
Renewable Resources as Promising Materials for Obtaining Graphene Oxide-like Structures

 , , ,
, , ,
Abstract
:1. Introduction
2. Experimental
2.1. Materials
2.2. Methods
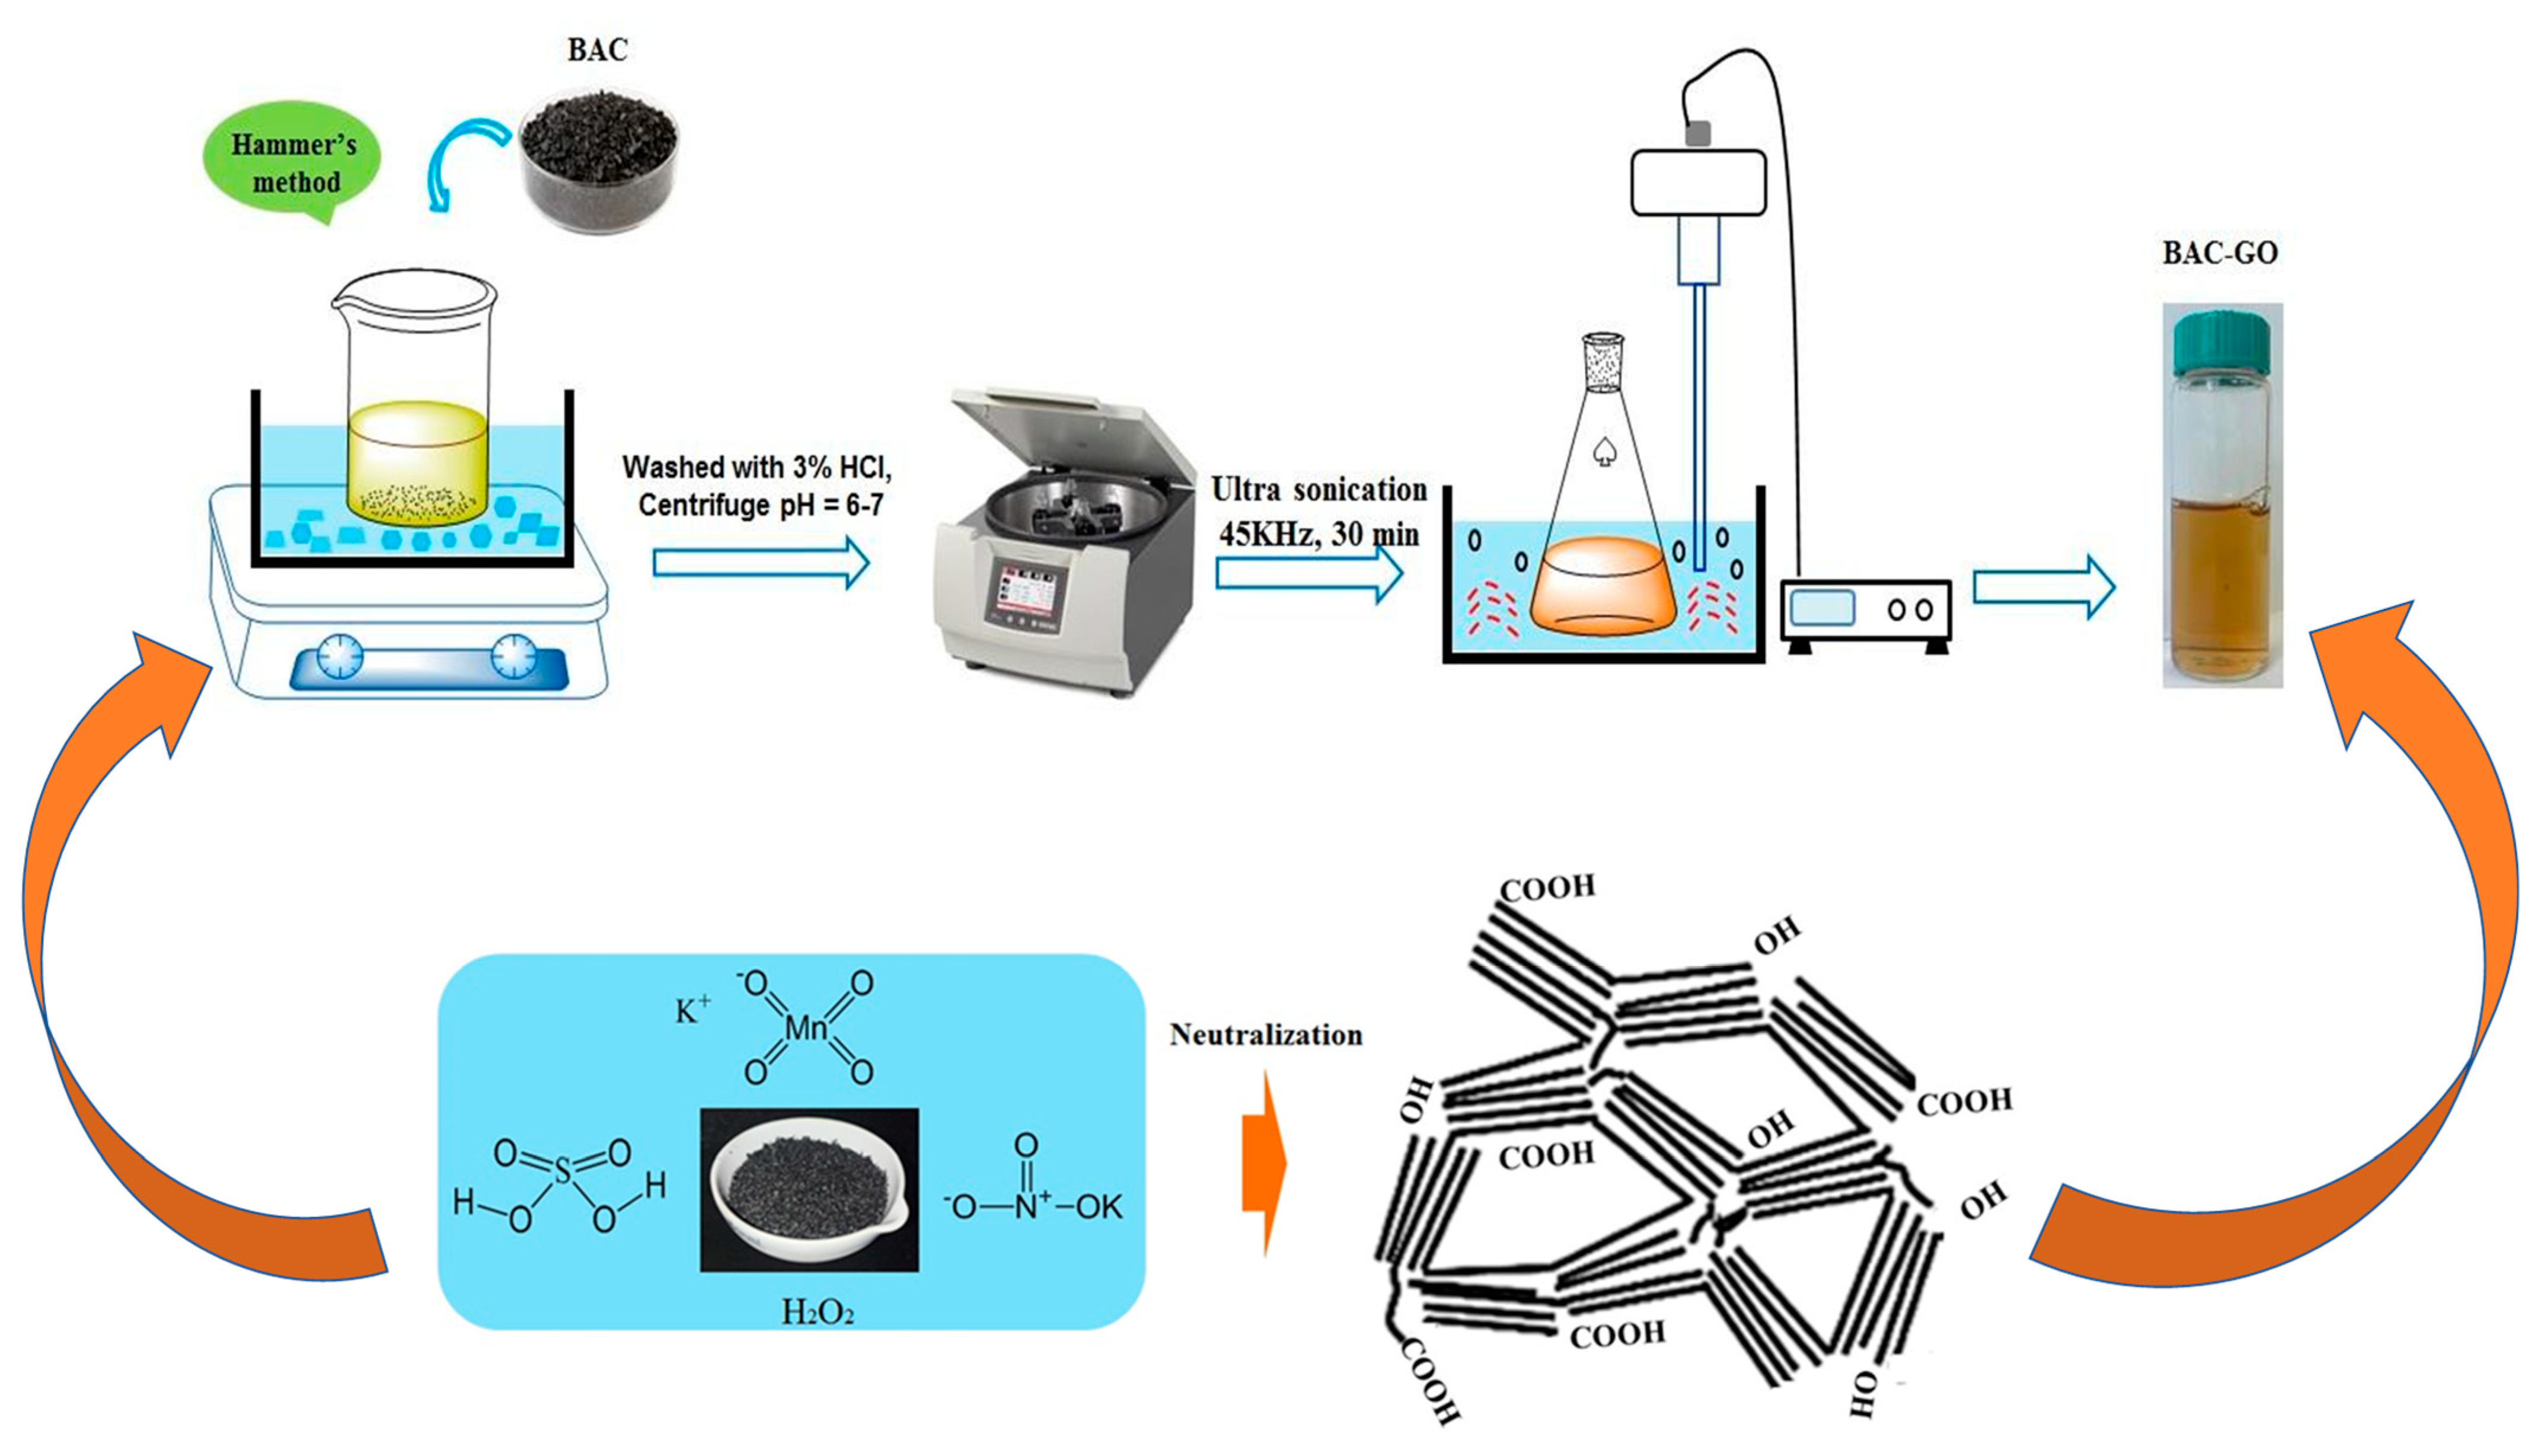
2.2.1. Preparation of GO from BAC and Graphite
2.2.2. Ultraviolet–Visible Spectroscopy (UV-Vis) Analysis of B–GO and G–GO
2.2.3. Fourier Transform Infrared (FTIR) Spectroscopy
2.2.4. Raman Spectroscopy
2.2.5. Determination of Functional Oxygen-Containing Groups in the BAC–GO and G–GO Samples
2.2.6. The Particle Sizes of BAC–GO and G–GO
2.2.7. X-ray Photoelectron Spectroscopy (XPS) Analysis
2.2.8. X-ray Diffraction (XRD) Analysis
2.2.9. Scanning Electron Microscopy (SEM) with Energy-Dispersive X-ray Spectroscopy (EDX) Analysis
2.2.10. Brillouin Spectra
2.2.11. Density, Sound Velocity, and Young Modulus
2.2.12. Electrical Characteristics
2.2.13. Adsorption Porosimetry
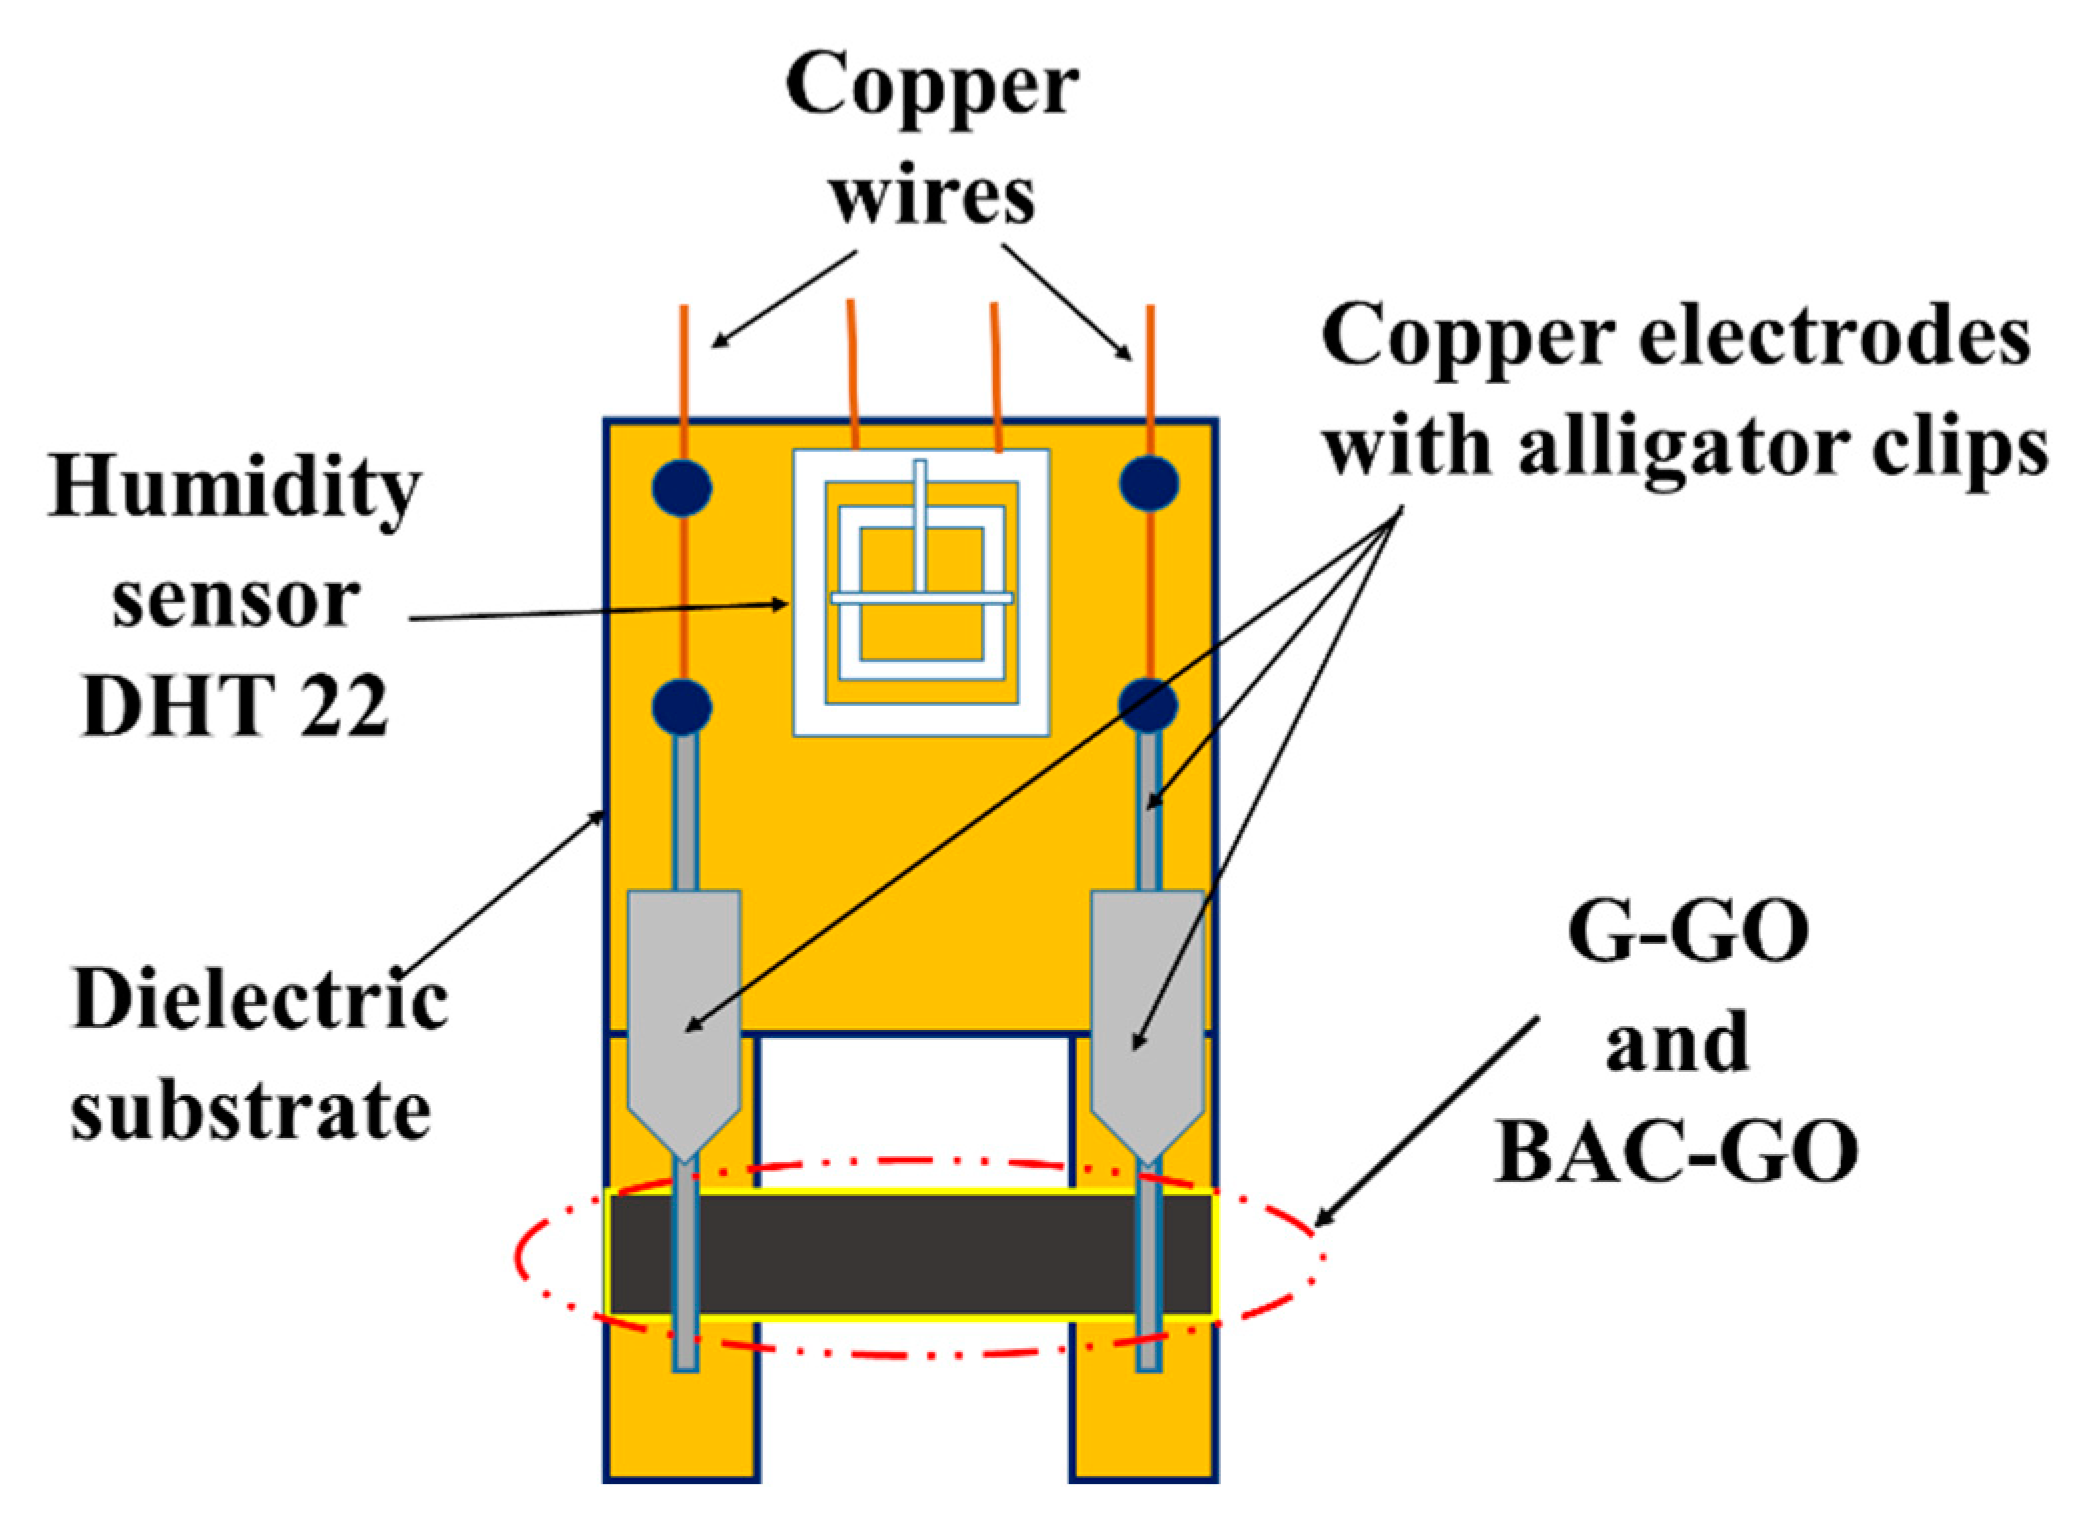
2.2.14. Creation of a Humidity Sensor Based on BAC–GO and G–GO
3. Results and Discussion
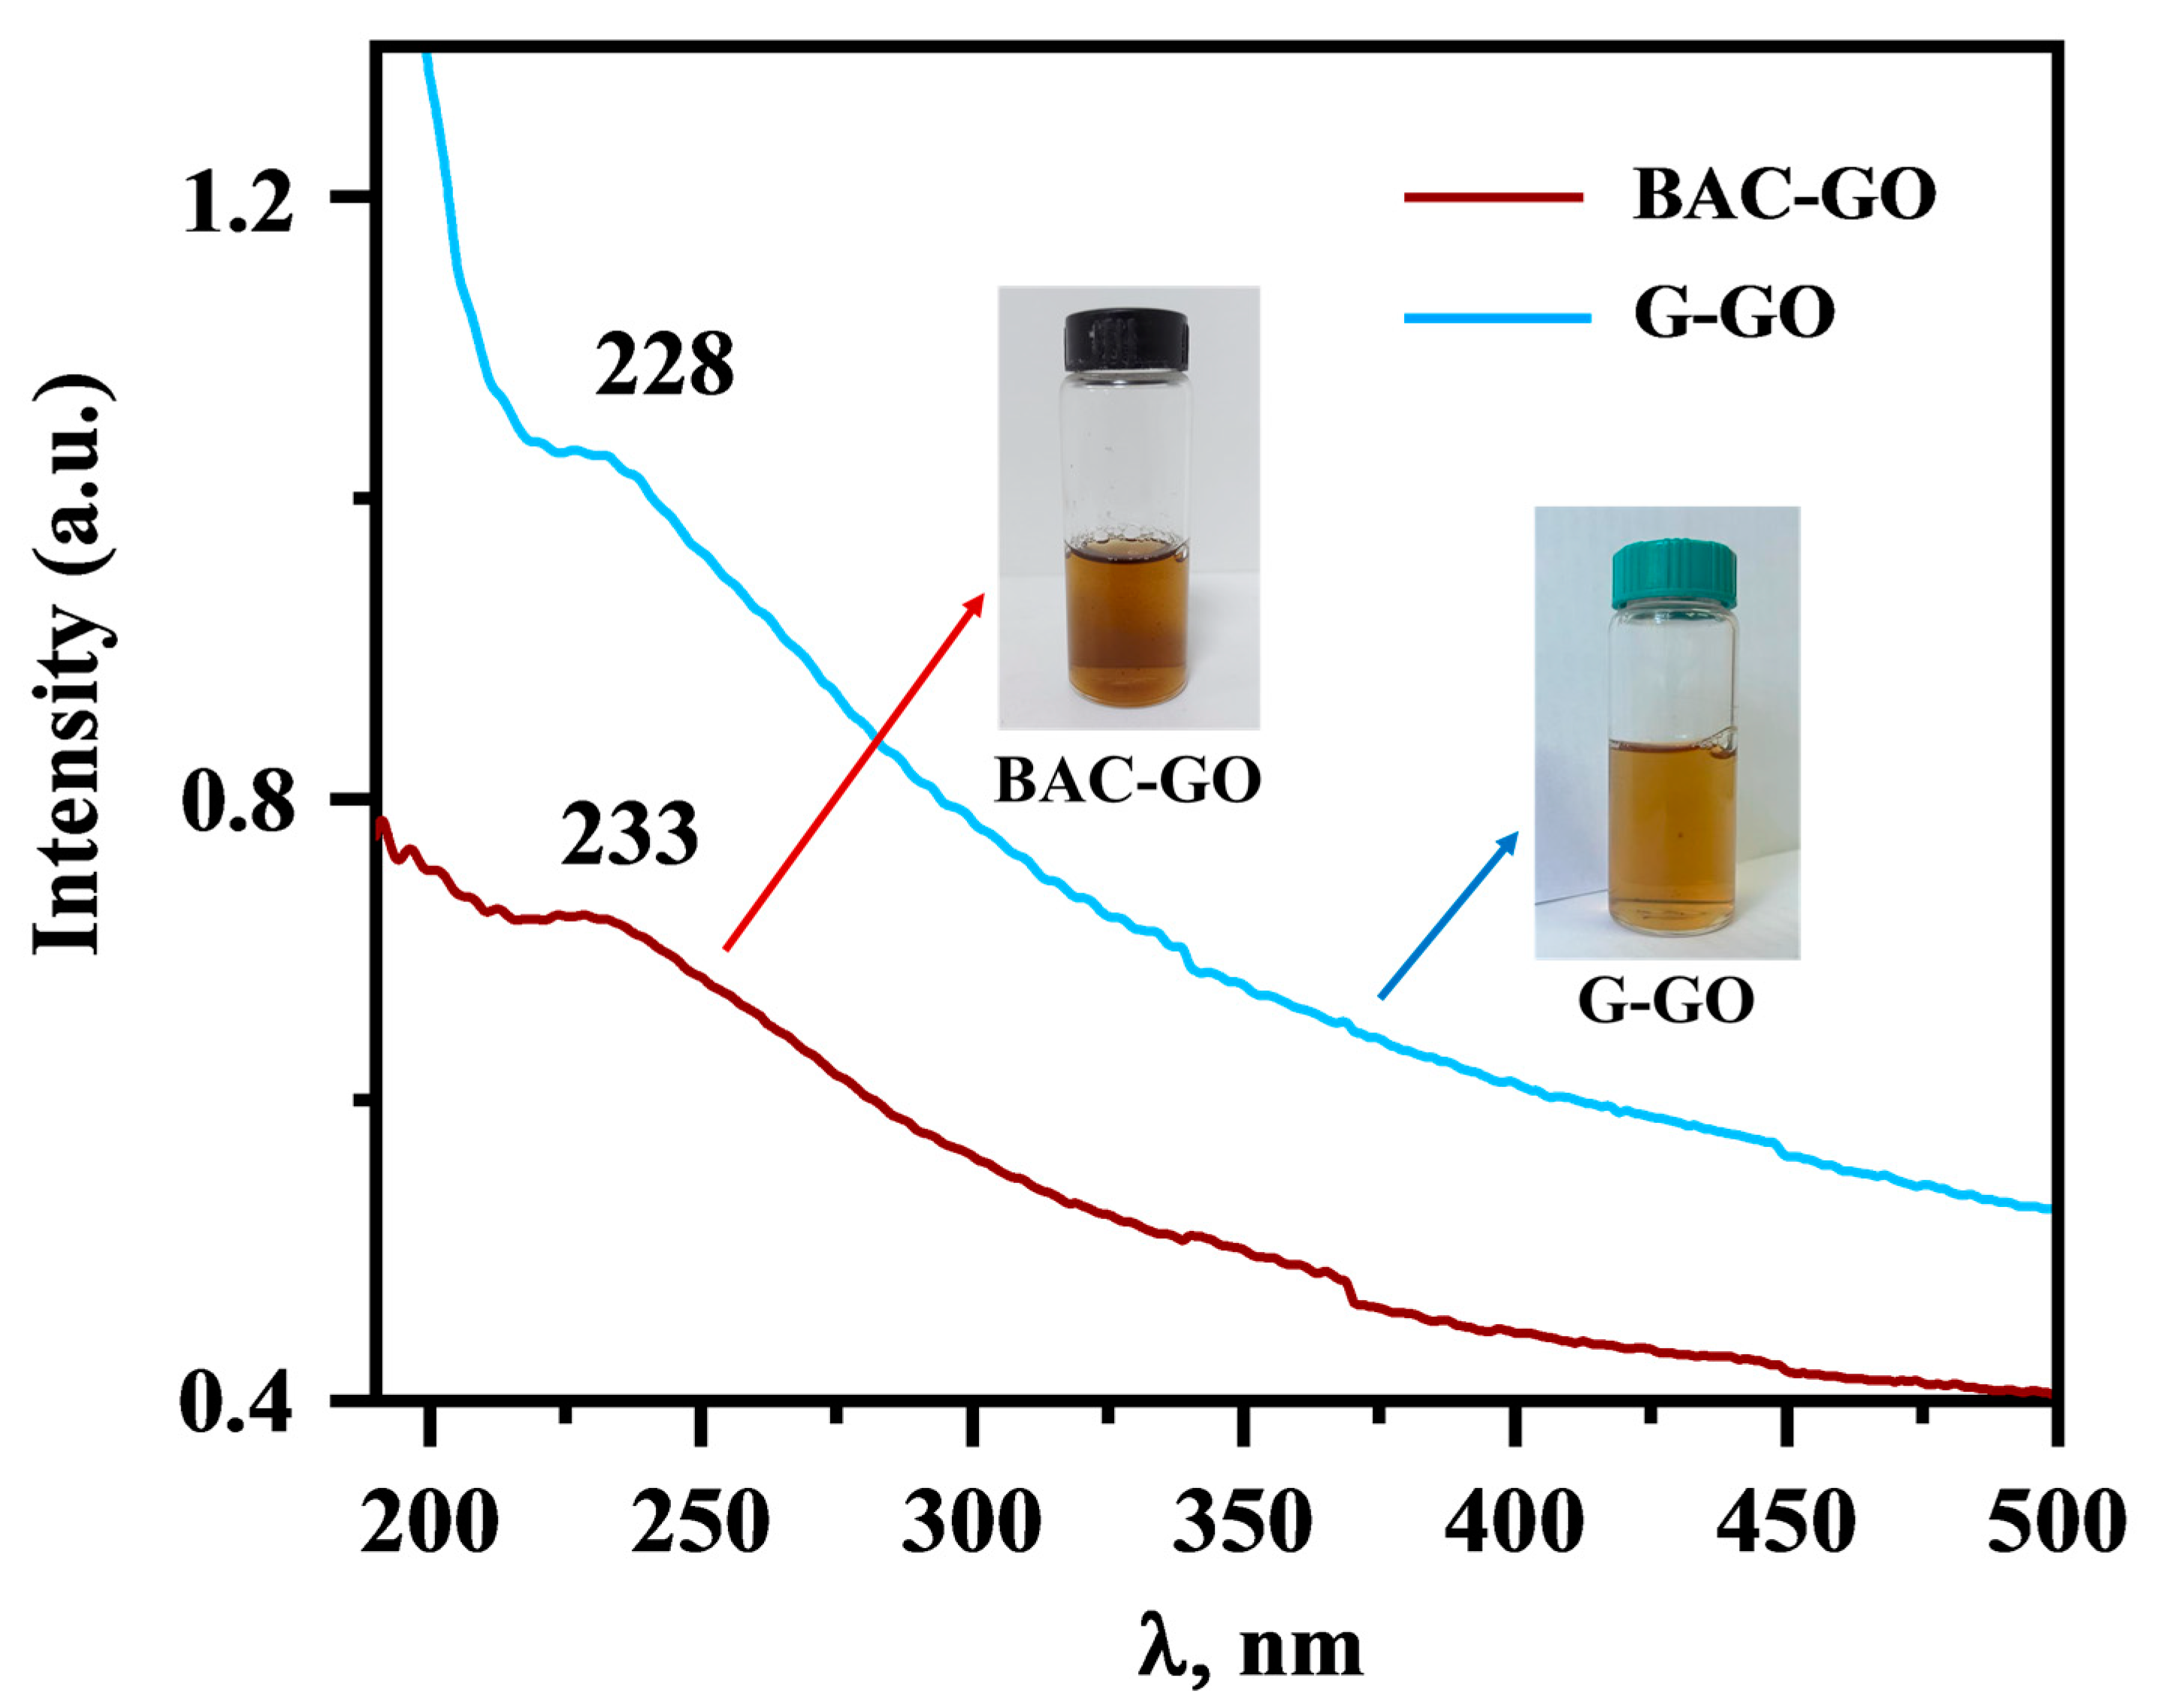
3.1. UV-Vis Analysis of BAC–GO and G–GO
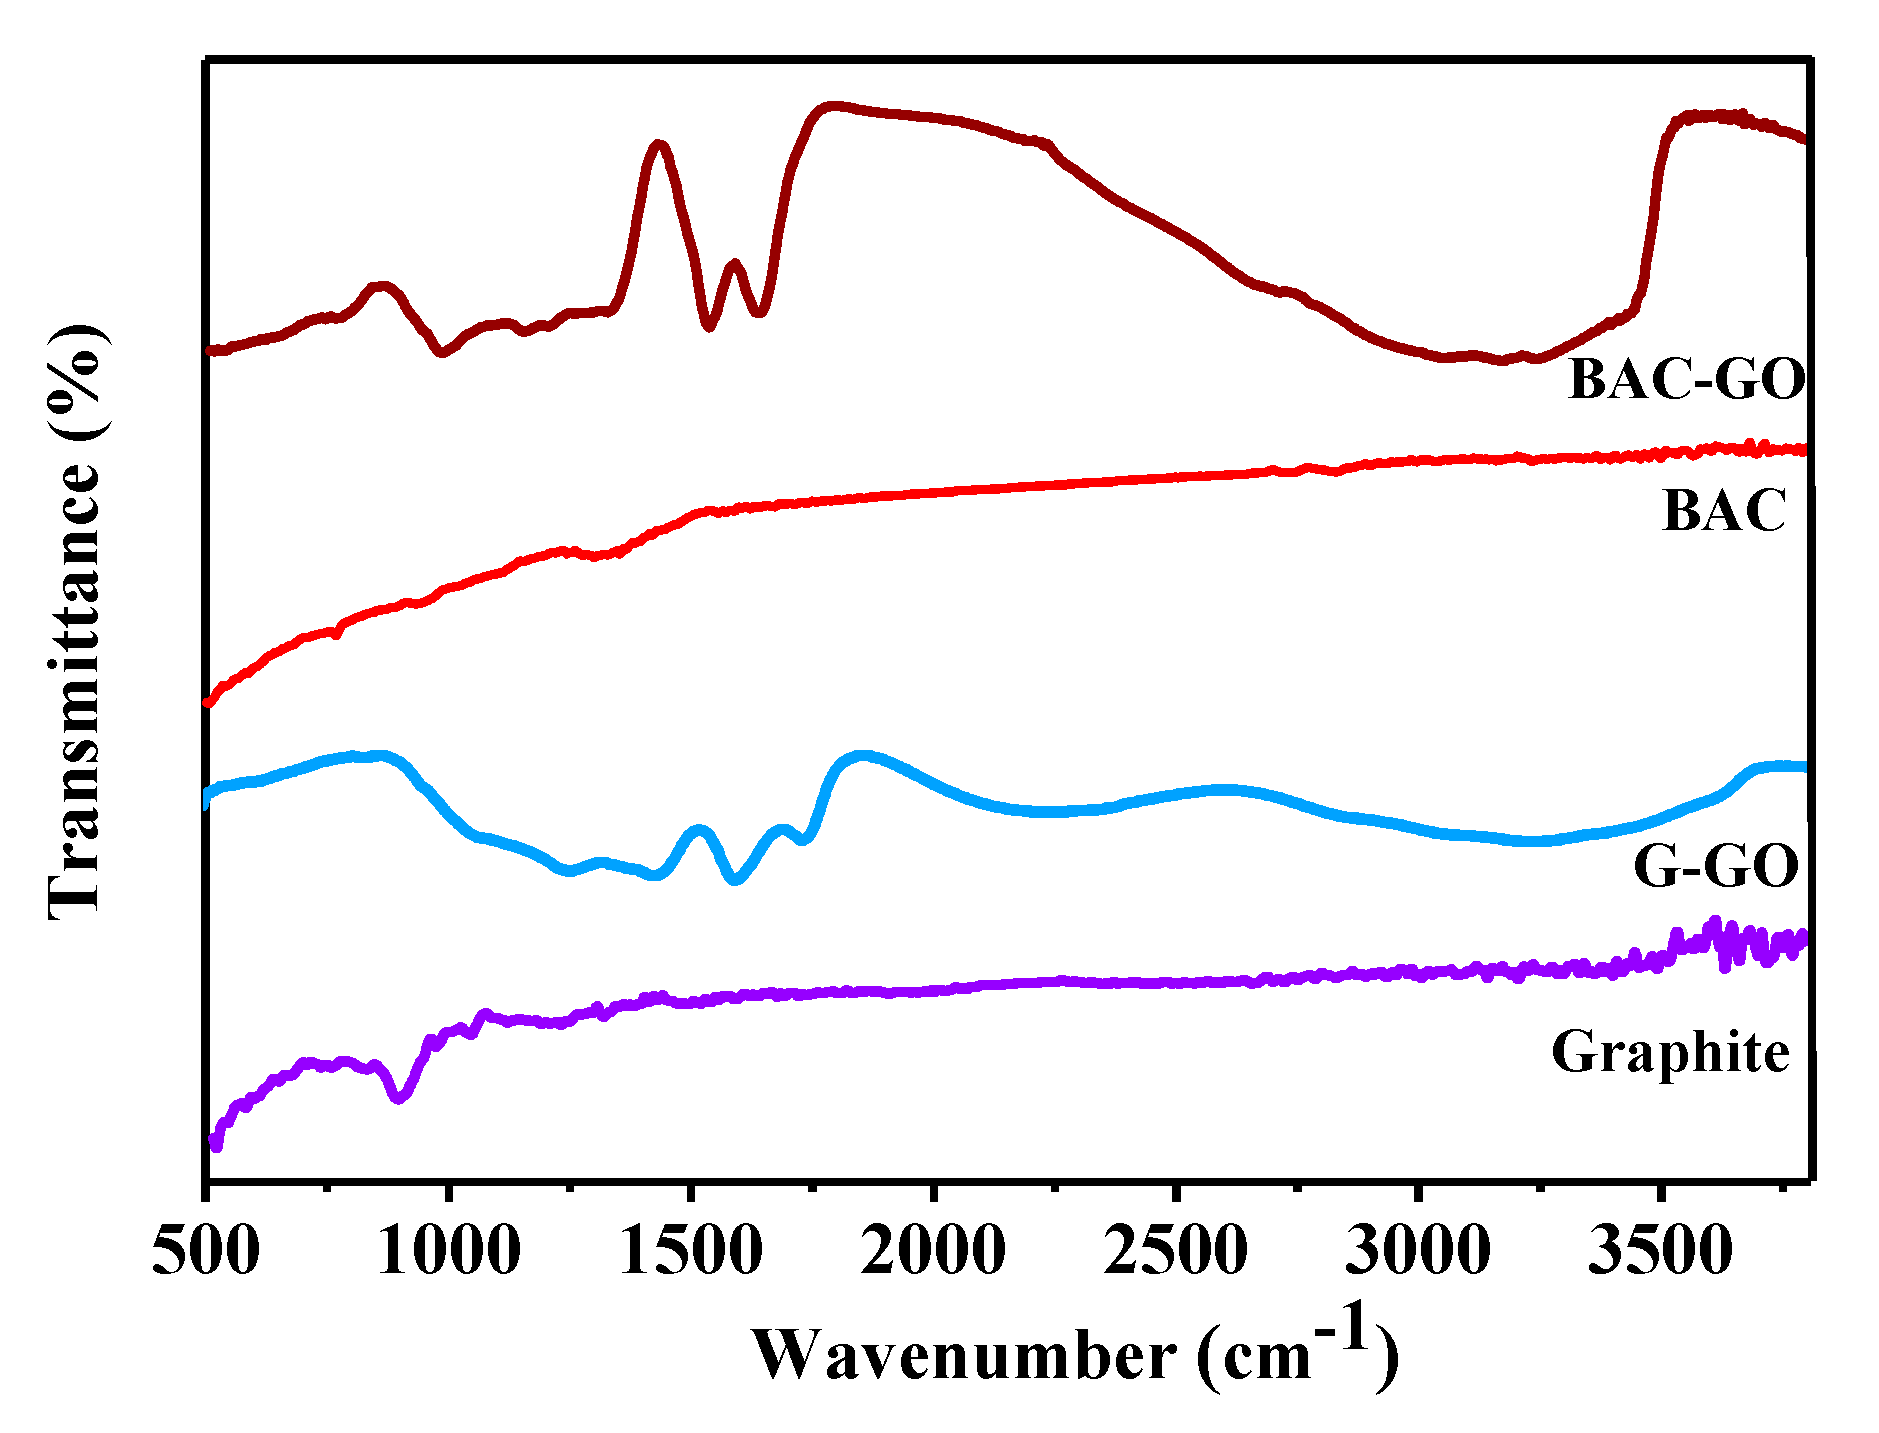
3.2. FTIR Spectroscopy
3.3. Raman Spectroscopy
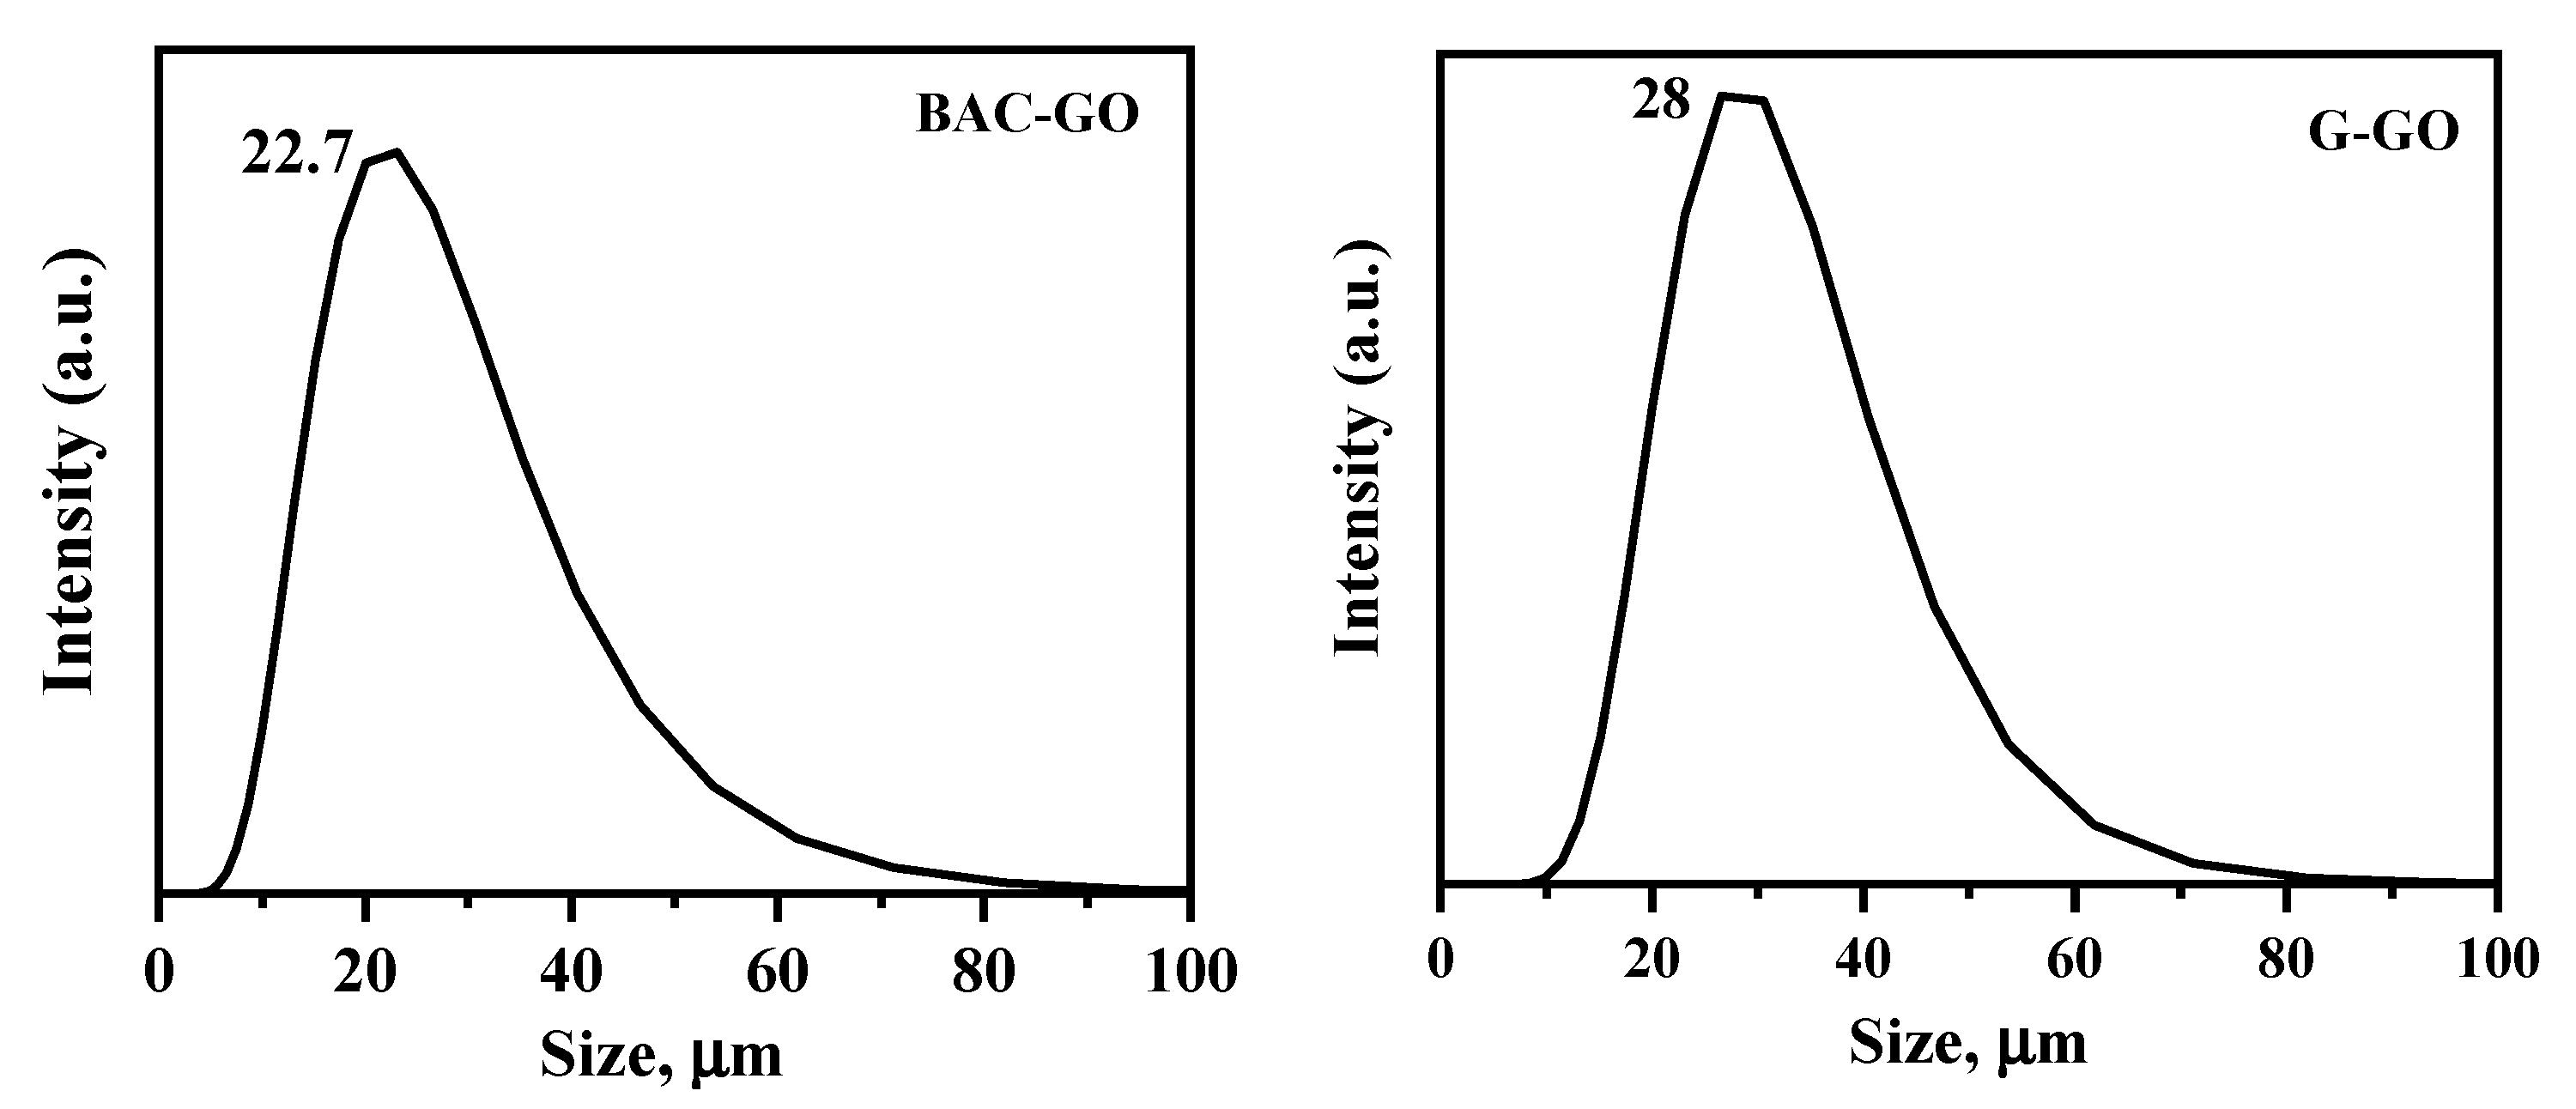
3.4. The Particle Sizes and Functional Oxygen-Containing Groups in the BAC–GO and G–GO Samples
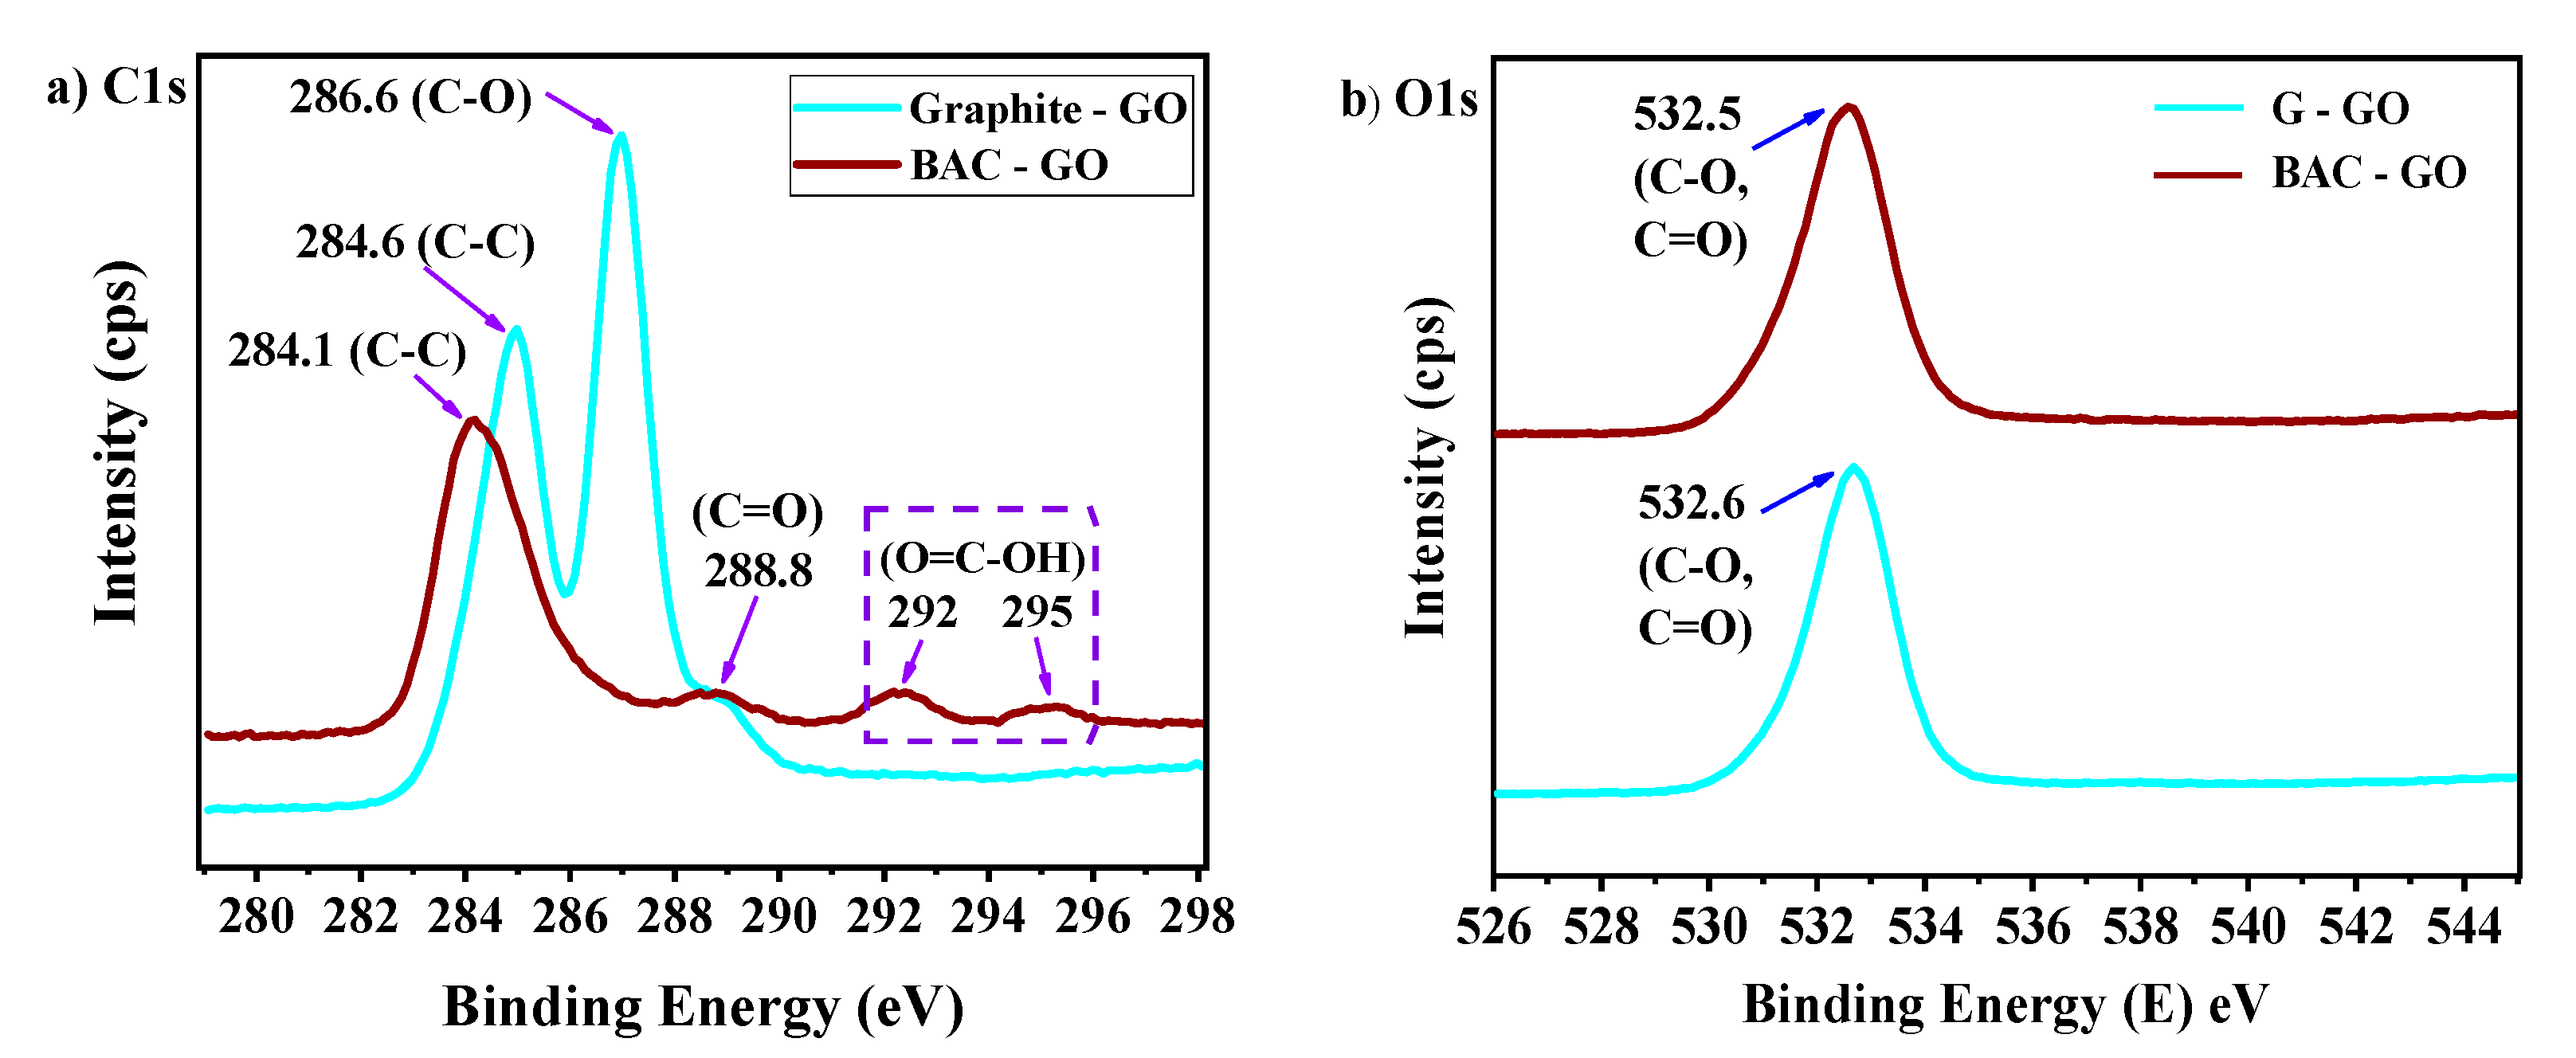
3.5. XPS Analysis
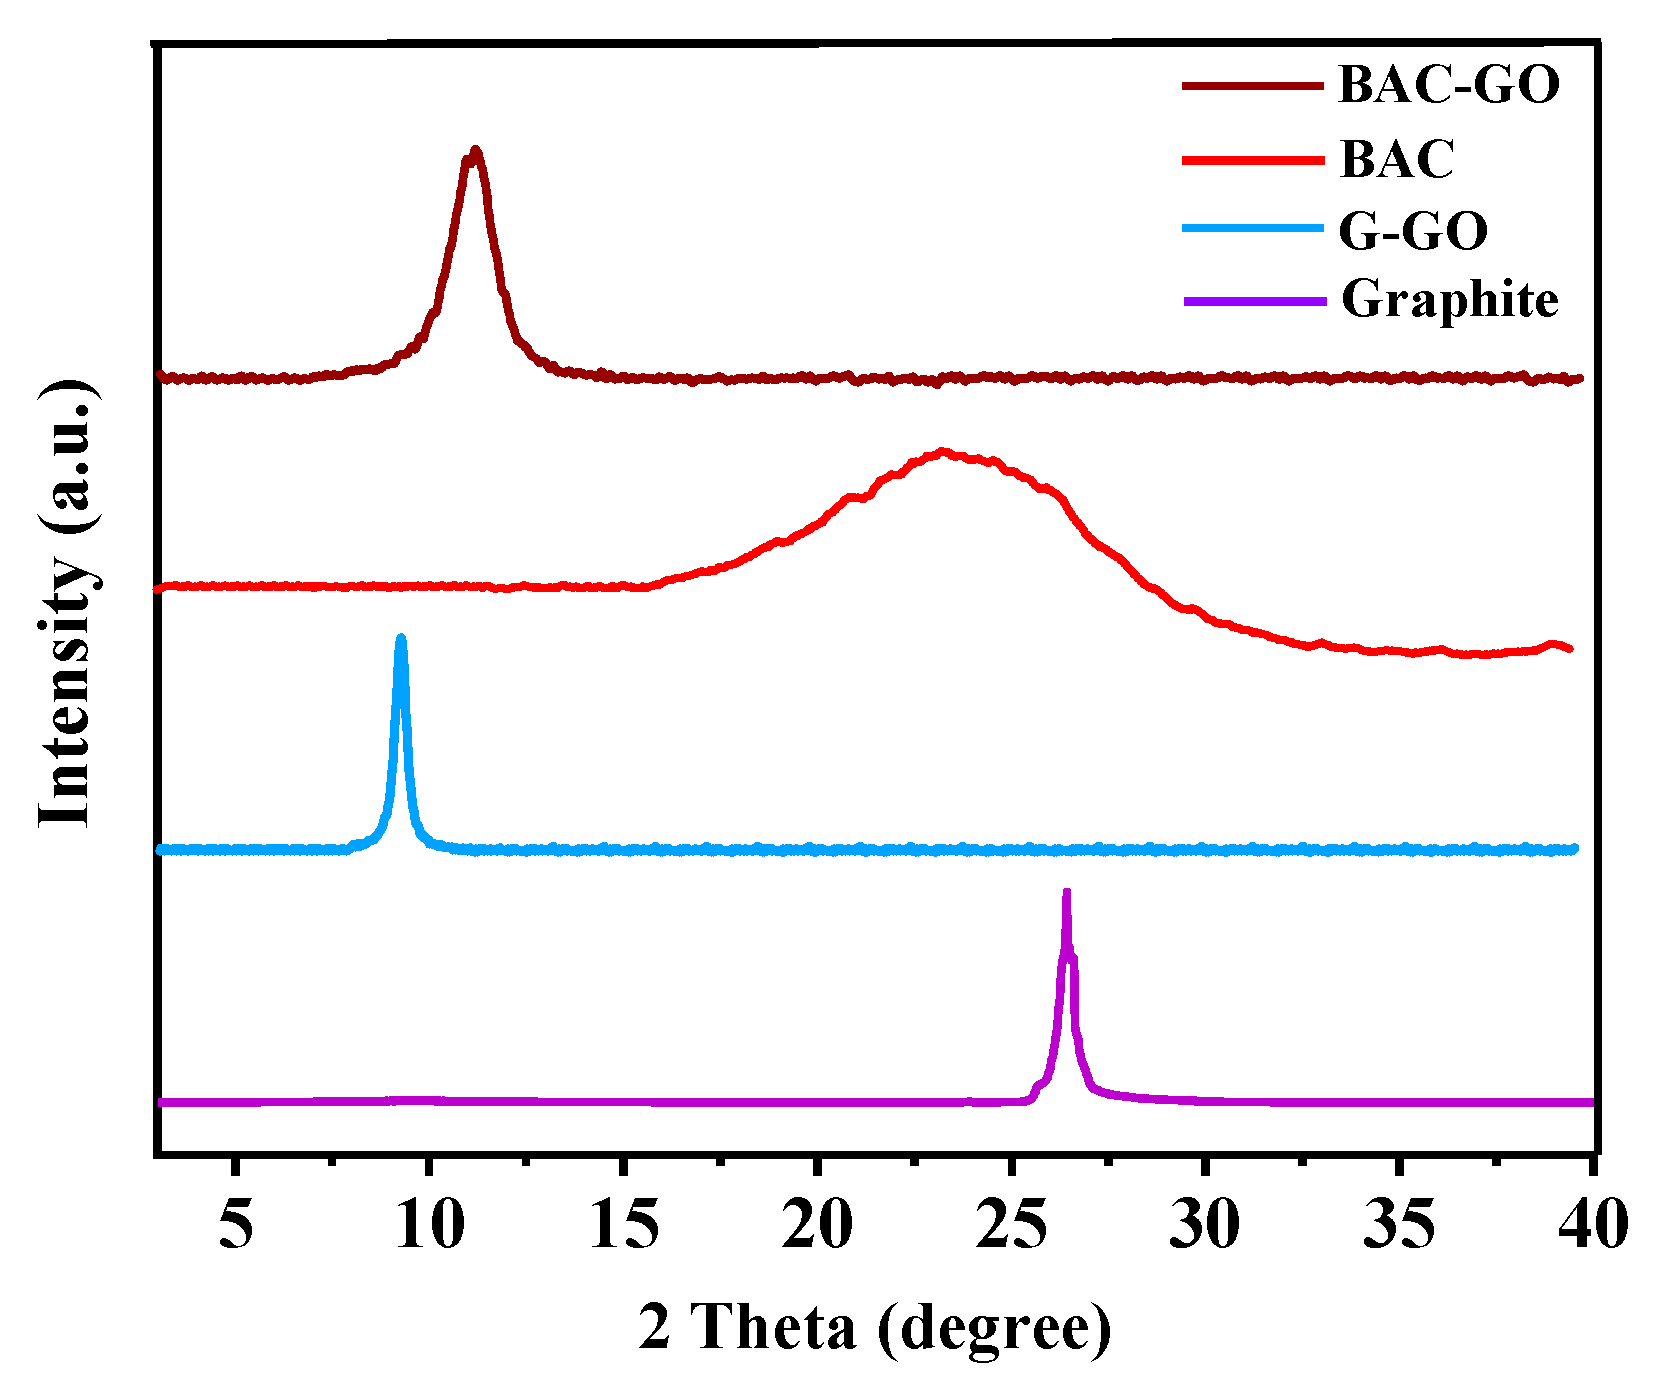
3.6. XRD
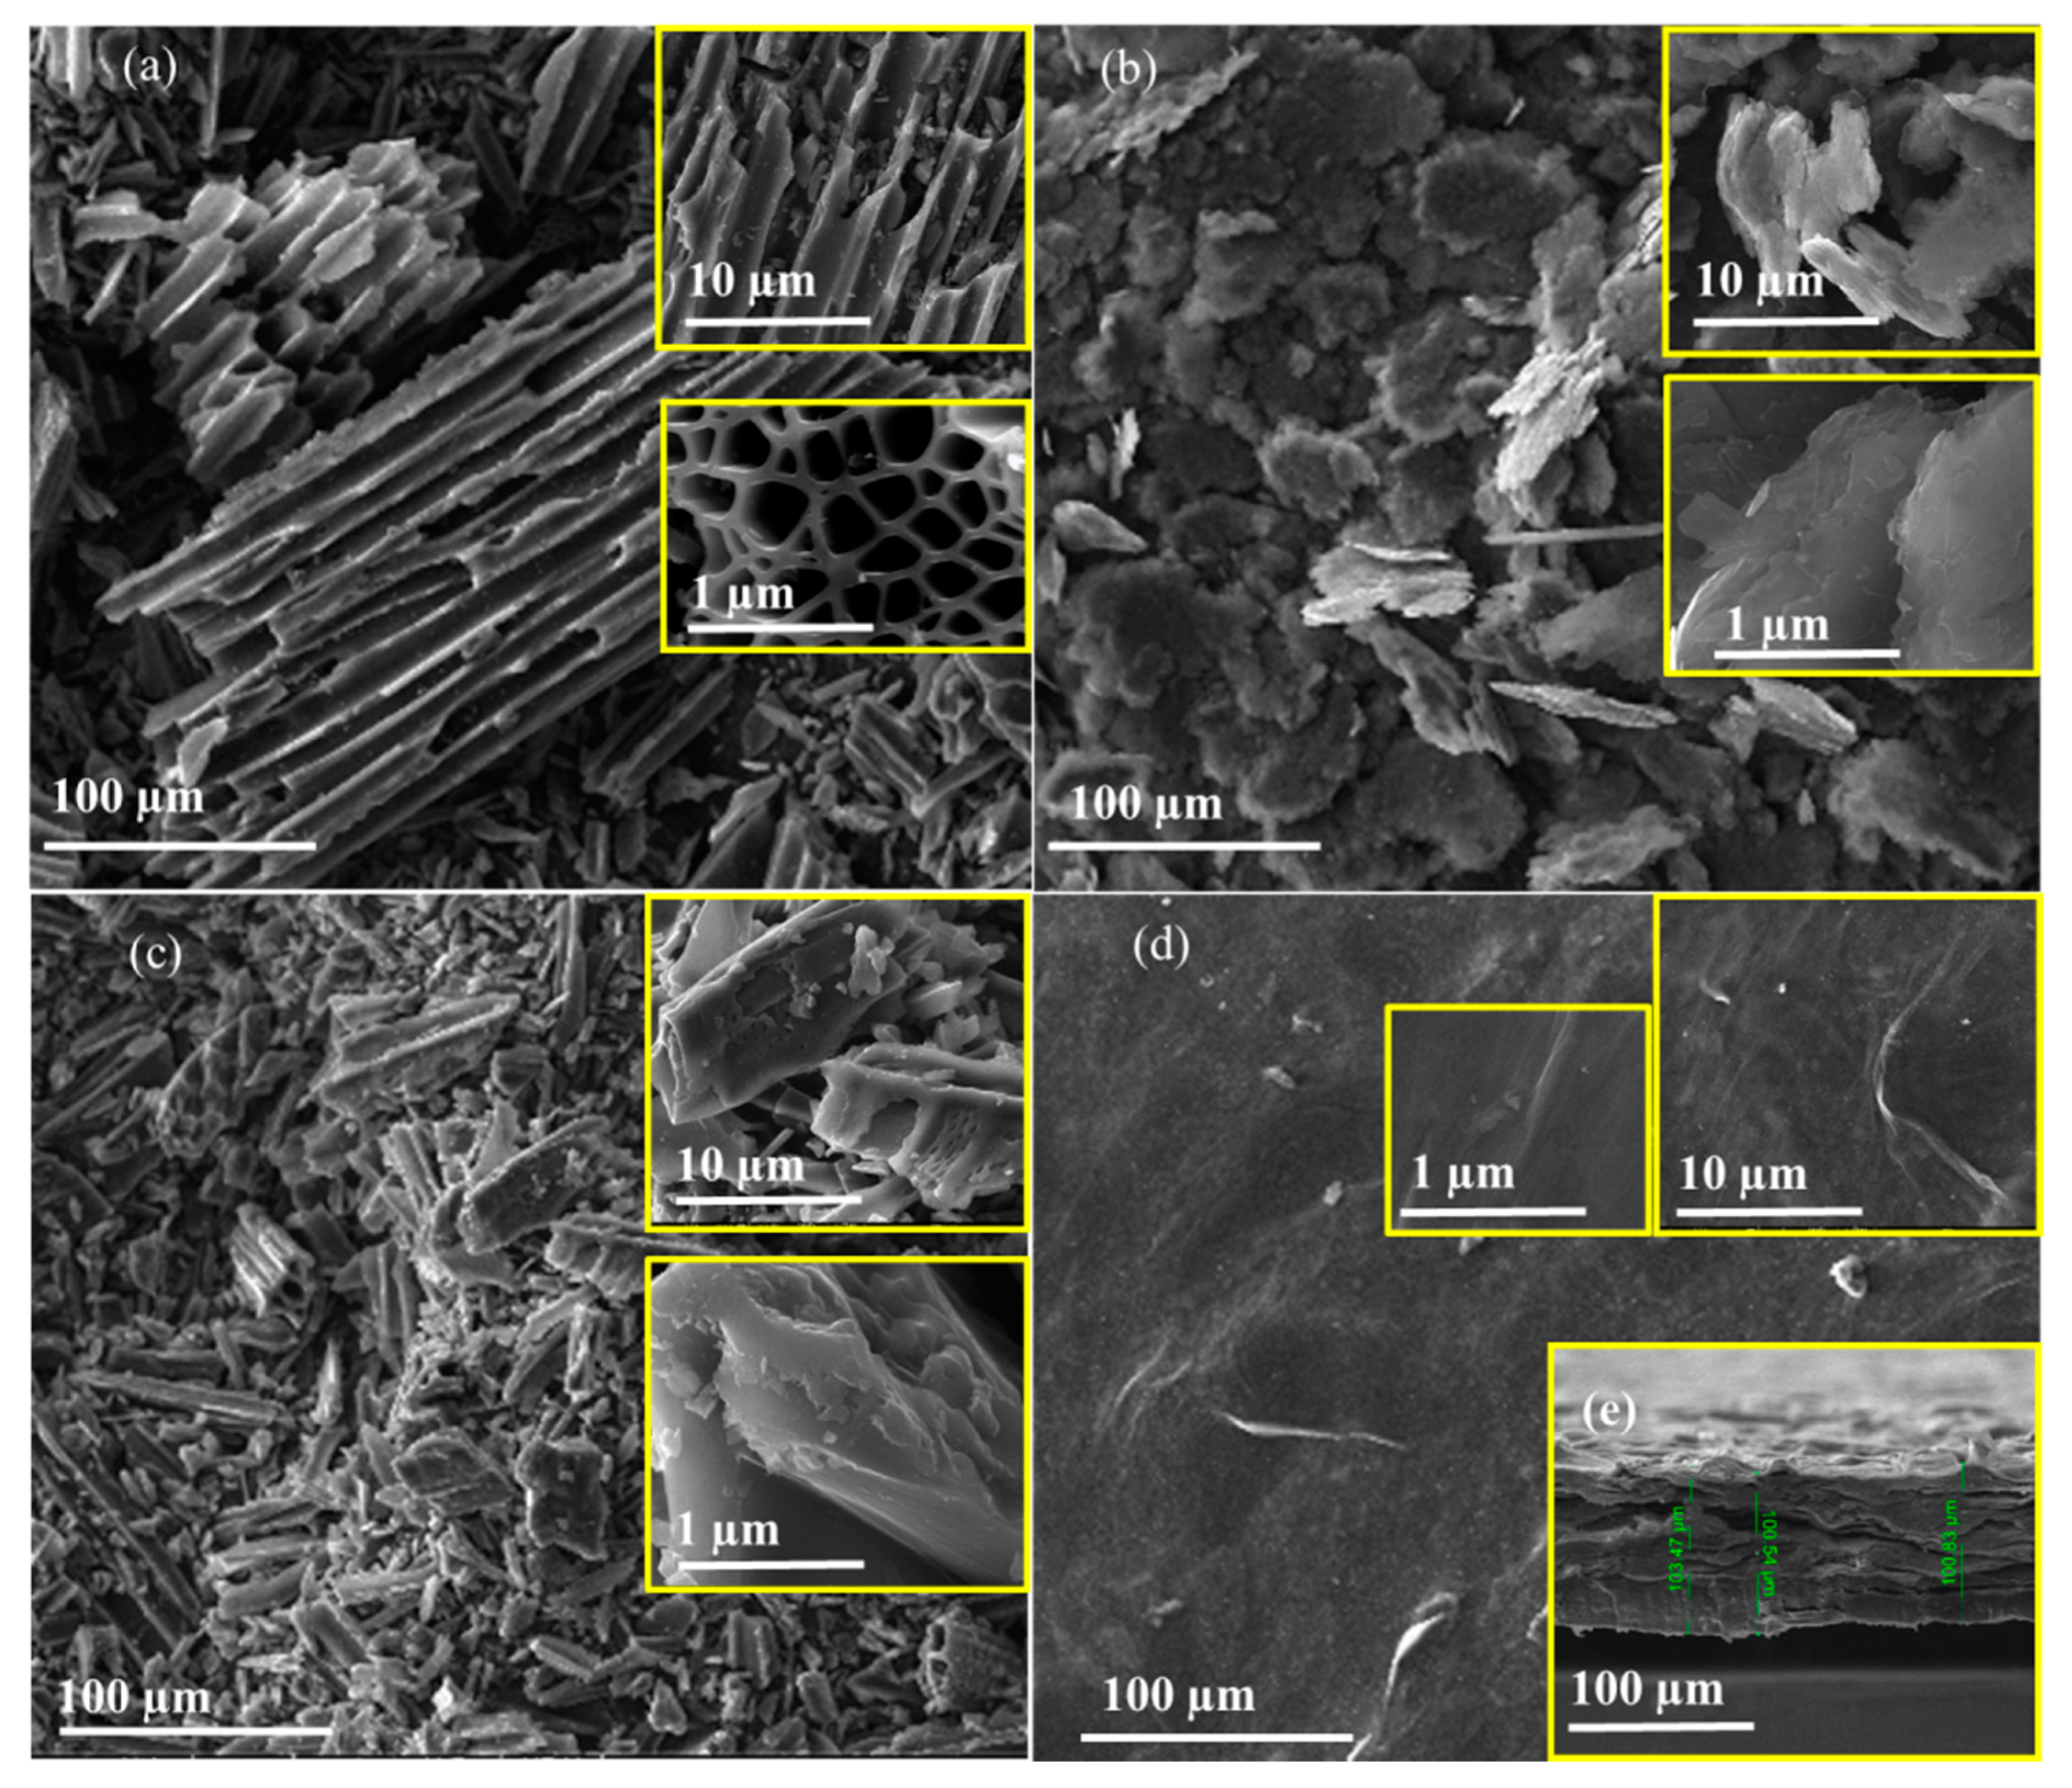
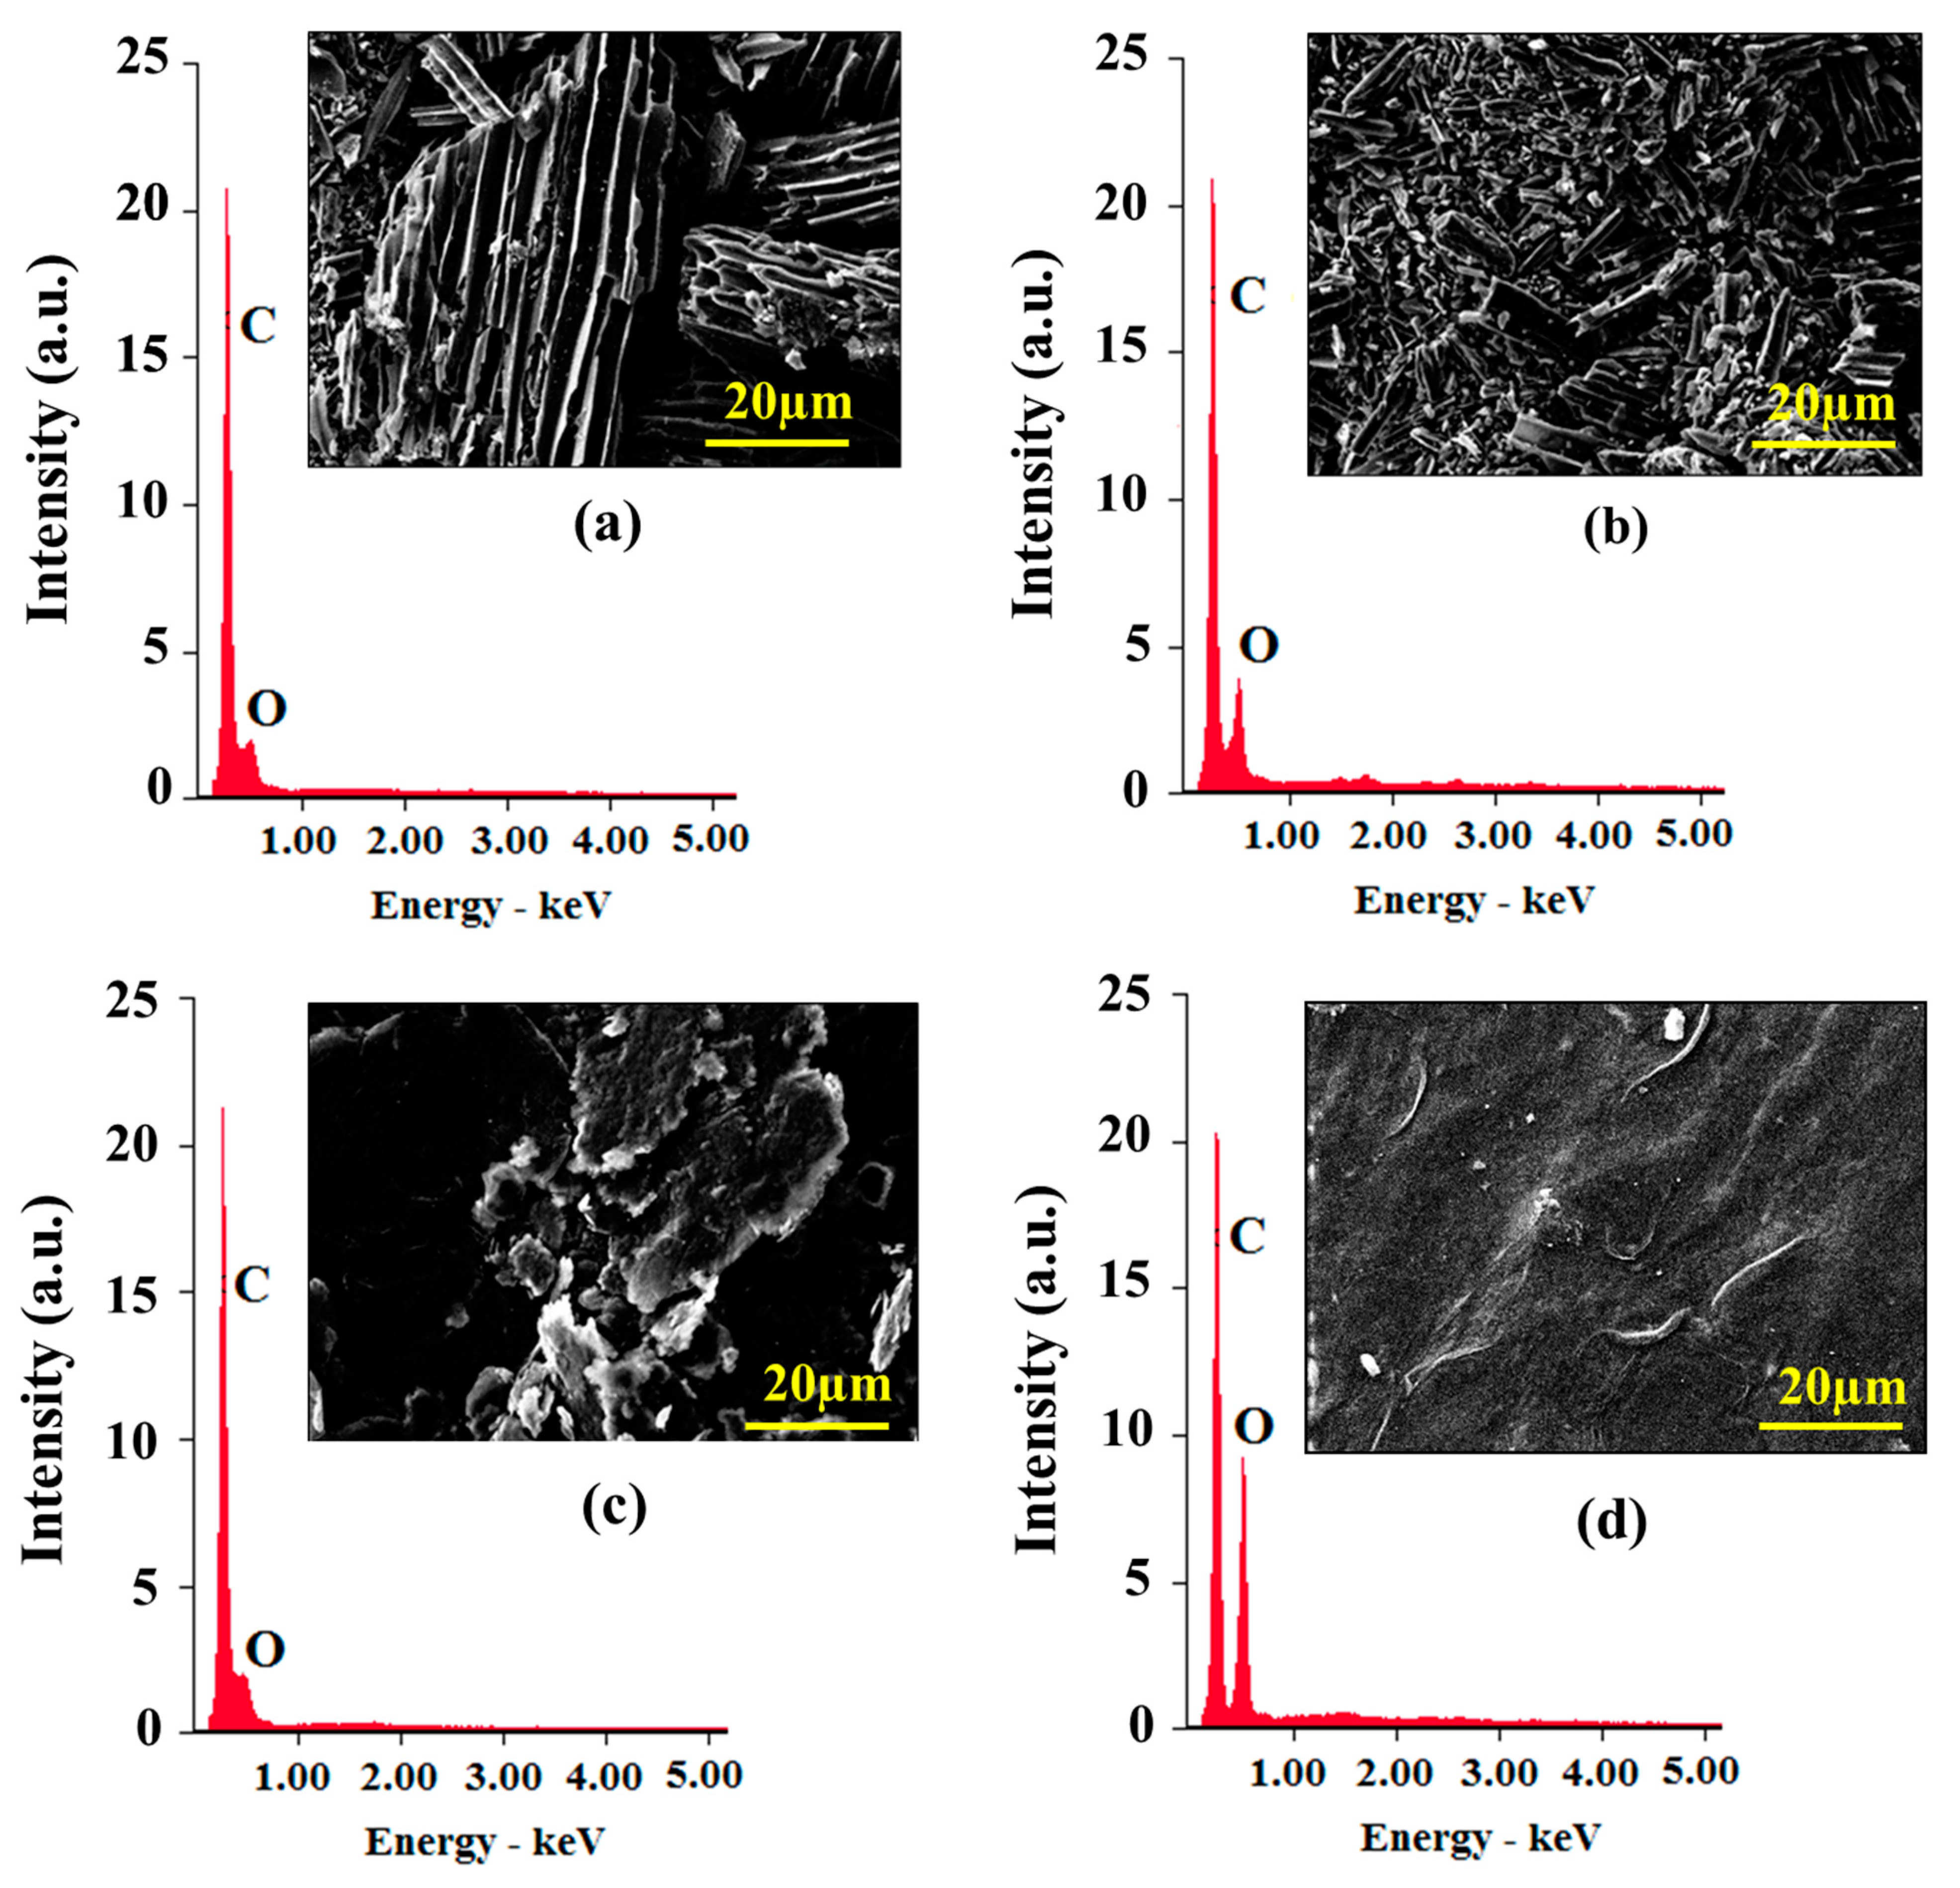
3.7. SEM Analysis
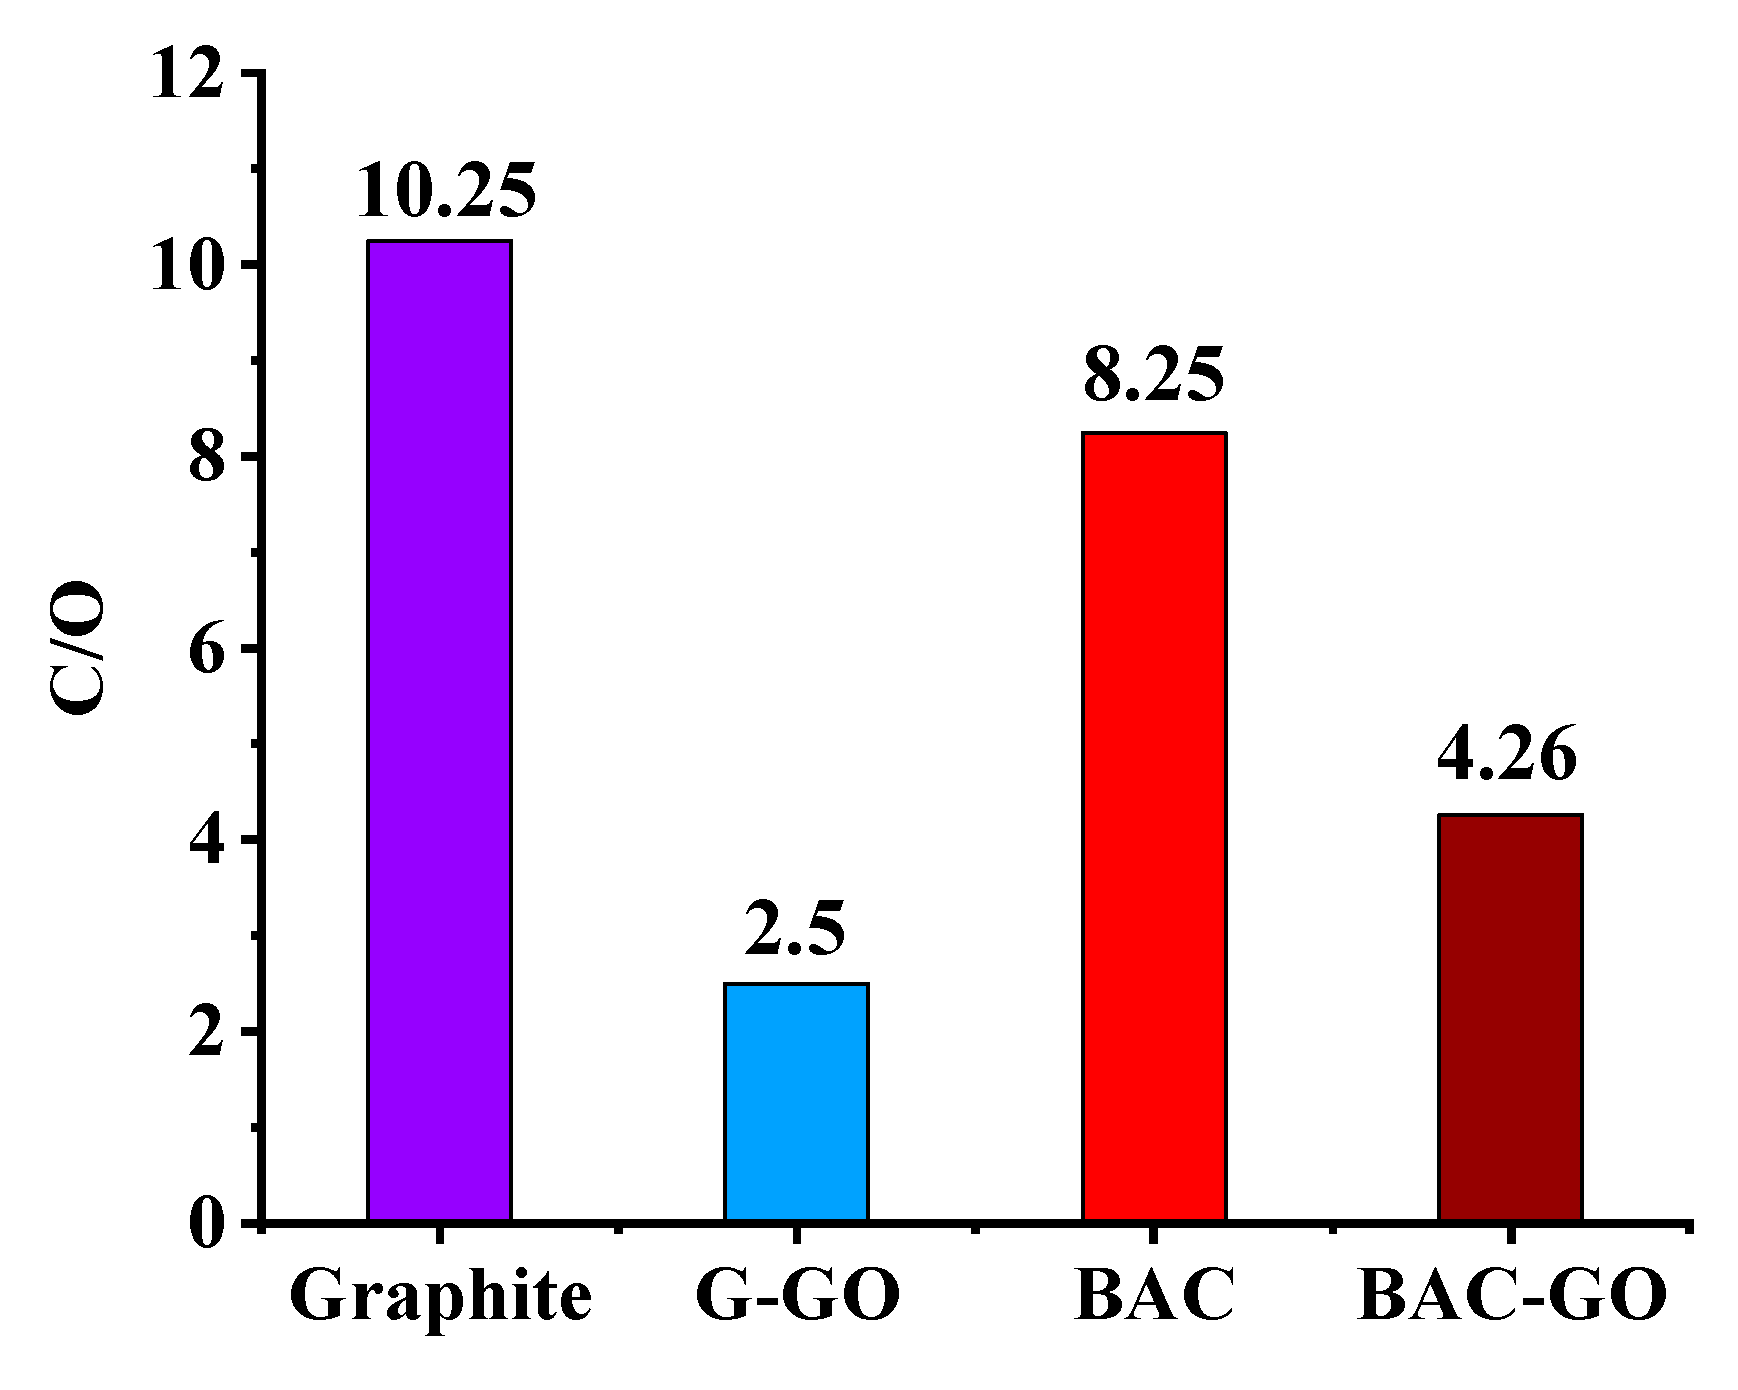
3.8. EDX Analysis
3.9. Brillouin Spectra (Elasticity and Viscosity), Density, Sound Velocity, and Young Modulus Results
- p—density;
- V—sound velocity.
3.10. Electrical Characteristic
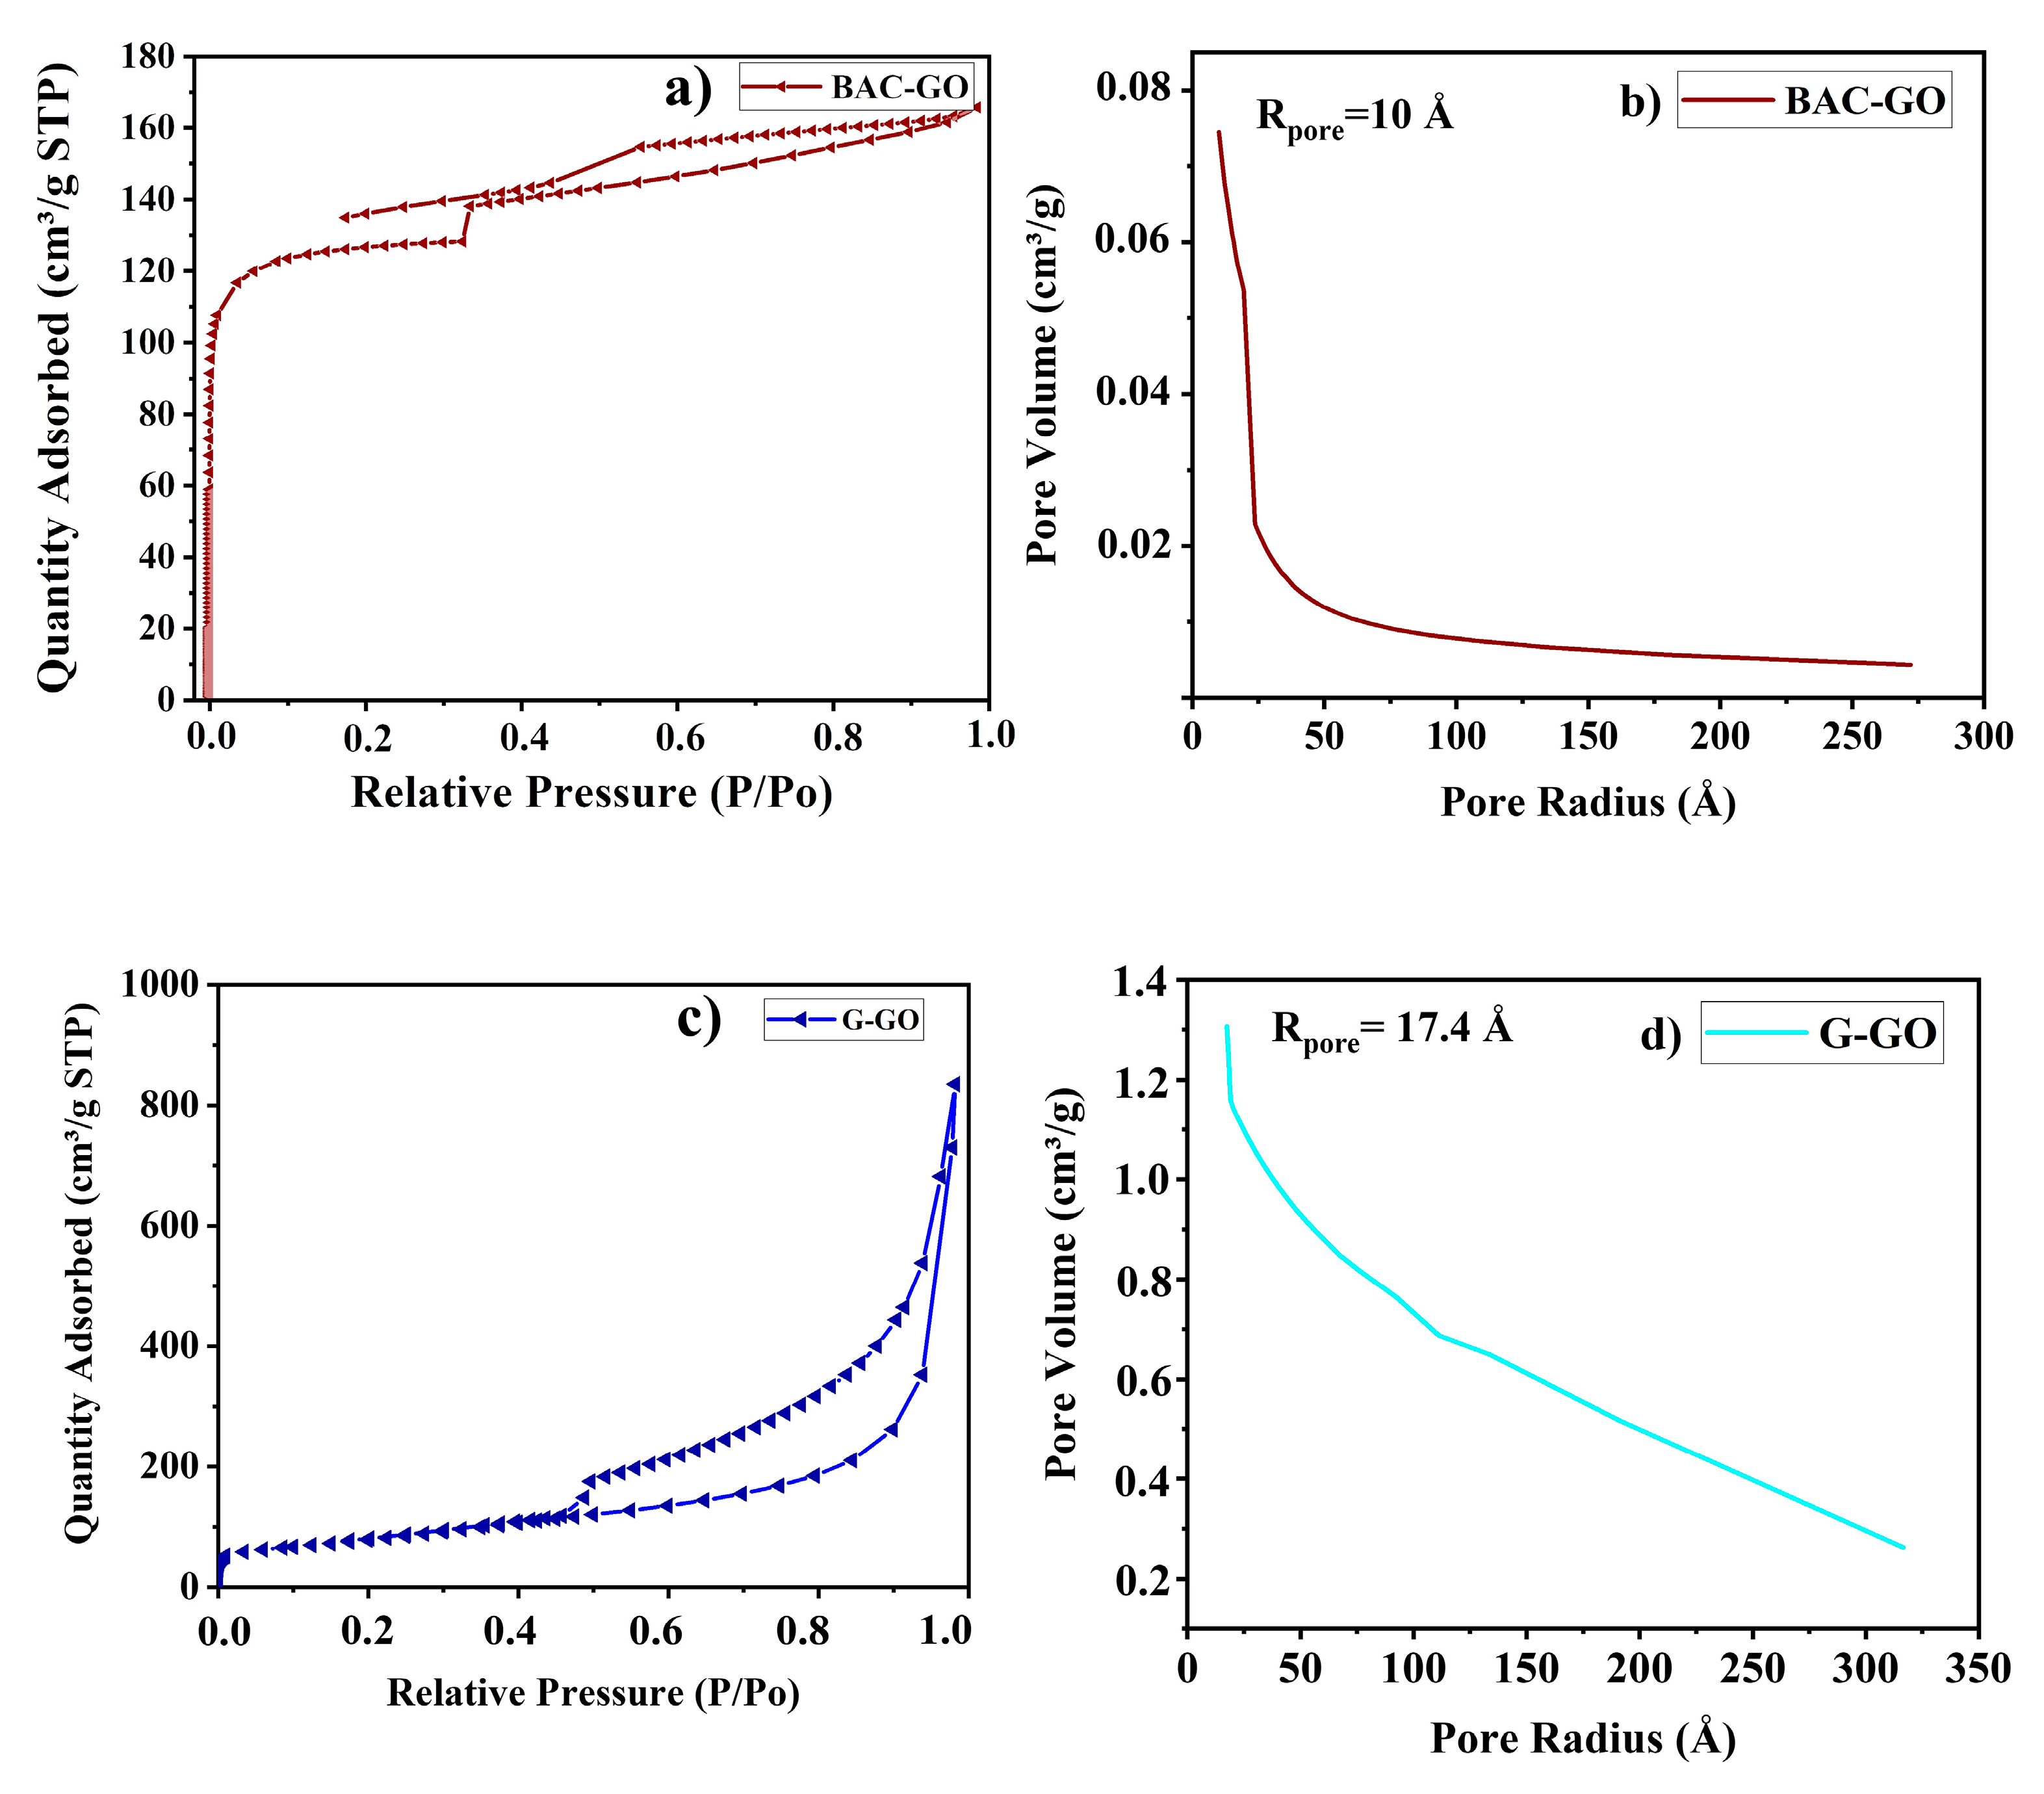
3.11. Adsorption Porosimetry
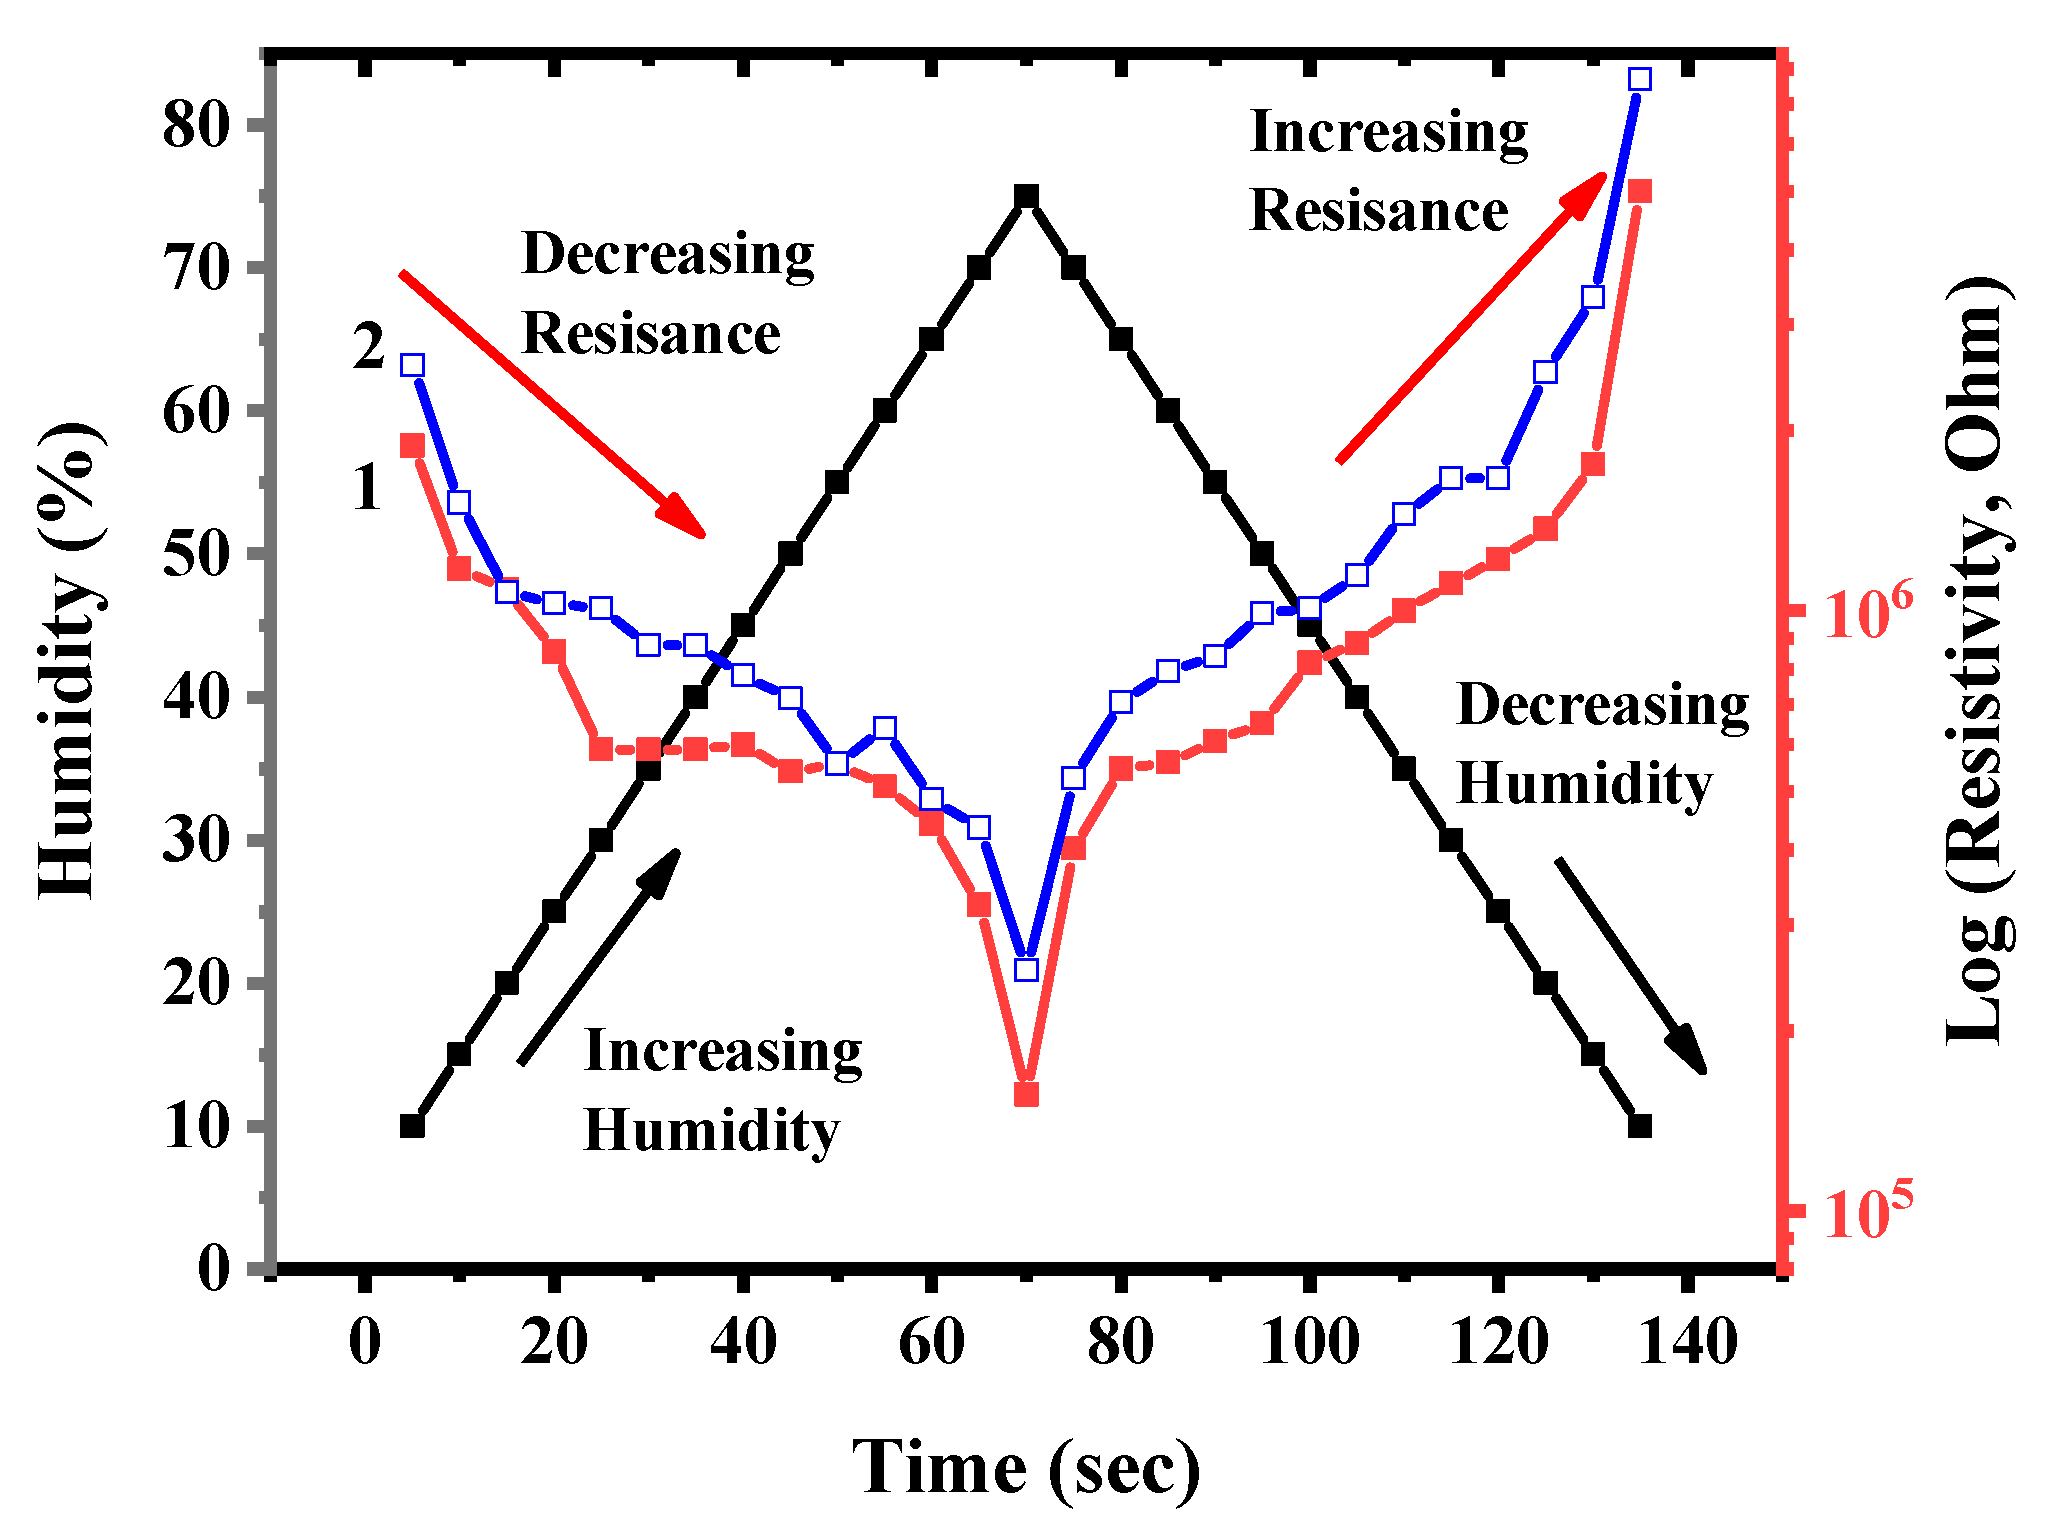
3.12. Electrophysical Characteristics of the Humidity Sensor Based on BAC–GO and G–GO
4. Conclusions
Author Contributions
Funding
Data Availability Statement
Conflicts of Interest
References
- Alharthi, M.; Hanif, I.; Alamoudi, H. Impact of environmental pollution on human health and financial status of households in MENA countries: Future of using renewable energy to eliminate the environmental pollution. J. Renew. Energy 2022, 190, 338–346. [Google Scholar] [CrossRef]
- Akatan, K.; Kabdrakhmanova, S.; Kuanyshbekov, T.; Ibraeva, Z.; Battalova, A.; Joshy, K.S.; Thomas, S. Highly-efficient isolation of microcrystalline cellulose and nanocellulose from sunflower seed waste via environmentally benign method. Cellulose 2022, 29, 3787–3802. [Google Scholar] [CrossRef]
- Reddygunta, K.K.R.; Callander, A.; Šiller, L.; Faulds, K.; Berlouis, L.; Ivaturi, A. Sono-exfoliated graphene-like activated carbon from hazelnut shells for flexible supercapacitors. Int. J. Energy Res. 2022, 46, 16512–16537. [Google Scholar] [CrossRef]
- Supeno, M.; Siburian, R.; Natalia, D. The Synthesis of Graphene from Coconut Shell Charcoa. In Proceedings of the 1st International Conference on Chemical Science and Technology Innovation, Sumatera Utara, Indonesia, 21–22 July 2019; pp. 39–44. [Google Scholar]
- Blachnio, M.; Derylo-Marczewska, A.; Charmas, B.; Zienkiewicz-Strzalka, M.; Bogatyrov, V.; Galaburda, M. Activated Carbon from Agricultural Wastes for Adsorption of Organic Pollutants. J. Mol. 2020, 25, 5105. [Google Scholar] [CrossRef]
- Mas’udah, K.W.; Nugraha, M.A.; Abidin, S.; Mufid, A.; Astuti, F. Solution of Reduced Graphene Oxide Synthesized from Coconut Shells and Its Optical Properties. In Proceedings of the 3rd International Conference on Advanced Materials Science and Technology, Semarang, Indonesia, 6–7 October 2015; Volume 1725, pp. 020045-1–020045-8. [Google Scholar]
- Yagub, M.T.; Sen, T.K.; Afroze, S.; Ang, H.M. Dye and its removal from aqueous solution by adsorption: A review. J. Adv. Colloid Interface Sci. 2014, 209, 172–184. [Google Scholar] [CrossRef] [PubMed]
- Karanfil, T.; Kilduff, J.E. Role of granular activated carbon surface chemistry on the adsorption of organic compounds. J. Prior. Pollut. Environ. Sci. Technol. 1999, 33, 3217–3224. [Google Scholar] [CrossRef]
- Kyotani, T. Control of pore structure in carbon. J. Carbon 2000, 38, 269–286. [Google Scholar] [CrossRef]
- Kabdrakhmanova, S.; Shaimardan, E.; Akatan, K.; Selenova, B.; Zhilkashinova, A.; Erbolatuly, D.; Skakov, M. Preparation and Characterization of the Catalyst Based on the Copper Nanoparticles. Int. J. Nanosci. Nanotechnol. 2022, 18, 1–10. [Google Scholar]
- Lee, S.-Y.; Mahajan, R.L. A facile method for coal to graphene oxide and its application to a biosensor. J. Carbon 2021, 181, 408e420. [Google Scholar] [CrossRef]
- Pakhira, B.; Ghosh, S.; Maity, S.; Sangeetha, D.N.; Laha, A.; Allam, A.; Sarka, S. Extraction of preformed graphene oxide from coal: Its clenched fist form entrapping large molecules. J. RSC Adv. 2015, 5, 89076. [Google Scholar] [CrossRef]
- Savitskyi, D.P.; Makarov, A.S.; Goncharuk, V.V. Preparation of a colloidal graphene oxide solution from natural coal. J. Rep. Natl. Acad. Sci. Ukr. 2016, 6, 87–94. [Google Scholar] [CrossRef]
- Kang, S.; Kim, K.M.; Jung, K.; Son, Y.; Mhin, S.; Ryu, J.H.; Bo Shim, K.; Lee, B.; Han, H.; Song, T. Graphene oxide Quantum Dots Derived from Coal for Bioimaging: Facile and Green Approach. J. Sci. Rep. 2019, 9, 4101. [Google Scholar] [CrossRef] [PubMed]
- Somanathan, T.; Prasad, K.; Ostrikov, K.; Saravanan, A.; Krishna, V.M. Graphene Oxide Synthesis from Agro Waste. J. Nanomater. 2015, 5, 826–834. [Google Scholar] [CrossRef]
- Novoselov, K.S.; Falko, V.I.; Colombo, L.; Gellert, P.R.; Schwab, M.G.; Kim, K. A roadmap for graphene. J. Nat. 2012, 490, 192–200. [Google Scholar] [CrossRef] [PubMed]
- Ma, R.; Zhang, X.; Zhou, J.; Cao, L.; Song, Y.; Yin, Y.; Wang, X.; Yang, G.; Yi, F. Self-supporting, binder-free, and flexible Ti3C2TxMXene-based supercapacitor electrode with improved electrochemical performance. J. ACS Nano 2022, 16, 9713–9727. [Google Scholar] [CrossRef] [PubMed]
- Chen, J.; Peng, H.; Wang, X.; Shao, F.; Yuan, Z.; Han, H. Graphene oxide exhibits broad-spectrum antimicrobial activity against bacterial phytopathogens and fungal conidia by intertwining and membrane perturbation. J. Nanoscale 2014, 6, 1879–1889. [Google Scholar] [CrossRef]
- Zhu, J.; Zhang, S.; Wang, L.; Jia, D.; Xu, M.; Zhao, Z.; Qiu, J.; Jia, L. Engineering cross-linking by coal-based graphene quantum dots toward tough, flexible, and hydrophobic electrospun carbon nanofiber fabrics. J. Carbon 2018, 129, 54–62. [Google Scholar] [CrossRef]
- Wang, Y.M.; Zhang, C.H. Reduced Graphene Oxide Derived from Low-Grade Coal for High-Performance Flexible Supercapacitors with Ultrahigh Cyclability. J. Nanomater. 2022, 12, 2989. [Google Scholar] [CrossRef]
- Savitskii, D.P. Preparation and characterization of colloidal dispersions of graphene-like structures from different ranks of coals. J. Fuel Chem. Technol. 2017, 45, 897–907. [Google Scholar] [CrossRef]
- Li, j.; Qin, Y.; Chen, Y.; Song, Y.; Wang, Z. HRTEM observation of morphological and structural evolution of aromatic fringes during the transition from coal to graphite. J. Carbon 2022, 187, 133–144. [Google Scholar] [CrossRef]
- Loeh, M.O.; Badaczewski, F.; Faber, K.; Hintner, S.; Bertino, M.F.; Mueller, P.; Metz, J.; Smarsly, B.M. Analysis of thermally induced changes in the structure of coal tar pitches by an advanced evaluation method of X-ray scattering data. J. Carbon 2016, 109, 823–835. [Google Scholar] [CrossRef]
- Meng, J.; Li, S.; Niu, J. Crystallite Structure Characteristics and Its Influence on Methane Adsorption for Different Rank Coals. J. ACS Omega 2019, 26, 20762–20772. [Google Scholar] [CrossRef] [PubMed]
- Xi, P.; Ma, R.; Liu, W. Study on the Crystal Structure of Coal Kaolinite and Non-Coal Kaolinite: Insights from Experiments and DFT Simulations. Symmetry 2020, 12, 1125. [Google Scholar] [CrossRef]
- Islam, F.; Tahmasebi, A.; Wang, R.; Yu, J. Structure of Coal-Derived Metal-Supported Few-Layer Graphene Composite Materials Synthesized Using a Microwave-Assisted Catalytic Graphitization Process. Nanomaterials 2021, 11, 1672. [Google Scholar] [CrossRef] [PubMed]
- Chen, C.; Kong, Q.; Shi, J.; Li, S.; Su, F.; Li, X.; Liu, Z.; Huang, X.; Guo, X.q. Preparation Method of Coal Base Graphene. Chinse Patent CN105819430A, 16 March 2016. [Google Scholar]
- Arsyad, W.S.; Pranata, Y.; Variani, V.I.; Usman, I.; Aba, L.; Agusu, L. Synthesize of rGO from coal (sub-bituminous) as a counterelectrode on dye-sensitized solar cells. J. Phys. Conf. Ser. 2021, 1951, 012005. [Google Scholar] [CrossRef]
- Liu, G.-y.; Li, K.-k.; Jia, J.; Zhang, Y.-t. Coal-based graphene as a promoter of TiO2 catalytic activity for the photocatalytic degradation of organic dyes. J. New Carbon Mater. 2022, 37, 1172–1182. [Google Scholar] [CrossRef]
- Kumar, E.S.; Sivasankar, V.; Sureshbabu, R.; Raghu, S.; Kalaivani, R.A. Facile synthesis of few layer graphene from bituminous coal and its application towards electrochemical sensing of caffeine. Adv. Mater. Lett. 2017, 8, 239–245. [Google Scholar] [CrossRef]
- Atkins, C.A.; Lindemann, G.W.; Targett, M. Methods for Producing Graphene from Coal. U.S. Patent US2019/0194022A1, 27 June 2019. [Google Scholar]
- Popova, A.N. Crystallographic Analysis of Graphite by X-Ray Diffraction. Coke Chem. 2017, 60, 361–365. [Google Scholar] [CrossRef]
- Mubari, P.K.; Beguerie, T.; Monthioux, M.; Weiss-Hortala, E.; Nzihou, A.; Puech, P. The X-ray, Raman and TEM Signatures of Cellulose-Derived Carbons Explained. C 2022, 8, 4. [Google Scholar] [CrossRef]
- Fujimoto, H. Theoretical X-ray scattering intensity of carbons with turbostratic stacking and AB stacking structures. Carbon 2003, 41, 1585–1592. [Google Scholar] [CrossRef]
- Cançado, L.G.; Takai, K.; Enoki, T.; Endo, M.; Kim, Y.A.; Mizusaki, H.; Jorio, A.; Coelho, L.N.; Magalhães-Paniago, R.; Pimenta, M.A. General equation for the determination of the crystallite size La of nanographite by Raman spectroscopy. Appl. Phys. Lett. 2006, 88, 163106. [Google Scholar] [CrossRef]
- Pimenta, M.A.; Dresselhaus, G.; Dresselhaus, M.S.; Cançado, L.G.; Jorio, A.; Saito, R. Studying disorder in graphite-based systems by Raman spectroscopy. Phys. Chem. Chem. Phys. 2007, 9, 1276–1290. [Google Scholar] [CrossRef]
- Puech, P.; Kandara, M.; Paredes, G.; Moulin, L.; Weiss-Hortala, E.; Kundu, A.; Ratel-Ramond, N.; Plewa, J.-M.; Pellenq, R.; Monthioux, M. Analyzing the Raman Spectra of Graphenic Carbon Materials from Kerogens to Nanotubes: What Type of Information Can Be Extracted from Defect Bands? C 2019, 5, 69. [Google Scholar] [CrossRef]
- Tuinstra, F.; Koenig, J. Raman Spectrum of Graphite. J. Chem. Phys. 1970, 53, 1126–1130. [Google Scholar] [CrossRef]
- Sadezky, A.; Muckenhuber, H.; Grothe, H.; Niessner, R.; Pöschl, U. Raman microspectroscopy of soot and related carbonaceous materials: Spectral analysis and structural information. Carbon 2005, 8, 1731–1742. [Google Scholar] [CrossRef]
- Kuanyshbekov, T.K.; Akаtаn, K.; Kabdrakhmanova, S.K.; Nemkaeva, R.; Aitzhanov, M.; Imasheva, A.; Kаirаtuly, E. Synthesis of Graphene Oxide from Graphite by the Hummers’ Method. J. Oxid. Commun. 2021, 44, 356–365. [Google Scholar]
- Iqbaldin, M.N.; Azlan, M.I.; Khudzir, I. One Step Process of Producing Reduced Graphene Oxide from Silantek Sub-Bituminous Coal Using Microwave Irradiation Heating. Int. J. Eng. Technol. 2018, 7, 73–77. [Google Scholar]
- Kishibayeva, K.K.; Tokpayev, R.R.; Atchabarov, A.A.; Efremov, S.A.; Voropaeva, N.L.; Fernández-Sanjurjo, M.J.; Nechipurenko, S.V.; Nauryzbayev, M.K.; Tassibekov, S.K.; Karpachev, V.V. Activated Carbons of Varied Nature in Recovery of Gold. Russ. J. Appl. Chem. 2016, 89, 381–387. [Google Scholar] [CrossRef]
- Fiolek, B.W.; Macquarrie, S.L.; Omari, K.W. Generation of High Quality Birch-Based Activated Carbons for Adsorption of Heavy Metals and PAH from Water. WO2015066816A1, 14 May 2015. [Google Scholar]
- Seyedzadeh, A.; Mwafy, A.; Ahmed, W.K.; Kamala Pandurangan, K.; Hilal-Alnaqbi, A. Activating Carbon Fibers and Date Pits for Use in Liver Toxin Adsorption. In Poisoning-From Specific Toxic Agents to Novel Rapid and Simplified Techniques for Analysis [Internet]; Malangu, N., Ed.; IntechOpen: London, UK, 2017; Available online: https://www.intechopen.com/chapters/57993 (accessed on 17 January 2023).
- Shinke, K.; Ando, K.; Koyama, T.; Takai, T.; Nakaji, S.; Ogino, T. Properties of various carbon nanomaterial surfaces in bilirubin adsorption. J. Colloids Surf. B Biointerfaces 2010, 77, 18–21. [Google Scholar] [CrossRef]
- Chang, S.-K.; Zainal, Z. Activated Carbon for Supercapacitors. J. Synth. Technol. Appl. Carbon Nanomater. 2019, 309–334. [Google Scholar] [CrossRef]
- Kim, C.H.; Kim, B.-H. Zinc oxide/activated carbon nanofiber composites for high-performance supercapacitor electrodes. J. Power Sources 2015, 274, 512–520. [Google Scholar] [CrossRef]
- Taha, A.; Ben Aissa, M.; Da’na, E. Green Synthesis of an Activated Carbon-Supported Ag and ZnO Nanocomposite for Photocatalytic Degradation and Its Antibacterial Activities. J. Mol. 2020, 25, 1586. [Google Scholar] [CrossRef]
- Boehm, H.P. Surface oxides on carbon and their analysis: A critical assessment. J. Carbon 2002, 40, 145. [Google Scholar] [CrossRef]
- Lim, D.J.; Marks, N.A.; Rowles, M.R. Universal Scherrer equation for graphene fragments. Carbon 2020, 162, 475–480. [Google Scholar] [CrossRef]
- Coker, Z.; Troyanova-Wood, M.; Traverso, A.J.; Yakupov, T.; Utegulov, Z.N.; Yakovlev, V.V. Assessing performance of modern Brillouin spectrometers. Opt. Express. 2018, 26, 2400–2409. [Google Scholar] [CrossRef]
- Fuku, X.; Dyosiba, X.; Iftikhar, F.J. Green prepared nanomaterials from various biodegradable wastes and their application in energy. J. Nano-Struct. Nano-Objects 2023, 35, 100997. [Google Scholar] [CrossRef]
- Nandi, D.; Parameswaranpillai, J.; Siengchin, S. Synthesis of three-dimensional graphene architectures from chicken feather and its unusual dimensional crossover in electronic conductivity. J. Nano-Struct. Nano-Objects 2021, 25, 100665. [Google Scholar] [CrossRef]
- Saha, J.K.; Dutta, A. A Review of Graphene: Material Synthesis from Biomass Sources. J. Waste Biomass Valorization 2022, 13, 1385–1429. [Google Scholar] [CrossRef]
- Chafidz, A.; Astuti, W.; Augustia, V.; Novira, D.T.; Rofiah, N. Removal of methyl violet dye via adsorption using activated carbon prepared from Randu sawdust (Ceiba pentandra). IOP Conf. Ser. Earth Environ. Sci. 2018, 167, 012013. [Google Scholar] [CrossRef]
- Marinin, S.D.; Afrikyan, G.T. Production of carbon sorbents for metal recovery from metal salt solutions. Min. Inf. Anal. Bull. 2020, 4, 33. [Google Scholar] [CrossRef]
- Zuñiga, J.; Akashi, L.; Pinheiro, T.; Rivera, M.; Barreto, L.; Albertin, K.F.; Champi, A. Synthesis of lysozyme-reduced graphene oxide films for biosensor applications. J. Diam. Relat. Mater. 2020, 126, 109093. [Google Scholar] [CrossRef]
- Larraza, I.; Ugarte, L.; Fayanas, A.; Gabilondo, N.; Arbelaiz, A.; Corcuera, M.A.; Eceiza, A. Influence of Process Parameters in Graphene Oxide Obtention on the Properties of Mechanically Strong Alginate Nanocomposites. J. Mater. 2020, 13, 1081. [Google Scholar] [CrossRef] [PubMed]
- Kaniyoor, A.; Ramaprabhu, S. A Raman spectroscopic investigation of graphite oxide derived grapheme. J. AIP Adv. 2012, 2, 032183. [Google Scholar] [CrossRef]
- Ferrari, A.C. Raman spectroscopy of graphene and graphite: Disorder, electron–phonon coupling, doping and nonadiabatic effects. J. Solid State Commun. 2007, 143, 47–57. [Google Scholar] [CrossRef]
- Cançado, L.G.; Pimenta, M.A.; Neves, B.R.A.; Medeiros-Ribeiro, G.; Enoki, T.; Jorio, A. Anisotropy of the Raman Spectra of Nanographite Ribbons. J. Phys. Rev. Lett. 2004, 93, 047403. [Google Scholar] [CrossRef] [PubMed]
- Nemanich, R.J.; Solin, S.A. First- and second-order Raman scattering from finite-size crystals of graphite. J. Phys. Rev. B 1979, 20, 392–401. [Google Scholar] [CrossRef]
- Roscher, S.; Hoffmann, R.; Ambacher, O. Determination of the graphene-graphite ratio of graphene powder by Raman 2D band symmetry analysis. J. Anal. Methods 2019, 11, 1224–1228. [Google Scholar] [CrossRef]
- Frank, O.; Mohr, M.; Maultzsch, J.; Thomsen, C.; Riaz, I.; Jalil, R.; Galiotis, C. Raman 2D-Band Splitting in Graphene: Theory and Experiment. J. ACS Nano 2011, 5, 2231–2239. [Google Scholar] [CrossRef]
- Mohr, M.; Maultzsch, J.; Thomsen, C. Splitting of the Raman 2D Band of Graphene Subjected to Strain. J. Phys. Rev. B 2010, 82, 201409. [Google Scholar] [CrossRef]
- Scardaci, V.; Compagnini, G. Raman Spectroscopy Investigationof Graphene Oxide Reduction by Laser Scribing. J. Carbon Res. 2021, 7, 48. [Google Scholar] [CrossRef]
- López-Díaz, D.; Delgado-Notario, J.A.; Clericò, V.; Diez, E.; Merchán, M.D.; Velázquez, M.M. Towards Understanding the Raman Spectrum of Graphene Oxide: The Effect of the Chemical Composition. J. Coat. 2020, 10, 524. [Google Scholar] [CrossRef]
- Kudin, K.N.; Ozbas, B.; Schniepp, H.C.; Prud’homme, R.K.; Aksay, I.A.; Car, R. Raman Spectra of Graphite Oxide and Functionalized Graphene Sheets. J. Nano Lett. 2008, 8, 36–41. [Google Scholar] [CrossRef] [PubMed]
- Sadilov, I.; Petukhov, D.; Brotsman, V.; Chumakova, A.; Eliseev, A.; Eliseev, A. Light Response and Switching Behavior of Graphene Oxide Membranes Modified with Azobenzene Compounds. J. Membr. 2022, 12, 1131. [Google Scholar] [CrossRef] [PubMed]
- Dennison, J.R.; Greg Swain, M.H. Raman Spectroscopy of Carbon Materials. J. Spectrosc. 1996, 11, 38–45. [Google Scholar]
- Wang, Y.; Alsmeyer, D.C.; McCreery, R.L. Raman Spectroscopy of Carbon Materials: Structural Basis of Observed Spectra. J. Chem. Mater. 1990, 2, 557–563. [Google Scholar] [CrossRef]
- Carvalho, A.; Costa, M.C.F.; Marangoni, V.S.; Ng, P.R.; Nguyen, T.L.H.; Castro Neto, A.H. The Degree of Oxidation of Graphene Oxide. J. Nanomater. 2021, 11, 560. [Google Scholar] [CrossRef]
- Aliyev, E.; Filiz, V.; Khan, M.M.; Lee, Y.J.; Abetz, C.; Abetz, V. Structural Characterization of Graphene Oxide: Surface Functional Groups and Fractionated Oxidative Debris. J. Nanomater. 2019, 9, 1180. [Google Scholar] [CrossRef]
- Abolhassani, M.; Griggs, C.S.; Gurtowski, L.A.; Mattei-Sosa, J.A.; Nevins, M.; Medina, V.F.; Greenlee, L.F. Scalable Chitosan-Graphene Oxide Membranes: The Effect of GO Size on Properties and Cross-Flow Filtration Performance. J. ACS Omega 2017, 2, 8751–8759. [Google Scholar] [CrossRef]
- Qian, L.; Wang, H.; Yang, J.; Chen, X.; Chang, X.; Nan, Y.; Liu, T. Amino Acid Cross-Linked Graphene Oxide Membranes for Metal Ions Permeation, Insertion and Antibacterial Properties. J. Membr. 2020, 10, 296. [Google Scholar] [CrossRef]
- Xia, S.; Ni, M.; Zhu, T.; Zhao, Y.; Li, N. Ultrathin graphene oxide nanosheet membranes with various d-spacing assembled using the pressure-assisted filtration method for removing natural organic matter. J. Desalination 2015, 371, 78–87. [Google Scholar] [CrossRef]
- Ma, F.; Li, Z.; Zhao, H.; Geng, Y.; Zhou, W.; Li, Q.; Zhang, L. Potential application of graphene oxide membranes for removal of Cs(I) and Sr(II) from high level-liquid waste. J. Sep. Purif. Technol. 2017, 188, 523–529. [Google Scholar] [CrossRef]
- Yorgun, S.; Yıldız, D. Preparation and characterization of activated carbons from Paulownia wood by chemical activation with H3PO4. J. Taiwan Inst. Chem. Eng. 2015, 53, 122–131. [Google Scholar] [CrossRef]
- Syafiuddin, A.; Salmiati, S.; Hadibarata, T.; Salim, M.R.; Kueh, A.B.H.; Suhartono, S. Removal of Silver Nanoparticles from Water Environment: Experimental, Mathematical Formulation, and Cost Analysis. J. Water Air Soil Pollut. 2019, 230, 102. [Google Scholar] [CrossRef]
- Cychosz, K.A.; Guillet-Nicolas, R.; Garcia-Martinez, J.; Thommes, M. Recent advances characterization of hierarchically structured nanoporous materials. J. Chem. Soc. Rev. 2017, 46, 389–414. [Google Scholar] [CrossRef] [PubMed]
- Drewniak, S.; Muzyka, R.; Stolarczyk, A.; Pustelny, T.; Kotyczka-Morańska, M.; Setkiewicz, M. Studies of Reduced Graphene Oxide and Graphite Oxide in the Aspect of Their Possible Application in Gas Sensors. J. Sens. 2016, 16, 103. [Google Scholar] [CrossRef]
- Yang, D.; Velamakanni, A.; Bozoklu, G.; Park, S.; Stoller, M.; Piner, R.D.; Stankovich, S.; Jung, I.; Field, D.A.; Ventrice, C.A., Jr.; et al. Chemical analysis of graphene oxide films after heat and chemical treatments by X-ray photoelectron and Micro-Raman spectroscopy. J. Carbon 2009, 47, 145–152. [Google Scholar] [CrossRef]
- Kuanyshbekov, T.K.; Ilyin, A.M.; Beall, G.W. Researching the Properties of Functionalized Few-Layer Graphene Nanostructures. Ph.D. Thesis, The Republic of Kazakhstan Almaty, Almaty, Kazakhstan, 2019. [Google Scholar]
- Johra, F.T.; Lee, J.W.; Jung, W.G. Facile and safe graphene preparation on solution based platform. J. Ind. Eng. Chem. 2014, 20, 2883–2887. [Google Scholar] [CrossRef]
- Kovtun, A.; Jones, D.; Dell’Elce, S.; Treossi, E.; Liscio, A.; Palermo, V. Accurate chemical analysis of oxygenated graphene-based materials using X-ray photoelectron spectroscopy. J. Carbon 2018, 143, 268–275. [Google Scholar] [CrossRef]
- Yu, H.; Zhang, B.; Bulin, C.; Li, R.; Xing, R. High-efficient Synthesis of Graphene Oxide Based on Improved Hummers’ Method. J. Sci. Rep. 2016, 6, 36143. [Google Scholar] [CrossRef]
- Wei, G.; Yu, J.; Gu, M.; Tong, B. Tang Dielectric relaxation and hopping conduction in reduced graphite oxide. J. Appl. Phys. 2016, 119, 224102. [Google Scholar] [CrossRef]
- Kuanyshbekov, T.; Guseinov, N.; Tolepov, Z.; Kurbanova, B.; Tulegenova, M.; Akatan, K.; Kantay, N.; Zhasasynov, E. Thermally Reduced Graphene Oxide Membranes From Local Kazakhstan Graphite “Ognevsky”. ChemistrySelect 2023, 8, e202301746. [Google Scholar] [CrossRef]
- Qi, C.; Yang, L.; Xu, H.; He, S.; Men, Y. Natural polysaccharides-modified graphene oxide for adsorption of organic dyes from aqueous solutions. J. Colloid. Interface Sci. 2017, 486, 84–96. [Google Scholar] [CrossRef] [PubMed]
- Tang, G.; Jiang, Z.G.; Li, X.; Zhang, H.B.; Dasari, A.; Yu, Z.Z. Three dimensional graphene aerogels and their electrically conductive composites. Carbon 2014, 77, 592–599. [Google Scholar] [CrossRef]
- Manoj, B.; Kunjomana, A.G. Study of Stacking Structure of Amorphous Carbon by X-ray Diffraction Technique. Int. J. Electrochem. Sci. 2012, 7, 3127. [Google Scholar] [CrossRef]
- Manoj, B. Synthesis and Characterization of Porous, Mixed Phase, Wrinkled, Few Layer Graphene Like Nanocarbon from Charcoal. Russ. J. Phys. Chem. A 2015, 89, 2438–2442. [Google Scholar] [CrossRef]
- Lu, L.; Sahajwalla, V.; Kong, C.; Harris, D. Quantitative X-ray diffraction analysis and its application to various coals. Carbon 2001, 39, 1821–1833. [Google Scholar] [CrossRef]
- Siburian, R.; Sihotang, H.; Lumban Raja, S.; Supeno, M.; Simanjuntak, C. New Route to Synthesize of Graphene Nano Sheets. Orient. J. Chem. 2018, 34, 182–187. [Google Scholar] [CrossRef]
- Purwandari, V.; Gea, S.; Wirjosentono, B.; Haryono, A. Synthesis of Graphene Oxide from The SawahluntoSijunjung Coal Via Modified Hummers’ Method. In Proceedings of the 3rd International Seminar on Chemistry: Green Chemistry and Its Role for Sustainability, Surabaya, Indonesia, 18–19 July 2018; Volume 2049, pp. 020065-1–020065-6. [Google Scholar] [CrossRef]
- Kim, S.-G.; Park, O.-K.; Lee, J.H.; Ku, B.-C. Layer-by-layer assembled graphene oxide films and barrier properties of thermally reduced graphene oxide membranes. J. Carbon Lett. 2013, 14, 247–250. [Google Scholar] [CrossRef]
- Greczynski, G.; Hultman, L. X-ray photoelectron spectroscopy: Towards reliable binding energy referencing. J. Prog. Mater. Sci. 2019, 107, 100591. [Google Scholar] [CrossRef]
- Barr, T.L. Advances in the application of X-ray photoelectron spectroscopy (ESCA) Part II. New methods. J. Crit. Rev. Anal. Chem. 1991, 22, 229–325. [Google Scholar] [CrossRef]
- Mattevi, C.; Eda, G.; Agnoli, S.; Miller, S.; Mkhoyan, K.A.; Celik, O.; Mastrogiovanni, D.; Granozzi, G.; Garfunkel, E.; Chhowalla, M. Evolution of electrical, chemical, and structural properties of transparent and conducting chemically derived graphene thin films. J. Adv. Funct. Mater. 2009, 19, 2577–2583. [Google Scholar] [CrossRef]
- Bagri, A.; Mattevi, C.; Acik, M.; Chabal, Y.J.; Chhowalla, M.; Shenoy, V.B. Structural evolution during the reduction of chemically derived graphene oxide. J. Nat. Chem. 2010, 2, 581. [Google Scholar] [CrossRef] [PubMed]
- Kuanyshbekov, T.; Sagdollin, Z.; Zhasasynov, E.; Akatan, K.; Kurbanova, B.; Guseinov, N.; Tolepov, Z.; Kantay, N.; Beisebekov, M. Composite membrane based on graphene oxide and carboxymethylcellulose from local Kazakh raw materials for possible applications in electronic devices. J. Compos. Sci. 2023, 7, 342. [Google Scholar] [CrossRef]
- Kuanyshbekov, T.; Guseinov, N.; Kurbanova, B.; Nemkaeva, R.; Akаtаn, K.; Tolepov, Z.; Tulegenova, M.; Aitzhanov, M.; Zhasasynov, E.; Thomas, S. Local Natural Graphite as a Promising Raw Material for the Production of Thermally Reduced Graphene-Like Films. Eng. Science. 2024, 23, 1000. [Google Scholar] [CrossRef]
- Ali, R.; Aslam, Z.; Shawabkeh, R.A.; Asghar, A.; Hussein, I.A. BET, FTIR, and RAMAN characterizations of activated carbon from waste oil fly ash. Turk. J. Chem. 2020, 44, 279–295. [Google Scholar] [CrossRef]
- Fuertes, A.B.; Ferrero, G.A.; Diez, N.; Sevilla, M. A Green route to high-surface area carbons by chemical activation of biomass-based products with sodium thiosulfate. ACS Sustain. Chem. Eng. 2018, 10, 16323–16331. [Google Scholar] [CrossRef]
- Li, M.; Liu, Q.; Jia, Z.; Xu, X.; Cheng, Y.; Zheng, Y.; Xi, T.; Wei, S. Graphene oxide/hydroxyapatite composite coatings fabricated by electrophoretic nanotechnology for biological applications. Carbon 2014, 67, 185–197. [Google Scholar] [CrossRef]


| Samples | Functional Groups | ||||||||
|---|---|---|---|---|---|---|---|---|---|
| UV Spectra, λ, Wavelength (nm) | FTIR Spectra, Wavenumber (cm−1) | ||||||||
| 228 | 233 | 980 | 1054 | 1249 | 1585 | 1723 | 1420 | 3300 | |
| G–GO | presence of π-π* bond of aromatic ring in GO molecule and C=O bonds in epoxy and carbonyl groups | C-O-H and C=O bonds | C–O alkoxy bonds | C–O epoxy functional groups | C=C bonds of the aromatic ring | C=O bonds in carbonyl group and carboxyl groups | O-H | ||
| BAC–GO | |||||||||
| Samples | Total Number of Oxygen-Containing Groups, mg-eq/g |
|---|---|
| BAC | 0.2 ± 0.01 |
| Graphite | 0.2 ± 0.01 |
| BAC–GO | 13 ± 0.2 |
| G–GO | 15 ± 0.2 |
| Samples | 2D | D-Band Position (cm−1) | G-Band Position (cm−1) | ID (arb.u.) | IG (arb.u.) | La (nm) | ID/IG |
|---|---|---|---|---|---|---|---|
| G | 2747 | 1360 | 1582 | 0.3642 | 1 | 33.09 | 0.3642 |
| G–GO | Broad peak 2600–2800 | 1357 | 1589 | 0.8813 | 1 | 13.69 | 0.88 |
| BAC | 1360 | 1595 | 1 | 0.8148 | 9.8 | 1.23 | |
| BAC–GO | 1354 | 1598 | 1 | 0.7158 | 8.67 | 1.39 |
| Samples | Functional Groups | ||||||||||
|---|---|---|---|---|---|---|---|---|---|---|---|
| FTIR Spectra, Wavelength (cm−1) | XPS Spectra Binding Energy (E) eV | ||||||||||
| C1s | O1s | ||||||||||
| 980 | 1054 | 1249 | 1585 | 1723 | 1420 | 3300 | 284.6; 286.6 288.8 | 284.1; 288.8; 292–295 | 532.5 | 532.6 | |
| G–GO | C-O-H and C=O bonds | C–O alkoxy bonds | C–O epoxy functional groups | C=C bonds of the aromatic ring | C=O bonds in carbonyl group and carboxyl groups | O-H | sp2 aromatic carbon atoms (C=C), epoxy groups (C-O-C), and carboxyl groups (C(O)-O-H) | C=O C–O ketone, carbonyl, hydroxyl, and epoxy functionalities | |||
| BAC–GO | sp2 carbon (C-C/C=C, 284.1 eV); carbonyl/carboxyl groups (C=O/O-C=O, 288.8 eV); π-π* transitions in aromatic closed chains in the region of 292–295 eV | ||||||||||
| Samples | d Inter-Layer Distance (Å) |
|---|---|
| BAC | 3.59 |
| Graphite | 3.5 |
| BAC–GO | 8.2 |
| G–GO | 10.2 |
| Samples | Parameters | Peak Position | θ (°) (2θ(°)/2) | β | cos θ(°) | Crystallite Size (Å) D | Crystallite Size (nm) D | ||
|---|---|---|---|---|---|---|---|---|---|
| K [37] | Λ (Å) | 2θ(°) | FWHM (In Degree) | FWHM (In Radian) | |||||
| graphite | 0.94 | 1.5418 | 26.43 | 13.21 | 0.55 | 0.009595986 | 0.79 | 120.31 | 12.03 |
| G–GO | 0.94 | 1.5418 | 7.05 | 3.53 | 0.27 | 0.004807155 | 0.92 | 279.33 | 27.93 |
| BAC | 0.94 | 1.5418 | 23.46 | 11.73 | 7.63 | 0.13320925 | 0.67 | 7.30 | 0.73 |
| BAC–GO | 0.94 | 1.5418 | 11.91 | 5.96 | 1.48 | 0.025833508 | 0.95 | 53.15 | 5.31 |
| Samples | Brillouin Shift (Ghz) Elasticity | Brillouin Line Width Viscosity | Density (g/cm3) | Sound Velocity (m/s) | Young Modulus GPa |
|---|---|---|---|---|---|
| BAC–GO | 7.47 | 0.68 | 0.99 | 1483.91 | 2.17 |
| G–GO | 7.55 | 0.67 | 1 | 1483.83 | 2.2 |
Disclaimer/Publisher’s Note: The statements, opinions and data contained in all publications are solely those of the individual author(s) and contributor(s) and not of MDPI and/or the editor(s). MDPI and/or the editor(s) disclaim responsibility for any injury to people or property resulting from any ideas, methods, instructions or products referred to in the content. |
© 2024 by the authors. Licensee MDPI, Basel, Switzerland. This article is an open access article distributed under the terms and conditions of the Creative Commons Attribution (CC BY) license (https://creativecommons.org/licenses/by/4.0/).
Share and Cite
Kuanyshbekov, T.; Akatan, K.; Guseinov, N.; Nemkaeva, R.; Kurbanova, B.; Tolepov, Z.; Tulegenova, M.; Kabdrakhmanova, S.; Zhilkashinova, A. Renewable Resources as Promising Materials for Obtaining Graphene Oxide-like Structures. Nanomaterials 2024, 14, 1588. https://doi.org/10.3390/nano14191588
Kuanyshbekov T, Akatan K, Guseinov N, Nemkaeva R, Kurbanova B, Tolepov Z, Tulegenova M, Kabdrakhmanova S, Zhilkashinova A. Renewable Resources as Promising Materials for Obtaining Graphene Oxide-like Structures. Nanomaterials. 2024; 14(19):1588. https://doi.org/10.3390/nano14191588
Chicago/Turabian StyleKuanyshbekov, Tilek, Kydyrmolla Akatan, Nazim Guseinov, Renata Nemkaeva, Bayan Kurbanova, Zhandos Tolepov, Malika Tulegenova, Sana Kabdrakhmanova, and Almira Zhilkashinova. 2024. "Renewable Resources as Promising Materials for Obtaining Graphene Oxide-like Structures" Nanomaterials 14, no. 19: 1588. https://doi.org/10.3390/nano14191588