Article

Tuneable Red and Blue Emission of Bi3+-Co-Doped SrF2:Eu3+ Nanophosphors for LEDs in Agricultural Applications

Centre of Excellence for Photoconversion, Vinča Institute of Nuclear Sciences—National Institute of the Republic of Serbia, University of Belgrade, 11000 Belgrade, Serbia
*
Authors to whom correspondence should be addressed.
Nanomaterials 2024, 14(20), 1617; https://doi.org/10.3390/nano14201617
Submission received: 17 September 2024 / Revised: 4 October 2024 / Accepted: 8 October 2024 / Published: 10 October 2024
(This article belongs to the Section Inorganic Materials and Metal-Organic Frameworks)

Abstract

:
Tunable blue/red dual-emitting Eu3+-doped, Bi3+-sensitized SrF2 phosphors were synthesized utilizing a solvothermal-microwave method. All phosphors have cubic structure (Fm-3m (225) space group) and well-distinct sphere-like particles with a size of ~20 nm, as examined by X-ray diffraction and transmission electron microscopy. The diffuse reflectance spectra reveal a redshift of the absorption band in the UV region as the Bi3+ concentration in SrF2: Eu3+ phosphor increases. Under the 265 nm excitation, photoluminescence spectra show emission at around 400 nm from the host matrix and characteristic orange 5D0 → 7F1,2 and deep red 5D0 → 7F4 Eu3+ emissions. The red emission intensity increases with an increase in Bi3+ concentration up to 20 mol%, after which it decreases. The integrated intensity of Eu3+ red emission in the representative 20 mol% Bi3+ co-doped SrF2:10 mol% Eu3+ shows twice as bright emission compared to the Bi3+-free sample. To demonstrate the potential application in LEDs for artificial light-based plant factories, the powder with the highest emission intensity, SrF2: 10Eu, 20 Bi, was mixed with a ceramic binder and placed on top of a 275 nm UVC LED chip, showing pinkish violet light corresponding to blue (409 nm) and red (592, 614, and 700 nm) phosphors’ emission.

Graphical Abstract

1. Introduction

Plants require light for photosynthesis, morphogenesis, physiological reactions, and the buildup of bioactive compounds [1]. The usage of LEDs (light-emitting diodes) in plant cultivation has markedly increased in recent years due to their cool emitting surface, extended longevity, and customizable spectrum composition aligned with the absorption wavelengths of plant photoreceptors [2,3]. Plants absorb light for photosynthesis in the 300–800 nm wavelength range, although different plant photoreceptors have varying absorption properties [4].
The photosynthetically active radiation (PAR) spectrum, which spans from 400 to 700 nm, is crucial for plant growth as it encompasses the wavelengths most effective for photosynthesis. Plants primarily absorb blue and red light to drive this process, and recent research has demonstrated the importance of deep-red light for the growth of leafy plants [5]. Blue light supports vegetative growth and leaf development, promoting strong, compact plants with efficient photosynthesis. Red light is essential for flowering and fruiting, influencing plant morphology and the timing of these developmental stages. Although red light is crucial for leaf expansion, blooming, and overall plant growth, some studies suggest that plants under red light can achieve higher dry weight compared to those exposed to mixed red and blue light [6,7]. Additionally, blue light may negatively impact chlorophyll concentration [2]. Adding a specific amount of blue to red light in LEDs for agricultural applications is crucial for balancing the effects on plant photoreceptors. This combination helps avoid the drawbacks of using only red or blue light, ensuring a more effective interaction with both blue-absorbing cryptochrome and red-absorbing phytochrome. This balance is essential for promoting optimal plant health and growth [8]. Researchers have found that using a significant amount of blue light joint with the red one inhibits growth and leaf expansion, making it an effective strategy for controlling height in various bedding plants while preserving flowering and post-harvest quality [9,10]. Herbaceous perennial plants grown under a 50:50 blue/red LED light combination demonstrate improved root biomass and stem elongation, which minimizes damage during transportation and transplantation [11]. Incorporating blue light into a dominant red-light environment may inhibit the rapid dehydration of cuttings; blue light promotes stomatal opening and trichome production, maintaining photosynthesis while preventing transpiration [12]. Therefore, the development of suitable phosphors that can absorb blue or UV light and emit tunable blue-red light has evolved into an imperative in crop production.
Eu3+ with the 4f6 electronic configuration is a lanthanide red-emitting ion that exhibits orange, red, and deep red emission corresponding to transitions from the excited 5D0 level to the ground 7FJ (J  =  1, 2, 3, and 4) levels [13]. On the contrary, Bi3+ ions can act as a sensitizer, increasing phosphor absorption. The effective energy transfer processes from Bi3+ to Eu3+ have been explored in the following materials, which may be used in general illumination or plant growth LEDs: BaSc2O4: Li+, Eu3+, Bi3+ [14], Na4CaSi3O9: Bi3+, Eu3+ [15], BaGd2O4: Bi3+, Eu3+ [16], Ba9Lu2Si6O24:Bi3+, Eu3+ [17], and KBaYSi2O7: Bi3+, Eu3+ [18], Lu2GeO5: Bi3+, Eu3+ [19], Gd3GaO6: Bi3+, Eu3+ [20], etc. By selecting the appropriate host, the emission spectra of Bi3+–Eu3+ co-activated luminescent materials can be fine-tuned to achieve blue-red double emission, effectively aligning with the absorption spectra of plant photoreceptors such as cryptochrome and phytochrome. Among various classes of inorganic host materials, fluoride-based phosphors exhibit numerous outstanding properties, including a broad optical transmission range, anionic conductivity, low phonon energy, high resistivity, and reduced nonradiative relaxation of excited states, which ultimately enhances radiative emission [21,22]. Moreover, they can be prepared by simple, environmentally friendly, and HF-free methods [21,22,23,24,25,26,27]. Mancebo et al. found that Bi3+ sensitization enhanced Eu3+ emission in LaF3 by more than one order of magnitude because the bismuth ion in this host lattice improves the material’s X-ray attenuation capacity [25]. Luo et al. also showed that Bi3+-sensitized NaGdF4: Eu3+ nanocrystals for white LEDs exhibit increased red emission through co-doping with Bi3+ [26]. In addition to fluoride materials with enhanced red emission, tunable blue-red double-emitting phosphors that correspond to the absorption of cryptochrome and phytochrome plant photoreceptors are needed. In this study, SrF2: Bi3+, Eu3+ phosphors are prepared using the solvothermal microwave-assisted method, and their blue/red dual emission is tuned by varying the Bi3+ and Eu3+ concentrations. SrF2: Bi3+, Eu3+ phosphors exhibit two emission bands in the wavelength ranges of 400–500 nm and 575–720 nm, which can be attributed to host emission, and 5D0  →  7FJ (J = 1, 2, 3, and 4) transitions of Eu3+, respectively. Our findings indicate that SrF2:Bi3+ and Eu3+ phosphors could be an excellent choice for increasing plant photosynthesis and growth in greenhouses.

2. Experimental

2.1. Synthesis of SrF2: x mol% Eu3+ (x = 1, 5, 10, 15, 20) and SrF2: 10 mol% Eu3+, y mol% Bi3+ (y = 5, 10, 15, 20, 30, 40, 50) Nanoparticles

Two sets of samples were synthesized as follows: (a) SrF2 doped with different europium ion concentrations such as 1, 5, 10, 15, and 20 mol% (Sr1−xEuxF2 (x = 0.01, 0.05, 0.1, 0.15, 0.2), Table 1), and (b) SrF2 doped with 10 mol% of europium ions and 5, 10, 15, 20, 30, 40, and 50 mol% of bismuth ions (Sr0.9−yEu0.1BiyF2 (y = 0.05, 0.1, 0.15, 0.2, 0.3, 0.4, 0.5), Table 2). Additionally, one more sample of SrF2 doped with 20 mol% of bismuth ions was synthesized (SrF2:20Bi; exact amounts are given in Table S1 in Supplementary Materials).
The following chemicals for the synthesis of the desired samples were acquired and used as received: strontium (II) nitrate (Sr(NO3)2, Alfa Aesar, Ward Hill, MA, USA, 99%), europium (III) nitrate hexahydrate (Eu(NO3)3·6H2O, Alfa Aesar, 99.9%), bismuth (III) nitrate pentahydrate (Bi(NO3)3·5H2O, Sigma Aldrich, St. Louis, MO, USA, 98+%), sodium fluoride (NaF, Alfa Aesar, 99.9%), ethylene glycol (EG), and absolute ethanol (abs. EtOH).
In essence, strontium and europium nitrate in corresponding ratios (for the samples co-doped with bismuth ions, bismuth nitrate was added) were dissolved in ethylene glycol and stirred for 30 min. The next step is the addition of an EG solution of sodium fluoride, followed by another 30 min of stirring. The precursor mixture was then placed in the microwave reaction vessel, and the reaction conditions were as follows: (a) heating at 150 °C for 10 min, and (b) subsequently cooling to room temperature. The microwave experiments were carried out in an Anton-Paar microwave reactor (Monowave 400, Anton-Paar GmbH, Graz, Austria) in temperature control mode, utilizing a 30 mL Pyrex jar tightly sealed with a Teflon lid and stirred magnetically at 600 rpm. Each sample obtained through microwave synthesis was transferred into a centrifuge tube, centrifuged, and rinsed several times with abs. EtOH.

2.2. Characterization

Crystal structures of the obtained phosphors were investigated with an X-ray diffractometer (XRD) from Rigaku SmartLab, Tokyo, Japan (Cu-Kα1,2 radiation, λ = 0.1540 nm) at room temperature. The experimental conditions for measurements were as follows: 2θ range of 20°–90°, with a step size of 0.02° and a counting time of 10°/min. Conclusions on the structural study (unit cell parameters, crystal coherence size, micro strain values, and data fit parameters) were attained using the built-in PDXL2 software v 2.1. The average particle size was calculated using ImageJ software V 1.8.0 (https://imagej.net/software/imagej/, accessed on 7 October 2024). The morphology was examined by a TESCAN MIRA3 field emission scanning electron microscope (FE-SEM), Brno, Czech Republic, with the samples coated using a thin layer of Au, and by transmission electron microscope (TEM) JEOL JEM1011, Tokyo, Japan operated at an accelerating voltage of 100 kV. The sample’s UV–VIS diffuse reflection spectrum was recorded using a Shimadzu UV-3600 UV-VIS-NIR spectrophotometer, Kyoto, Japan with BaSO4 used as the reflectance standard. Photoluminescent properties (PL) were studied utilizing a spectrofluorometric system FHR 1000 (Horiba Jobin-Yvon, Kyoto, Japan) equipped with a 300 grooves/mm grating and an ICCD detector (Horiba Jobin-Yvon 3771). Moreover, 265 and 405 nm LEDs from Ocean Optics (Tokyo, Japan) were used as excitation sources for the steady-state emission measurements. A 275 nm LED chip (CREE) with 100 mW optical power was used to excite a mixture of luminescent powder with transparent high-temperature inorganic binder (Cerambind 643-2 from Aremco, Van Nuys, CA, USA).

3. Results and Discussion

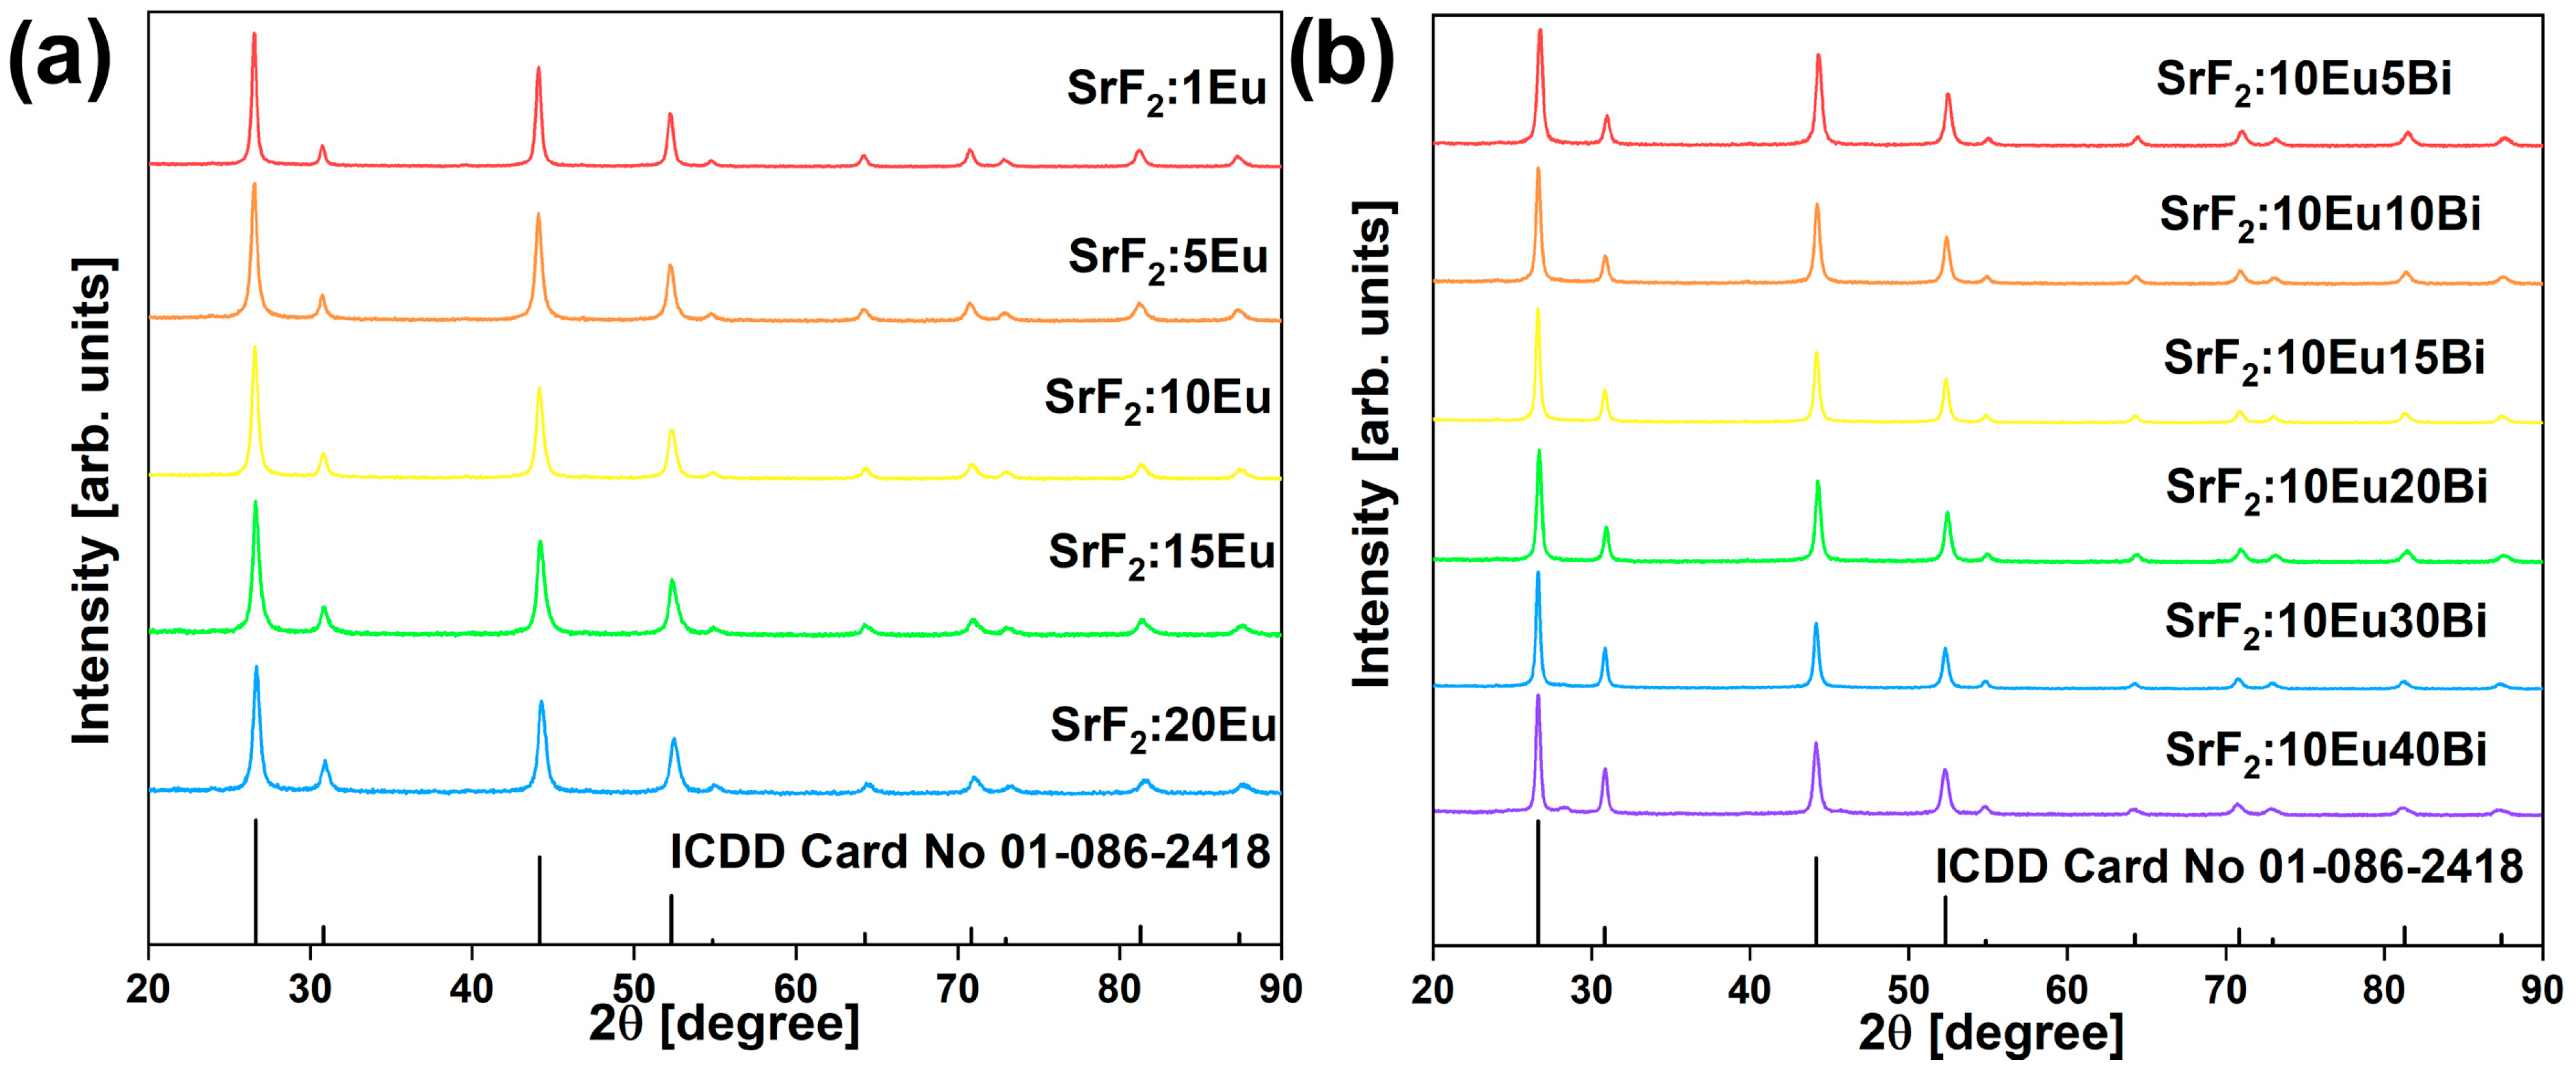
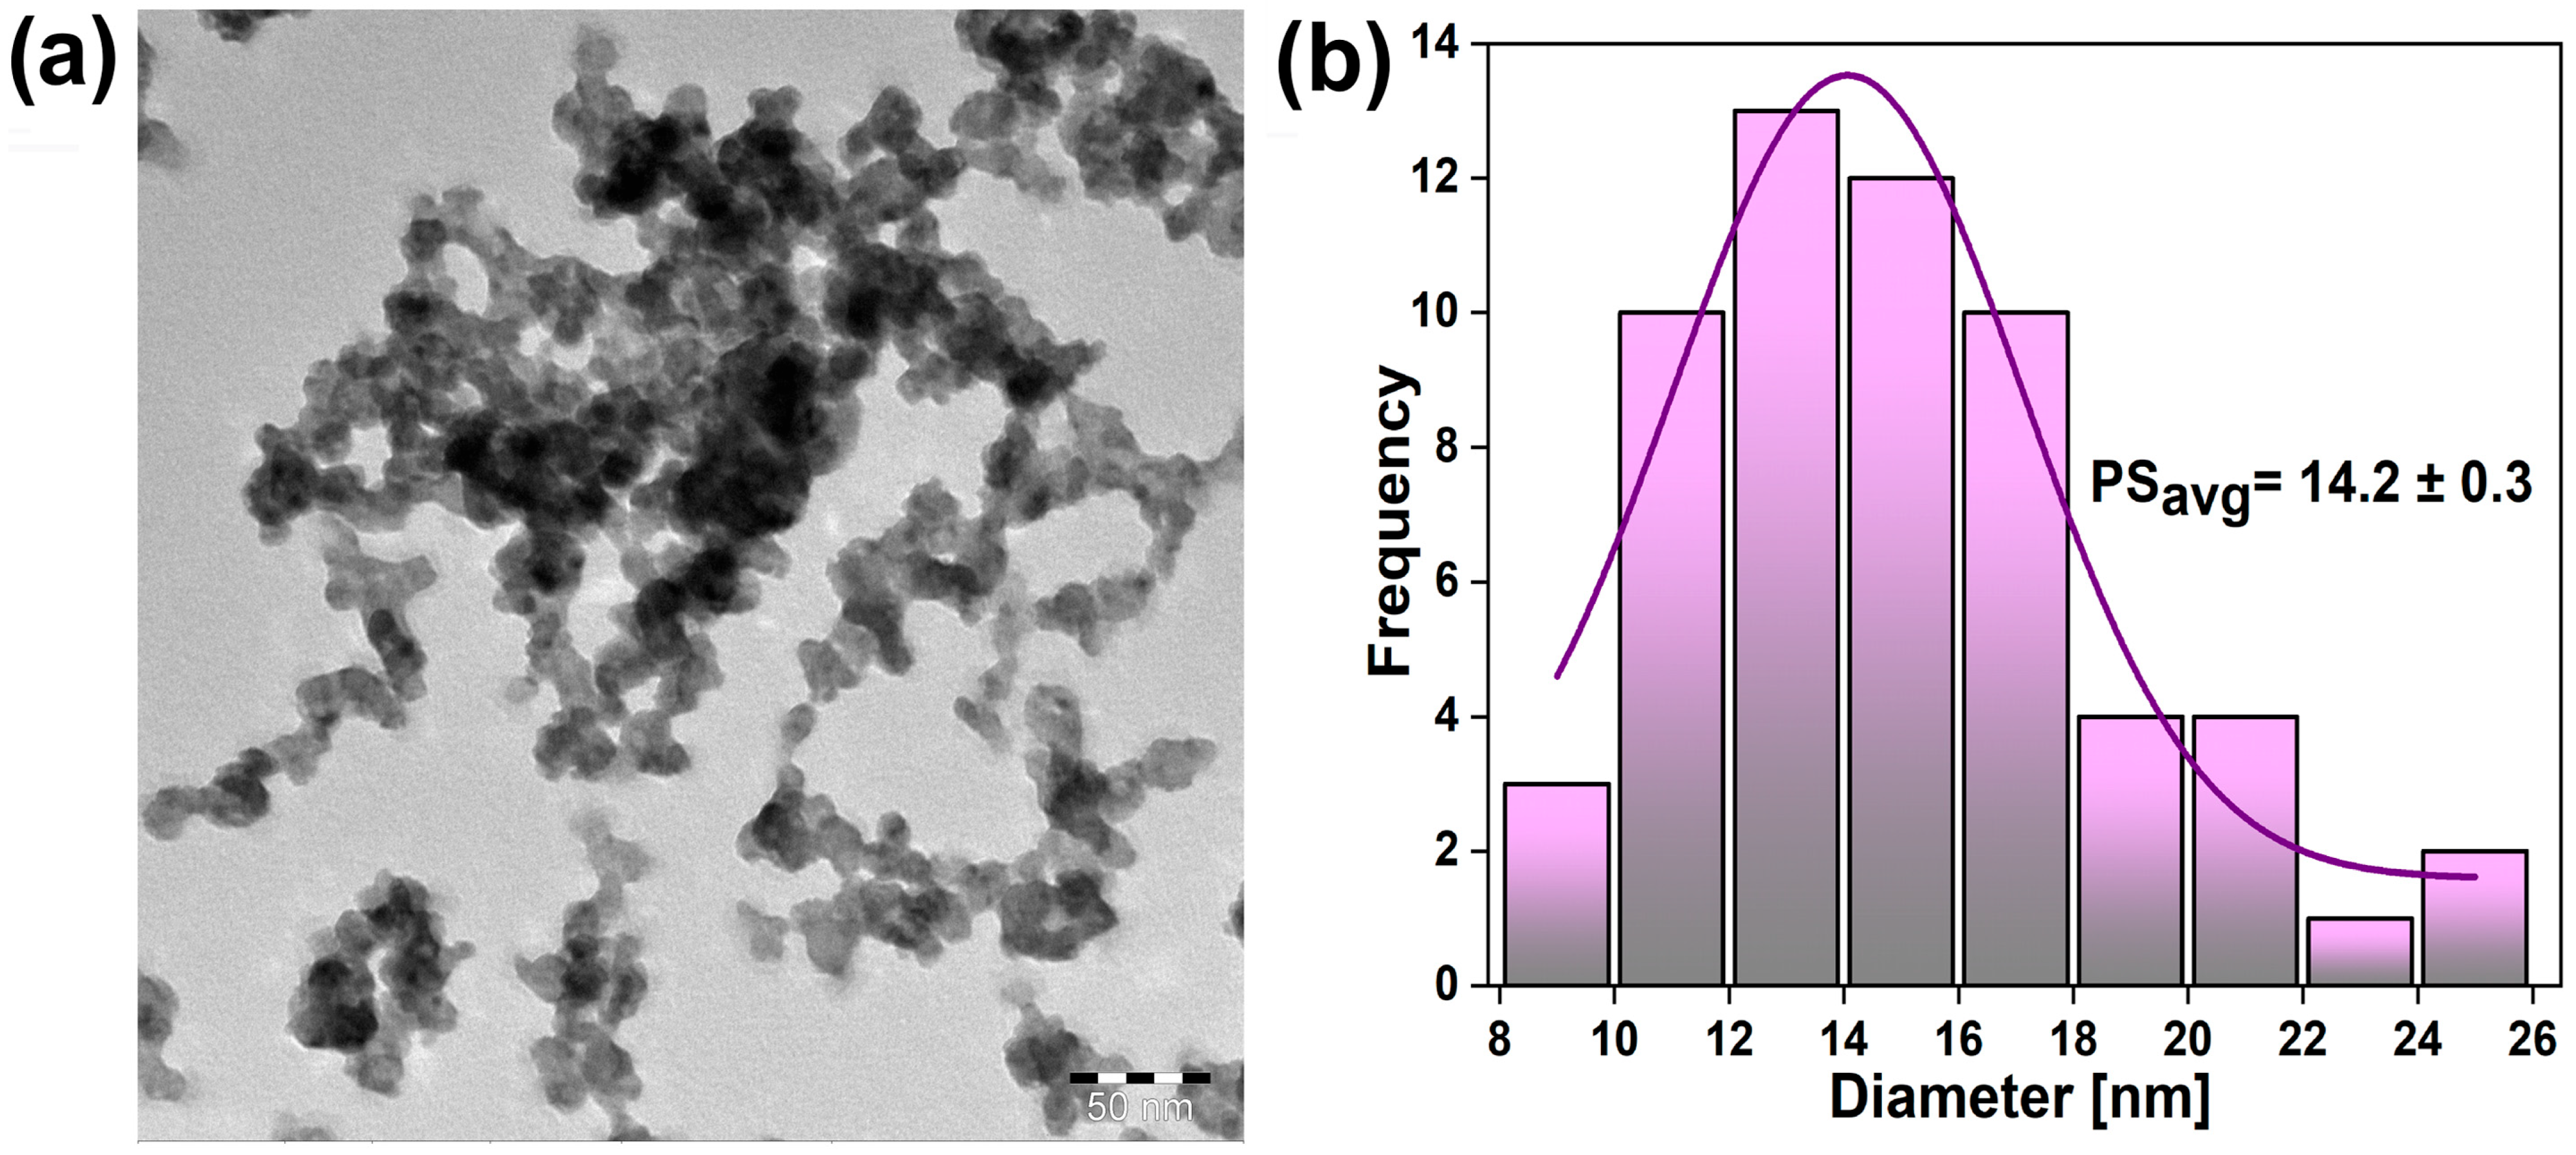
3.1. Structure and Morphology

Figure 1a,b show the X-ray pattern of SrF2:xEu (x = 1, 5, 10, 15, 20 mol%) and SrF2: 10EuyBi (y = 5, 10, 15, 20, 30, 40 mol%) presented with the International Centre for Diffraction Data (ICDD) Card No. 01-086-2418. The X-ray diffraction examination of the synthesized samples proved a single-phase cubic structure with an -3m (225) space group (including the SrF2:20Bi sample; Figure S1a in the Supplementary Materials File). Traces of contaminations or other phase peaks were not observed in either set of samples, indicating that dopant Eu3+/Bi3+ ions were embedded into the SrF2 lattice. On the contrary, in the case of the SrF2:10Eu50Bi sample, there are additional peaks originating from a different phase, suggesting that the upper limit of dopant ion concentration in the made material is reached (Supplementary Materials Figure S1b).
Additionally, integrated PDXL2 software was used to obtain the values of the mean crystallite size and structural parameters presented in Table S2 (parameters for SrF2:xEu (x = 1, 5, 10, 15, 20 mol%), SrF2:10EuyBi (y = 5, 10, 15, 20, 30, 40 mol%), and SrF2:20Bi sample). The initial parameters for the examination in PDXL2 software were collected from the reference [28]. The average crystallite size (CS) was calculated to be in the nanometer domain (~14–25 nm) for all the samples.
A transmission electron microscopy (TEM) image of the representative SrF2:10Eu20Bi sample is shown in Figure 2a. Nanoparticles exhibit a pseudospherical shape, with the average particle size estimated to be 14.2 ± 0.3 nm (see the histogram fitted with a Gaussian distribution based on around 60 particles using the largest axis of the grain in Figure 2b). The calculated average particle size roughly equals the crystallite size obtained using X-ray diffraction.

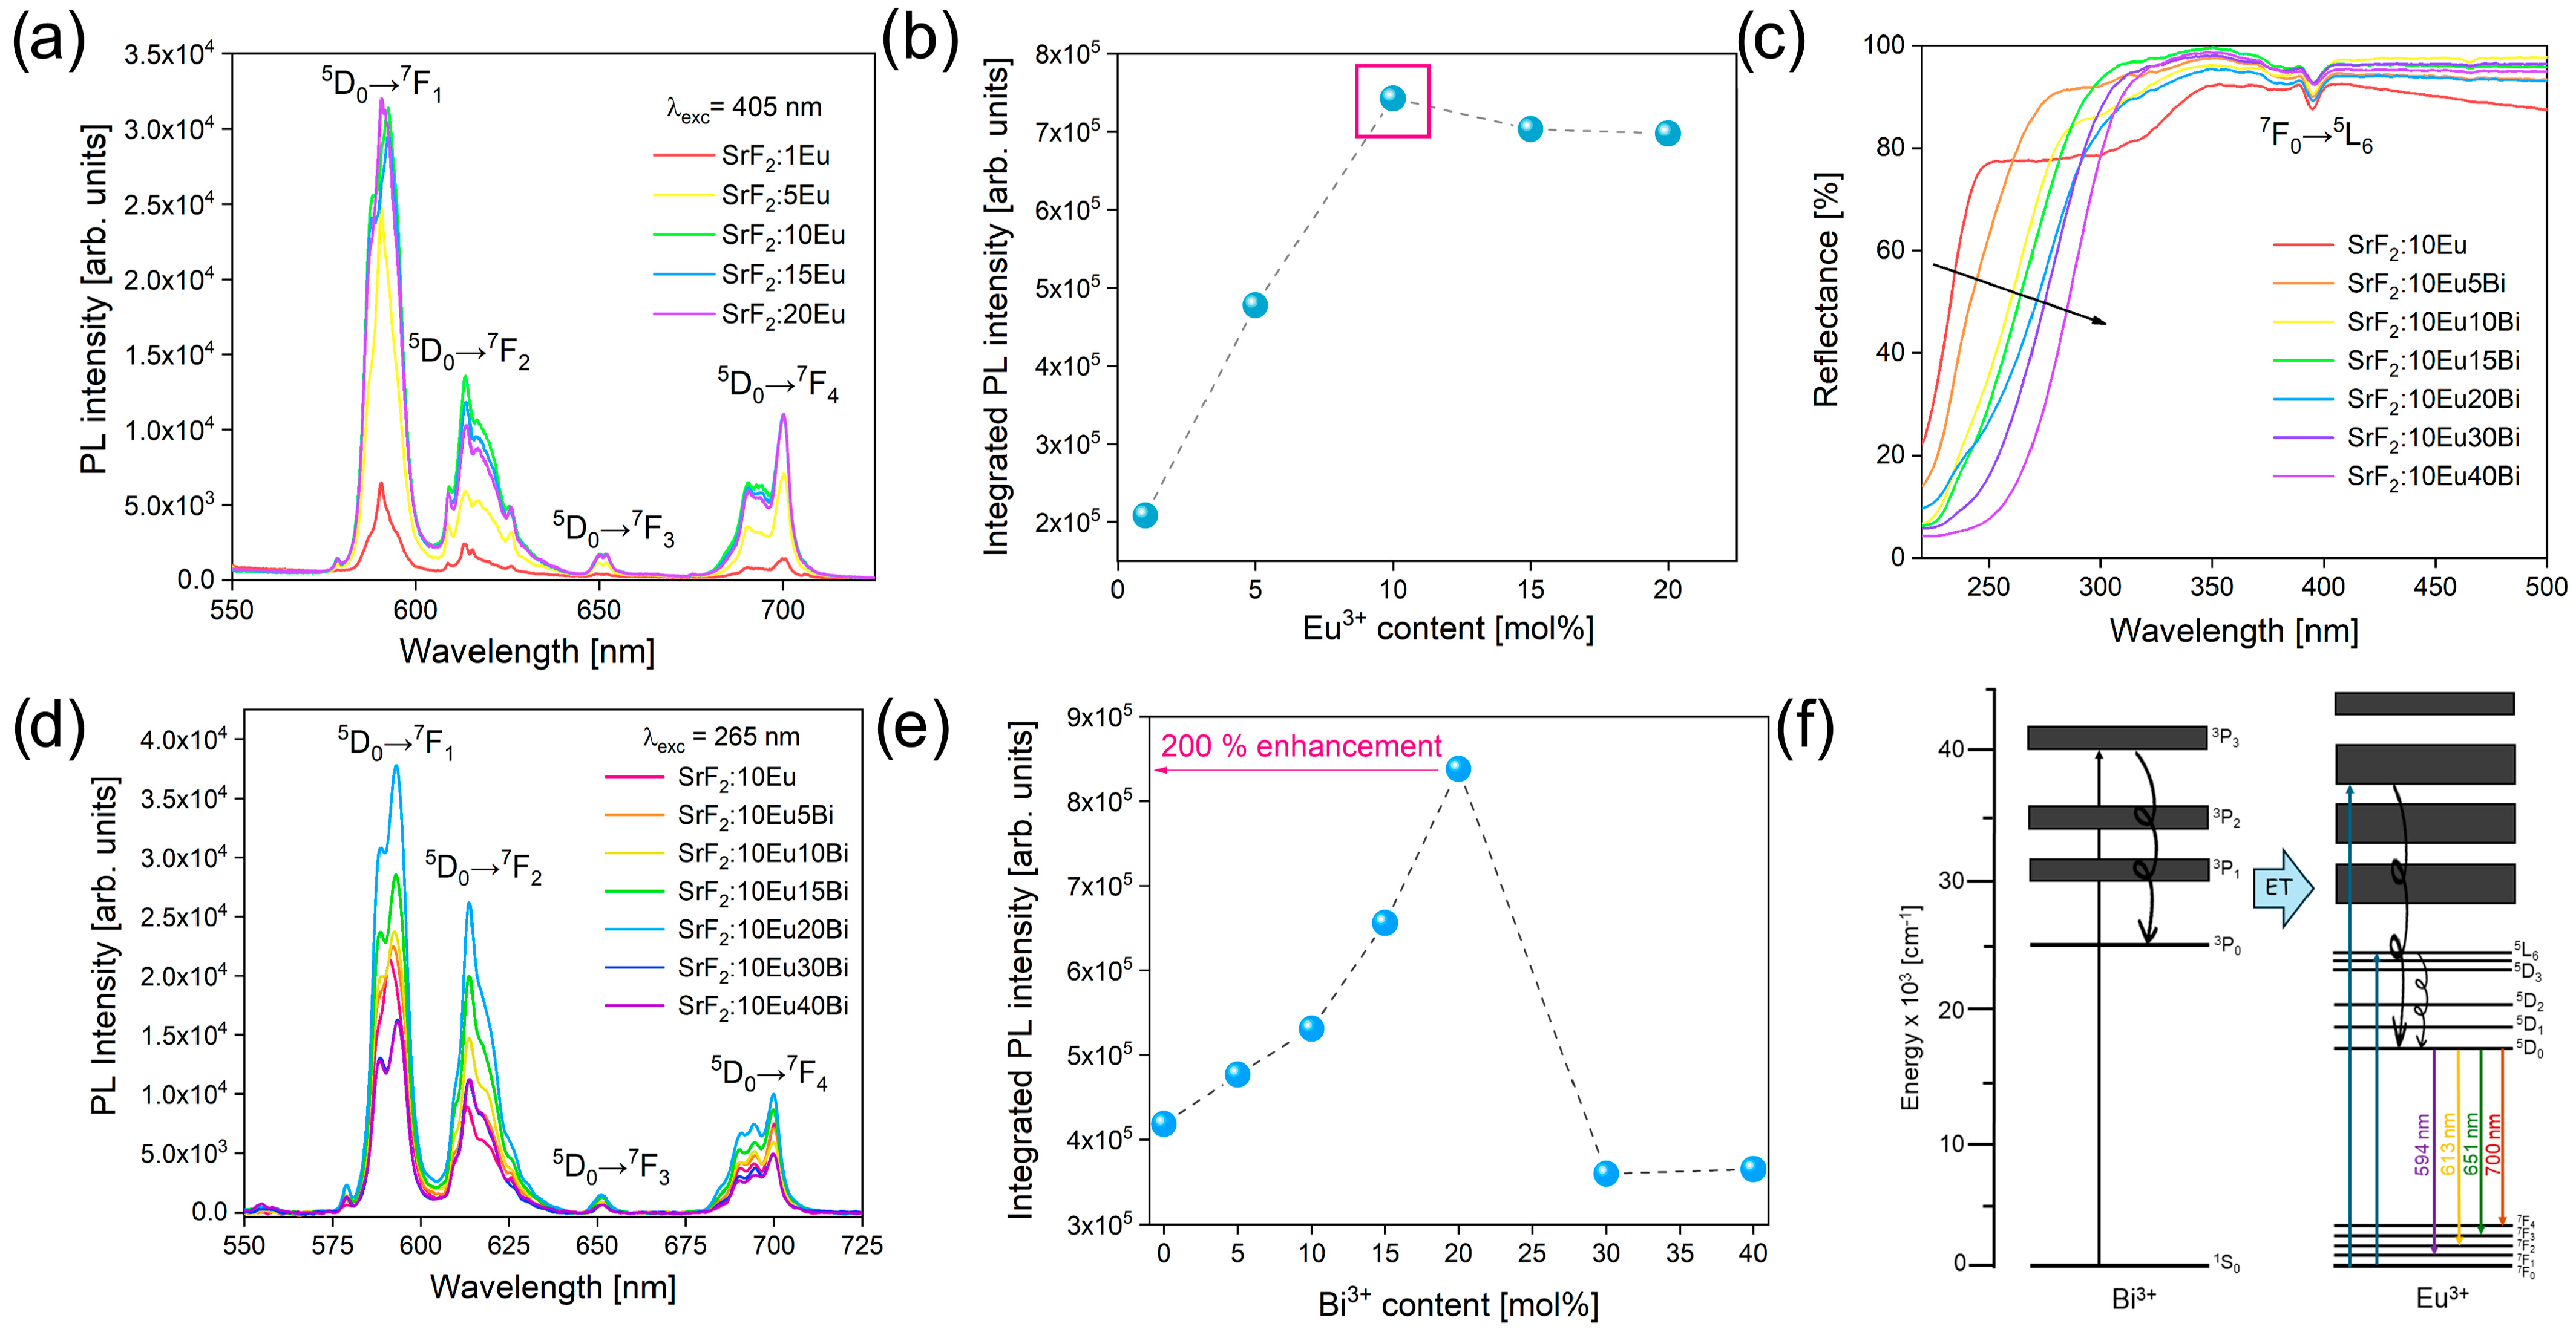
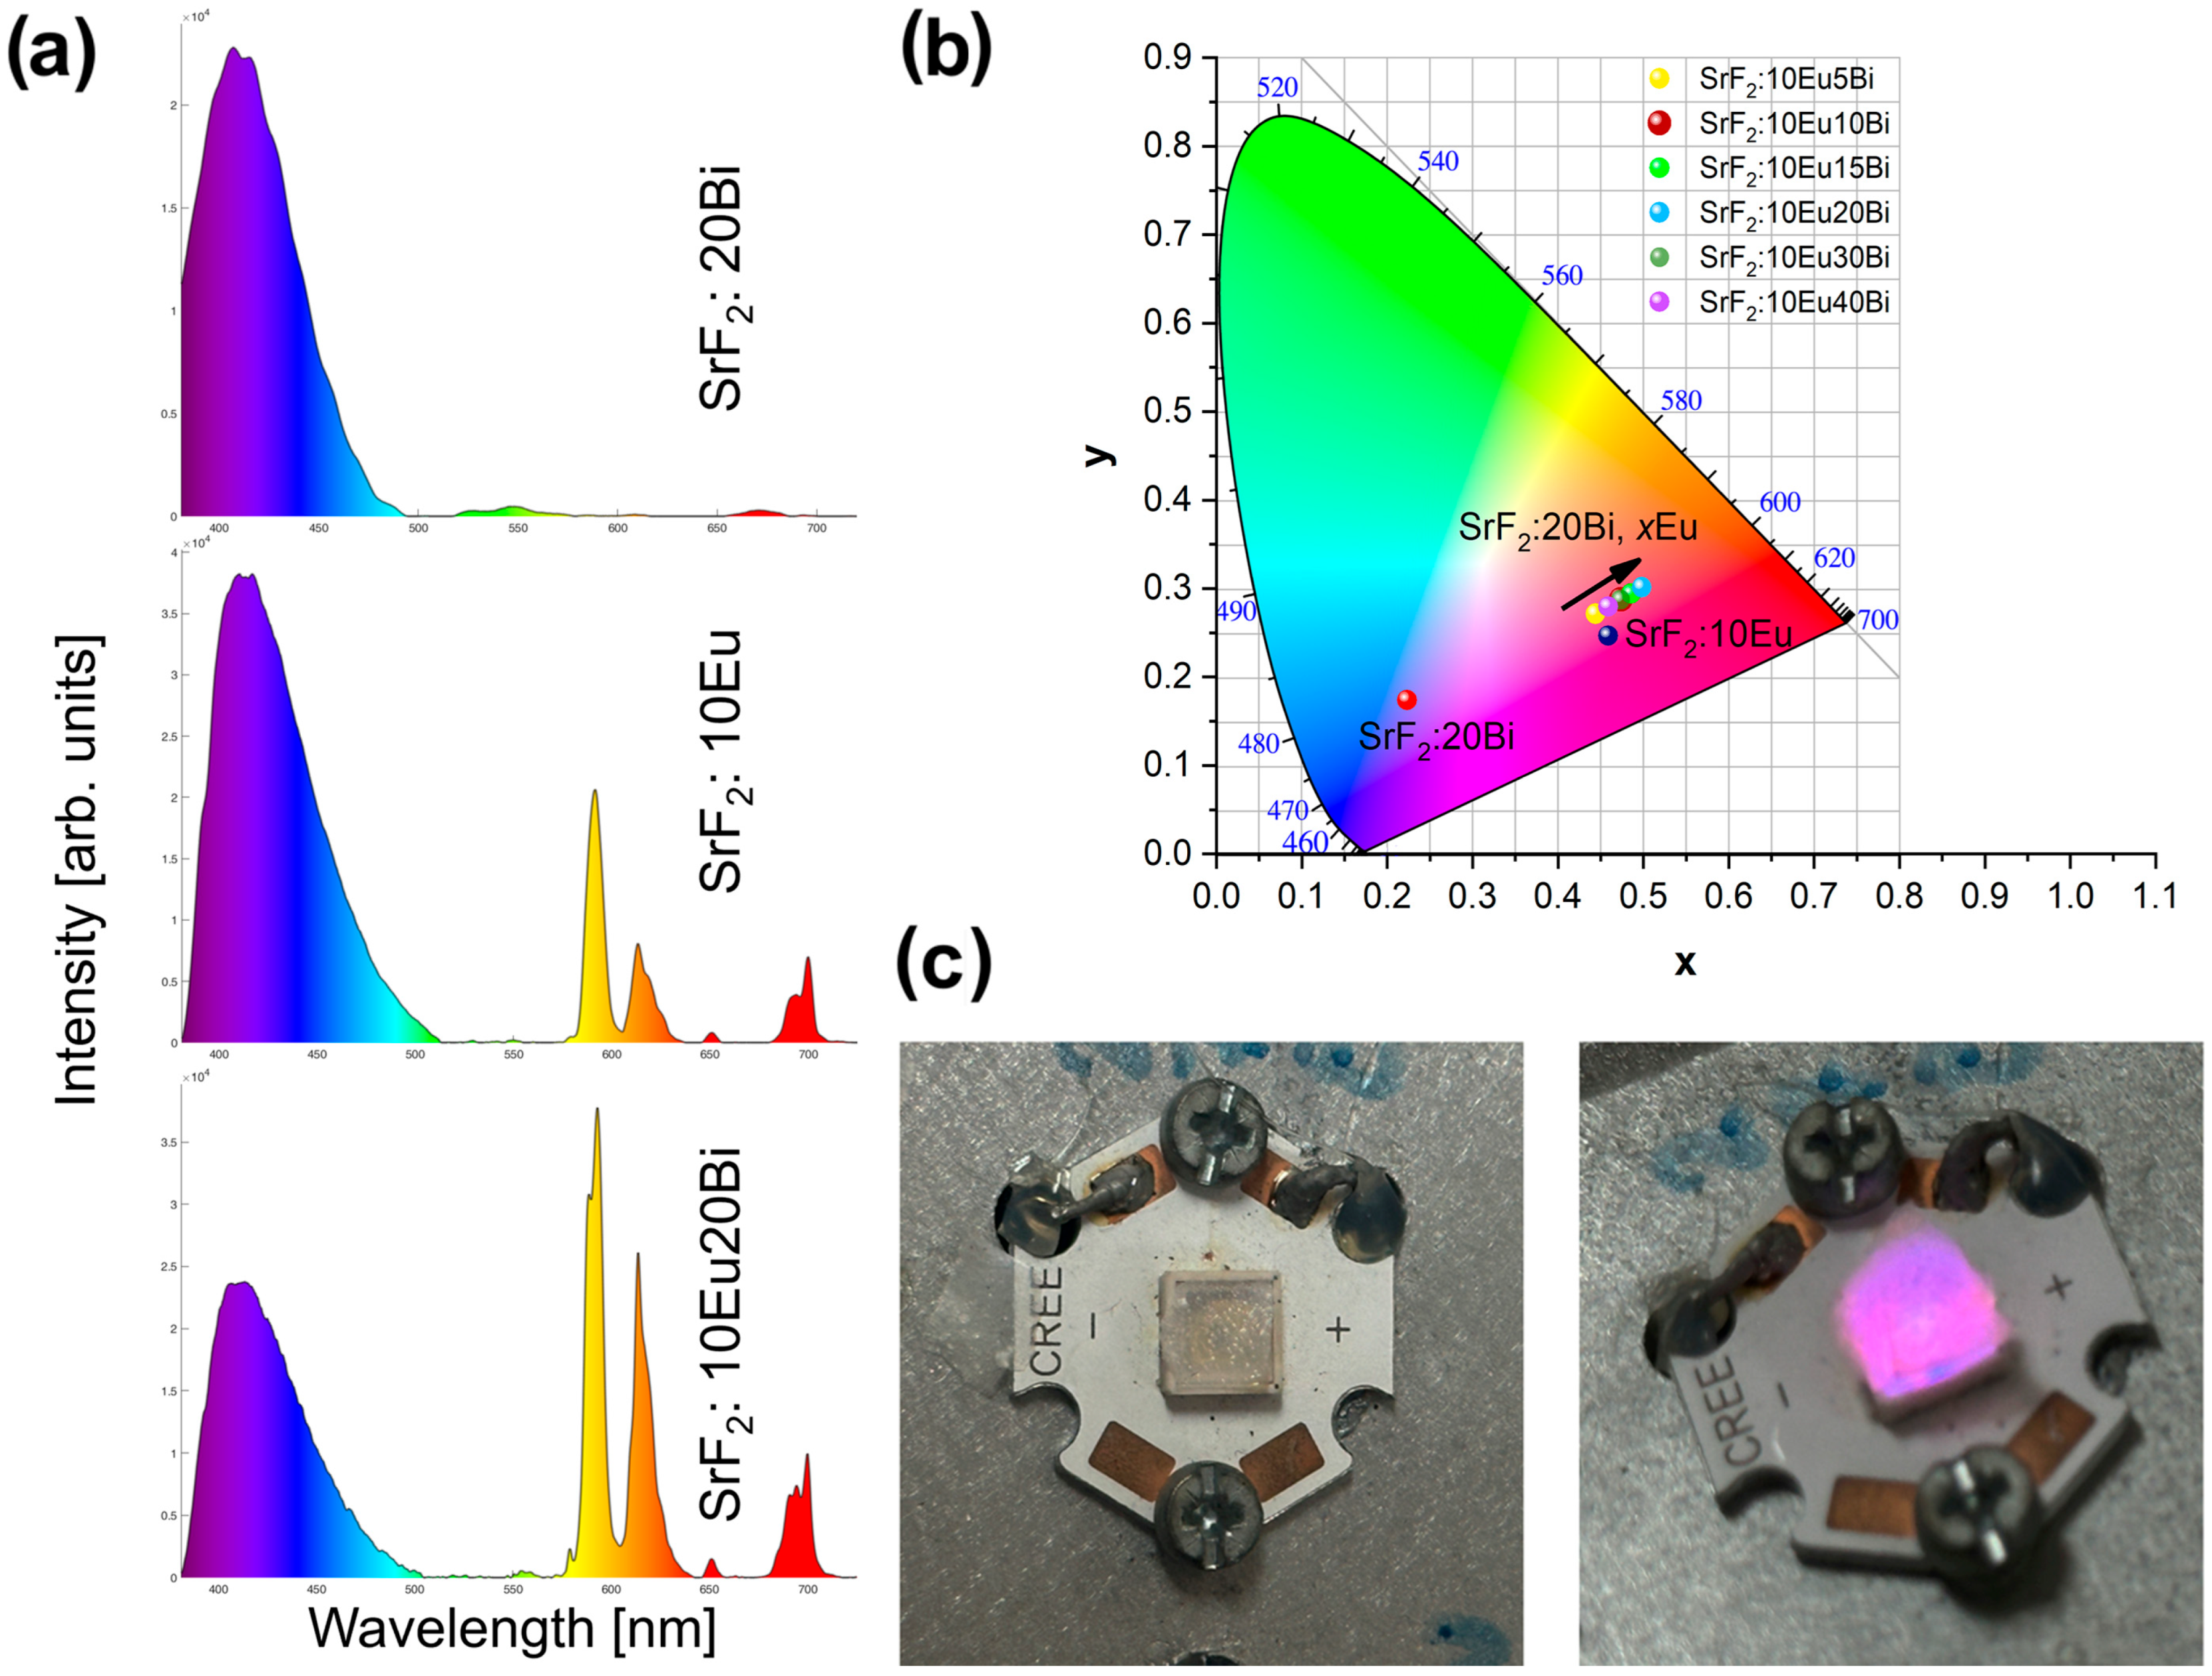
3.2. Photoluminescence Properties

The photoluminescence (PL) emission spectra of the Eu3+-doped set of samples, namely, SrF2:1Eu, SrF2:5Eu, SrF2:10Eu, SrF2:15Eu, and SrF2:20Eu, recorded at room temperature are displayed in Figure 3a (λexc = 405 nm). All emissions correspond to 4f4f transitions of Eu3+ located at ~593 nm (5D0  → 7F1), ~614 nm (5D0  →  7F2), ~651 nm (5D0  →  7F3), and ~700 nm (5D0  →  7F4). From the obtained emission spectra and integrated PL intensity (Figure 3b), it is evident that the sample SrF2:10Eu shows the highest emission intensity, and for this reason, it is chosen.
Figure 3c shows the diffuse reflectance spectra of Bi3+ co-doped SrF2:10Eu (Bi3+ mol% = 5, 10, 15, 20, 30, and 40) samples in the 220–500 nm wavelength range. The spectra show the absorption band at 394 nm corresponding to the Eu3+ transition from the ground state 7F0 to the upper level 5L6. In addition, it is observed that the UV band edge redshifts with an increase in Bi3+ content, indicating a strong absorption of Bi3+, which lies in the UV region [29,30,31].
Figure 3d shows PL emission spectra of Bi3+-co-doped samples in the 550–725 nm spectral region recorded at room temperature under 265 nm excitation. Europium ion emission intensity monotonically increases in the co-doped samples up to 20 mol% of Bi3+, while the further addition of Bi3+ decreases the emission intensity. The integrated emission intensity in the 550–725 nm wavelength range shows that the sample with the highest emission intensity—SrF2:10Eu20Bi—has twice as bright PL compared to the Bi-free SrF2:10Eu phosphor (Figure 3e). Energy transfer (ET) between bismuth (Bi3+) and europium (Eu3+) ions in inorganic hosts involves Bi3+ ions absorbing energy and transitioning from their ground state to excited states, followed by energy transfer to Eu3+ ions, exciting them from their ground state to higher state (Figure 3f). The efficiency of this process depends on factors such as the distance between ions, the spectral overlap between Bi3+ emission and Eu3+ absorption, and the properties of the host material. When excited, Eu3+ electrons radiatively return to the ground state and emit light at characteristic wavelengths, making this mechanism valuable for applications like LED displays, sensors, and solid-state lasers, and grasping these interactions enables tailoring of optical properties in materials development [32,33,34,35].
Figure 4a shows the room temperature PL emission spectra (λexc = 265 nm) of SrF2:20Bi, SrF2:10Eu, and SrF2:10Eu20Bi samples in the 380–725 nm spectral region, showing both blue- and red-light components in different ratios. Emission spectra of SrF2:10EuyBi (y = 5, 10, 15, 30, and 40 mol%) samples in the 380–725 nm spectral region are presented in Supplementary Materials (Figure S2). Since the intense blue emission is present in both single-doped samples, it can be concluded that it originates from the host material. On account of the energy transfer from Bi3+ to Eu3+ [24,25], it is feasible to attain modifiable emission from blue to red in the SrF2:10Eu, Bi co-doped samples system by modulating Bi3+ content (5, 10, 15, 20, 30, and 40 mol%). Figure 4b shows the CIE chromaticity diagram for SrF2:20Bi, SrF2:10Eu, and SrF2:10EuyBi samples (y = 5, 10, 15, 20, 30, and 40 mol%). The CIE chromaticity coordinates move from blue for the SrF2:20Bi sample to pinkish for SrF2:10Eu, and orange-red areas with the increase in Bi3+ content in SrF2:10EuyBi, showing the color tunability in the produced series (CIE values are listed in Table 3).
Balancing blue- and red-light components is vital for optimizing plant health and maximizing yield in controlled environments. The integrated PL area in the 380–500 nm (blue) and 575–725 nm (red) wavelength range was used to determine the blue- and red-light emission portion. Table 3 shows that single-doped Bi3+ and Eu3+ SrF2 exhibit strong blue emissions corresponding to the host material; however, increasing Bi3+ concentration enhances Eu3+ red emission in Eu3+/Bi3+-activated samples. The highest red/blue emission portion (40.8:59.2) was found for the sample SrF2:10Eu20Bi.
Lastly, to demonstrate the potential application of the obtained material in LED fabrication, the powder sample with the highest emission intensity, SrF2:10Eu20Bi, was mixed with a ceramic binder and placed on top of a 275 nm near-UV chip. Photographs of the fabricated LED device, presented in Figure 4c, display strong pinkish violet light when the power supply is on.

4. Conclusions

The ability to convert UV into blue and red light in inorganic phosphors for LEDs in agricultural applications is essential to boost the photosynthesis of plants in greenhouses. We report tunable blue- and red-emitting Bi3+-co-doped SrF2:Eu3+ nanoparticles prepared via solvothermal microwave-assisted method. Upon 265 nm excitation, photoluminescence spectra show blue emission at around 400 nm originating from the host and characteristic orange 5D0 → 7F1, red 5D0 → 7F2 and 5D0 → 7F3, and deep red 5D0 → 7F4 Eu3+ emissions from Eu3+ ions.
In practice, most grow lights combine both red and blue wavelengths to offer a balanced spectrum that supports various stages of plant growth. For the best results, an adjustment of the ratio of red to blue light based on the plant’s specific needs and growth stage is needed. For example, plants like tomatoes, peppers, and orchids benefit from red light during their flowering and fruiting stages. For plants like strawberries or cucumbers, red light will support better fruit production. Leafy greens like lettuce, spinach, and kale thrive under blue light as it promotes healthy leaf growth. Also, blue light helps young seedlings develop strong, healthy leaves and stems, giving them a solid start. Tunable red and blue light reported here in Bi3+-co-doped SrF2:Eu3+ nanoparticles could ensure that plants receive the benefits of both types of light throughout their lifecycle.

Supplementary Materials

The following supporting information can be downloaded at: https://www.mdpi.com/article/10.3390/nano14201617/s1, Table S1: Exact amounts of precursors used for the synthesis of 1 mmol of SrF2:20Bi sample. Table S2: Selected structural parameters of the SrF2:xEu (x = 1, 5, 10, 15, 20 mol%), SrF2:10EuyBi (y = 5, 10, 15, 20, 30, 40 mol%) and SrF2:20Bi nanopowders. Figure S1: XRD patterns of (a) SrF2:10Eu50Bi, and (b) SrF2:20Bi samples. The diffraction peaks are indexed according to the ICDD card No. 01-086-2418. Figure S2: The room temperature PL emission spectra of SrF2:10EuxBi (x = 5, 10, 15, 30 and 40 mol%) samples measured in 380–725 nm spectral range showing both blue and red-light components in different ratios (λexc = 265 nm).

Author Contributions

Conceptualization, J.P., M.D.D. and B.M.; Methodology, A.Ć. and Ž.A.; Software, S.K.; Formal analysis, J.P., A.Ć. and Z.R.; Investigation, J.P. and B.M.; Data curation, S.K.; Writing—original draft, J.P. and B.M.; Writing—review & editing, Ž.A., M.D.D. and B.M.; Visualization, S.K. and Z.R.; Supervision, M.D.D. and B.M. All authors have read and agreed to the published version of the manuscript.

Funding

This research was supported by the Science Fund of the Republic of Serbia, #GRANT No 10412, LED technology based on bismuth-sensitized Eu3+ luminescence for cost-effective indoor plant growth—LEDTECH-GROW (J. Periša, S. Kuzman, A. Ćirić, and B. Milićević). The authors would like to acknowledge funding of the Ministry of Science, Technological Development, and Innovation of the Republic of Serbia under contract 451-03-66/2024-03/200017.

Data Availability Statement

Data are contained within the article and Supplementary Materials.

Conflicts of Interest

The authors declare no conflict of interest.

References

  1. McCree, K.J. The Action Spectrum, Absorptance and Quantum Yield of Photosynthesis in Crop Plants. Agric. Meteorol. 1971, 9, 191–216. [Google Scholar] [CrossRef]
  2. Gao, Q.; Liao, Q.; Li, Q.; Yang, Q.; Wang, F.; Li, J. Effects of LED Red and Blue Light Component on Growth and Photosynthetic Characteristics of Coriander in Plant Factory. Horticulturae 2022, 8, 1165. [Google Scholar] [CrossRef]
  3. Sena, S.; Kumari, S.; Kumar, V.; Husen, A. Light Emitting Diode (LED) Lights for the Improvement of Plant Performance and Production: A comprehensive review. Curr. Res. Biotechnol. 2024, 7, 100184. [Google Scholar] [CrossRef]
  4. Fang, S.; Lang, T.; Cai, M.; Han, T. Light Keys Open Locks of Plant Photoresponses: A Review of Phosphors for Plant Cultivation LEDs. J. Alloys Compd. 2022, 902, 163825. [Google Scholar] [CrossRef]
  5. Zhen, S.; Bugbee, B. Far-red photons have equivalent efficiency to traditional photosynthetic photons: Implications for redefining photosynthetically active radiation. Plant Cell Environ. 2020, 43, 259–1272. [Google Scholar] [CrossRef]
  6. Chen, X.L.; Li, Y.L.; Wang, L.C.; Guo, W.Z. Red and Blue Wavelengths Affect the Morphology, Energy Use Efficiency and Nutritional Content of Lettuce (Lactuca sativa L.). Sci. Rep. 2021, 11, 8374. [Google Scholar] [CrossRef]
  7. Wollaeger, H.M.; Runkle, E.S. Growth of Impatiens, Petunia, Salvia, and Tomato Seedlings Under Blue, Green, and Red Light-Emitting Diodes. Hortic. Sci. 2014, 49, 734–740. [Google Scholar]
  8. Hogewoning, S.; Trouwborst, G.; Maljaars, H.; Poorter, H.; Van Ieperen, W.; Harbinson, J. Blue Light Dose-Responses of Leaf Photosynthesis, Morphology, and Chemical Composition of Cucumis sativus Grown Under Different Combinations of Red and Blue Light. J. Exp. Bot. 2010, 61, 3107–3117. [Google Scholar] [CrossRef]
  9. Trivellini, A.; Toscano, S.; Romano, D.; Ferrante, A. The Role of Blue and Red Light in the Orchestration of Secondary Metabolites, Nutrient Transport and Plant Quality. Plants 2023, 12, 2026. [Google Scholar] [CrossRef]
  10. Islam, M.A.; Kuwar, G.; Clarke, J.L.; Blystad, D.R.; Gislerød, H.R.; Olsen, J.E.; Torre, S. Artificial Light from Light Emitting Diodes (LEDs) with a High Portion of Blue Light Results in Shorter Poinsettias Compared to High Pressure Sodium (HPS) Lamps. Sci. Hortic. 2012, 147, 136–143. [Google Scholar] [CrossRef]
  11. Owen, W.G.; Lopez, R.G. Comparison of Sole-Source and Supplemental Lighting on Callus Formation and Initial Rhizogenesis of Gaura and Salvia Cuttings. Hortic. Sci. 2019, 54, 684–691. [Google Scholar] [CrossRef]
  12. Yang, J.; Li, C.; Kong, D.; Guo, F.; Wei, H. Light-Mediated Signaling and Metabolic Changes Coordinate Stomatal Opening and Closure. Front. Plant Sci. 2020, 11, 601478. [Google Scholar] [CrossRef]
  13. Serna-Gallén, P.; Beltrán-Mir, H.; Cordoncillo, E. Practical Guidance for Easily interpreting the Emission and Physicochemical Parameters of Eu3+ in Solid-State Hosts. Ceram. Int. 2023, 49, 41078–41089. [Google Scholar] [CrossRef]
  14. Dang, P.; Liang, S.; Li, G.; Wei, Y.; Cheng, Z.; Lian, H.; Shang, M.; Hod, S.J.; Lin, J. Controllable Optical Tuning and Improvement in Li+,Eu3+-codoped BaSc2O4:Bi3+ Based on Energy Transfer and Charge Compensation. J. Mater. Chem. C 2018, 6, 6449–6459. [Google Scholar] [CrossRef]
  15. Liu, M.; Yang, C.; Liu, W.; Zhou, X.; Liu, S.; You, Q.; Jiang, X. Synthesis of Bi3+ and Eu3+ Co-doped Na4CaSi3O9 Blue-Red Light Tunable Emission Phosphors for Inducing Plant Growth. Ceram. Int. 2024, 50, 9058–9069. [Google Scholar] [CrossRef]
  16. Wang, H.; Chen, X.Y.; Teng, L.M.; Xu, D.K.; Chen, W.P.; Wei, R.F.; Hu, F.F.; Sun, X.Y.; Guo, H. Adjustable Emission and Energy Transfer Process in BaGd2O4:Bi3+,Eu3+ Phosphors. J. Lumin. 2019, 206, 185–191. [Google Scholar] [CrossRef]
  17. Guo, Y.; Park, S.H.; Choi, B.C.; Jeong, J.H.; Kim, J.H. Dual-Mode Manipulating Multicenter Photoluminescence in a Single-Phased Ba9Lu2Si6O24:Bi3+, Eu3+ Phosphor to Realize White Light/Tunable Emissions. Sci. Rep. 2017, 7, 15884. [Google Scholar] [CrossRef]
  18. Kong, H.; Jia, G.; Li, H.; Meng, Z.; Zhang, N.; Zhang, C. Deep Blue, Cyan, Orange-Red, and White Multicolor Emissions Generated by Bi3+/Eu3+ Activated KBaYSi2O7 Luminescent Materials for White Light-Emitting Diodes. Ceram. Int. 2023, 49, 15320–15332. [Google Scholar] [CrossRef]
  19. Sun, L.; Devakumar, B.; Liang, J.; Wang, S.; Sun, Q.; Huang, X. Novel High-Efficiency Violet-Red Dual-Emitting Lu2GeO5: Bi3+, Eu3+ Phosphors for Indoor Plant Growth Lighting. J. Lumin. 2019, 214, 116544. [Google Scholar] [CrossRef]
  20. Du, C.; Gao, D.; Hou, X.; Zhang, X.; Pang, Q.; Yun, S. Deep trap engineering in Gd3GaO6:Bi3+ persistent phosphors through co-doping lanthanide ions. J. Mater. Chem. C 2024, 12, 9284–9292. [Google Scholar] [CrossRef]
  21. Krishnaiah, K.V.; Venkatalakshmamma, P.; Kumar, K.U.; Haritha, P.; Lavin, V.; Martin, I.R.; Ravi, N.; Reddy, H.S.K.; Venkatramu, V.; Nallabala, N.K.R.; et al. Structure, Morphology, Photonconversion and Energy Tansfer Characteristics of Er3+/Yb3+:BaYF5 Nanocrystals Synthesized by Hydrothermal Method for Photovoltaics. Ceramamics Int. 2023, 49, 26879–26889. [Google Scholar] [CrossRef]
  22. Cortelletti, P.; Pedroni, M.; Boschi, F.; Pin, S.; Ghigna, P.; Canton, P.; Vetrone, F.; Speghini, A. Luminescence of Eu3+ Activated CaF2 and SrF2 Nanoparticles: Effect of the Particle Size and Codoping with Alkaline Ions. Cryst. Growth Des. 2018, 18, 686–694. [Google Scholar] [CrossRef]
  23. Đačanin Far, L.J.; Zeković, I.; Periša, J.; Ristić, Z.; Alodhayb, A.; Dramićanin, M.D.; Antić, Ž. Luminescent Eu3+ Doped SrF2 Nanoparticles for Fluorescent Detection of Fertilizers. Opt. Mater. 2023, 142, 114061. [Google Scholar] [CrossRef]
  24. Lorbeer, C.; Behrends, F.; Cybinska, J.; Eckert, H.; Mudring, A.-V. Charge Compensation in RE3+ (RE = Eu, Gd) and M+ (M = Li, Na, K) Do-doped Alkaline Earth Nanofluorides Obtained by Microwave Reaction with Reactive Ionic Liquids Leading to Improved Optical Properties. J. Mater. Chem. C 2014, 2, 9439–9450. [Google Scholar] [CrossRef]
  25. Mancebo, D.G.; Becerro, A.I.; Corral, A.; Moros, M.; Balcerzyk, M.; de la Fuente, J.M.; Ocaña, M. Enhancing Luminescence and X-ray Absorption Capacity of Eu3+:LaF3 Nanoparticles by Bi3+ Codoping. ACS Omega 2019, 4, 765–774. [Google Scholar] [CrossRef]
  26. Luo, R.; Li, Q.; Wang, J.; Ning, Z.; Zhao, Y.; Liu, M.; Lai, X.; Zhong, C.; Bi, J.; Gao, D. Bi3+ Ion Doping: An Effective Strategy to Significantly Enhance Luminescence Performances of NaGdF4: Eu3+ Red-emitting Nanocrystals. J. Alloys Compd. 2020, 828, 154375. [Google Scholar] [CrossRef]
  27. Gao, D.; Zhang, X.; Zhang, J. The effects of structural characterization on the luminescence of Eu3+-doped fluoride nano/microcrystals. CrystEngComm 2014, 16, 11115–11121. [Google Scholar] [CrossRef]
  28. Forsyth, J.B.; Wilson, C.C.; Sabine, T.M. Time-of-Flight Neutron Diffraction Study of Anharmonic Thermal Vibrations in SrF2, at the Spallation Neutron Source ISIS. Acta Crystallogr. Sect. A Found. Adv. 1989, 45, 244. [Google Scholar] [CrossRef]
  29. Chen, L.; Jiang, Y.; Zhang, G.-B.; Wu, C.; Yang, G.-T.; Wang, C.; Li, G.-H. Concentration and Temperature Dependences of YBO3:Bi3+ Luminescence Under Vacuum Ultraviolet Excitation. Chin. Phys. Lett. 2008, 25, 1884–1887. [Google Scholar] [CrossRef]
  30. Sontakke, A.D.; Tarafder, A.; Biswas, K.; Annapurna, K. Sensitized Red Luminescence from Bi3+ Do-Doped Eu3+: ZnO–B2O3 Glasses. Phys. B Condens. Matter 2009, 404, 3525–3529. [Google Scholar] [CrossRef]
  31. Weber, M.J.; Monchamp, R.R. Luminescence of Bi4Ge3O12: Spectral and Decay Properties. J. Appl. Phys. 1973, 44, 5495–5499. [Google Scholar] [CrossRef]
  32. Hull, R.; Parisi, J.; Osgood, R.M.; Warlimont, H.; Liu, G.; Jacquier, B. (Eds.) Spectroscopic Properties of Rare Earths in Optical Materials; Springer: Berlin/Heidelberg, Germany, 2005. [Google Scholar] [CrossRef]
  33. Bourcet, J.C.; Moine, B.; Boulon, G.; Reisfeld, R.; Kalisky, Y. Energy Transfer between Bi3+ and Eu3+ in Germanite Glasses using Time Resolved Spectroscopy. Chem. Phys. Lett. 1979, 61, 23–24. [Google Scholar] [CrossRef]
  34. Cao, R.; Liu, N.; Zhong, Q.; Tu, Y.; Xu, Y.; Zhang, H.; Luo, W.; Chen, T. Luminescence Properties and Tunable Emission of Ca3MgSi2O8:Eu3+, Bi3+ Phosphor with Bi3+ → Eu3+ Energy Transfer. J. Mater. Sci. Mater. Electron. 2021, 32, 26620–26630. [Google Scholar] [CrossRef]
  35. Giraldo, O.; Fei, M.; Wei, R.; Liming, T.; Zheng, Z.; Guo, H. Energy Transfer and White Luminescence in Bi3+/Eu3+ Co-Doped Oxide Glasses. J. Lumin. 2020, 219, 116918. [Google Scholar] [CrossRef]
Figure 1. XRD patterns of (a) SrF2:xEu (x = 1, 5, 10, 15, 20 mol%) and (b) SrF2:10EuyBi (y = 5, 10, 15, 20, 30, 40 mol%) samples presented with the ICDD card No. 01-086-2418.
Nanomaterials 14 01617 g001
Figure 2. (a) TEM images of the representative SrF2:10Eu20Bi sample and (b) particle size distribution histogram.
Nanomaterials 14 01617 g002
Figure 3. (a) Room temperature PL emission spectra under λexc = 405 nm of samples doped with only Eu3+ ions, (b) integrated intensity of PL spectra presented in (a), (c) diffuse reflectance spectra of samples doped with 10 mol% of Eu3+ ions and co-doped with Bi3+ ions, (d) room temperature PL emission spectra under λexc = 265 nm of co-doped samples, (e) integrated intensity of PL spectra presented in (d), and (f) schematic representation of the possible ET between Bi3+ and Eu3+ ions.
Nanomaterials 14 01617 g003
Figure 4. (a) The room temperature PL emission spectra of SrF2:20Bi, SrF2:10Eu, and SrF2:10Eu20Bi samples showing both blue- and red-light components in different ratios (λexc = 265 nm), (b) CIE chromaticity coordinates, and (c) a fabricated LED device displaying pinkish violet light.
Nanomaterials 14 01617 g004
Table 1. Precursors for synthesis of 1 mmol of SrF2: x mol% Eu3+ (x = 1, 5, 10, 15, 20) samples.
SampleAbbreviated
Name
Sr(NO3)2
(g)
Eu(NO3)3·6H2O
(g)
NaF
(g)
EG
(ml)
Sr0.99Eu0.01F2SrF2:1Eu0.20950.004460.084015
Sr0.95Eu0.05F2SrF2:5Eu0.20100.0223
Sr0.9Eu0.1F2SrF2:10Eu0.19050.0446
Sr0.85Eu0.15F2SrF2:15Eu0.17990.0669
Sr0.8Eu0.2F2SrF2:20Eu0.16930.0892
Table 2. Precursors for synthesis of 1 mmol of SrF2: 10 mol% Eu3+, y mol% Bi3+ (y = 5, 10, 15, 20, 30, 40, 50) samples.
SampleAbbreviated NameSr(NO3)2
(g)
Eu(NO3)3·6H2O
(g)
Bi(NO3)3·5H2O
(g)
NaF
(g)
EG
(ml)
Sr0.4Eu0.1Bi0.5F2SrF2:10Eu5Bi0.17990.04460.02430.084015
Sr0.8Eu0.1Bi0.1F2SrF2:10Eu10Bi0.16930.0485
Sr0.75Eu0.1Bi0.15F2SrF2:10Eu15Bi0.15870.0725
Sr0.7Eu0.1Bi0.2F2SrF2:10Eu20Bi0.14810.0970
Sr0.6Eu0.1Bi0.3F2SrF2:10Eu30Bi0.12690.1455
Sr0.5Eu0.1Bi0.4F2SrF2:10Eu40Bi0.10580.1940
Sr0.4Eu0.1Bi0.5F2SrF2:10Eu50Bi0.08460.2425
Table 3. Blue and red emission portions for the SrF2:20Bi, SrF2:10Eu, and SrF2:10EuyBi (x = 5, 10, 15, 20, 30, and 40 mol%) samples.
Sample% Blue% RedCIE (x, y) Coordinates
SrF2:20Bi100.00.0(0.223, 0.174)
SrF2:10Eu85.015.0(0.399, 0.247)
SrF2:10Eu5Bi76.523.5(0.444, 0.271)
SrF2:10Eu10Bi71.628.4(0.474, 0.288)
SrF2:10Eu15Bi61.938.1(0.486, 0.294)
SrF2:10Eu20Bi59.240.8(0.498, 0.301)
SrF2:10Eu30Bi66.733.3(0.473, 0.287)
SrF2:10Eu40Bi73.126.9(0.459, 0.279)
Disclaimer/Publisher’s Note: The statements, opinions and data contained in all publications are solely those of the individual author(s) and contributor(s) and not of MDPI and/or the editor(s). MDPI and/or the editor(s) disclaim responsibility for any injury to people or property resulting from any ideas, methods, instructions or products referred to in the content.

