Article

Prednisolone Nanoprecipitation with Dean Instability Microfluidics Mixer

1
Department of Physics, The Hong Kong University of Science and Technology, Clear Water Bay, Hong Kong 999077, China
2
Thrust of Advanced Materials, The Hong Kong University of Science and Technology (Guangzhou), Guangzhou 510630, China
3
HKUST Shenzhen-Hong Kong Collaborative Innovation Research Institute, Futian, Shenzhen 518000, China
*
Author to whom correspondence should be addressed.
Nanomaterials 2024, 14(8), 652; https://doi.org/10.3390/nano14080652
Submission received: 16 March 2024 / Revised: 5 April 2024 / Accepted: 8 April 2024 / Published: 9 April 2024
(This article belongs to the Special Issue Controlled Synthesis and Catalytic Applications of Nanoparticles)

Abstract

:
Dean flow and Dean instability play an important role in inertial microfluidics, with a wide application in mixing and sorting. However, most studies are limited to Dean flow in the microscale. This work first reports the application of Dean instability on organic nanoparticles synthesis at D e up to 198. The channel geometry (the tortuous channel) is optimized by simulation, in which the mixing efficiency is considered. With the optimized design, prednisolone nanoparticles are synthesized, and the size of the most abundant prednisolone nanoparticles is down to 100 nm with an increase in the R e and D e and smallest size down to 46 nm. This work serves as an ice-breaker to the real application of Dean instability by demonstrating its ability in mixing and nanomaterials like nanoparticle synthesis.

1. Introduction

Nanoparticle synthesis has been widely studied and applied in various fields in recent years [1,2,3]. Among all the synthetic methods, microfluidics outperforms the others by providing a microscale mixing [4,5]. There are two types of micro-mixing: active mixing, which requires external energy input, and passive mixing, which completely relies on the hydrodynamics in the microchannel. In general, passive mixing provides more simplicity in system [6,7,8] as active mixing usually requires integration with power sources such as an electromagnetic field [9], acoustic field [10] or thermal actuation [11]. Simplicity in the system does not mean simplicity in the channel, as there is no external power source, and passive mixing heavily depends on the design of the channel for the best mixing efficiency [12,13,14]. However, such complexity of channel geometry can be reduced by increasing the Reynolds number ( R e ):
R e = ρ U H μ
where ρ, U, H and μ are the fluid density, average fluid velocity, channel dimension and dynamic viscosity.
An emerging sub-field, inertial microfluidics, has been a promising candidate for sorting [15,16] and passive mixing in the past two decades [17,18]. In inertial microfluidics, the R e is outside the Stokes’ flow regime and lies in an intermediate range of R e , meaning the inertia term in the Navier–Stokes equations is no longer negligible. There are mainly two types of channel geometries, straight and curved channels in inertial microfluidics [19]. Dean flow occurs in curved channels due to the paraboloid nature of the velocity profile, and results in the generation of two counter-rotating vortexes (Dean vortexes) in the plane perpendicular to the main flow direction. Such vortexes promote mixing and the strength can be quantified by the Dean number ( D e ):
D e = R e H 2 R
where R is the radius of curvature. There are numerical [20,21] and experimental reports [22,23] on using Dean flow for mixing purposes. Regarding nanoparticle synthesis, X. Yu et al. [24] performed ZIP-8 nanoparticles synthesis using the Dean flow and resulted in nanoparticles from 40 nm to 700 nm. M. Thiele et al. [25] fabricated the gold nanocubes with the edge length down to 53 nm by Dean flow in the zigzag channel.
According to Dean [26] and Reid [27], Dean instability results as the D e exceeds a critical value, resulting in the generation of an extra pair of vortexes at the outer wall due to the increase in radial pressure gradient. The four vortexes condition further enhances mixing. There are only a few numerical [28] and experimental studies on the microscale. Nivedita et al. [29] first visualized the secondary flow pattern of low aspect ratio channels in different aspect ratios but only demonstrated the application in particle sorting. Y.C. Wong et al. [30] illustrated the generation of Dean instability in a high aspect ratio channel, proposed a tortuous design, and demonstrated the ability to mix with Dean instability.
This paper presents one of the first few applications of Dean instability in microfluidics mixing. It is an experimental study on the synthesis of nanoparticles using Dean instability. It is a continuing work on a previous study, optimizing the novel tortuous channel design and carrying on to applications. The tortuous channel design was designed specifically for the creation of Dean instability at a lower R e environment compared to other typical channel patterns due to the perturbation of smaller radii [30]. The selection of prednisolone as the application for this study is based on its practical use as a glucocorticoid drug. Previous research has also examined this drug in microchannels [31]. The lack of chemical reaction involved in its precipitation enables a clear focus on the alteration of R e and D e in this study.

2. Materials and Methods

2.1. Fabrication

The devices were fabricated in two phases (image of the process flow shown in Supplementary Materials). In the first phases, the silicon mould for polydimethylsiloxane (PDMS) was fabricated at The Hong Kong University of Science and Technology Nanosystem Fabrication Facility (HKUST NFF) using standard lithography and deep reactive ion etching (DRIE). The positive photoresist (HPR 506) was spun, exposed in Karl Suss MA6 (Munich, Germany) and developed by the FHD5 developer. The etching depth across the silicon wafer was 90 μm ± 2 μm measured by Tencor P-10 Surface Profiler (Hwaseong-si, Republic of Korea). The second stage was PDMS device fabrication. Here, 10:1 PDMS of 50 g was poured onto the mould and cured in the oven at 80 °C (24 h). The glass slide (SLItech, Lagos, Nigeria, microscope slides, MS-13) was bonded to the PDMS after 3 min of plasma treatment in the plasma cleaner (Harrick, Pleasantville, NY, USA, PDC-001-HP) followed by baking at 80 °C (40 min). The connecting tube is Tygon Microbore Autoanalysis Tubing, Anyang, Republic of Korea.

2.2. Sample Preparation

The prednisolone was purchased from Sigma-Aldrich (St. Louis, MO, USA) and the absolute ethanol was purchased from Scharlau (Barcelona, Spain). The saturated prednisolone solution was prepared by putting the excess amount of prednisolone into absolute ethanol. The addition of prednisolone was stopped only if oversaturation was observed after shaking of 10 mins (Fisher Vortex Genie 2, Hampton, NH, USA). The oversaturated solution was then centrifuged at 14,000 rpm for 5 min (Sigma 3-18K, Tokyo, Japan) and the saturated prednisolone was removed and ready for use. The prednisolone solution was later used to mix with deionized (DI) water in the microchannel.

2.3. Experimental Setup and Data Analysis

The channel geometry is shown in Figure 1, it consists of three radii of curvatures (270 μm, 50 μm and 200 μm) in a single unit with 60 μm in width and 90 μm in height. This geometry was chosen after optimization by simulation. There are two channel lengths: L (3227 μm) and 2L (6454 μm). The infusion was carried out by PHD 2000 Infusion (Harvard Apparatus, Cambridge, MA, USA), and the total flow rates (Q1 + Q2) were 175 μL/min ( R e = 39), 250 μL/min ( R e = 56), 525 μL/min ( R e = 117), 700 μL/min ( R e = 156), 875 μL/min ( R e = 194) and 1050 μL/min ( R e = 233) while the ratio of Q2:Q1 is always 1:2.5 to maintain the solvent to DI water ratio. The experiment was carried out under the light microscope (Olympus IX71, Tokyo, Japan) to ensure no blockages of precipitate occurred during the solution collection, an image of the setup is attached in Supplementary Materials. The collected solution was then washed and dried on diced silicon wafers on the hotplate at 40 °C until all liquid evaporated. The particles were then observed under the scanning electron microscope (SEM) (JSM-7100F, Tokyo, Japan). The SEM images were analyzed in ImageJ 1.53 t to obtain the size distribution, and the graphs were plotted in Origin 2018. And the most abundant particles’ sizes and percentage in amount are discussed.

2.4. Simulation

The simulation was performed with COMSOL Multiphysics 6.0, and the pattern was imported from AutoCAD 2021. Laminar flow and the transport of diluted species modules were used and water was considered in the simulation. The size of meshing elements was chosen to range from 1.64 μm to 8.71 μm after we evaluated the convergence of data, and the results of the meshing convergence test are attached in Supplementary Materials. The Navier–Stokes equation and the continuity equation for incompressible Newtonian fluid solved in the laminar flow module were
ρ D u D t = p + μ 2 u + F
p t + · ( ρ u ) = 0
where u is the velocity field, p is the pressure and F is any external force. The boundary condition of the walls was no slip and the pressure at the outlet was set to be zero.
The velocity field obtained from the laminar flow module was then coupled with the transport of the diluted species module. The initial concentration in the channel was set to be 0 mol/m3 and two species of 1 mol/m3 and 0 mol/m3 were injected from the inlets for mixing. The convection–diffusion equation responsible is given as
c t = D 2 c u · c
where c is the concentration.
We obtained the velocity profiles and concentration profiles for analysis. The simulation mainly served as an optimization of channel parameters purposes with assistance in flow visualization. The concentration graphs were analyzed and compared by the Mixing Index (MI):
M I = 1 1 N Σ i N ( I i I ¯ ) 2 / I ¯ 1 N Σ i N ( I o i I o ¯ ) 2 / I o ¯
where I i and I ¯ are the local concentration magnitude and the average concentration at the cross-section of the outlet, I o i and I o ¯ are the local concentration magnitude and the average concentration at the cross-section of the inlet, and N is the amount of data.

3. Results and Discussion

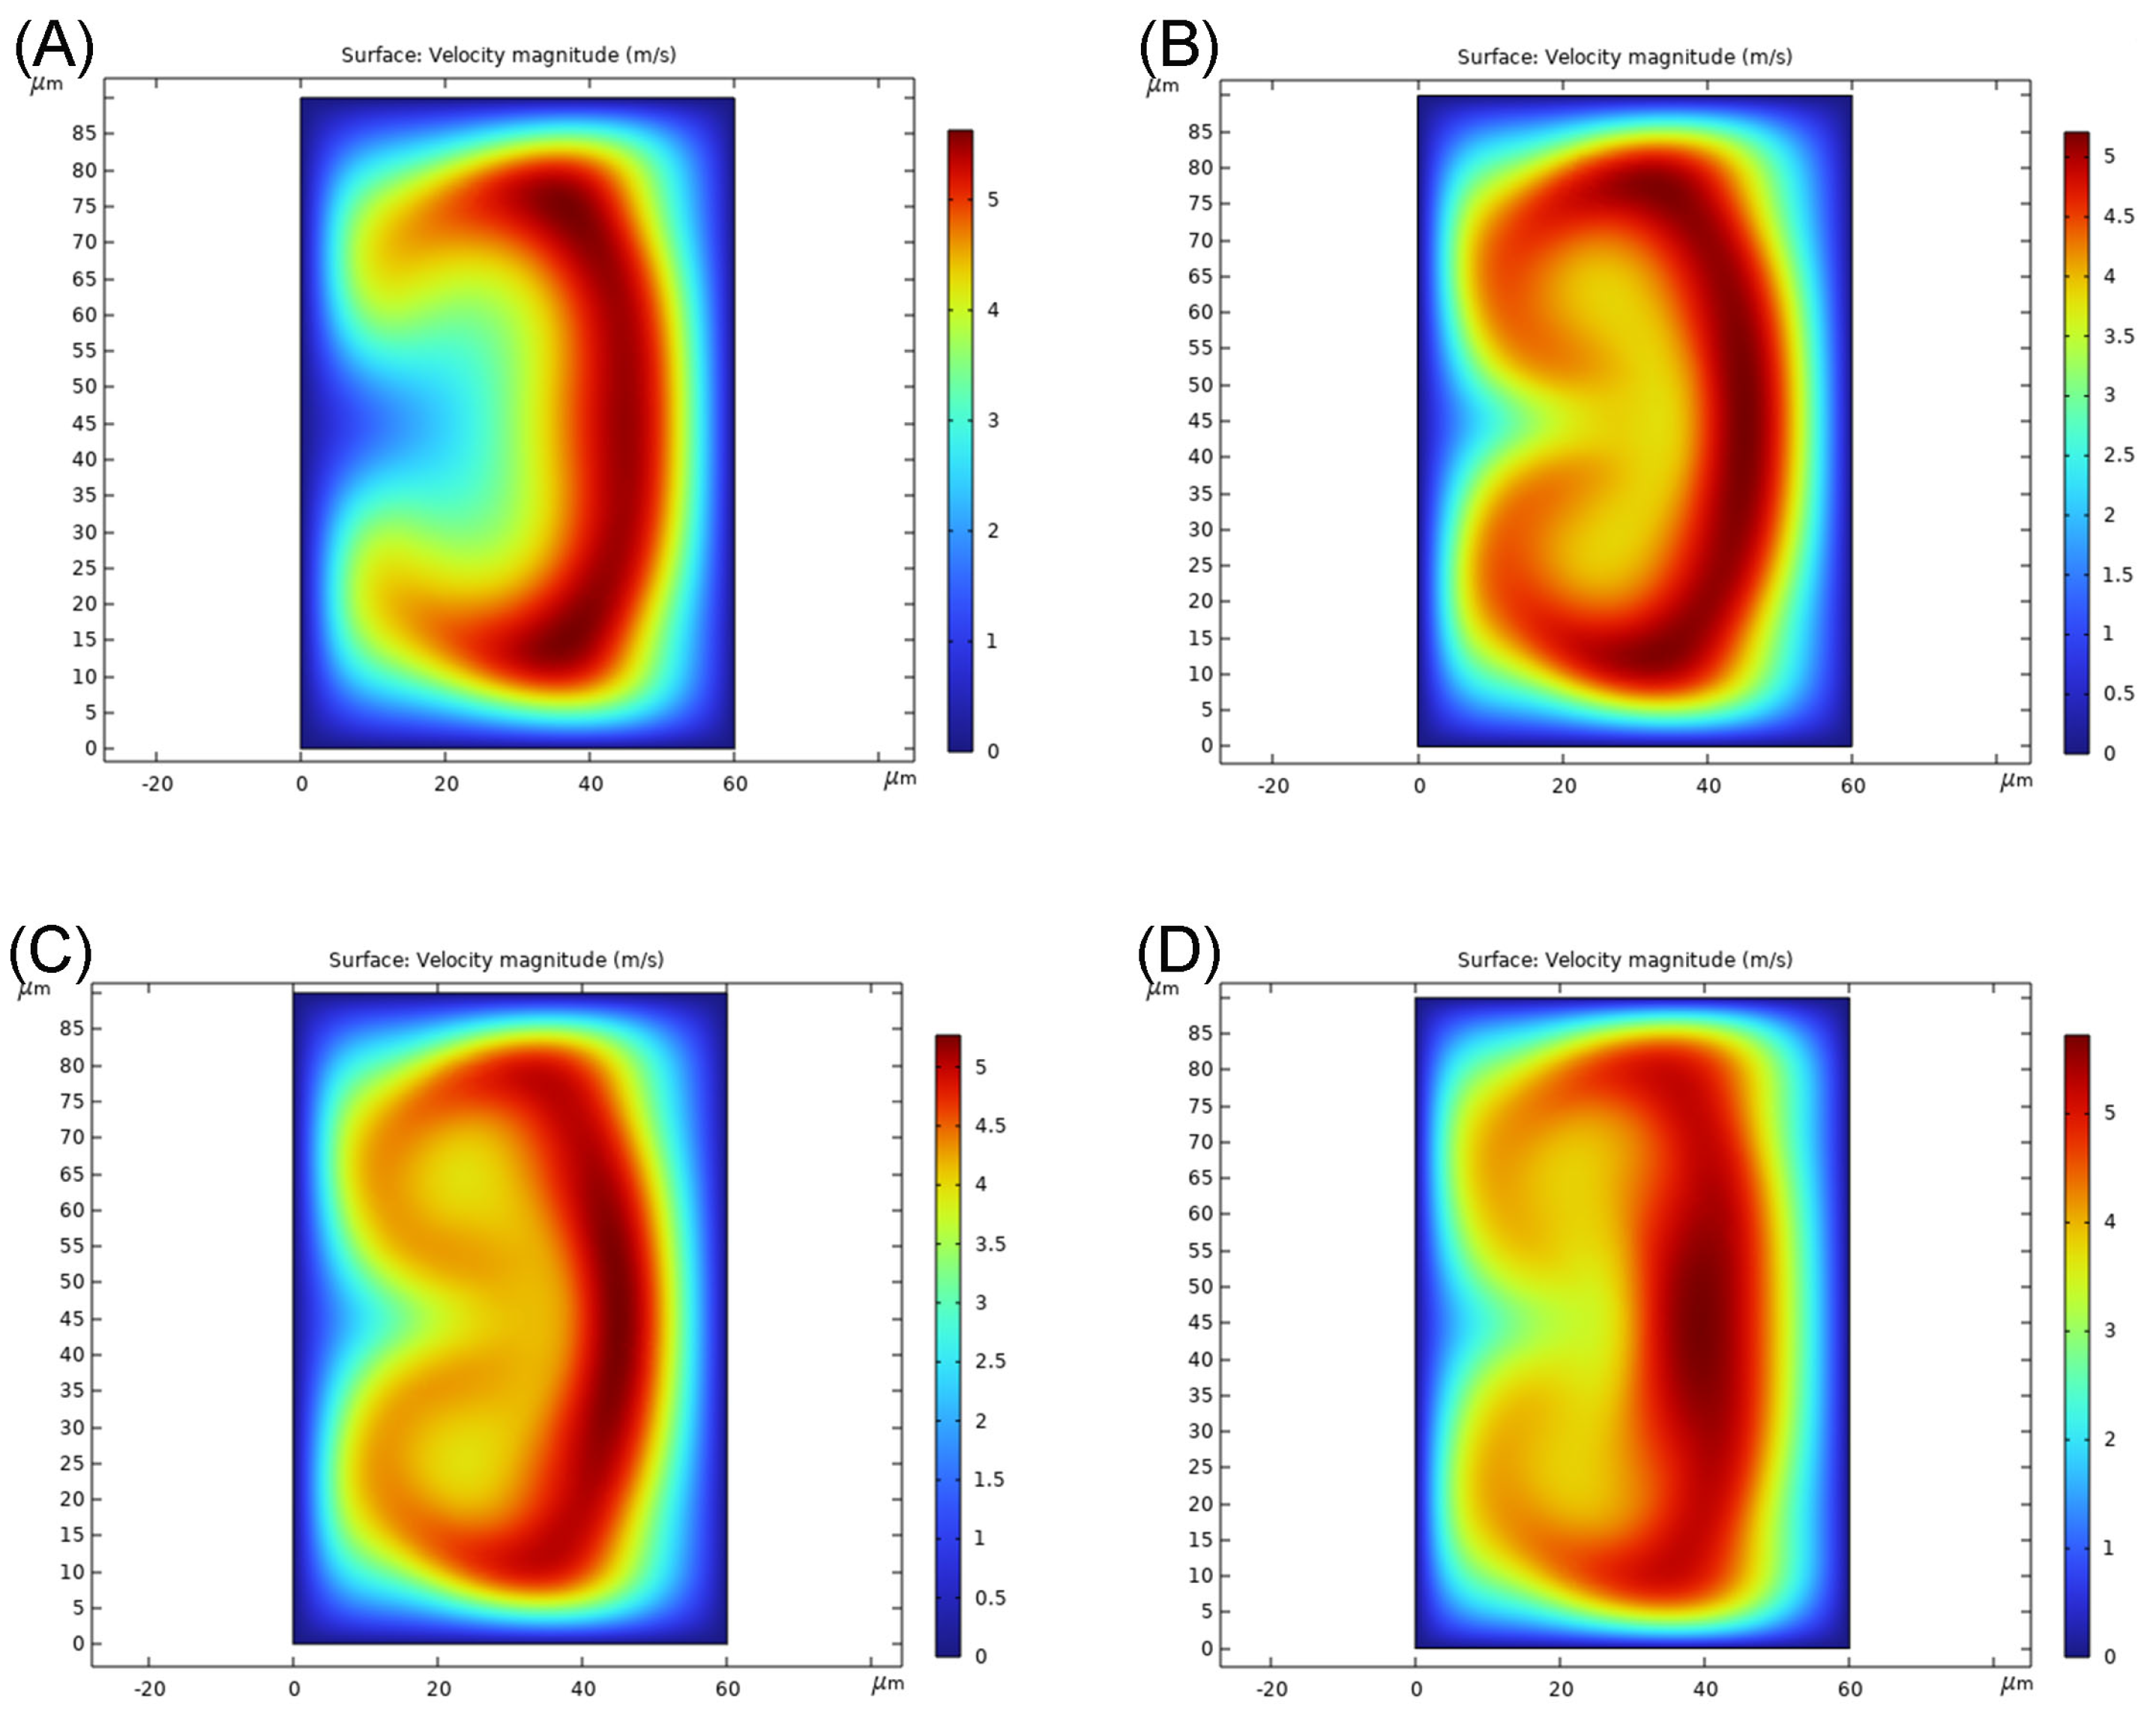
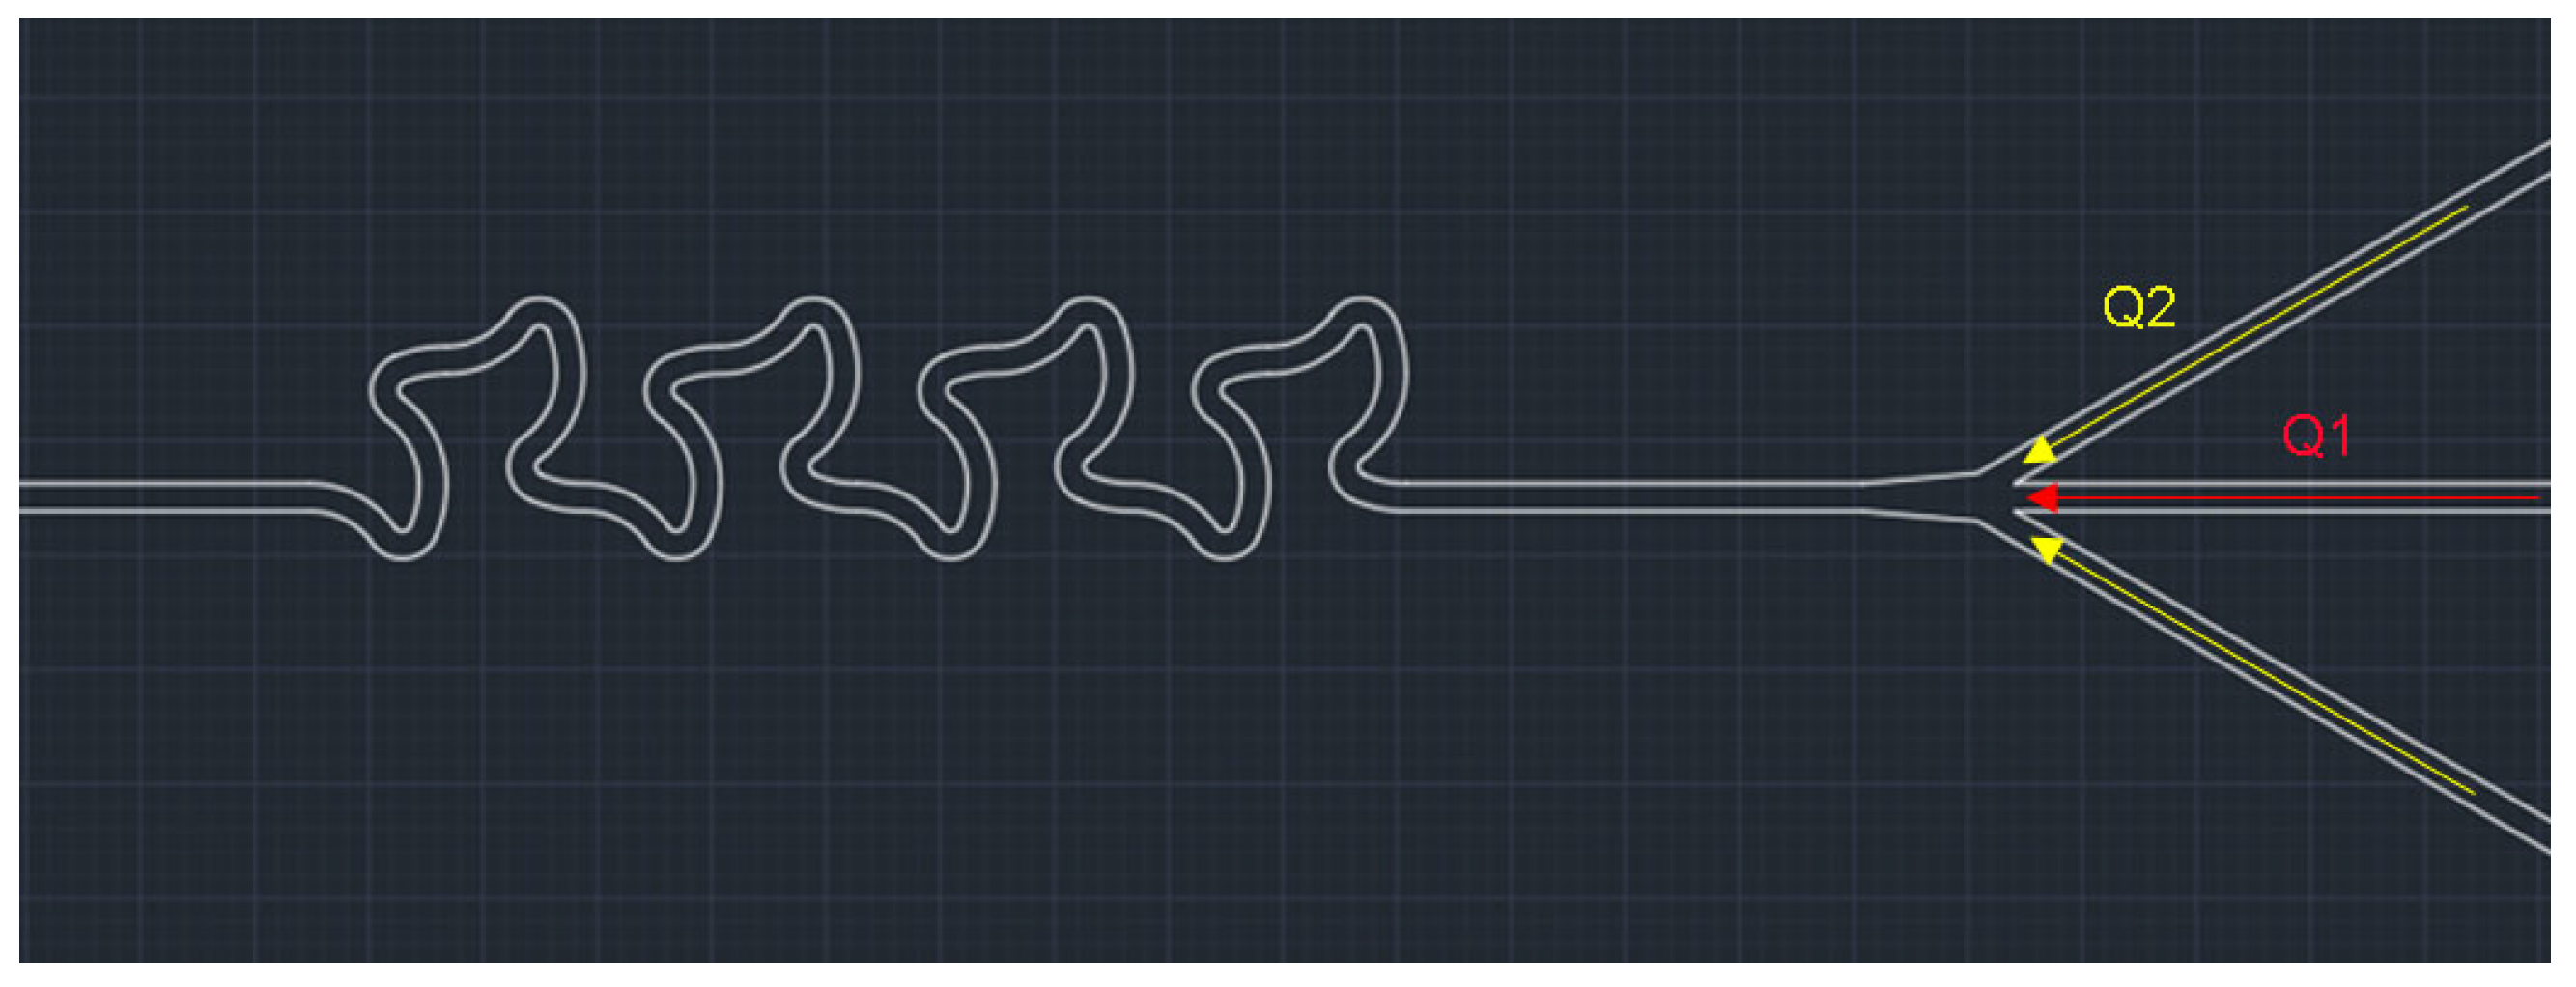
3.1. Optimization of the Channel Geometry by Simulation

Microfluidics mixer enhances mixing by stretching and folding the fluid elements. Such a feature exponentially increases the interfacial area between two species and allows layers of fluid to interact by diffusion or convection. In the condition of Dean instability, the strength of vortexes (value of D e ) is a major factor in facilitating convection and hence mixing. From the equation of D e , the characteristic dimension and radius of curvature are related to the geometrical design. The characteristic dimension in this study is already the smallest value considering the strength of plasma bonding [32]. As a result, only the radius of curvature is optimized and its variation refers to the change in magnitude of the centripetal force ( F 1 / R ).
The channel geometries are optimized by changing the radius of the second and third curvature with a fixed first radius of curvature. The range of radius in the second and third turns are from 40 μm to 80 μm and from 160 μm to 270 μm, respectively, with an interval of 10 μm, and two repeating units are studied in each case. Simulations were carried out and the MI were calculated and compared. The MI of the top 10 patterns in mixing at Dean instability is shown in Table 1.
The second radius of curvature plays a dominant role in the mixing, as the D e there is significantly larger than other parts of the repeating unit. Ideally, the smaller the better for the radius and the result reflects that the second radius of curvature in the best mixing pattern is 50 μm, the second smallest value in the range. For the third radius of curvature, the result of 200 μm, which is close to the middle value of the range, also meets our expectations. As we previously studied, the tortuous design behaves slightly differently in the flow due to the rolled-up velocity profile [30]. The centripetal force and pressure gradient “cooperate” for vortex formation. The third radius of curvature acts for reinforcement purposes and, hence, a moderate value is appropriate.
There is a piece of additional information the optimization result reveals. It is the ratio of force for the second curvature to the third curvature. Since the tortuous channel presents a “cooperation” behaviour, it is reasonable to assume there is an optimized ratio. From Table 1, the top few mixing patterns that perform the best all have a ratio close to 4. However, the ratio itself does not complete the picture; we need to consider the velocity profile. Due to the design nature, the second radius of curvature acts as a fillet to connect the channel and the angle of curvature changes with the radius. Such difference in angle affects the swirl [33] and hence the development of flow. As shown in Figure 2, at a longer second radius of curvature of 80 μm (Figure 2A), the fluid elements of the highest velocity are pushed toward the side and elongate along the wall. At a shorter second radius of curvature of 50 μm (Figure 2B), the velocity profile looks similar but with more roll-up features. For the second radius of curvature in 40 μm (Figure 2C), it is obvious that the fastest fluid elements do not elongate along the side, meaning a non-ideal velocity profile. We further present the velocity profile with 40 μm as the second radius of curvature in the top 10 mixing patterns (Figure 2C) and it is shown that the loss in the rolled-up velocity profile is more obvious due to the difference in the third radius of curvature. As a result, we think besides the higher D e the better the mixing principle, the presence of a rolled-up velocity profile and an appropriate ratio in radii also needs to be considered for the best mixing performance in the tortuous design at Dean instability condition.
In addition, the mixing length (data shown in Supplementary Materials) is affected as the circumference changes with the radius. However, we do not observe a major effect of the mixing length at Dean instability condition. It may due to the near-complete mixing condition (MI close to 1). The effect of the mixing length is further explored in the experiment.

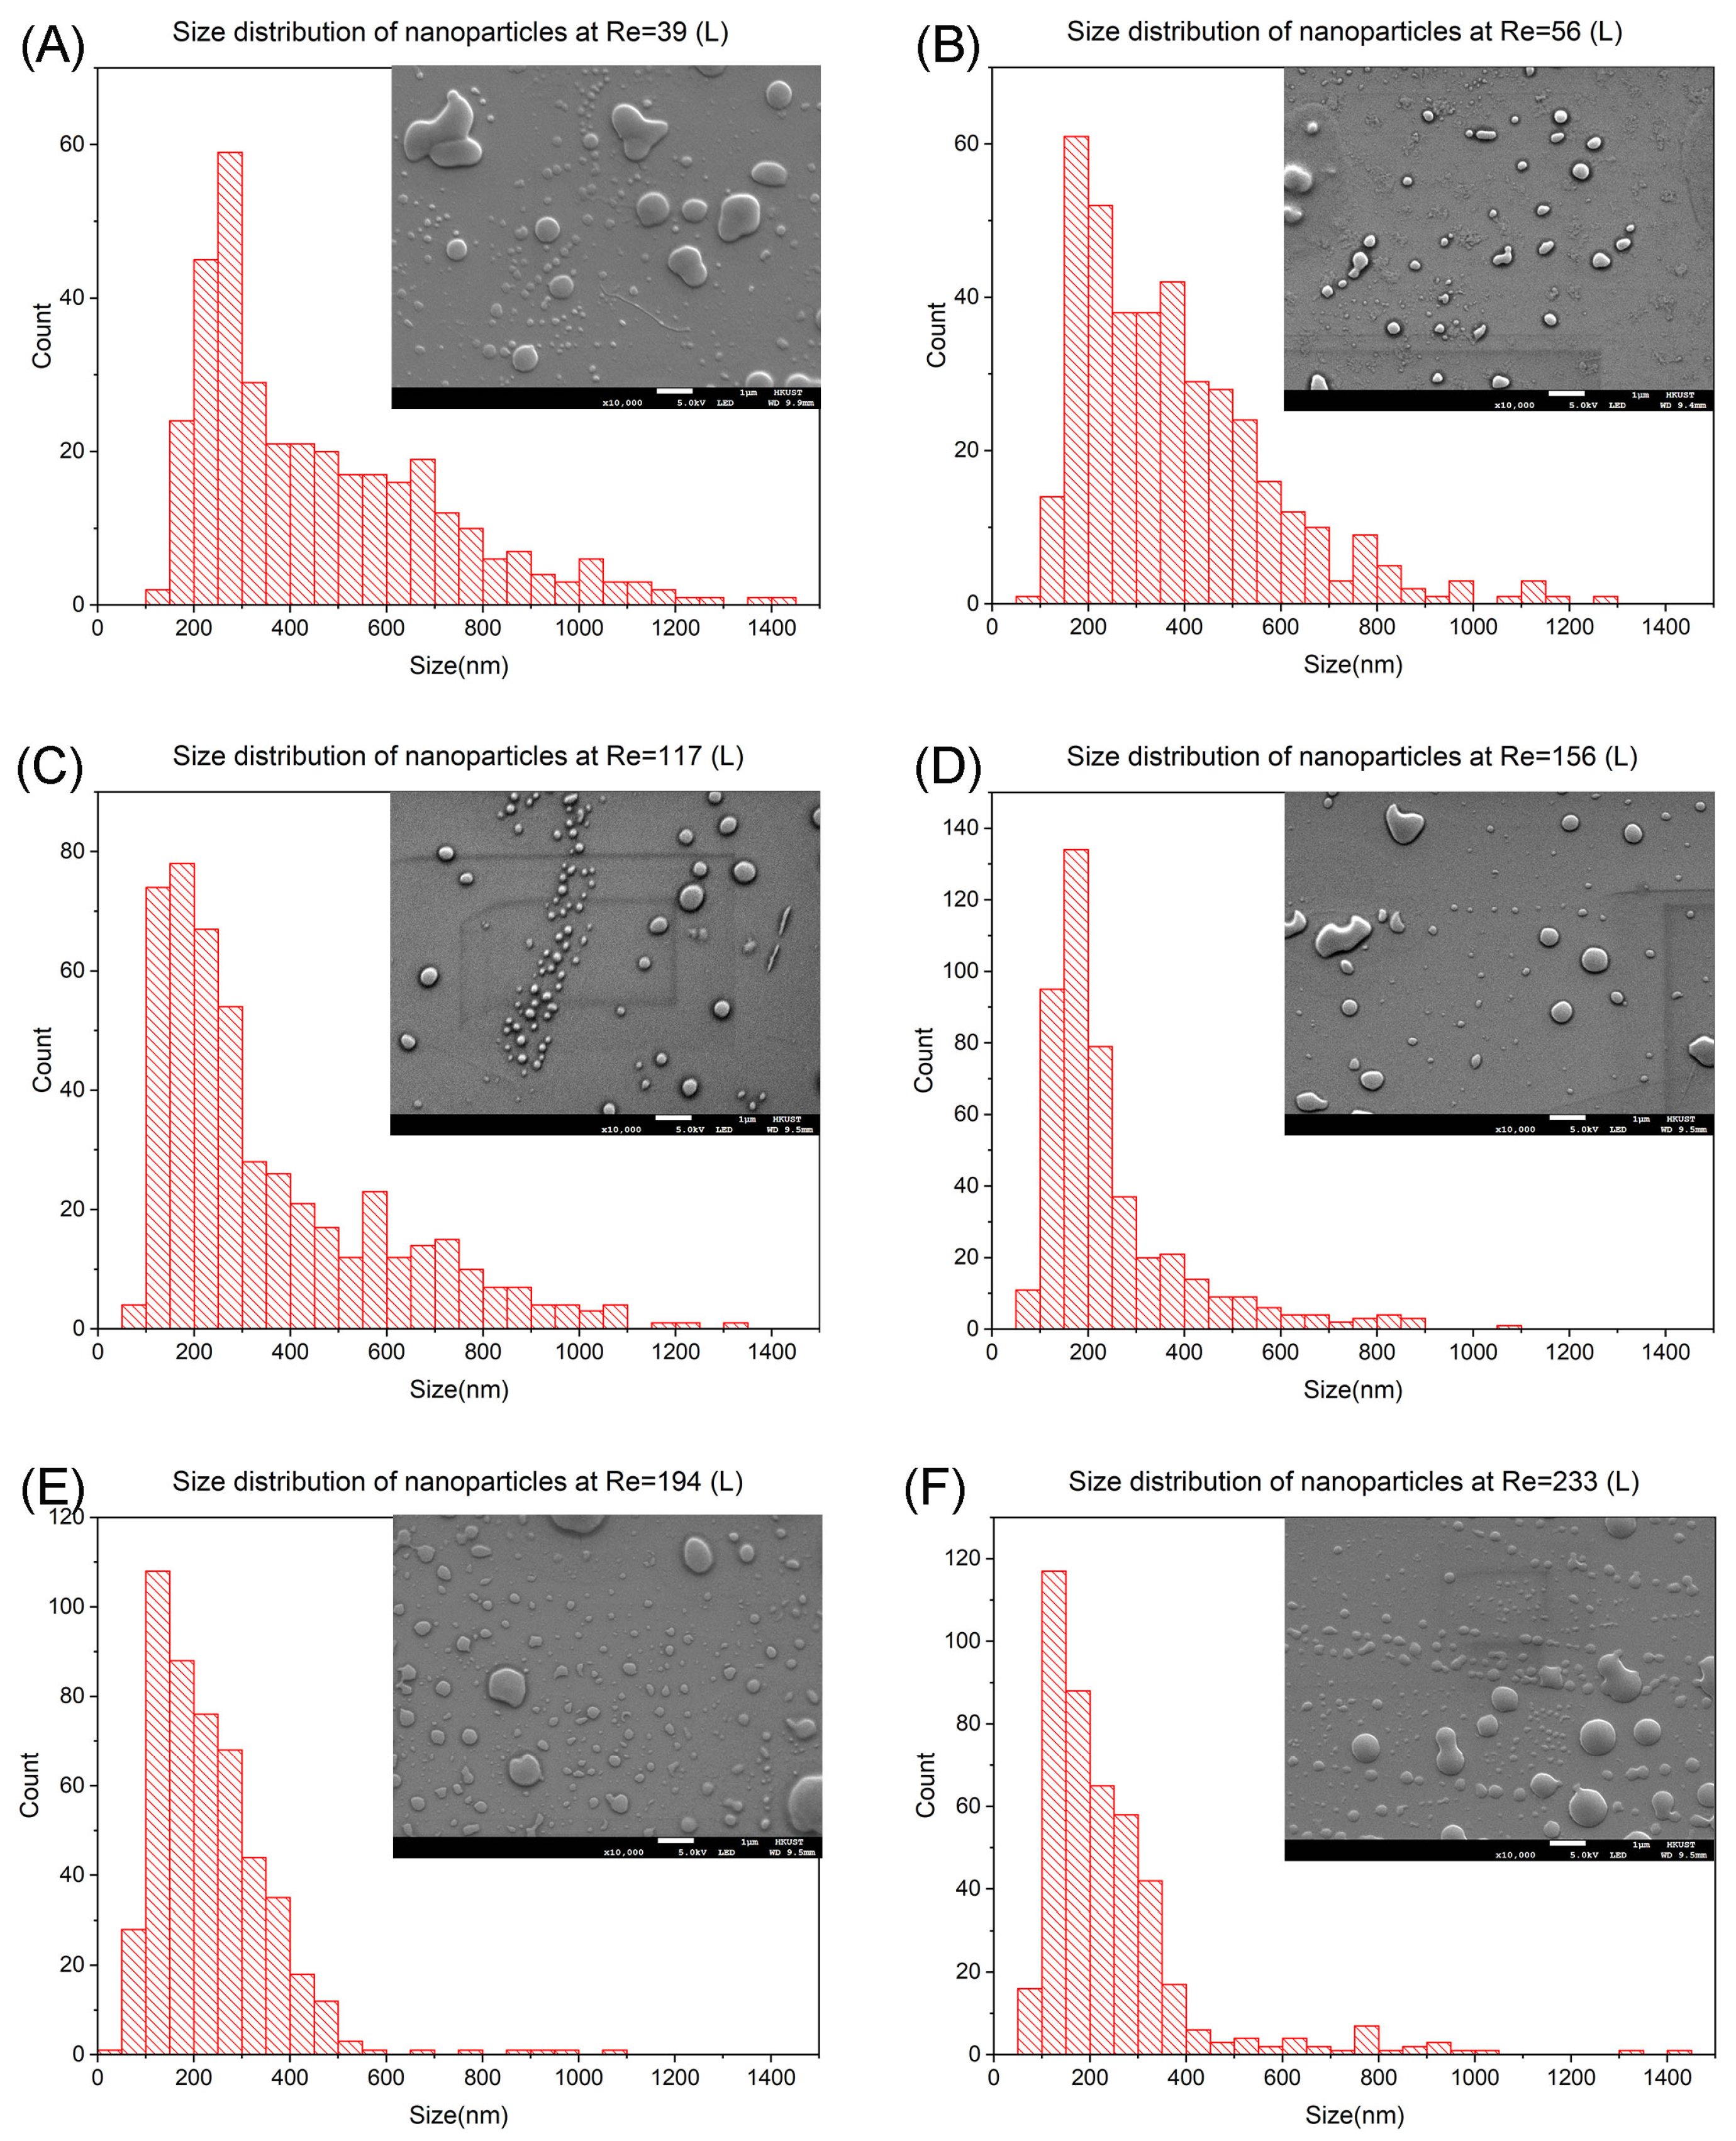
3.2. Prednisolone Nanoparticles Synthesis at Mixing Length L

In general, the drug nanoparticles are synthesized by either “top-down” or “bottom-up” approaches. The top-down approach is the breaking of larger particles while the bottom-up approach is the building up of particles from molecules in solution. The synthesis of nanoparticles in microfluidics adapts the bottom-up approach by mixing the solvent with anti-solvent. This means the mechanism is in the molecular range.
Figure 3 presents the size distribution charts of prednisolone particles and a corresponding SEM image to each R e ranging from 39 to 223 ( D e ranging from 33 to 198). The effect of increases in R e and D e is discussed. Figure 3A shows the most abundant nanoparticles at R e = 39 are in 250 nm to 300 nm, occupying 16.9% of the total. As the R e increases to 56, the most abundant size range changes to 150 nm to 200 nm with 15.5% (Figure 3B). The most abundant size range remains at 150 nm to 200 nm when the R e increases to 117 and 156 (Figure 3C,D). Moreover, the percentage increases to 15.9% and 29.4%. The size range decreases to 100 nm to 150 nm when the R e increases to 194 and 233 (Figure 3E,F). The percentages of the most abundant nanoparticles are 22.1% and 26.5%, respectively, in these two R e .
The result agrees with our hypothesis. For Dean flow regime, there is only one pair of Dean vortexes. As the R e increases from 39 ( D e = 33) to 56 ( D e = 48). The transverse velocity and the strength of Dean vortexes increase. This enhances the mixing, leading to a drop in the most abundant particle size from 250 nm to 300 nm to 150 nm to 200 nm. It remains as Dean flow as R e = 117 and 156 ( D e = 99 and 132). The strengthening of Dean vortexes in this transition is not strong enough for a reduction in particle size, but there is an increase in the percentage of the most abundant particle for 13.9%.
The flow condition changes from Dean flow to Dean instability as the R e proceeds to 194 ( D e = 165). The value of D e matches our previous work as we observed Dean instability at D e = 172 in the unoptimized channel. The most abundant particle size further decreases to 100 nm to 150 nm. It is because the mixing is further improved as the pressure-gradient generated vortexes arise. Similar to the previous transition, there is not a significant change in flow behaviour when R e changes to 233 ( D e = 198), resulting in no change in particle size but an increase in the percentage of 1.8%. From this set of data in mixing length L, we confirm the nanoparticle size drops with an increment in R e and D e .

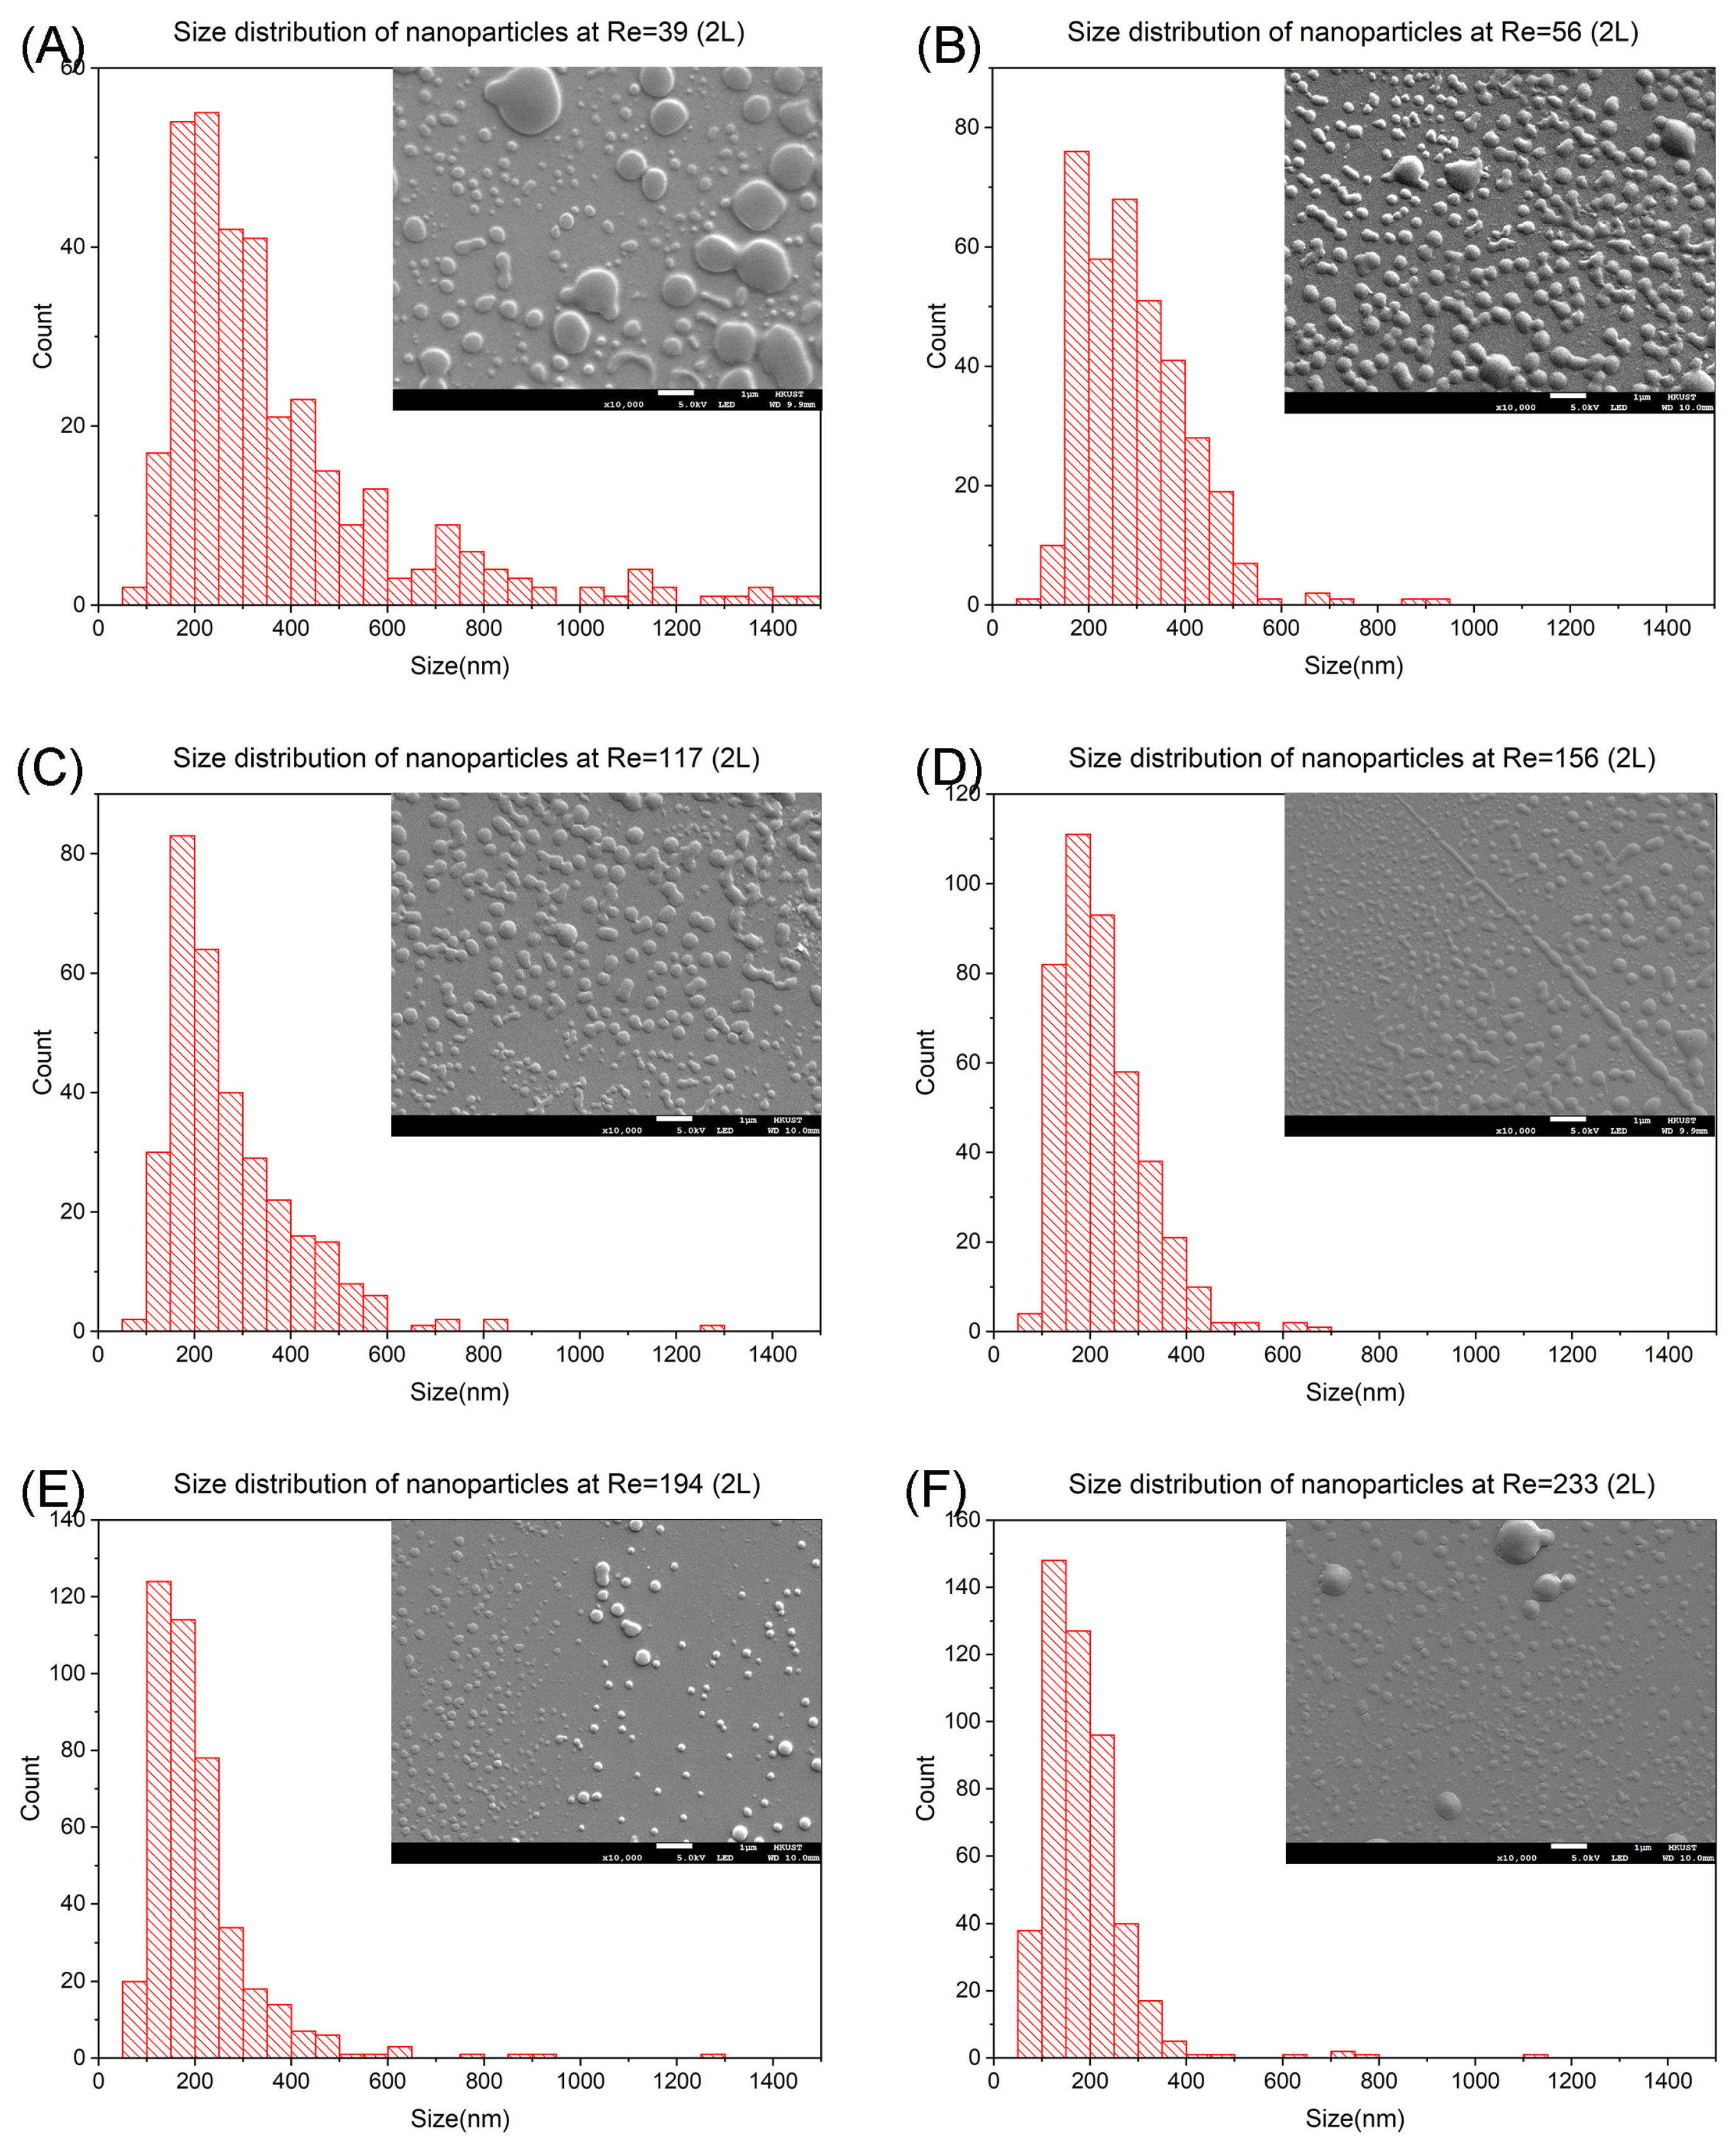
3.3. Prednisolone Nanoparticles Synthesis at Mixing Length 2L

The prednisolone nanoparticles synthesized in 2L are analyzed similarly along with the size distribution graphs and SEM images. We would like to observe if the mixing length has no significant effect as the simulation shows, with a larger difference by doubling the length.
In Figure 4A, the most abundant nanoparticles at R e = 39 are in 200 nm to 250 nm with 16.0%. The size range changes to 150 nm to 200 nm with 20.8% (Figure 4B) at R e = 56. The nanoparticles size range is the same as R e increases to 117 and 156 (Figure 4C,D). And the corresponding percentages are 25.7% and 26.2%. The size range decreases to 100 nm to 150 nm when the R e increases to 194 and 233 (Figure 4E,F) with 29.2% and 31.0%.
The overall change in the size of the nanoparticles and the percentage are similar as in the case of mixing length L. The fluid in Dean flow first gains more momentum, reducing the particle size down to 150 nm to 200 nm, then transiting to Dean instability, further reducing the particle size to 100 nm to 150 nm. And the most abundant particle size remains the same in some transitions, but all with an increment in the percentage of abundance in those phases (+5.4% in Dean flow and +1.7% in Dean instability).
There is one major difference between L and 2L: the drop in particle size at the lowest flow rate (from 250 nm to 300 nm down to 200 nm to 250 nm). It is due to the incomplete mixing at the lowest flow rate. For the other flow rates, the most abundant particles sizes remain the same because the mixing is near completion, hence with no change in size. However, we do observe some effect of the change in mixing length, which is not observed from the simulation. That is the amount of the most abundant particle increases with mixing length. We believe there is a higher probability of the particles with the highest percentage in size to be synthesized and the increase in mixing length reinforces such behaviour. This leads to an overall increase in the percentage number. As a result, we think the mixing length is crucial when there is no complete mixing. And for a complete mixing case, only the purity of nanoparticles is improved.

4. Conclusions

The first experimental study of Dean instability in real application at the microscale is reported. The tortuous channel is optimized numerically with the consideration of the radii of curvature, showing the importance of radii of curvature and a rolled-up velocity profile. We concluded the nanoparticles size decreases as the Dean flow transits to Dean instability, and the mixing length has a limited effect in the Dean instability regime. This work shows the promising mixing ability of the tortuous channel. And it demonstrates a huge potential in other applications involving micro-mixing apart from nanotechnology like nanoparticles synthesis.

Supplementary Materials

The following supporting information can be downloaded at: https://www.mdpi.com/article/10.3390/nano14080652/s1, Figure S1: work flow of the fabrication; Figure S2: Experimental setup; Figure S3: Convergence of velocity; Table S1: Meshing tested for the convergence test; Table S2: Top 10 best performed mixing patterns (two repeating units) at Dean instability.

Author Contributions

Conceptualization, Y.C.W. and W.W.; methodology, Y.C.W. and S.Y.; software, Y.C.W.; validation, Y.C.W.; formal analysis, Y.C.W.; investigation, Y.C.W. and S.Y.; resources, Y.C.W.; data curation, Y.C.W.; writing—original draft preparation, Y.C.W.; writing—review and editing, W.W.; visualization, Y.C.W.; supervision, W.W.; project administration, Y.C.W.; funding acquisition, W.W. All authors have read and agreed to the published version of the manuscript.

Funding

This research was funded by Hong Kong Innovation and Technology Fund (ITF, MRP/084/20), and the Project of Hetao Shenzhen-Hong Kong Science and Technology Innovation Cooperation Zone (HZQB-KCZYB-2020083).

Data Availability Statement

The data used in this study are available from the corresponding author upon reasonable request.

Acknowledgments

We would like to thank C. F. Yeung, H. Li and P.K. Man from The HKUST NFF, and L.Y. Shek and H.K. Wong from The HKUST MCPF.

Conflicts of Interest

The authors declare no conflicts of interest.

References

  1. Murphy, C.J. Sustainability as an emerging design criterion in nanoparticle synthesis and applications. J. Mater. Chem. 2008, 18, 2173–2176. [Google Scholar] [CrossRef]
  2. Abou El-Nour, K.M.; Eftaiha, A.; Al-Warthan, A.; Ammar, R.A. Synthesis and applications of silver nanoparticles. Arab. J. Chem. 2010, 3, 135–140. [Google Scholar] [CrossRef]
  3. Khan, A.; Rashid, R.; Murtaza, G.; Zahra, A. Gold nanoparticles: Synthesis and applications in drug delivery. Trop. J. Pharm. Res. 2014, 13, 1169–1177. [Google Scholar] [CrossRef]
  4. Demello, A.J. Control and detection of chemical reactions in microfluidic systems. Nature 2006, 442, 394–402. [Google Scholar] [CrossRef]
  5. Liu, Y.; Jiang, X. Why microfluidics? Merits and trends in chemical synthesis. Lab Chip 2017, 17, 3960–3978. [Google Scholar] [CrossRef] [PubMed]
  6. Meijer, H.E.; Singh, M.K.; Kang, T.G.; Den Toonder, J.M.; Anderson, P.D. Passive and active mixing in microfluidic devices. In Proceedings of the Macromolecular Symposia, Taipei, Taiwan, 29 June–4 July 2008; Wiley Online Library: Hoboken, NJ, USA, 2009; Volume 279, pp. 201–209. [Google Scholar]
  7. Lee, C.Y.; Chang, C.L.; Wang, Y.N.; Fu, L.M. Microfluidic mixing: A review. Int. J. Mol. Sci. 2011, 12, 3263–3287. [Google Scholar] [CrossRef] [PubMed]
  8. Ward, K.; Fan, Z.H. Mixing in microfluidic devices and enhancement methods. J. Micromech. Microeng. 2015, 25, 094001. [Google Scholar] [CrossRef] [PubMed]
  9. Wen, C.Y.; Yeh, C.P.; Tsai, C.H.; Fu, L.M. Rapid magnetic microfluidic mixer utilizing AC electromagnetic field. Electrophoresis 2009, 30, 4179–4186. [Google Scholar] [CrossRef] [PubMed]
  10. Frommelt, T.; Kostur, M.; Wenzel-Schäfer, M.; Talkner, P.; Hänggi, P.; Wixforth, A. Microfluidic mixing via acoustically driven chaotic advection. Phys. Rev. Lett. 2008, 100, 034502. [Google Scholar] [CrossRef]
  11. Anderson, J.C.; Welle, R.P. Thermally-actuated microfluidic systems. JALA: J. Assoc. Lab. Autom. 2008, 13, 65–72. [Google Scholar] [CrossRef]
  12. Stroock, A.D.; Dertinger, S.K.; Ajdari, A.; Mezic, I.; Stone, H.A.; Whitesides, G.M. Chaotic mixer for microchannels. Science 2002, 295, 647–651. [Google Scholar] [CrossRef]
  13. Nimafar, M.; Viktorov, V.; Martinelli, M. Experimental comparative mixing performance of passive micromixers with H-shaped sub-channels. Chem. Eng. Sci. 2012, 76, 37–44. [Google Scholar] [CrossRef]
  14. Hossain, S.; Ansari, M.A.; Husain, A.; Kim, K.Y. Analysis and optimization of a micromixer with a modified Tesla structure. Chem. Eng. J. 2010, 158, 305–314. [Google Scholar] [CrossRef]
  15. Kim, G.Y.; Han, J.I.; Park, J.K. Inertial microfluidics-based cell sorting. BioChip J. 2018, 12, 257–267. [Google Scholar] [CrossRef]
  16. Lu, X.; Chow, J.J.M.; Koo, S.H.; Tan, T.Y.; Jiang, B.; Ai, Y. Enhanced molecular diagnosis of bloodstream candida infection with size-based inertial sorting at submicron resolution. Anal. Chem. 2020, 92, 15579–15586. [Google Scholar] [CrossRef] [PubMed]
  17. Di Carlo, D. Inertial microfluidics. Lab Chip 2009, 9, 3038–3046. [Google Scholar] [CrossRef] [PubMed]
  18. Zhao, Q.; Yuan, D.; Zhang, J.; Li, W. A review of secondary flow in inertial microfluidics. Micromachines 2020, 11, 461. [Google Scholar] [CrossRef]
  19. Tang, W.; Zhu, S.; Jiang, D.; Zhu, L.; Yang, J.; Xiang, N. Channel innovations for inertial microfluidics. Lab Chip 2020, 20, 3485–3502. [Google Scholar] [CrossRef]
  20. Tripathi, E.; Patowari, P.K.; Pati, S. Numerical investigation of mixing performance in spiral micromixers based on Dean flows and chaotic advection. Chem. Eng. Process.-Process Intensif. 2021, 169, 108609. [Google Scholar] [CrossRef]
  21. Ngo, I.; Lai, T.; Choi, H.; Le, H.; Kim, G.; Dang, T. A study on mixing performance of dean flows through spiral micro-channel under various effects. Phys. Fluids 2020, 32. [Google Scholar] [CrossRef]
  22. Sudarsan, A.P.; Ugaz, V.M. Fluid mixing in planar spiral microchannels. Lab Chip 2006, 6, 74–82. [Google Scholar] [CrossRef] [PubMed]
  23. Howell, P.B., Jr.; Mott, D.R.; Golden, J.P.; Ligler, F.S. Design and evaluation of a Dean vortex-based micromixer. Lab Chip 2004, 4, 663–669. [Google Scholar] [CrossRef]
  24. Yu, X.; Andreo, J.; Walden, M.; Del Campo, J.F.; Basabe-Desmonts, L.; Benito-Lopez, F.; Burg, T.P.; Wuttke, S. The Importance of Dean Flow in Microfluidic Nanoparticle Synthesis: A ZIF-8 Case Study. Small Methods 2024, 8, 2300603. [Google Scholar] [CrossRef] [PubMed]
  25. Thiele, M.; Knauer, A.; Malsch, D.; Csáki, A.; Henkel, T.; Köhler, J.M.; Fritzsche, W. Combination of microfluidic high-throughput production and parameter screening for efficient shaping of gold nanocubes using Dean-flow mixing. Lab Chip 2017, 17, 1487–1495. [Google Scholar] [CrossRef] [PubMed]
  26. Dean, W.R. Fluid motion in a curved channel. Proc. R. Soc. London. Ser. A Contain. Pap. Math. Phys. Character 1928, 121, 402–420. [Google Scholar]
  27. Reid, W. On the stability of viscous flow in a curved channel. Proc. R. Soc. London. Ser. A Math. Phys. Sci. 1958, 244, 186–198. [Google Scholar]
  28. Peng, K.; Xu, F.; Yang, L.; Yao, C.; Chen, G. Dean instability and vortex-induced mixing for two miscible fluids in T-micromixers. Chem. Eng. Process.-Process Intensif. 2022, 176, 108975. [Google Scholar] [CrossRef]
  29. Nivedita, N.; Ligrani, P.; Papautsky, I. Dean flow dynamics in low-aspect ratio spiral microchannels. Sci. Rep. 2017, 7, 44072. [Google Scholar] [CrossRef]
  30. Wong, Y.C.; Dai, C.; Xian, Q.; Yan, Z.; Zhang, Z.; Wen, W. Flow study of Dean’s instability in high aspect ratio microchannels. Sci. Rep. 2023, 13, 17896. [Google Scholar] [CrossRef]
  31. Ali, H.S.; Blagden, N.; York, P.; Amani, A.; Brook, T. Artificial neural networks modelling the prednisolone nanoprecipitation in microfluidic reactors. Eur. J. Pharm. Sci. 2009, 37, 514–522. [Google Scholar] [CrossRef]
  32. Xiong, L.; Chen, P.; Zhou, Q. Adhesion promotion between PDMS and glass by oxygen plasma pre-treatment. J. Adhes. Sci. Technol. 2014, 28, 1046–1054. [Google Scholar] [CrossRef]
  33. Squire, H.B.; Winter, K. The secondary flow in a cascade of airfoils in a nonuniform stream. J. Aeronaut. Sci. 1951, 18, 271–277. [Google Scholar] [CrossRef]
Figure 1. Optimized channel with mixing length of 2L, Q1: DI water, Q2: prednisolone solution.
Nanomaterials 14 00652 g001
Figure 2. Velocity profile at the end of the third radius of curvature ( R e = 233). (A) ( D e = 156) 2nd radius of curvature: 80 μm, 3rd radius of curvature: 200 μm. (B) ( D e = 198) 2nd radius of curvature: 50 μm, 3rd radius of curvature: 200 μm. (C) ( D e = 221) 2nd radius of curvature: 40 μm, 3rd radius of curvature: 200 μm. (D) ( D e = 221) 2nd radius of curvature: 40 μm, 3rd radius of curvature: 160 μm.
Nanomaterials 14 00652 g002
Figure 3. Size distribution and SEM images of prednisolone nanoparticles at mixing length L. (A) SEM image and size distribution at R e = 39, D e = 33. (B) SEM image and size distribution at R e = 56, D e = 48. (C) SEM image and size distribution at R e = 117, D e = 99. (D) SEM image and size distribution at R e = 156, D e = 132. (E) SEM image and size distribution at R e = 194, D e = 165. (F) SEM image and size distribution at R e = 233, D e = 198.
Nanomaterials 14 00652 g003
Figure 4. Size distribution and SEM images of prednisolone nanoparticles at mixing length 2L. (A) SEM image and size distribution at R e = 39, D e = 33. (B) SEM image and size distribution at R e = 56, D e = 48. (C) SEM image and size distribution at R e = 117, D e = 99. (D) SEM image and size distribution at R e = 156, D e = 132. (E) SEM image and size distribution at R e = 194, D e = 165. (F) SEM image and size distribution at R e = 233, D e = 198.
Nanomaterials 14 00652 g004
Table 1. Top 10 best-performing mixing patterns (two repeating units).
2nd Radius of Curvature [ μ m]3rd Radius of Curvature [ μ m]Mixing Index (cor. to 3 sig. fig.)
502000.988
602600.987
602100.986
501900.986
601900.985
401600.985
702000.981
702200.981
601700.980
702300.979
Disclaimer/Publisher’s Note: The statements, opinions and data contained in all publications are solely those of the individual author(s) and contributor(s) and not of MDPI and/or the editor(s). MDPI and/or the editor(s) disclaim responsibility for any injury to people or property resulting from any ideas, methods, instructions or products referred to in the content.

