Article

Preparation and Gas-Sensitive Properties of SnO2@Bi2O3 Core-Shell Heterojunction Structure

School of Communication and Information Engineering, Xi’an University of Science and Technology, Xi’an 710054, China
*
Author to whom correspondence should be addressed.
Nanomaterials 2025, 15(2), 129; https://doi.org/10.3390/nano15020129
Submission received: 15 December 2024 / Revised: 8 January 2025 / Accepted: 9 January 2025 / Published: 16 January 2025

Abstract

:
The SnO2@Bi2O3 core-shell heterojunction structure was designed and synthesized via a hydrothermal method, and the structure and morphology of the synthesized samples were characterized using X-ray diffraction (XRD), scanning electron microscopy (SEM), and X-ray photoelectron spectroscopy (XPS). Based on the conclusions from XRD and SEM, it can be observed that as the hydrothermal temperature increases, the content of Bi2O3 coated on the surface of SnO2 spheres gradually increases, and the diameter of Bi2O3 nanoparticles also increases. At a hydrothermal temperature of 160 °C, the SnO2 spheres are fully coated with Bi2O3 nanoparticles. This paper investigated the gas-sensitive performance of the SnO2@Bi2O3 sensor towards ethanol gas. Gas sensitivity tests at the optimal operating temperature of 300 °C showed that the composite prepared at 160 °C achieved a response value of 19.7 for 100 ppm ethanol. Additionally, the composite exhibited excellent response to 100 ppm ethanol, with a response time of only 4 s, as well as good repeatability. The excellent gas-sensitive performance of the SnO2@Bi2O3 core-shell heterojunction towards ethanol gas is attributed to its p-n heterojunction material properties. Its successful preparation contributes to the realization of high-performance heterostructure ethanol gas sensors.

1. Introduction

With the rapid development of industry, environmental pollution has become increasingly severe. Large quantities of untreated gasses containing harmful substances are being released into the atmosphere, posing significant threats to human health [1]. As a result, gas detection has become a key area of focus. Gas sensors, which play a vital role in environmental monitoring and air quality detection, have attracted growing research interest. Among them, metal oxide semiconductors (MOS) have garnered significant attention as gas-sensitive materials due to their simple structure, ease of fabrication, and real-time monitoring capabilities [2,3].
Tin dioxide (SnO2) is a common MOS material and is widely used in gas sensing materials due to its excellent electrical conductivity, wide bandgap (Eg = 3.6 eV), tunable resistivity, and sensitivity and selectivity to various gasses [4,5,6]. However, pure SnO2 suffers from low response and poor selectivity, and its gas sensing performance has not yet reached the expected targets. Many researchers have employed composite structures to enhance the performance of gas sensors. The formation of heterostructures, composed of two or more semiconductor materials, has been explicitly proven to improve gas sensor performance [7,8,9,10,11]. For instance, SnO2@SnS2 heterojunctions exhibited excellent performance in NO2 detection [12]. Researchers synthesized NiO/SnO2 hollow spheres and constructed p-n heterojunctions, significantly enhancing the sensitivity to triethylamine [13]. J.H. Kim et al. demonstrated that Co3O4/SnO2 composite nanofibers exhibited significantly enhanced response to acetone gas at 350 °C compared to pure SnO2 [14]. Zhang et al. developed a novel gas sensor based on ZnO/SnO2, which showed a response to 2000 ppm ethanol vapor that was 7 times higher than that of the original ZnO sensor [15]. Furthermore, Chen et al. reported that the SnO2/TiO2 heterojunction sensor achieved a response value of 9.58 to 100 ppm ethanol, which was 1.88 times that of SnO2 nanoparticles [16]. This improvement is attributed to the synergistic effect of band structure modulation and the formation of heterojunctions between the two semiconductors, which increases the electron depletion layer and improves charge carrier separation.
Bismuth oxide (Bi2O3) is another common MOS material with a bandgap of 2.79 eV. Due to its high refractive index and high dielectric constant, it has promising application prospects [17]. It is often combined with other metal oxides for constructing gas sensors [18,19,20,21]. For example, A. Montenegro et al. synthesized SnO2-Bi2O3 composites via the polymer precursor method, demonstrating that the introduction of bismuth significantly enhanced the sensor’s response to oxygen [22]. Jae Hoon Bang et al. proposed a highly sensitive and selective NO2 sensor based on Bi2O3 -modified branched SnO2 nanowires (NWs) [23]. Additionally, Yang et al. incorporated Bi2O3 particles as external additives onto the surface of SnO2 nanoparticles (NPs) for the efficient detection of oxygenated volatile organic compounds (VOCs) [24]. Therefore, SnO2@Bi2O3 composite materials exhibit potential for achieving reliable gas sensors, warranting further investigation in this field.
In this paper, SnO2@Bi2O3 core-shell heterojunctions were prepared at different temperatures using a hydrothermal method. The crystal structure, microstructure, and chemical states of the materials were characterized. The gas-sensing performance was tested to determine the optimal operating temperature of the sensor. The response and recovery times of the sensor were calculated, and the transient current curves of the sensors exposed to 5–100 ppm ethanol were analyzed. The effect of sensor repeatability was explored. This paper focuses on analyzing the gas-sensing mechanism of the sensors and reveals that the improvement in ethanol gas-sensing performance of SnO2@Bi2O3 composites primarily originates from the p-n heterojunction.

2. Experimental Section

2.1. Synthesis of SnO2

First, 8.098 g of SnCl4·5H2O (Beijing Tianyun Chemical Reagent Co., Ltd., Beijing, China) and 0.2 g of PVP (polyvinylpyrrolidone) (Sinopharm Chemical Reagent Co., Ltd., Shanghai, China) were dissolved in 35 mL of deionized water and stirred for 30 min until fully mixed. Subsequently, 6.02 g of NaOH(Sichuan Xilong Science Co., Ltd., Chengdu, China) was dissolved in 35 mL of deionized water and stirred at room temperature for 30 min to form a colorless and transparent NaOH solution. The NaOH solution was added dropwise to the SnCl4·5H2O solution, and the mixture was stirred for 30 min to form a transparent and uniform precursor solution. The precursor solution was transferred into a polytetrafluoroethylene reactor and reacted at 180 °C for 10 h. After natural cooling to room temperature, the sample was collected and washed five times with deionized water and anhydrous ethanol until neutral. Finally, the sample was dried at 60 °C for 12 h to obtain the final SnO2 sample.

2.2. Synthesis of SnO2@Bi2O3

First, 0.679 g of Bi(NO3)3·5H2O (Sinopharm Chemical Reagent Co., Ltd., Shanghai, China) and 0.168 g of NaOH were dissolved separately in 35 mL of deionized water and stirred for 30 min to form uniform solutions. The NaOH solution was added dropwise to the Bi(NO3)3·5H2O solution, forming a stable solution. Subsequently, 0.8 g of SnO2 prepared in the first step was added, and the mixture was stirred for another 30 min. The resulting solution was transferred into a polytetrafluoroethylene reactor and reacted at different temperatures (100 °C, 120 °C, 140 °C, and 160 °C) for 4 h. After natural cooling to room temperature, the samples were collected and washed five times with deionized water and anhydrous ethanol until neutral. Finally, the sample was dried at 70 °C for 12 h to obtain the final samples.

2.3. Material Characterization

The crystal structure of the samples was measured using an X-ray diffractometer (XRD, Bruker D8 Advance, Bruker Corporation, Karlsruhe, Germany). The microscopic morphology and element content of the prepared samples were analyzed using a scanning electron microscope (SEM, GeminiSEM 360, Carl Zeiss AG, Oberkochen, Germany) with energy-dispersive X-ray spectrum (EDS). X-ray photoelectron spectroscopy (XPS, Thermo Scientific-ESCALAB Xi+, Thermo Fisher Scientific, Waltham, MA, USA) was used to determine the surface composition and chemical states of the elements.

2.4. Sensor Fabrication and Gas Sensing

The fabrication process of the gas sensor is as follows: the prepared sample was mixed with an appropriate amount of deionized water and grinded to form a slurry. The slurry was then coated onto a clean ceramic tube equipped with a pair of gold electrodes to serve as the testing electrode. The ceramic tube was sintered in air at 300 °C for 3 h to enhance the material’s stability. Finally, a nickel–chromium heating wire was inserted and welded onto the hexagonal base of the ceramic tube, forming an indirectly heated gas sensor.
The sensor response was defined as I g I a , where I a represents the sensor current in air and I g represents the current in the target gas.

3. Results and Discussion

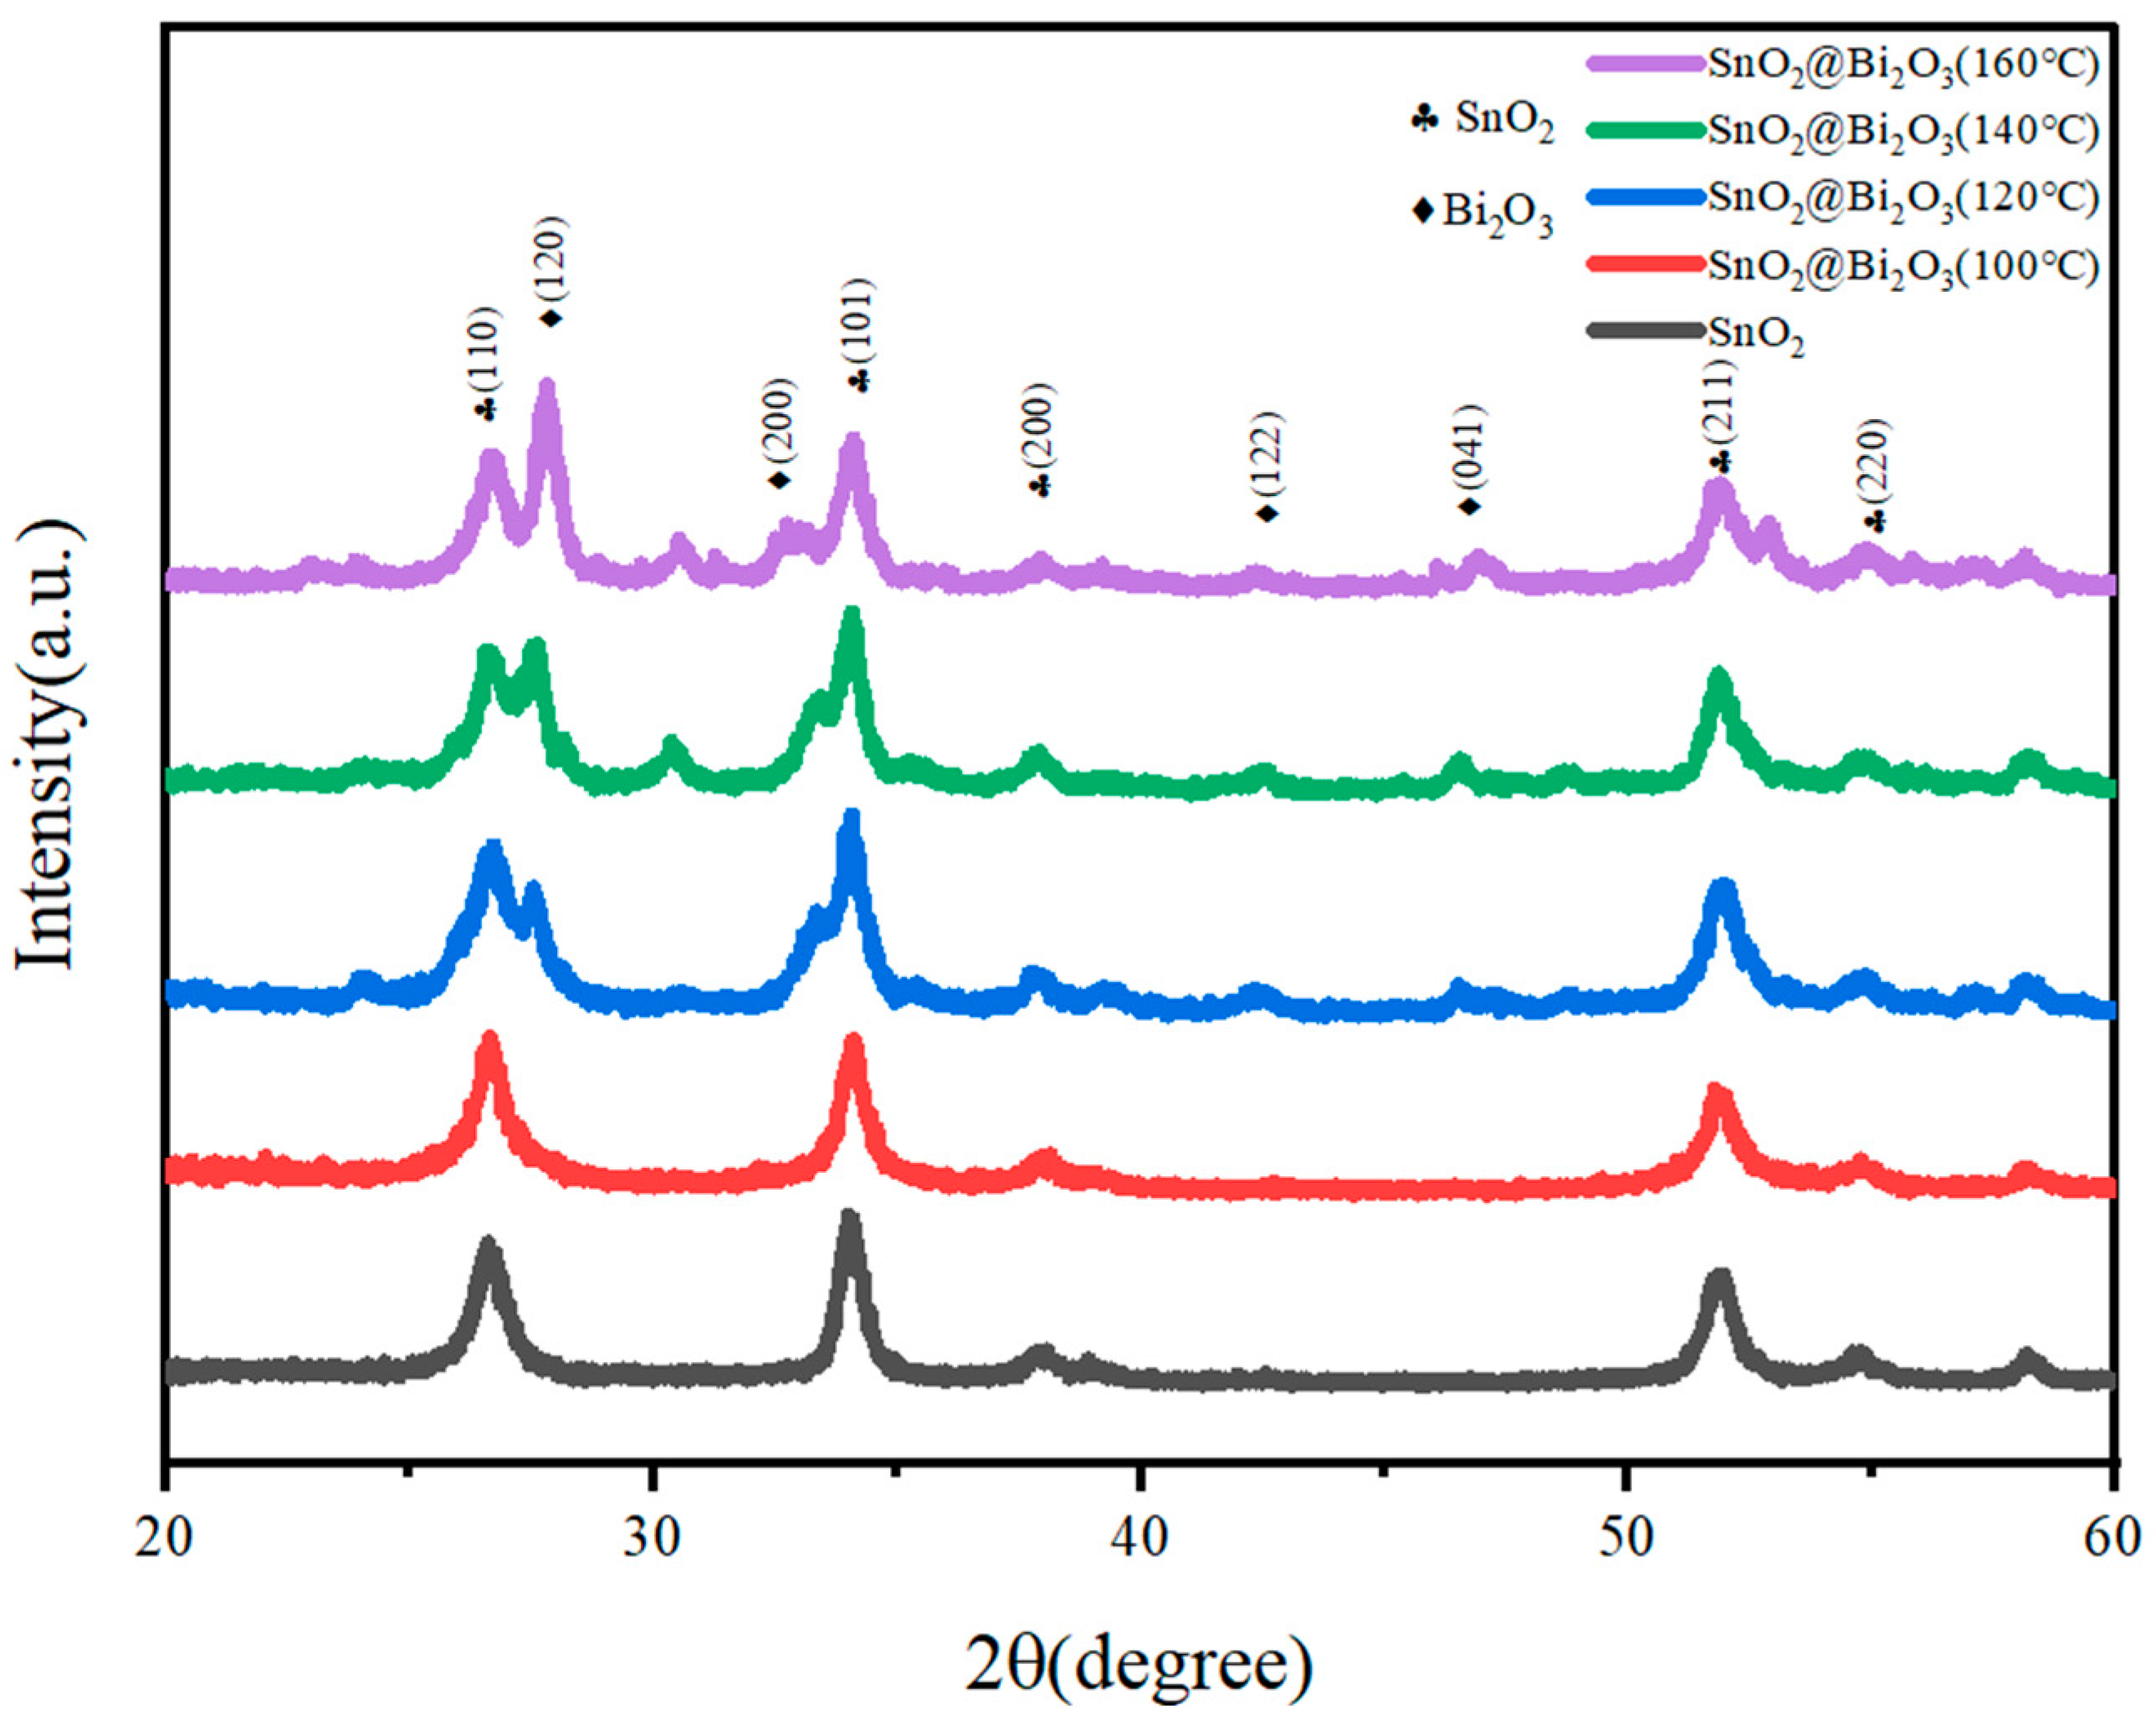
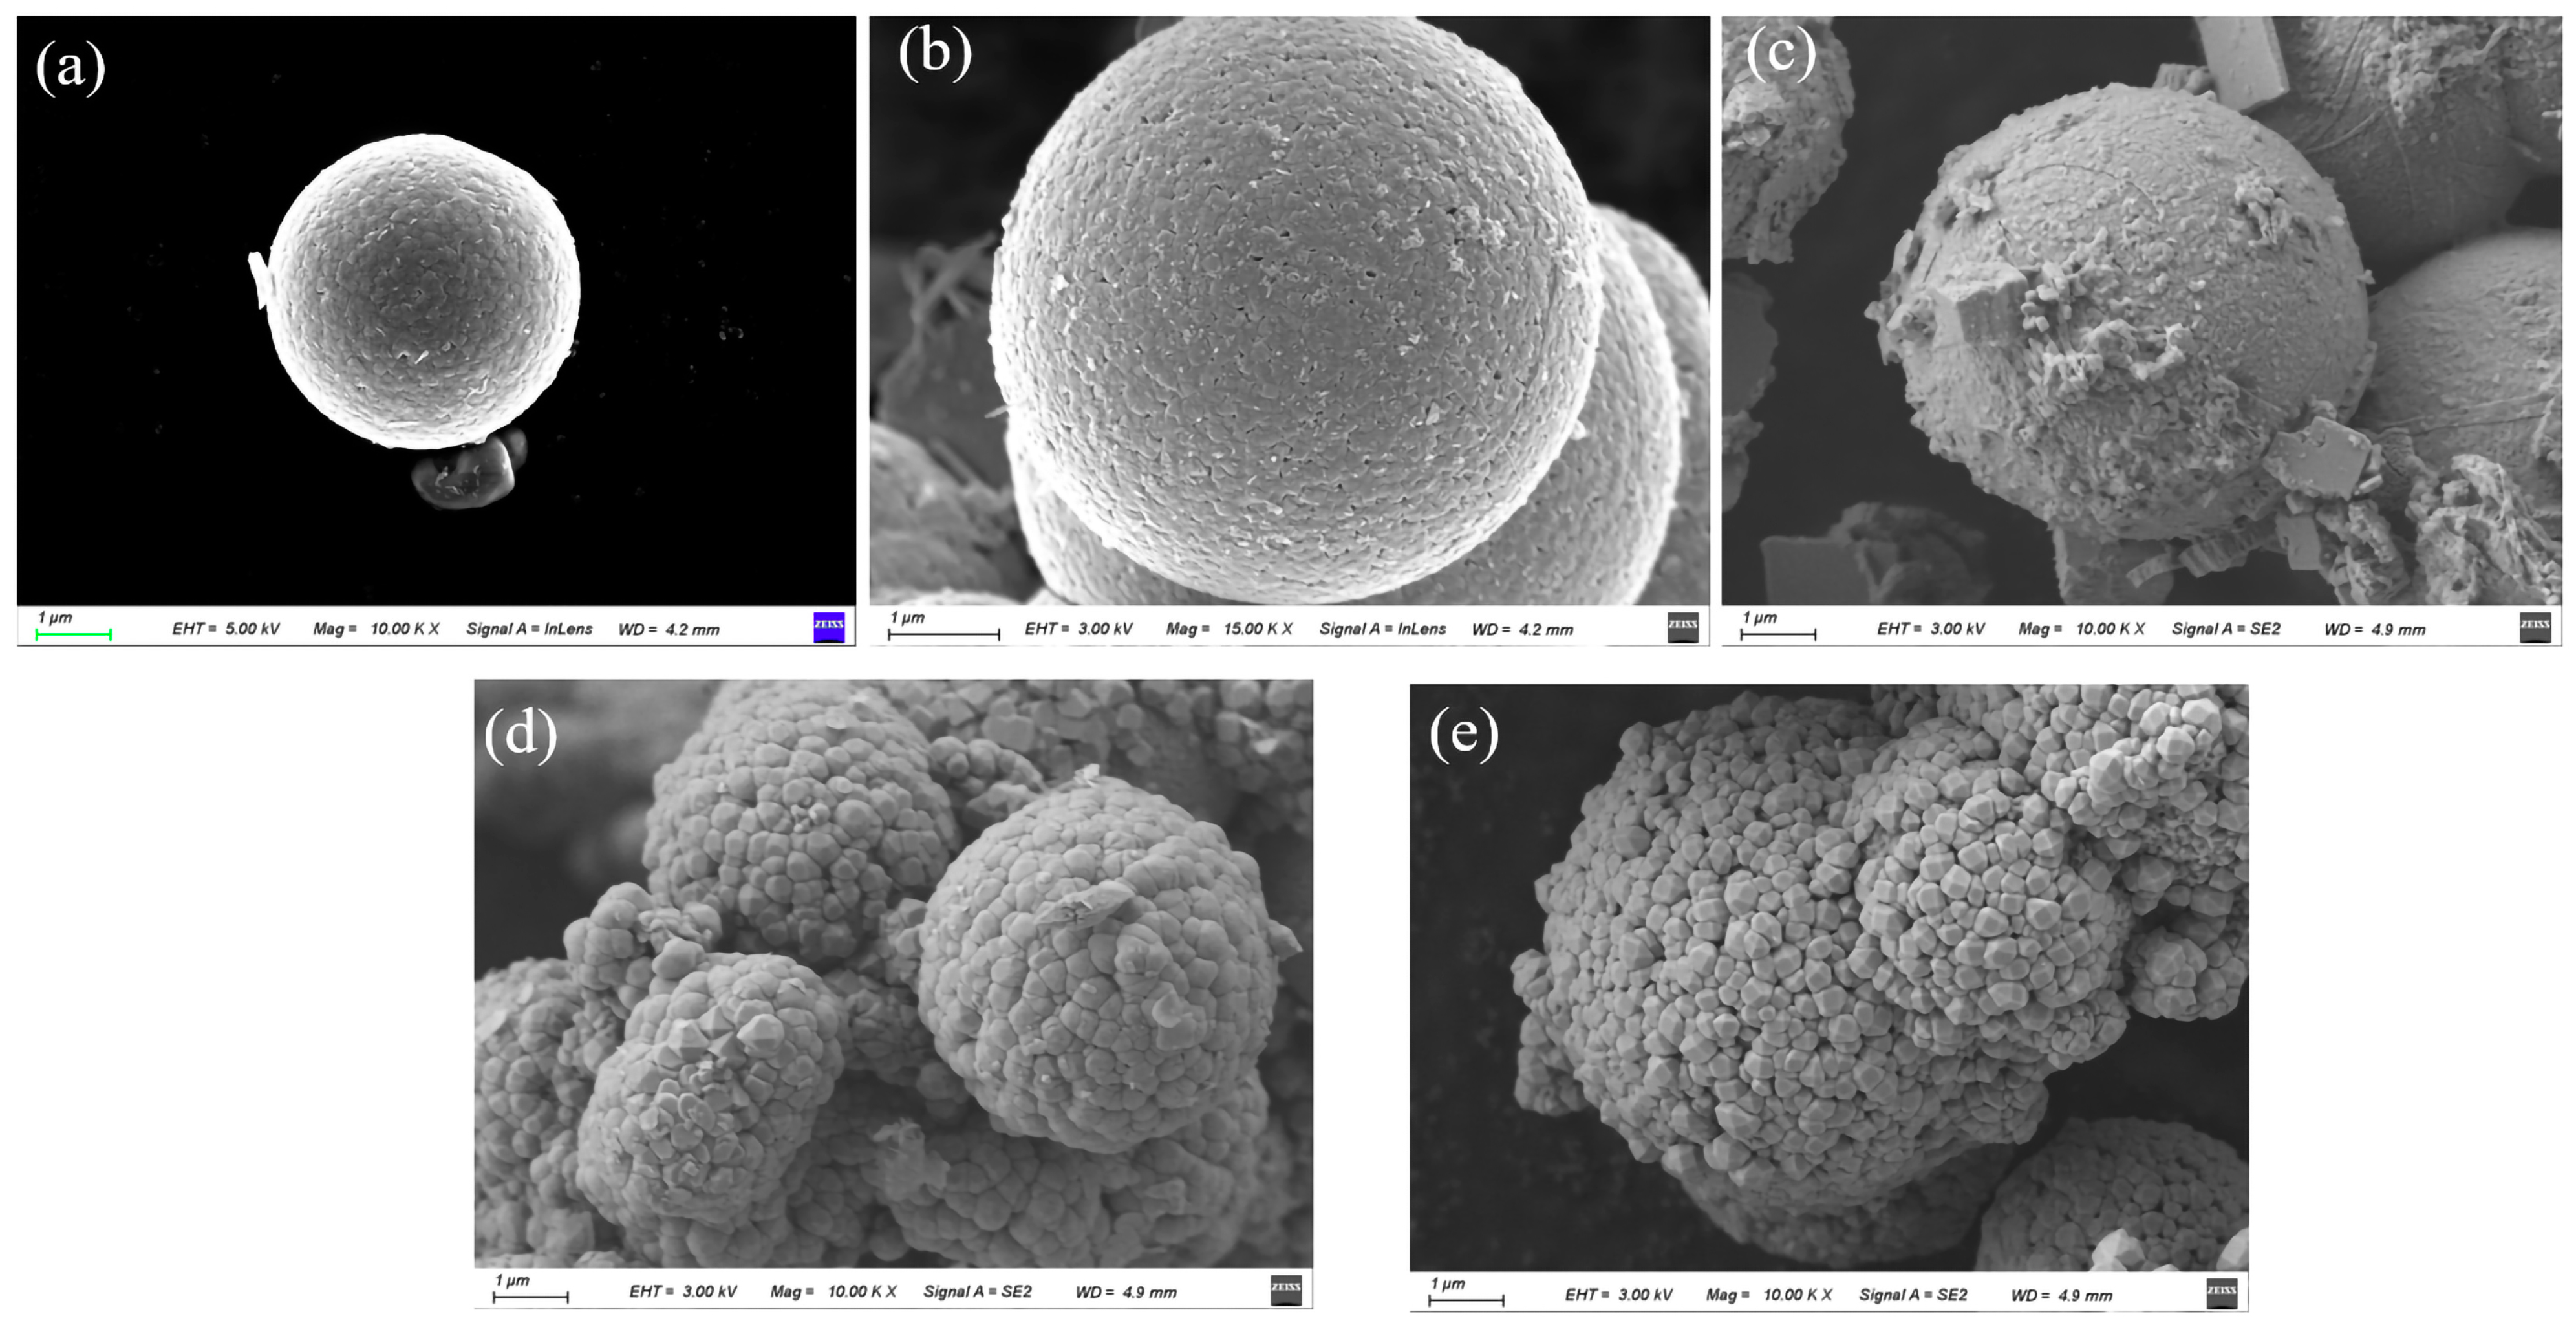
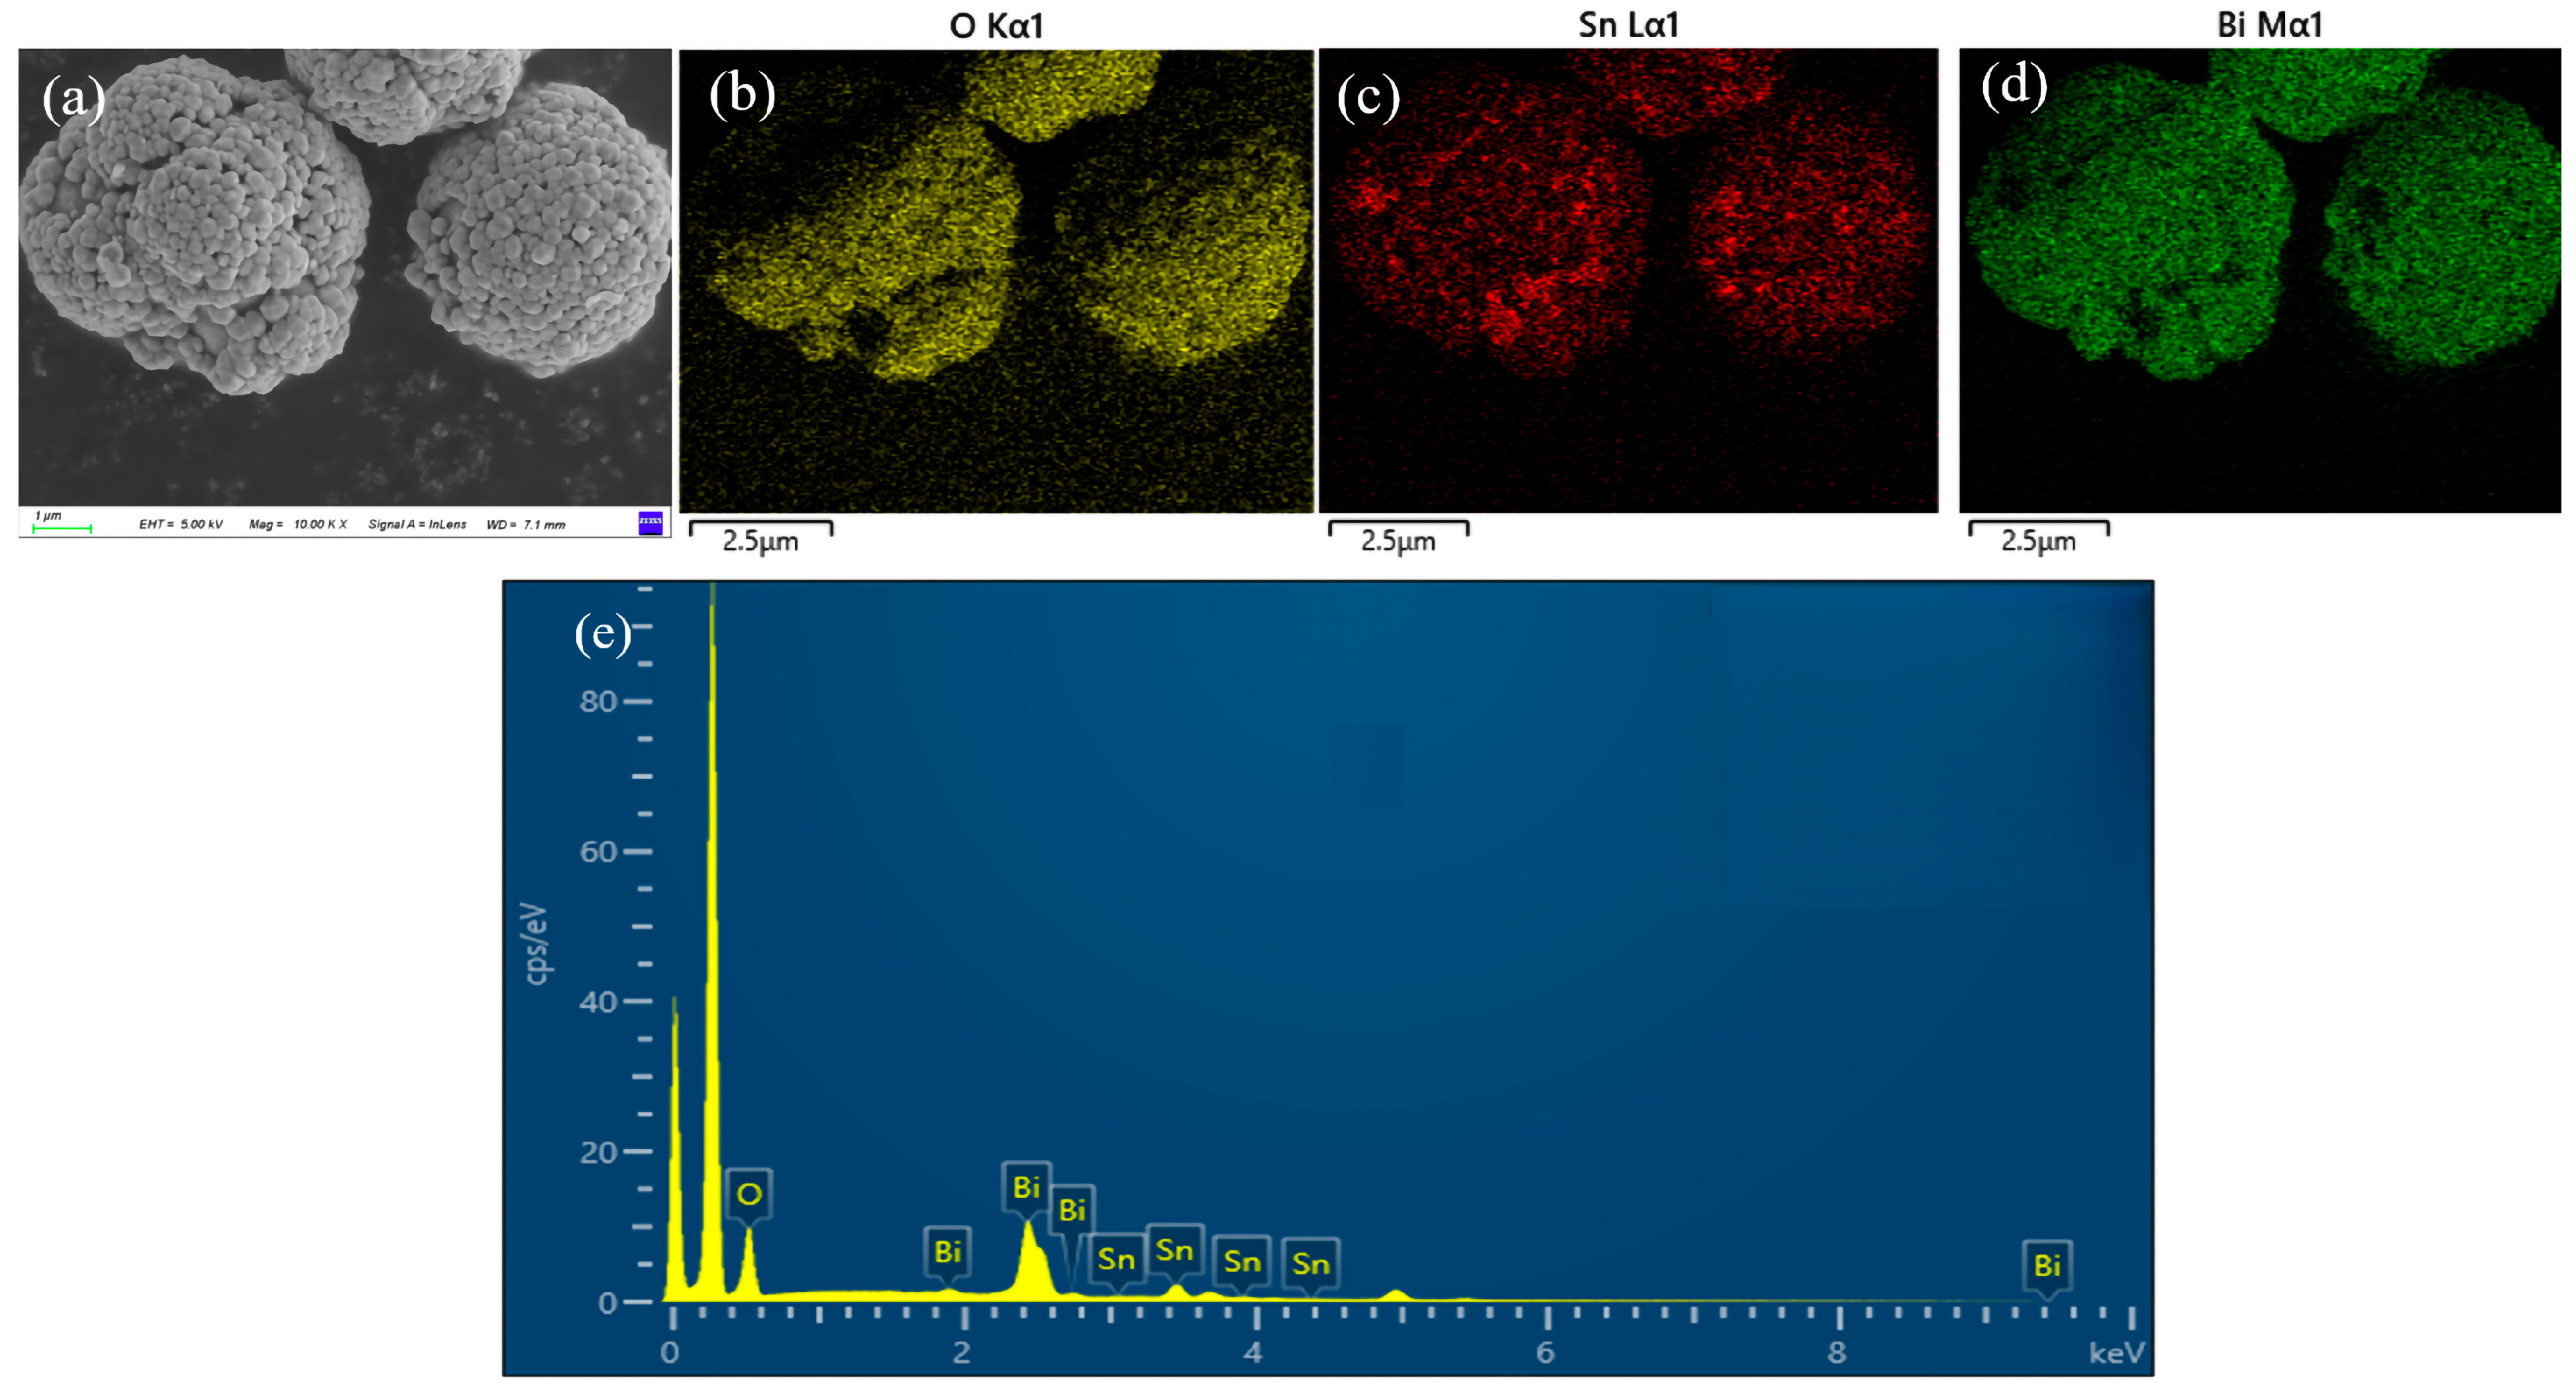
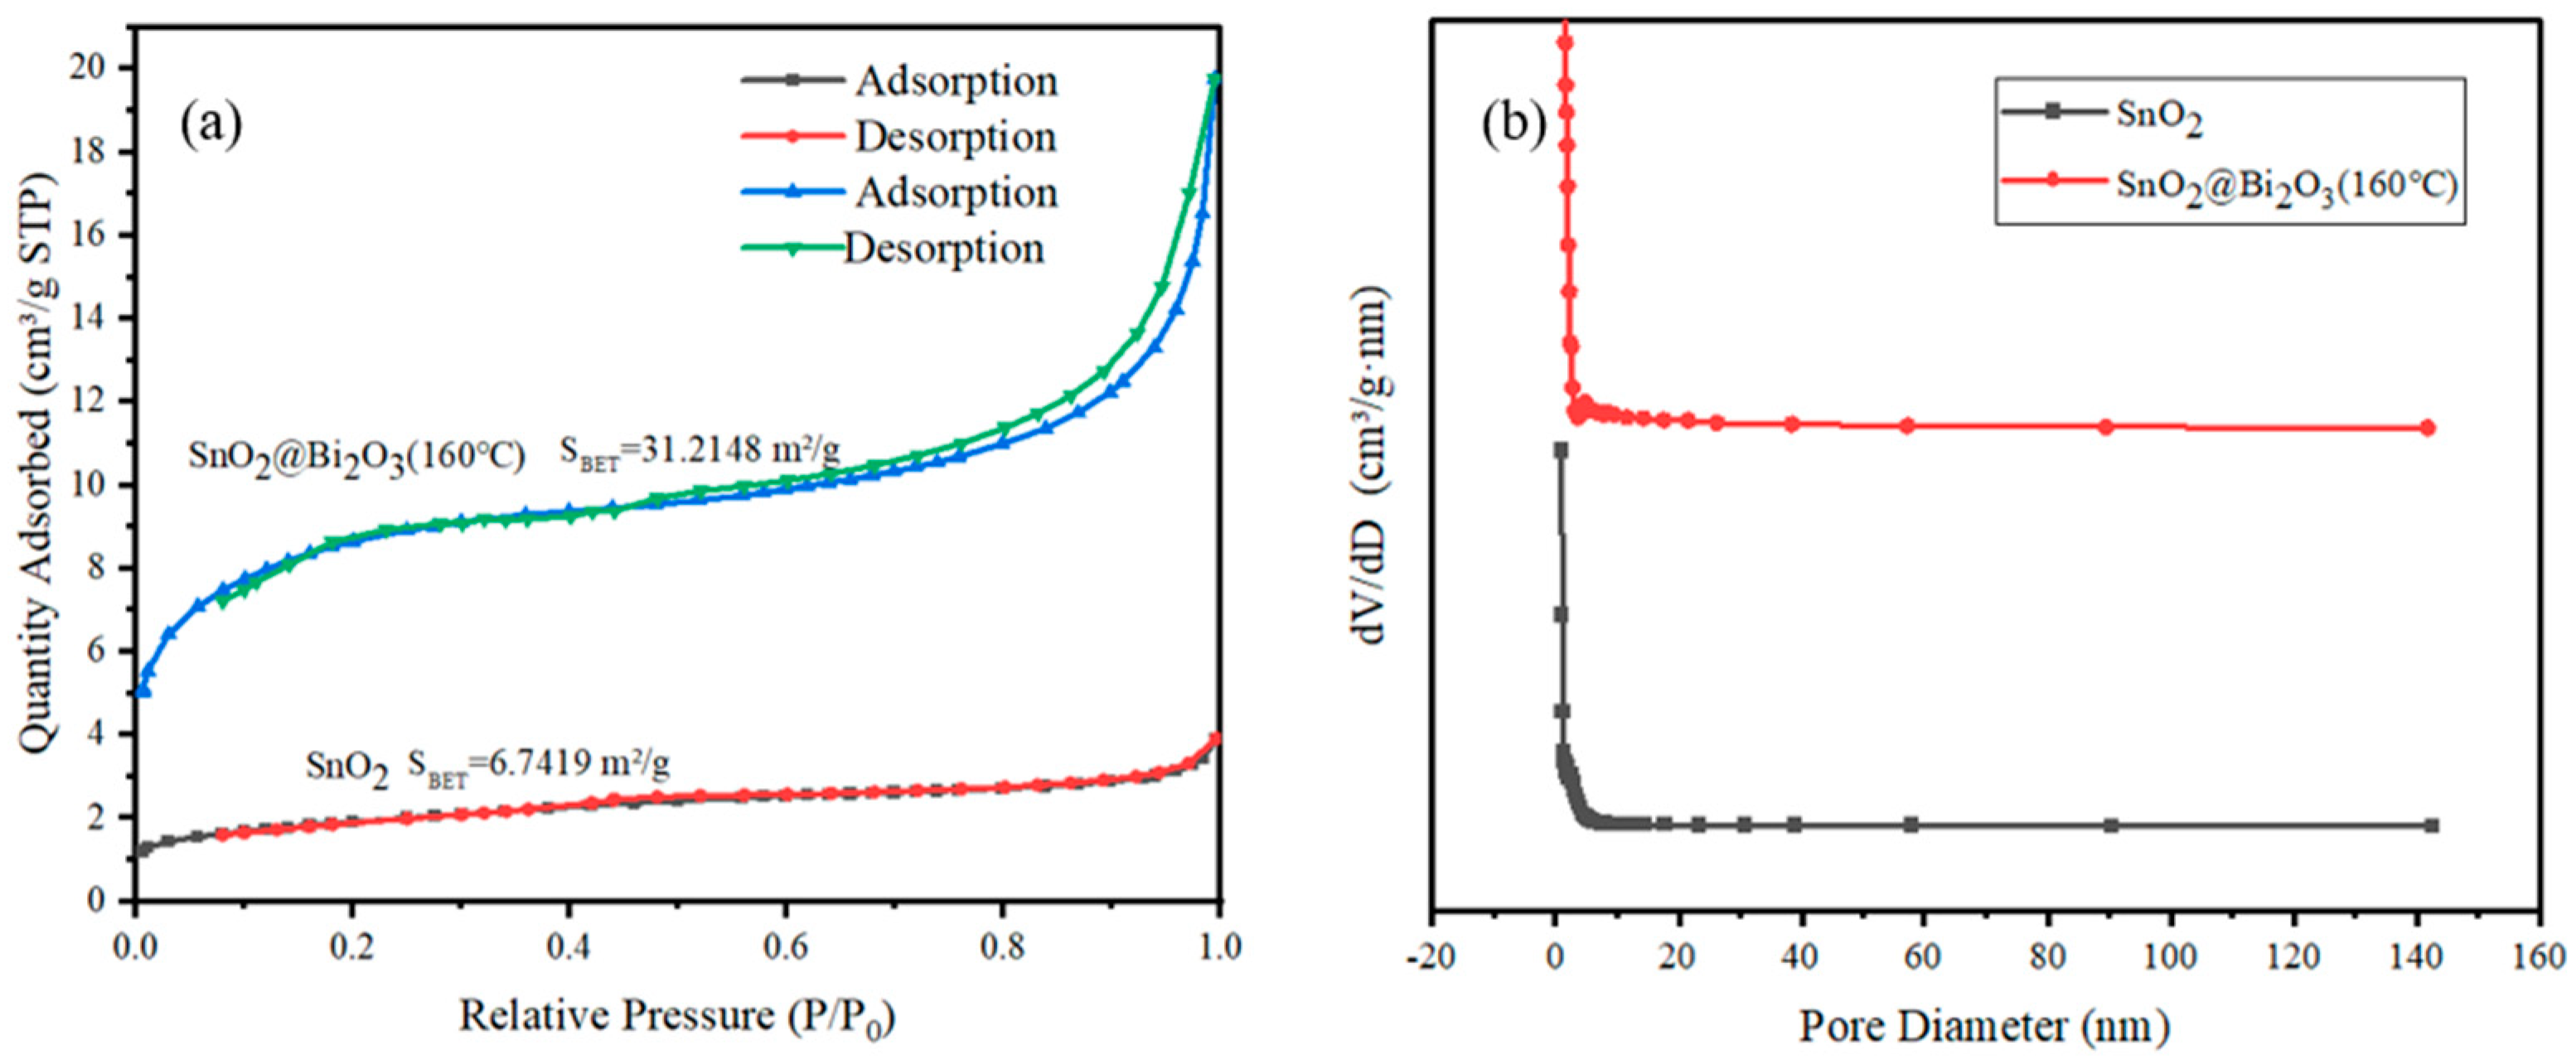
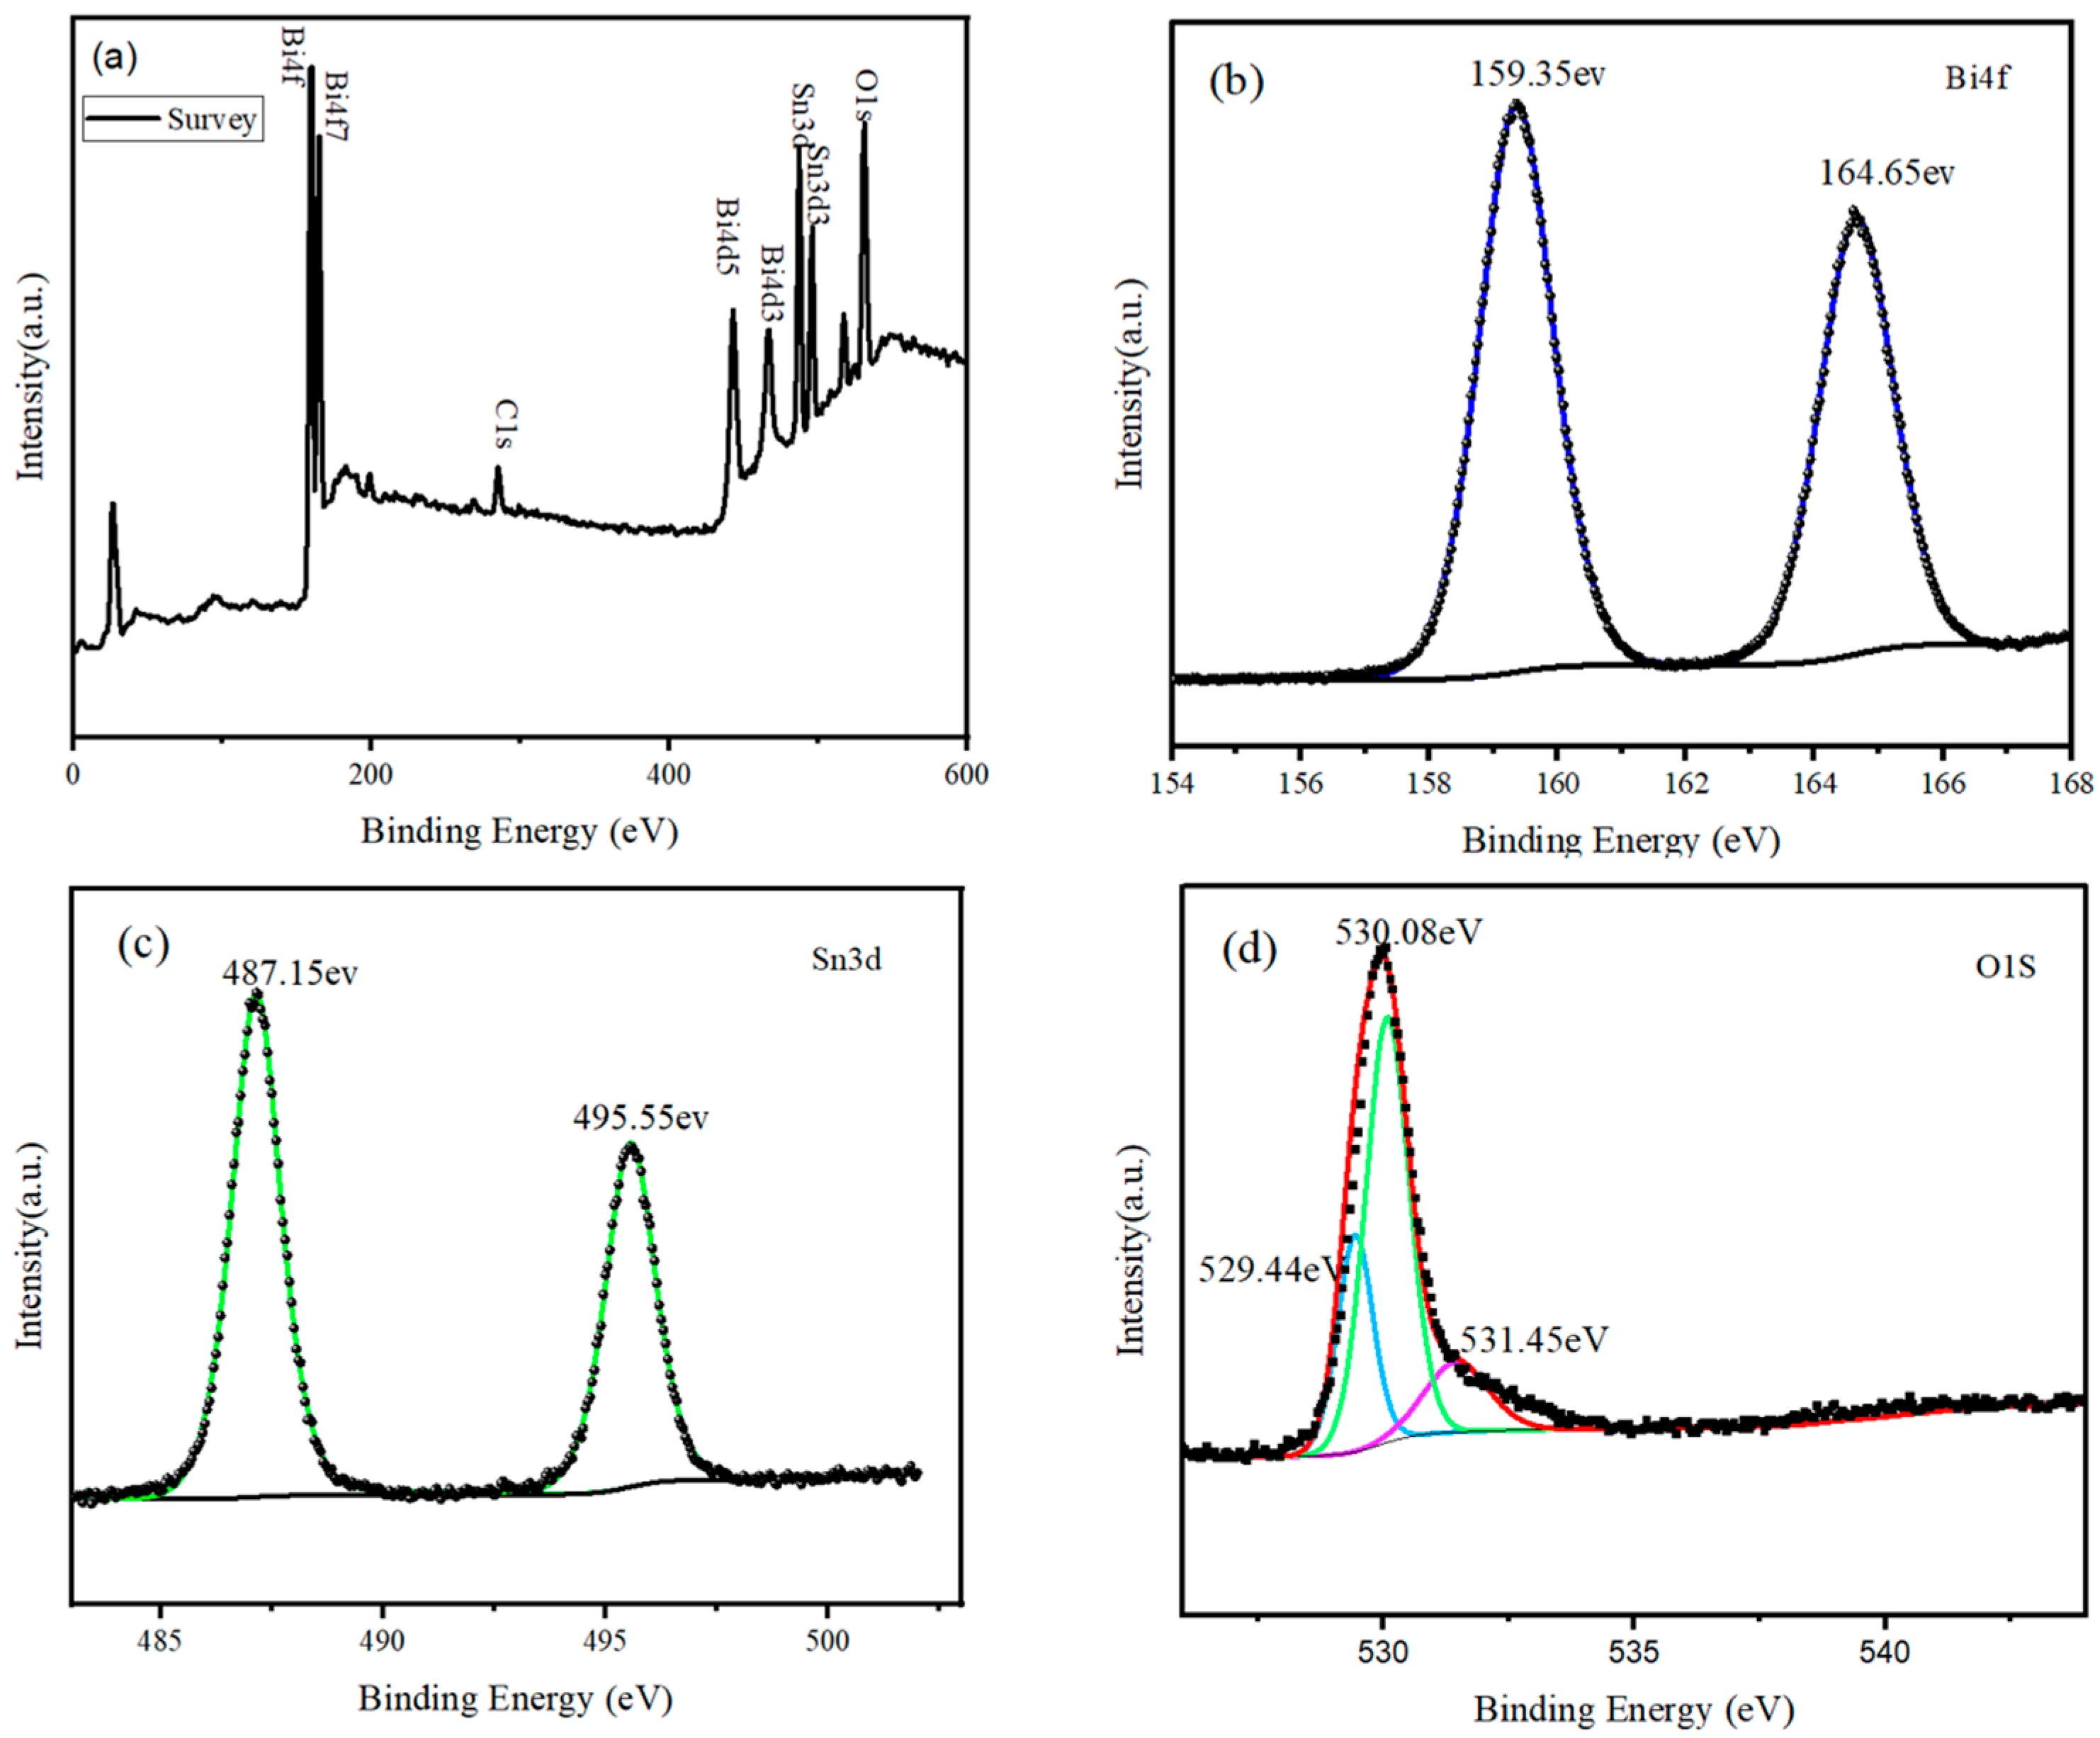
3.1. Characterization of the SnO2@Bi2O3

The crystal structures of SnO2, SnO2@Bi2O3 (100 °C), SnO2@Bi2O3 (120 °C), SnO2@Bi2O3 (140 °C), and SnO2@Bi2O3 (160 °C) samples were analyzed by XRD, and the results are presented in Figure 1. As shown in the figure, the XRD peaks of the synthesized SnO2 powder were observed at 2θ = 26.709°, 34.294°, 37.911°, and 52.03°, corresponding to the (110), (101), (200), and (211) planes of the tetragonal phase SnO2 (JCPDS No. 41-1445). This indicates that the SnO2 synthesized by the hydrothermal method possesses high purity and good crystallinity. For the SnO2@Bi2O3 composite material, the diffraction peaks not only include those of tetragonal SnO2 but also exhibit additional peaks at 2θ = 27.526°, 33.419°, and 46.474°, which correspond to the (120), (200), and (122) planes of Bi2O3 (JCPDS No. 41-1449). This confirms that the prepared material is indeed SnO2@Bi2O3. Moreover, the intensity of the Bi2O3 diffraction peaks increased with the reaction temperature, indicating improved crystallinity or higher Bi2O3 content in the SnO2@Bi2O3 composite.
The morphology and microstructure of the SnO2@Bi2O3 composite materials were further investigated using SEM. As shown in Figure 2a, pure SnO2 exhibits a typical spherical structure with a rough surface and an average diameter of approximately 4 µm. Figure 2b shows the SnO2@Bi2O3 composite synthesized at 100 °C, where a small amount of Bi2O3 is sparsely distributed on the SnO2 surface. This could be attributed to the fact that at low temperatures, the Bi2O3 grains are relatively small and not fully crystallized, existing predominantly in an amorphous or poorly crystallized state. As the temperature increased to 120 °C, Bi2O3 gradually formed sheet-like and flocculent structures, partially covering the SnO2 surface (Figure 2c). The increase in temperature promotes further crystallization of Bi2O3 and may lead to the formation of two-dimensional structures, such as sheet-like shapes, through self-assembly. The formation of these sheet-like structures can be attributed to the differences in crystal surface energy and growth rates, causing Bi2O3 to preferentially grow along specific crystal planes, resulting in sheet-like or flocculent morphologies. When the temperature was further elevated to 140 °C (Figure 2d), the morphology of Bi2O3 underwent a significant change, with the sheet-like and flocculent structures disappearing and being replaced by well-defined polyhedral structures. The SnO2surface was almost completely covered by Bi2O3, with the coverage becoming more uniform, though some residual sheet-like structures remained. At 160 °C (Figure 2e), the sheet-like Bi2O3 structures completely disappeared, and the surface morphology transformed into uniform polyhedron, resulting in a fully encapsulated structure, consistent with the XRD results. This transformation may be related to the rearrangement of crystals, crystal plane growth, and self-assembly mechanisms at high temperatures. At elevated temperatures, the solubility and diffusion rate of Bi2O3 increase, facilitating the crystal growth and optimized arrangement of Bi2O3 grains, driving the transition from sheet-like structures to polyhedral morphologies. The interfacial interaction between the SnO2 surface and Bi2O3 also promotes the uniform coating of Bi2O3, thereby forming stable polyhedral nanoparticles.
EDS mapping of the SnO2@Bi2O3 sample prepared at 160 °C was performed to determine the distribution and content of elements on the sample surface. As shown in Figure 3b–d, oxygen (O, yellow), tin (Sn, red), and bismuth (Bi, green) are uniformly distributed across the sample surface. Further quantitative analysis of the elemental composition (Figure 3e and Table 1) revealed that the sample contains 79.3% O, 14.6% Bi, and 6.1% Sn. Additionally, no other elements were detected, indicating that the prepared sample is composed of SnO2@Bi2O3 composite material, which is consistent with the results of XRD and SEM analyses.
The structure and specific surface area of materials are key factors affecting their gas sensitivity performance. Increasing the contact area between gas-sensitive materials and gasses can enhance the oxygen adsorption capacity on the material surface. In this study, both the SnO2@Bi2O3 (160 °C) composite material and pure SnO2 were tested using BET and BJH methods. As shown in Figure 4a, the adsorption–desorption isotherms of the SnO2@Bi2O3 (160 °C) composite material can be classified as Type IV, while those of SnO2 can be classified as Type II. Figure 4b shows the pore size distribution curves for both SnO2@Bi2O3 (160 °C) and pure SnO2, with the main peaks occurring at 2–4 nm. Table 2 presents the BET data for both SnO2@Bi2O3 (160 °C) and SnO2, where the specific surface area of SnO2@Bi2O3 (160 °C) is 31.2148 m2/g, approximately 5 times that of the pure SnO2 nanospheres (6.7419 m2/g). This indicates that the SnO2@Bi2O3 composite material prepared in this study has a larger specific surface area, enhancing the rate of electron exchange between ethanol gas and the semiconductor material, thus creating favorable conditions for the adsorption, diffusion, and reaction of the test gas. The average pore diameter of SnO2@Bi2O3 (160 °C) is about 2.9790 nm, slightly larger than that of SnO2 at 2.8669 nm. The pore volume of SnO2@Bi2O3 (160 °C) is 0.020202 cm3/g, significantly greater than that of SnO2 at 0.004116 cm3/g, corresponding to its higher specific surface area, suggesting that the material provides more pore space for gas adsorption.
The chemical states and surface composition of the SnO2@Bi2O3 composite prepared at 160 °C were analyzed using XPS, as shown in Figure 5. The survey spectrum (Figure 5a) reveals distinct peaks corresponding to Sn, O, and Bi elements, confirming their presence in the sample. The signal from C is attributed to calibration, with the C 1s peak at 284.8 eV used as the reference for calibration. Figure 5b shows the high-resolution Bi 4f spectrum, with peaks at binding energies of 159.35 eV and 164.65 eV, corresponding to Bi 4f7/2 and Bi 4f5/2, respectively, which are characteristic peaks of Bi3+ [25,26]. The high-resolution Sn 3d spectrum (Figure 5c) exhibits peaks at 487.15 eV and 495.55 eV, corresponding to Sn 3d5/2 and Sn 3d3/2, indicating that Sn exists in the form of Sn4+ in the composite [27,28]. Figure 5d presents the high-resolution O 1s spectrum, which can be divided into three sub-peaks with binding energies at 529.44 eV, 530.08 eV, and 531.45 eV, corresponding to oxygen in Bi2O3 (blue), oxygen in SnO2 (green), and adsorbed oxygen (purple), respectively [29,30]. The XPS results further confirm that the SnO2@Bi2O3 composite consists of SnO2 and Bi2O3.

3.2. Gas-Sensing Performances

Metal oxide semiconductors require sufficient operating temperatures to activate the surface adsorption of oxygen and promote chemical reactions. Thus, the optimum operating temperature needs to be determined [31,32,33]. As shown in Figure 6a, the response of the SnO2@Bi2O3 sensor prepared at 160 °C to 100 ppm ethanol was tested over a temperature range of 50 °C to 300 °C. The response value increased with rising temperature and reached a maximum of 19.7 at 300 °C. This indicates that the optimum operating temperature of the SnO2@Bi2O3 (160 °C) sensor is 300 °C. High selectivity is a critical requirement for gas sensors to avoid interference from other gasses during the detection process. Thus, the selectivity of the SnO2@Bi2O3 (160 °C) sensor was tested at 300 °C against various gasses (including NO2, NH3, toluene, H2, and CO) at a concentration of 100 ppm, as shown in Figure 6b. The response values for NO2, CO, NH3, toluene, and H2 were 12.09, 12.9, 13.47, 16.63, and 11.08, respectively, which were all lower than the response value of 19.7 for ethanol. This demonstrates the excellent selectivity of the SnO2@Bi2O3 (160 °C) sensor. At the optimal operating temperature of 300 °C, the responses of SnO2 and SnO2@Bi2O3 composites prepared at different temperatures to 100 ppm ethanol gas were compared, as shown in Figure 6c. It can be observed that SnO2 exhibits the lowest response value, while SnO2@Bi2O3 (160 °C) shows the highest response value. According to Table 3, it is evident that the response value of SnO2 is approximately 9, whereas the response values of SnO2@Bi2O3 (100 °C), SnO2@Bi2O3 (120 °C), and SnO2@Bi2O3 (140 °C) were 9, 10.5, and 13.6, respectively. The highest response value of 19.7 was observed for SnO2@Bi2O3 (160 °C), significantly outperforming the other samples.
As shown in Figure 7a, the transient current curves of the SnO2@ Bi2O3 sensor prepared at 160 °C to ethanol gas at 300 °C indicate gas concentrations ranging from 5 ppm to 100 ppm. It can be observed from the figure that as the ethanol gas concentration increases, the current of the SnO2@Bi2O3 (160 °C) sensor shows a continuous upward trend, reaching a maximum value of approximately 32 nA at 100 ppm ethanol gas. The response and recovery characteristics of the SnO2@Bi2O3 (160 °C) sensor to 100 ppm ethanol at 300 °C are shown in Figure 7b. The response and recovery times were 4 s and 11 s, respectively, demonstrating the sensor’s fast response and recovery capabilities. Figure 7c presents the transient current curves of the SnO2@Bi2O3 (160 °C) sensor over ten cycles for 100 ppm ethanol at 300 °C. The analysis indicates that the current of the SnO2@Bi2O3 (160 °C) sensor remained stable over time, with negligible fluctuations, consistently maintaining a value of approximately 32 nA. This result demonstrates the excellent repeatability of the sensor.
Figure 8a shows the response of the SnO2@Bi2O3 (160 °C) sensor to the target gas (ethanol) and interfering gasses (NO2, NH3, toluene, H2, and CO) at a concentration of 5 ppm. The decision to test these gasses at low concentrations is based on the fact that ethanol is typically derived from chemical production, while other gasses (NO2, NH3, toluene, H2, and CO) are often produced by industrial emissions. These gasses may coexist in the environment, and ethanol leaks in the environment generally occur at low concentrations. However, when mixed with other gasses, the accuracy of detection could be affected. Therefore, the sensor’s response to these gasses was tested at a low concentration of 5 ppm.
At 300 °C, the SnO2@Bi2O3 (160 °C) sensor showed a response value of 13.6 to 5 ppm ethanol gas, while its response values to other interfering gasses (NO2, NH3, toluene, H2, and CO) at the same concentration were 6.91, 6.75, 1.5, 1.1, and 1.23, respectively. It can be observed that the sensor’s response to the target gas ethanol is significantly higher than its response to the interfering gasses. This indicates that even under low concentration conditions, the SnO2@Bi2O3 (160 °C) sensor can effectively detect ethanol gas. Figure 8b shows the test results of the SnO2@Bi2O3 (160 °C) sensor within the ethanol concentration range of 1–5 ppm. It can be observed that the sensor has no response below 1 ppm, but begins to respond at 1 ppm, with a response value of 1.21, indicating a detection limit of 1 ppm. According to Table 4, the response values remain stable at approximately 1.21 in the range of 1 ppm to 1.4 ppm but increase significantly to 1.562 at 1.5 ppm, demonstrating a resolution of 0.5 ppm for the SnO2@Bi2O3 (160 °C) sensor.

3.3. Gas Sensing Mechanism

SnO2 is a typical n-type semiconductor metal oxide that follows the gas sensing mechanism of n-type semiconductors. The adsorption and desorption of target gas molecules on the surface of SnO2 cause changes in its resistance [34]. When the SnO2 sensor is exposed to air at its optimal operating temperature, a large amount of oxygen is adsorbed onto the material’s surface. At this point, some conduction band electrons transfer to the adsorbed oxygen, existing in the form of O, forming a thick depletion layer [35,36,37,38]. As a result, the potential barrier is higher, the resistance increases, and the current decreases. The specific reaction process is as follows:
O 2 ( g a s ) O 2 ( a d s )
O 2 ( a d s ) + e O 2 ( a d s ) , T < 100  ° C
O 2 a d s + e 2 O , 100 ° C T 300  ° C
When the SnO2 sensor comes into contact with ethanol (C2H5OH) gas, the adsorbed oxygen on the surface reacts with C2H5OH to produce CO2 and H2O, as shown in Figure 9a. In this process, electrons return to the conduction band of the sensing material, thinning the depletion layer, thereby reducing the sensor’s resistance and increasing the current. The reaction equation is as follows:
C 2 H 5 O H + 6 O 2 C O 2 + 3 H 2 O + 6 e
When the sensor is returned to normal air from the tested gas, oxygen re-adsorbs onto the surface of SnO2, and the conduction band electrons exist again in the form of O, causing the resistance to increase and the current to decrease.
The enhanced sensitivity of the SnO2@Bi2O3 composite material to ethanol gas may be attributed to the heterojunction effect [39,40,41]. Based on the grain boundary potential barrier model, Figure 9b shows that SnO2 and Bi2O3 materials have different Fermi energy levels. When SnO2 is combined with Bi2O3 to form an n-p heterojunction, electrons flow from the Fermi level of SnO2 (which is higher) to the Fermi level of Bi2O3 (which is lower) until a dynamic equilibrium is reached. At this point, the energy bands of SnO2 and Bi2O3 bend in the space charge region of the n-p junction, forming a potential barrier. Figure 9c illustrates that when the SnO2@Bi2O3 heterostructure is exposed to reducing ethanol gas, ethanol reacts with the oxygen adsorbed (O) on the surface of SnO2, releasing a large number of electrons. These electrons are injected into the conduction band of SnO2, lowering its resistance. Simultaneously, some electrons diffuse to the p-type Bi2O3 interface, causing electron–hole recombination and reducing the hole concentration in Bi2O3, which further decreases the thickness of the depletion layer and the height of the interface potential barrier. Moreover, ethanol gas may also directly react with the holes on the surface of Bi2O3, releasing more electrons. These electrons are transferred to the conduction band of SnO2, further reducing the overall resistance of the composite material and increasing the current. Ultimately, the synergistic effects of these processes significantly enhance the sensitivity of the SnO2@Bi2O3 heterojunction material to ethanol gas [42,43,44,45].

4. Conclusions

In summary, this study successfully prepared SnO2@Bi2O3 heterostructures via a simple hydrothermal method and evaluated their gas-sensing performance. As the hydrothermal temperature increases, the content of Bi2O3 coated on the surface of SnO2 spheres gradually increases, and the diameter of the Bi2O3 nanoparticles also increases. When the hydrothermal temperature reaches 160 °C, the SnO2 spheres are completely coated with Bi2O3 nanoparticles. The test results demonstrated that the SnO2@Bi2O3 heterostructure exhibited excellent sensitivity to ethanol gas. At 300 °C, the response value of SnO2@Bi2O3 (160 °C) to 100 ppm ethanol reached 19.7, with response and recovery times of 4 s and 11 s, respectively. The composite material also showed excellent repeatability. Based on the characterization results, the performance enhancement was attributed to the presence of p-n heterojunctions on the material surface. Therefore, the SnO2@Bi2O3 heterostructure provides a promising strategy for ethanol gas detection and sensor development.

Author Contributions

Conceptualization, J.L. and Y.G.; formal analysis, J.L. and Y.L.; investigation, Y.G. and J.L.; writing—original draft preparation, Y.G.; writing—review and editing, Y.G., Y.L. and M.Y.; visualization, H.G., N.L. and D.B.; supervision, A.W.; projection administration, J.L. and Y.L.; funding acquisition, J.L. and Y.L. All authors have read and agreed to the published version of the manuscript.

Funding

This research was funded by National Natural Youth Science Foundation of China (Grant number: 62205269), Education Department of Shaanxi Province Natural Special Project (Grant number: 22JK0467), Xi’an Beilin District Science and Technology Project (Grant number: GX2230), Natural Science Basic Research Plan in Shaanxi Province of China (Grant number: 2023-JC-YB-595), Science and Technology Program of Xi’an, China (Grant number: 24GXF0048).

Data Availability Statement

The data provided in this study are available from the corresponding author.

Conflicts of Interest

The authors declare no conflicts of interest.

References

  1. Reddy, P.A.K.; Reddy, P.V.L.; Kwon, E.; Kim, K.-H.; Akter, T.; Kalagara, S. Recent advances in photocatalytic treatment of pollutants in aqueous media. Environ. Int. 2016, 91, 94–103. [Google Scholar] [CrossRef]
  2. Krishna, K.G.; Parne, S.; Pothukanuri, N.; Kathirvelu, V.; Gandi, S.; Joshi, D. Nanostructured metal oxide semiconductor-based gas sensors: A comprehensive review. Sens. Actuators A 2022, 341, 113578. [Google Scholar] [CrossRef]
  3. Pasupuleti, K.S.; Reddeppa, M.; Chougule, S.S.; Bak, N.-H.; Nam, D.-J.; Jung, N.; Cho, H.D.; Kim, S.-G.; Kim, M.-D. High performance langasite based SAW NO2 gas sensor using 2D g-C3N4@TiO2 hybrid nanocomposite. J. Hazard. Mater. 2022, 427, 128174. [Google Scholar] [CrossRef] [PubMed]
  4. Meng, X.; Bi, M.; Xiao, Q.; Gao, W. Ultrasensitive gas sensor based on Pd/SnS2/SnO2 nanocomposites for rapid detection of H2. Sens. Actuators B 2022, 359, 131612. [Google Scholar] [CrossRef]
  5. Yu, H.M.; Li, J.Z.; Luo, W.B.; Li, Z.Y.; Tian, Y.W.; Yang, Z.D.; Gao, X.W.; Liu, H. Hetero-structure La2O3-modified SnO2–Sn3O4 from tin anode slime for highly sensitive and ppb-Level formaldehyde detection. Appl. Surf. Sci. 2020, 513, 145825. [Google Scholar] [CrossRef]
  6. Xu, L.; Ge, M.Y.; Zhang, F.; Huang, H.J.; Sun, Y.; He, D.N. Nanostructured of SnO2/NiO composite as a highly selective formaldehyde gas sensor. J. Mater. Res. 2020, 35, 3079–3090. [Google Scholar] [CrossRef]
  7. Liu, Z.; Sun, D.D.; Guo, P.; Leckie, J.O. An Efficient Bicomponent TiO2/SnO2 Nanofiber Photocatalyst Fabricated by Electrospinning with a Side-by-Side Dual Spinneret Method. Nano Lett. 2007, 7, 1081–1085. [Google Scholar] [CrossRef]
  8. Tennakone, K.; Bandara, J.; Bandaranayake, P.K.M.; Kumara, G.R.A.; Konno, A. Enhanced Efficiency of a Dye-Sensitized Solar Cell Made from MgO-Coated Nanocrystalline SnO2. Jpn. J. Appl. Phys. 2001, 40, 732. [Google Scholar] [CrossRef]
  9. Liu, J.; Dai, M.; Wang, T.; Sun, P.; Liang, X.; Lu, G.; Shimanoe, K.; Yamazoe, N. Enhanced Gas Sensing Properties of SnO2 Hollow Spheres Decorated with CeO2 Nanoparticles Heterostructure Composite Materials. ACS Appl. Mater. Interfaces 2016, 8, 6669–6677. [Google Scholar] [CrossRef] [PubMed]
  10. Jiang, J.; Shi, L.; Xie, T.; Wang, D.; Lin, Y. Study on the Gas-Sensitive Properties for Formaldehyde Based on SnO2-ZnO Heterostructure in UV Excitation. Sens. Actuators B Chem. 2018, 254, 863–871. [Google Scholar] [CrossRef]
  11. Huang, H.; Gong, H.; Chow, C.L.; Guo, J.; White, T.J.; Tse, M.S.; Tan, O.K. Low-Temperature Growth of SnO2 Nanorod Arrays and Tunable n-p-n Sensing Response of a ZnO/SnO2 Heterojunction for Exclusive Hydrogen Sensors. Adv. Funct. Mater. 2011, 21, 2680–2686. [Google Scholar] [CrossRef]
  12. Liu, D.; Tang, Z.L.; Zhang, Z.T. Visible Light Assisted Room-Temperature NO2 Gas Sensor Based on Hollow SnO2@SnS2 Nanostructures. Sens. Actuators B Chem. 2020, 324, 128754. [Google Scholar] [CrossRef]
  13. Ju, D.; Xu, H.; Xu, Q.; Gong, H.; Qiu, Z.; Guo, J.; Zhang, J.; Cao, B. High Triethylamine-Sensing Properties of NiO/SnO2 Hollow Sphere P–N Heterojunction Sensors. Sens. Actuators B Chem. 2015, 215, 39–44. [Google Scholar] [CrossRef]
  14. Kim, J.-H.; Lee, J.-H.; Mirzaei, A.; Kim, H.W.; Kim, S.S. Optimization and Gas Sensing Mechanism of n-SnO2-p-Co3O4 Composite Nanofibers. Sens. Actuators B Chem. 2017, 248, 500–511. [Google Scholar] [CrossRef]
  15. Zhang, B.W.; Fu, W.Y.; Li, H.Y.; Fu, X.L.; Wang, Y.; Bala, H.; Sun, G.; Wang, X.D.; Wang, Y.; Cao, J.L.; et al. Actinomorphic ZnO/SnO2 Core-Shell Nanorods: Two-Step Synthesis and Enhanced Ethanol Sensing Properties. Mater. Lett. 2015, 160, 227–230. [Google Scholar] [CrossRef]
  16. Chen, K.; Chen, S.; Pi, M.; Zhang, D. SnO2 Nanoparticles/TiO2 Nanofibers Heterostructures: In Situ Fabrication and Enhanced Gas Sensing Performance. Solid State Electron. 2019, 157, 42–47. [Google Scholar] [CrossRef]
  17. Sardar, K.; Fang, T.; Yang, T.W. A novel route involving an in situ chemical reduction process to the one-dimensional nanostructures of bismuth trioxide. J. Am. Ceram. Soc. 2007, 90, 4033–4035. [Google Scholar] [CrossRef]
  18. Bonyani, M.; Lee, J.K.; Sun, G.-J.; Lee, S.; Ko, T.; Lee, C. Benzene sensing properties and sensing mechanism of Pd-decorated Bi2O3-core/ZnO-shell nanorods. Thin Solid Films 2017, 636, 257–266. [Google Scholar] [CrossRef]
  19. Chen, Q.; Tan, X.; Dastan, D.; Zhang, Z.; Liu, Z.; Yue, C.; Yang, Z.; Mu, Y.; Wang, X.; Chen, X.; et al. Ultrasensitive n-butanol gas sensor based on Bi2O3-In2O3 heterostructure. J. Alloys Compd. 2024, 1003, 175585. [Google Scholar] [CrossRef]
  20. Meng, X.; Kang, S.; Zhao, Z.; Jin, G.; Shao, Z.; Wu, L. Core-Shell Bi2O3/CeO2 heterojunction for enhanced formaldehyde gas sensor. Ceram. Int. 2024. [Google Scholar] [CrossRef]
  21. Devi, G.S.; Manorama, S.V.; Rao, V.J. SnO2/Bi2O3: A Suitable System for Selective Carbon Monoxide Detection. J. Electrochem. Soc. 1998, 145, 1039–1044. [Google Scholar] [CrossRef]
  22. Montenegro, A.; Ponce, M.; Castro, M.S.; Rodríguez-Paez, J.E. SnO2–Bi2O3 and SnO2–Sb2O3 Gas Sensors Obtained by Soft Chemical Method. J. Eur. Ceram. Soc. 2007, 27, 4143–4146. [Google Scholar] [CrossRef]
  23. Bang, J.H.; Choi, M.S.; Mirzaei, A.; Kwon, Y.J.; Kim, S.S.; Kim, T.W.; Kim, H.W. Selective NO₂ Sensor Based on Bi2O3 Branched SnO2 Nanowires. Sens. Actuators B Chem. 2018, 274, 356–369. [Google Scholar] [CrossRef]
  24. Yang, H.; Suematsu, K.; Mashiba, F.H.; Watanabe, K.; Shimanoe, K. Oxygenated VOC Detection Using SnO2 Nanoparticles with Uniformly Dispersed Bi2O3. Nanomaterials 2024, 14, 2032. [Google Scholar] [CrossRef] [PubMed]
  25. Sun, L.; Sun, J.; Han, N.; Liao, D.; Bai, S.; Yang, X. rGO decorated W doped BiVO4 novel material for sensing detection of trimethylamine. Sens. Actuators B 2019, 298, 126749. [Google Scholar] [CrossRef]
  26. Yu, C.F.; Wang, K.; Yang, P.Y.; Yang, S.N.; Lu, C.; Song, Y.Z.; Dong, S.Y.; Sun, J.Y.; Sun, J.H. One-pot facile synthesis of Bi2S3/SnS2/Bi2O3 ternary heterojunction as advanced double Z-scheme photocatalytic system for efficient dye removal under sunlight irradiation. Appl. Surf. Sci. 2017, 420, 233–242. [Google Scholar] [CrossRef]
  27. Bai, J.Z.; Shen, Y.B.; Zhao, S.K.; Li, A.; Kang, Z.K.; Cui, B.Y.; Wei, D.Z.; Yuan, Z.Y.; Meng, F.L. Room-Temperature NH3 Sensor Based on SnO2 Quantum Dots Functionalized SnS2 Nanosheets. Adv. Mater. Technol. 2023, 8, 2201671. [Google Scholar] [CrossRef]
  28. Kou, X.Y.; Meng, F.Q.; Chen, K.; Wang, T.S.; Sun, P.; Liu, F.M.; Yan, X.; Sun, Y.F.; Liu, F.M.; Shimanoe, K.; et al. High-performance acetone gas sensor based on Ru-doped SnO2 nanofibers. Sens. Actuators B 2020, 320, 128292. [Google Scholar] [CrossRef]
  29. Liu, H.; Du, C.; Li, M.; Zhang, S.; Bai, H.; Yang, L.; Zhang, S. One-Pot Hydrothermal Synthesis of SnO2/BiOBr Heterojunction Photocatalysts for the Efficient Degradation of Organic Pollutants Under Visible Light. ACS Appl. Mater. Interfaces 2018, 10, 28686–28694. [Google Scholar] [CrossRef]
  30. Meng, X.; Bi, M.; Gao, W. Shape and composition effects of PdPt bimetallic nanocrystals on hydrogen sensing properties of SnO2 based sensors. Sens. Actuators B 2023, 390, 133976. [Google Scholar] [CrossRef]
  31. Kaneti, Y.V.; Zhang, Z.; Yue, J.; Zakaria, Q.M.D.; Chen, C.; Jiang, X.; Yu, A. Crystal plane-dependent gas-sensing properties of zinc oxide nanostructures: Experimental and theoretical studies. Phys. Chem. Chem. Phys. 2014, 16, 11471–11480. [Google Scholar] [CrossRef] [PubMed]
  32. Bhattacharyya, P.; Basu, P.K.; Mondal, B.; Saha, H. A low power MEMS gas sensor based on nanocrystalline ZnO thin films for sensing methane. Microelectron. Reliab. 2008, 48, 1772–1779. [Google Scholar] [CrossRef]
  33. Massie, C.; Stewart, G.; McGregor, G.; Gilchrist, J.R. Design of a portable optical sensor for methane gas detection. Sens. Actuators B Chem. 2006, 113, 830–836. [Google Scholar] [CrossRef]
  34. Han, Z.J.; Qi, Y.; Yang, Z.Y.; Han, H.C.; Jiang, Y.Y.; Du, W.J.; Zhang, X.; Zhang, J.Z.; Dai, Z.F.; Wu, L.L.; et al. Recent advances and perspectives on constructing metal oxide semiconductor gas sensing materials for efficient formaldehyde detection. J. Mater. Chem. C 2020, 8, 13169–13188. [Google Scholar] [CrossRef]
  35. Shaalan, N.M.; Rashad, M.; Abdel-Rahim, M.A. Repeatability of indium oxide gas sensors for detecting methane at low temperature. Mater. Sci. Semicond. Process. 2016, 56, 260–264. [Google Scholar] [CrossRef]
  36. Lee, D.-D.; Chung, W.-Y.; Sohn, B.-K. High sensitivity and selectivity methane gas sensors doped with Rh as a catalyst. Sens. Actuators B Chem. 1993, 13, 252–255. [Google Scholar] [CrossRef]
  37. Haridas, D.; Gupta, V. Enhanced response characteristics of SnO2 thin film based sensors loaded with Pd clusters for methane detection. Sens. Actuators B Chem. 2012, 166–167, 156–164. [Google Scholar] [CrossRef]
  38. Shaalan, N.M.; Hamad, D. Low-temperature hydrogen sensor based on sputtered tin dioxide nanostructures through slow deposition rate. Appl. Surf. Sci. 2022, 598, 153857. [Google Scholar] [CrossRef]
  39. Liu, M.; Sun, R.Y.; Sima, Z.H.; Song, P.; Ding, Y.L.; Wang, Q. Au-decorated In2O3 nanospheres/exfoliated Ti3C2Tx MXene nanosheets for highly sensitive formaldehyde gas sensing at room temperature. Appl. Surf. Sci. 2022, 605, 154839. [Google Scholar] [CrossRef]
  40. Meng, D.; Liu, D.; Wang, G.; Shen, Y.; San, X.; Li, M.; Meng, F. Low-temperature formaldehyde gas sensors based on NiO-SnO2 heterojunction microflowers assembled by thin porous nanosheets. Sens. Actuators B Chem. 2018, 273, 418–428. [Google Scholar] [CrossRef]
  41. Chowdhuri, A.; Gupta, V.; Sreenivas, K.; Kumar, R.; Mozumdar, S.; Patanjali, P.K. Response speed of SnO2-based H2S gas sensors with CuO nanoparticles. Appl. Phys. Lett. 2004, 84, 1180–1182. [Google Scholar] [CrossRef]
  42. Xue, X.; Xing, L.; Chen, Y.; Shi, S.; Wang, Y.; Wang, T. Synthesis and H2S sensing properties of CuO−SnO2 core/shell pn-junction nanorods. J. Phys. Chem. C 2008, 112, 12157–12160. [Google Scholar] [CrossRef]
  43. Zhao, Y.; Zhang, J.; Wang, Y.; Chen, Z. A Highly Sensitive and Room Temperature CNTs/SnO2/CuO Sensor for H2S Gas Sensing Applications. Nanoscale Res. Lett. 2020, 15, 40. [Google Scholar] [CrossRef] [PubMed]
  44. Liu, Y.; Xiao, S.; Du, K. Chemiresistive Gas Sensors Based on Hollow Heterojunction: A Review. Adv. Mater. Interfaces 2021, 8, 2002122. [Google Scholar] [CrossRef]
  45. Tyagi, P.; Sharma, A.; Tomar, M.; Gupta, V. A comparative study of RGO-SnO2 and MWCNT-SnO2 nanocomposites based SO2 gas sensors. Sens. Actuators B Chem. 2017, 248, 980–986. [Google Scholar] [CrossRef]
Figure 1. XRD spectra of SnO2, SnO2@Bi2O3 (100 °C), SnO2@Bi2O3 (120 °C), SnO2@Bi2O3 (140 °C), and SnO2@Bi2O3 (160 °C).
Nanomaterials 15 00129 g001
Figure 2. SEM images of (a) SnO2, (b) SnO2@Bi2O3 (100 °C), (c) SnO2@Bi2O3 (120 °C), (d) SnO2@Bi2O3 (140 °C), and (e) SnO2@Bi2O3 (160 °C).
Nanomaterials 15 00129 g002
Figure 3. (a) SEM image of SnO2@Bi2O3 (160 °C); (bd) Elemental mapping images of O, Sn, and Bi, respectively; (e) EDS of SnO2@Bi2O3 (160 °C).
Nanomaterials 15 00129 g003
Figure 4. Nitrogen adsorption–desorption isotherms (a) and pore size distribution curves (b) for pure SnO2 and SnO2@Bi2O3 (160 °C).
Nanomaterials 15 00129 g004
Figure 5. XPS spectra of SnO2@Bi2O3 (160 °C): (a) Survey spectrum, (b) Bi 4f spectrum, (c) Sn 3d spectrum, and (d) O 1s spectrum.
Nanomaterials 15 00129 g005
Figure 6. (a) Response of SnO2@Bi2O3 (160 °C) to 100 ppm ethanol at different operating temperatures; (b) Selectivity of SnO2@Bi2O3 (160 °C) at 300 °C for various gasses; (c) Response of SnO2, SnO2@Bi2O3 (100 °C), SnO2@Bi2O3 (120 °C), SnO2@Bi2O3 (140 °C), and SnO2@Bi2O3 (160 °C) to 100 ppm ethanol at 300 °C.
Nanomaterials 15 00129 g006
Figure 7. (a) Transient current curves of the SnO2@Bi2O3 (160 °C) sensor to different concentrations of ethanol at 300 °C; (b) Response and recovery curves of the SnO2@Bi2O3 (160 °C) sensor to 100 ppm ethanol at 300 °C; (c) Transient current curves of the SnO2@Bi2O3 (160 °C) sensor over ten cycles for 100 ppm ethanol at 300 °C.
Nanomaterials 15 00129 g007
Figure 8. (a) SnO2@Bi2O3 (160 °C) sensor response to 5 ppm of different gasses; (b) Response of SnO2@Bi2O3 (160 °C) to 1–5 ppm concentration of ethanol.
Nanomaterials 15 00129 g008
Figure 9. (a) Schematic diagram of the sensing mechanism of the SnO2@Bi2O3 core-shell heterojunction when exposed to air and ethanol; (b) Band diagrams of SnO2 and Bi2O3 before and after contact; (c) Band diagram of the SnO2@Bi2O3 core-shell heterojunction in air and ethanol gas.
Nanomaterials 15 00129 g009
Table 1. Elemental composition of the SnO2@Bi2O3 (160 °C) sample.
ElementAtomic %
O79.3
Sn6.1
Bi14.6
Total100
Table 2. The BET specific surface areas of different samples.
SamplesSBET (m2/g)Average Pore Diameter (nm)Pore Volume (cm3/g)
SnO26.74192.86690.004116
SnO2@Bi2O3 (160 °C)31.21482.97900.020202
Table 3. Response of SnO2, SnO2@Bi2O3 prepared at different temperatures to 100 ppm ethanol at 300 °C.
Ethanol Gas (100 ppm)Sensor Response
SnO29
SnO2@Bi2O3 (100 °C)9
SnO2@Bi2O3 (120 °C)10.5
SnO2@Bi2O3 (140 °C)13.6
SnO2@Bi2O3 (160 °C)19.7
Table 4. Response of SnO2@Bi2O3 (160 °C) sensor to different concentrations of ethanol gas.
Concentration of Ethanol (ppm) Sensor Response
11.21
1.11.21
1.21.21
1.31.21
1.41.21
1.51.562
Disclaimer/Publisher’s Note: The statements, opinions and data contained in all publications are solely those of the individual author(s) and contributor(s) and not of MDPI and/or the editor(s). MDPI and/or the editor(s) disclaim responsibility for any injury to people or property resulting from any ideas, methods, instructions or products referred to in the content.

