A Deformation of a Mercury Droplet under Acceleration in an Annular Groove
Abstract
1. Introduction
2. Computational Models and Methods
2.1. Geometric Models
2.2. Governing Equations
2.3. Computational Models and Boundary Conditions
3. Result and Discussion
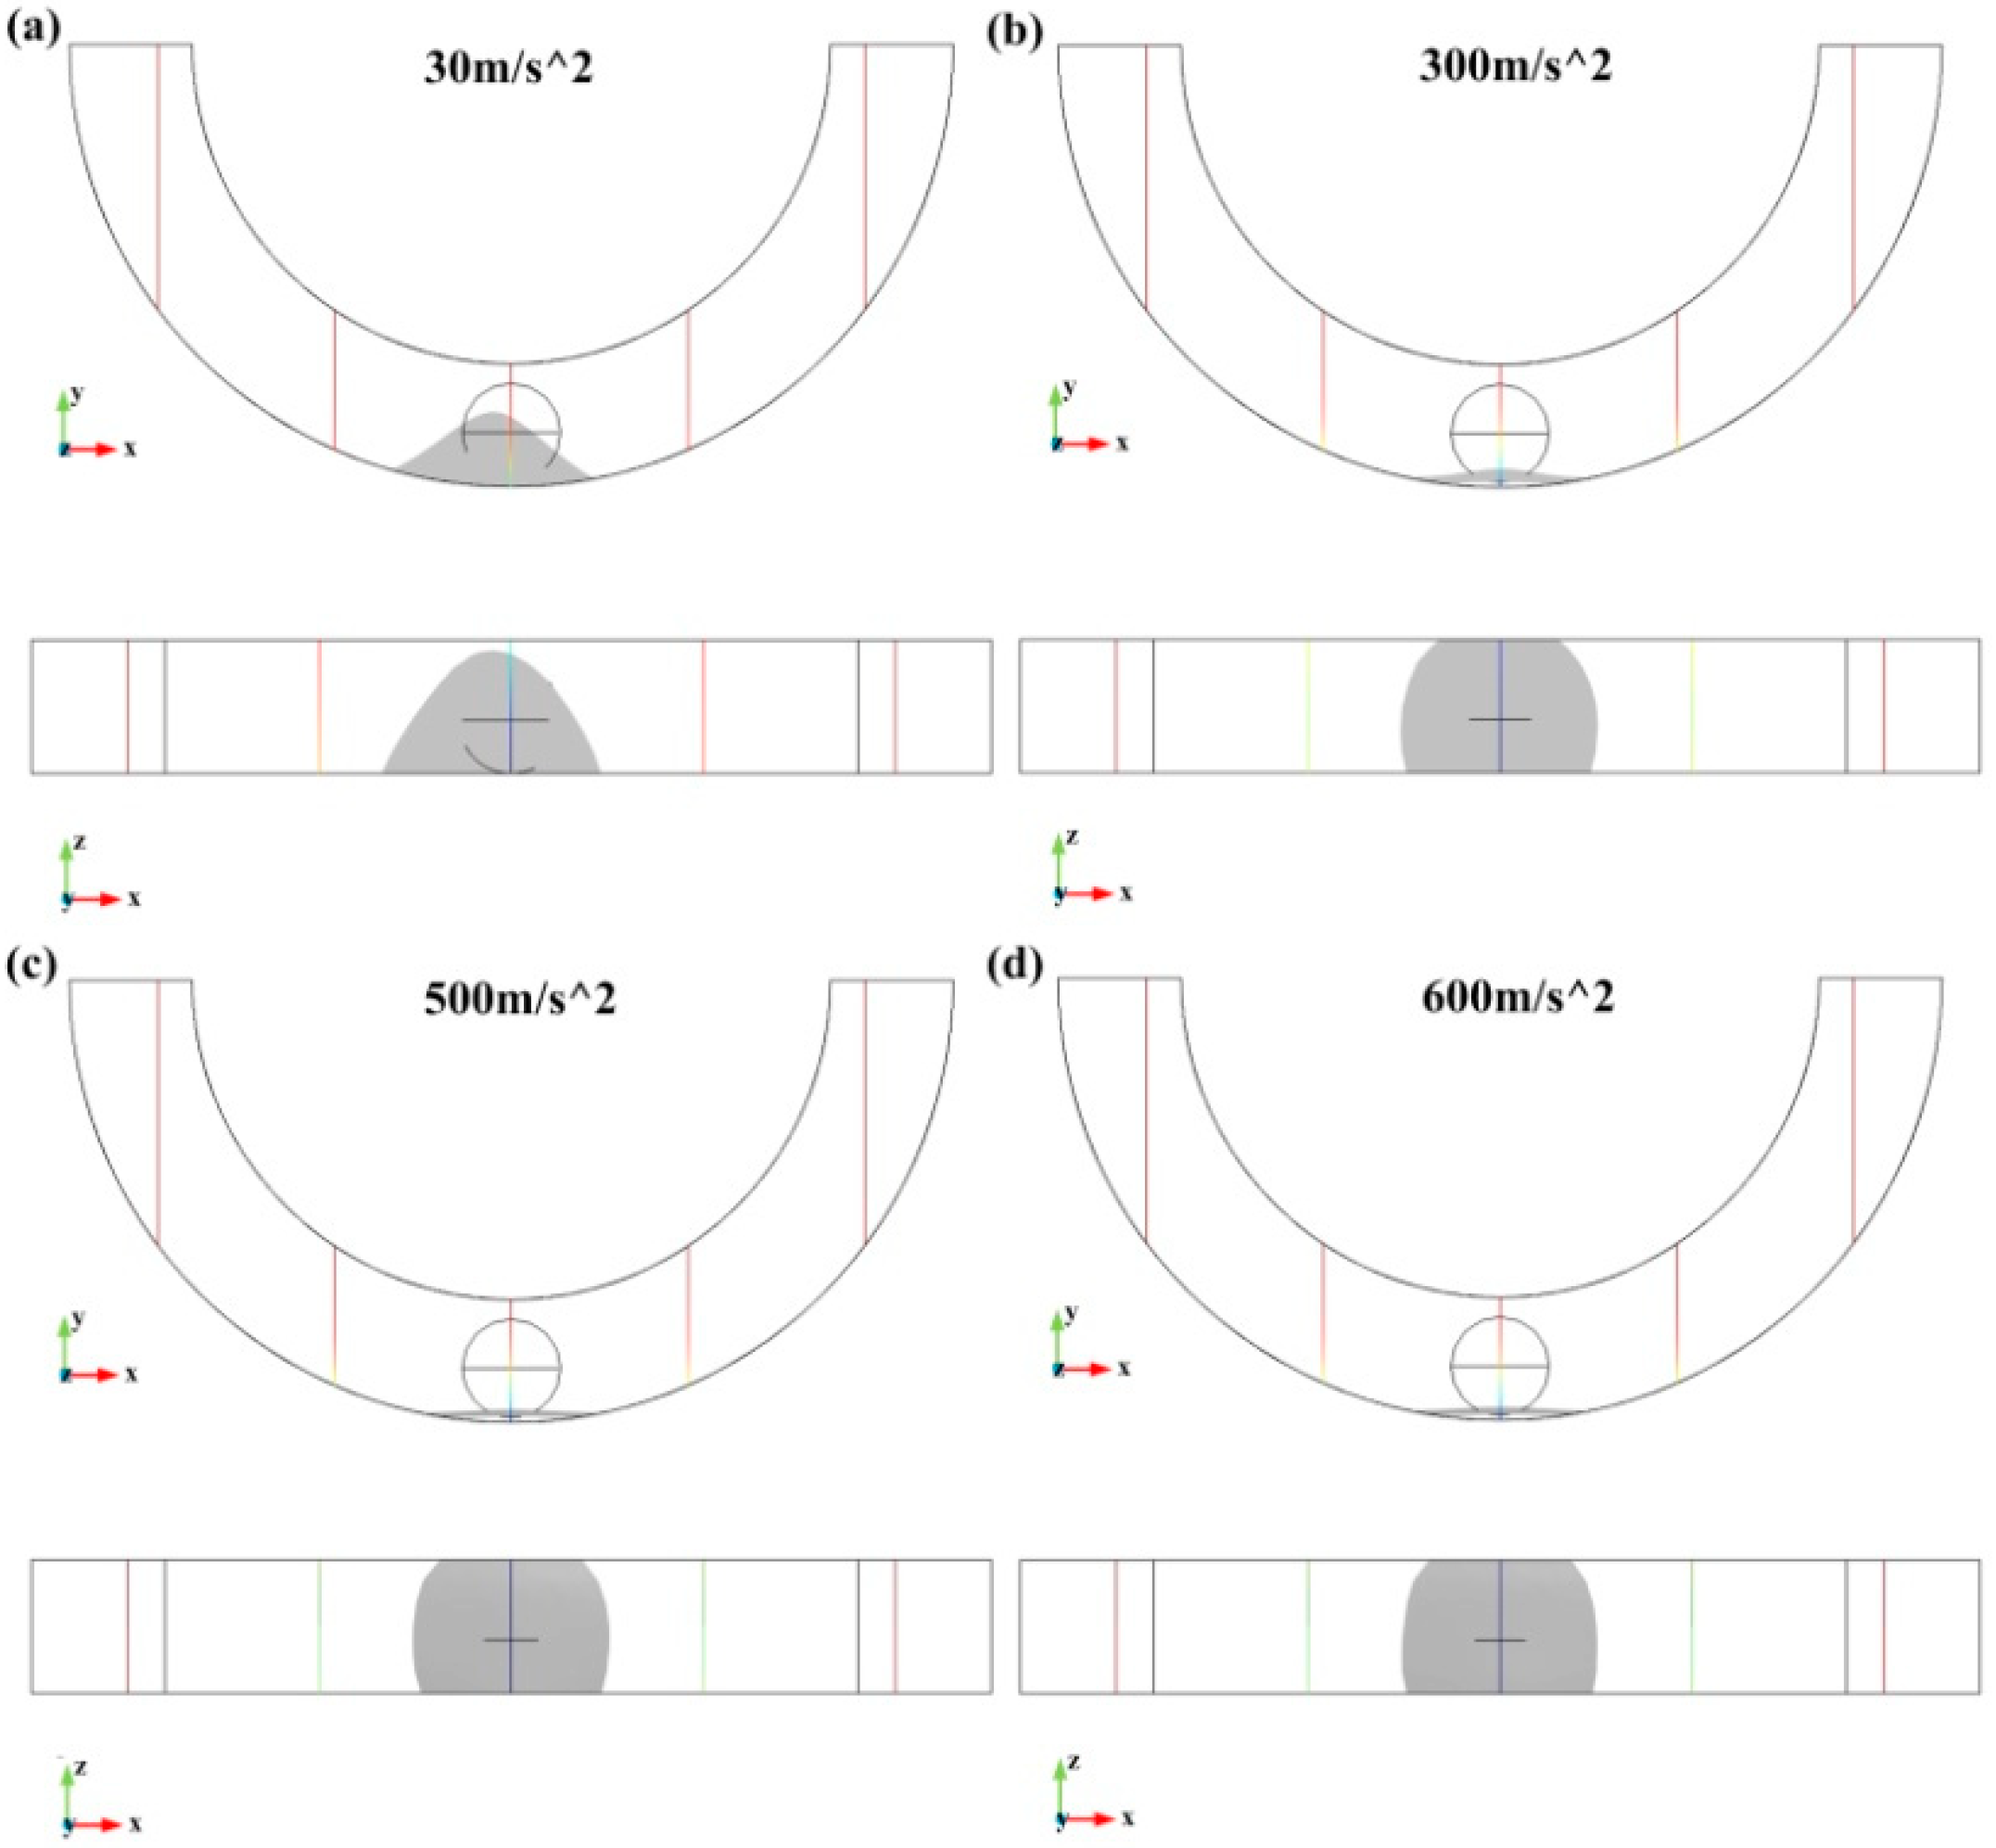
3.1. Characteristic Sizes of the Droplet Deformation
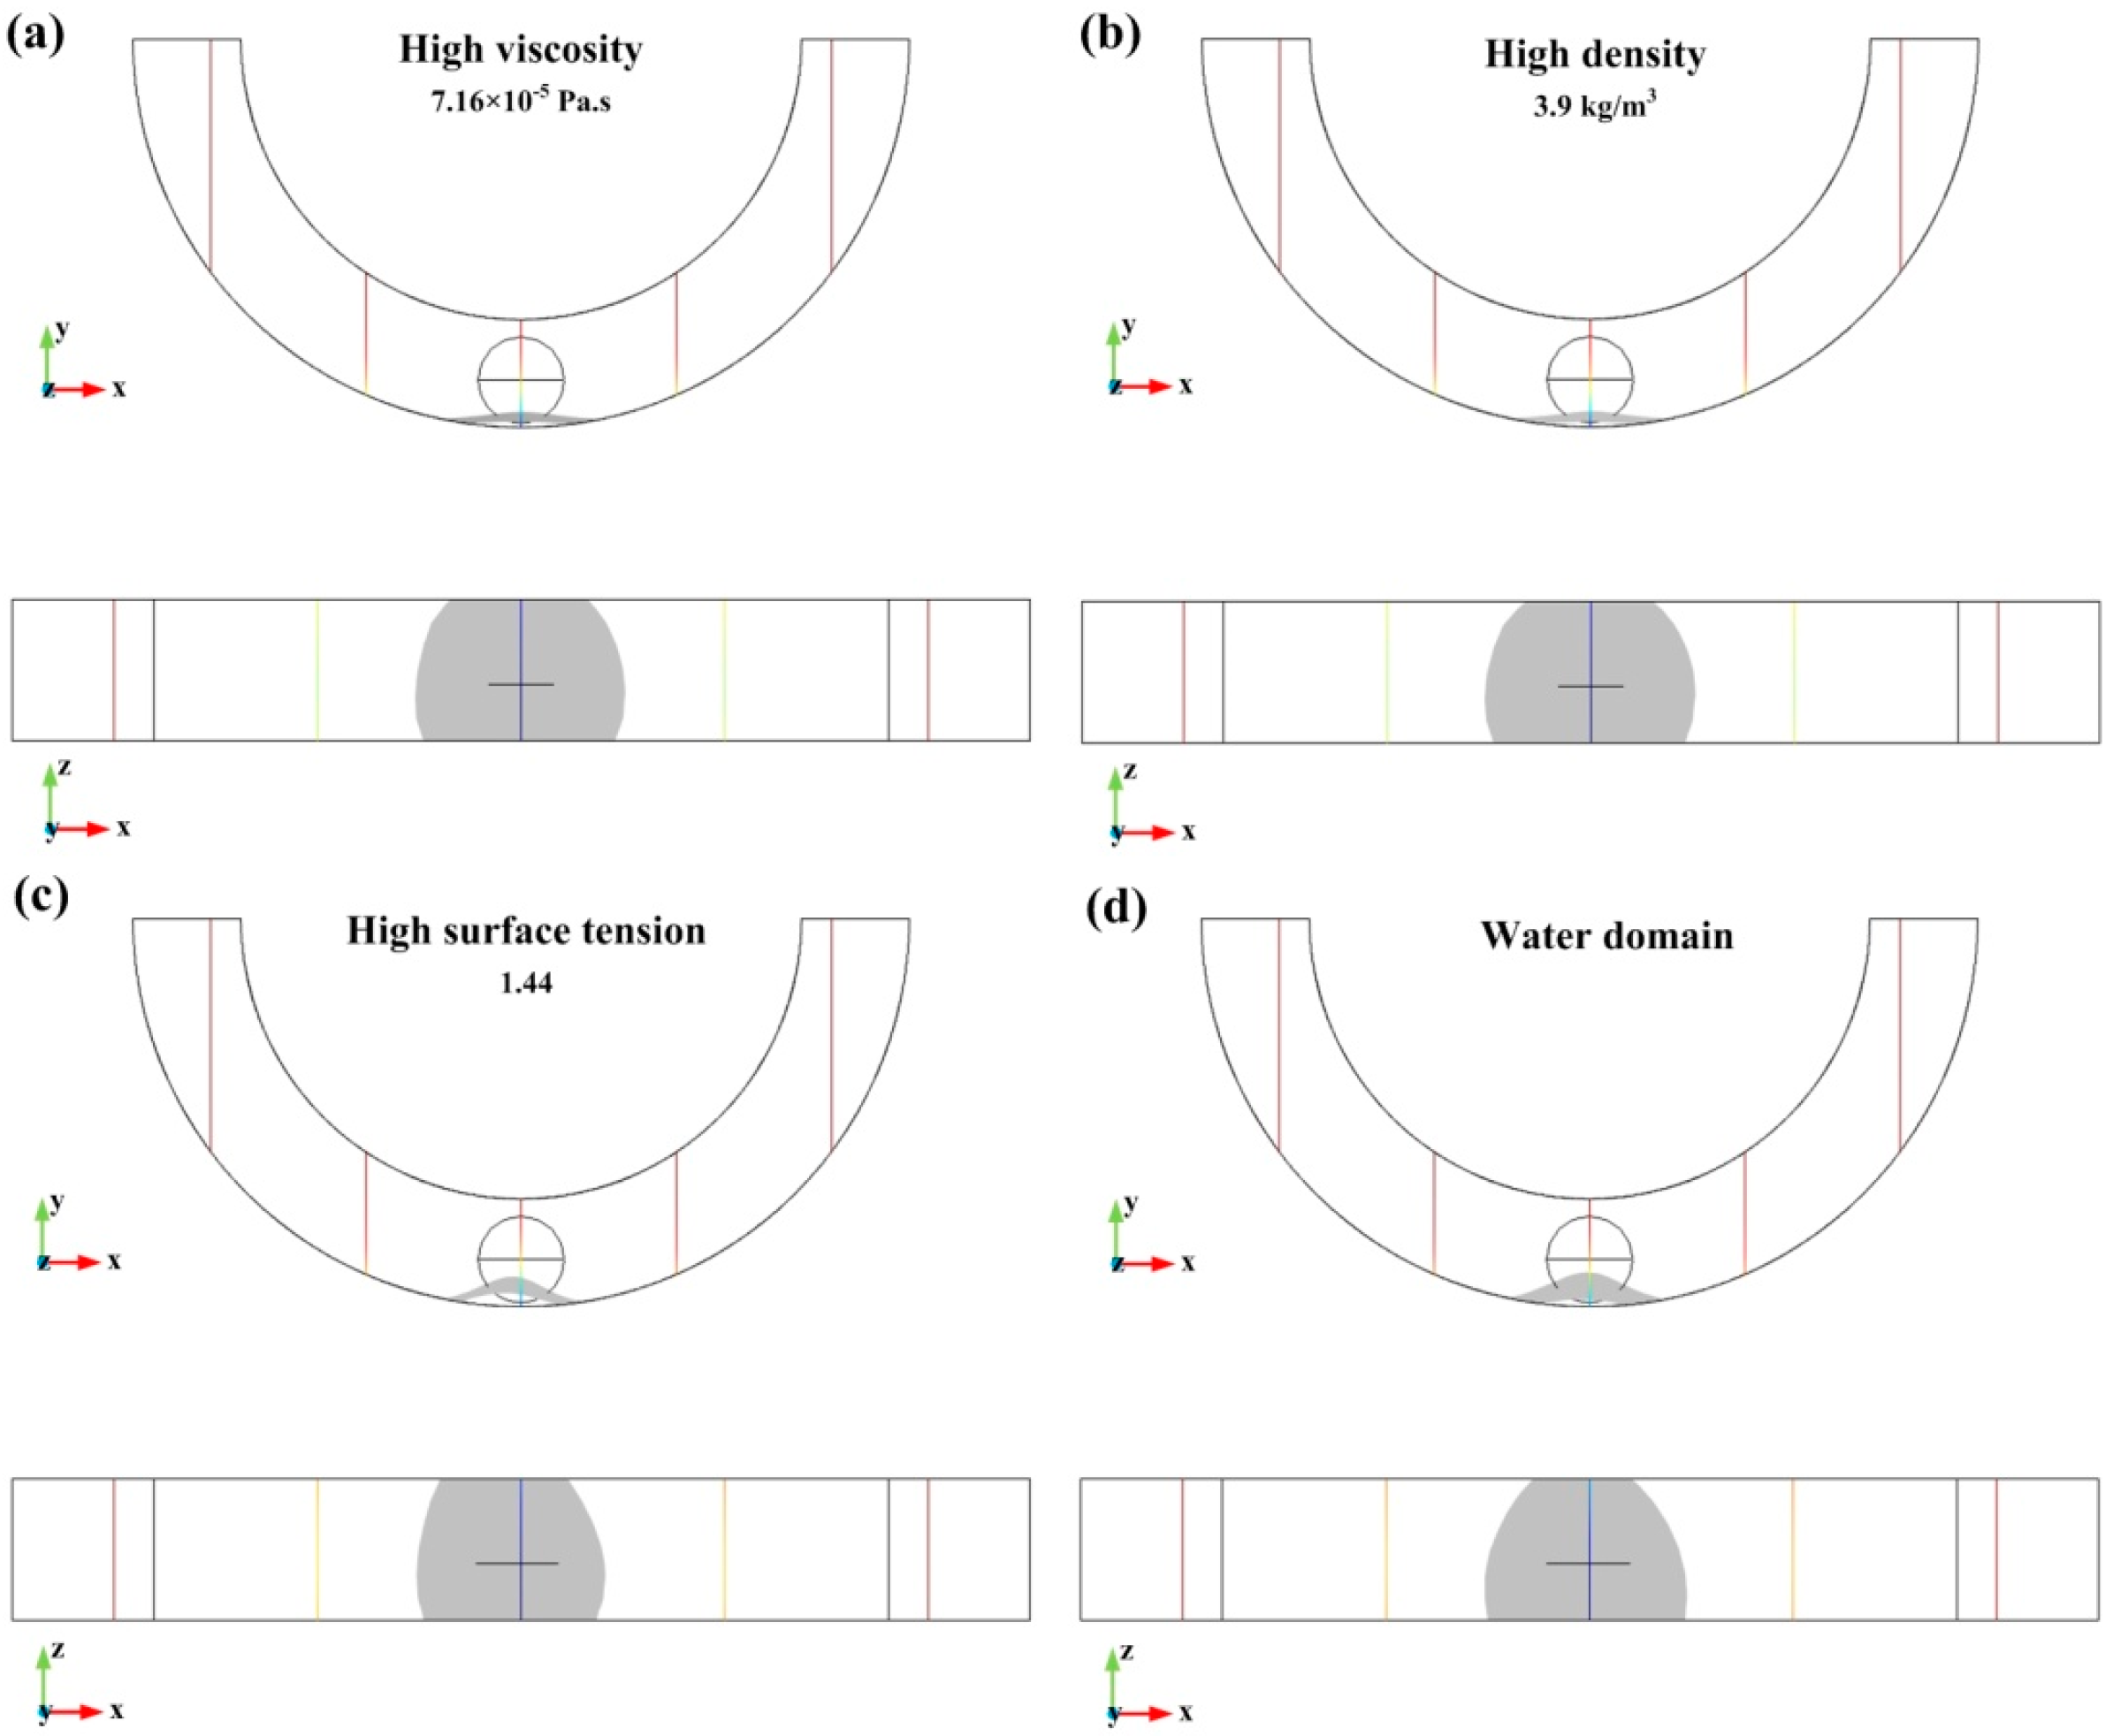
3.2. Effect of Material Properties in the Domain around the Droplet on Characteristic Sizes of the Deformation
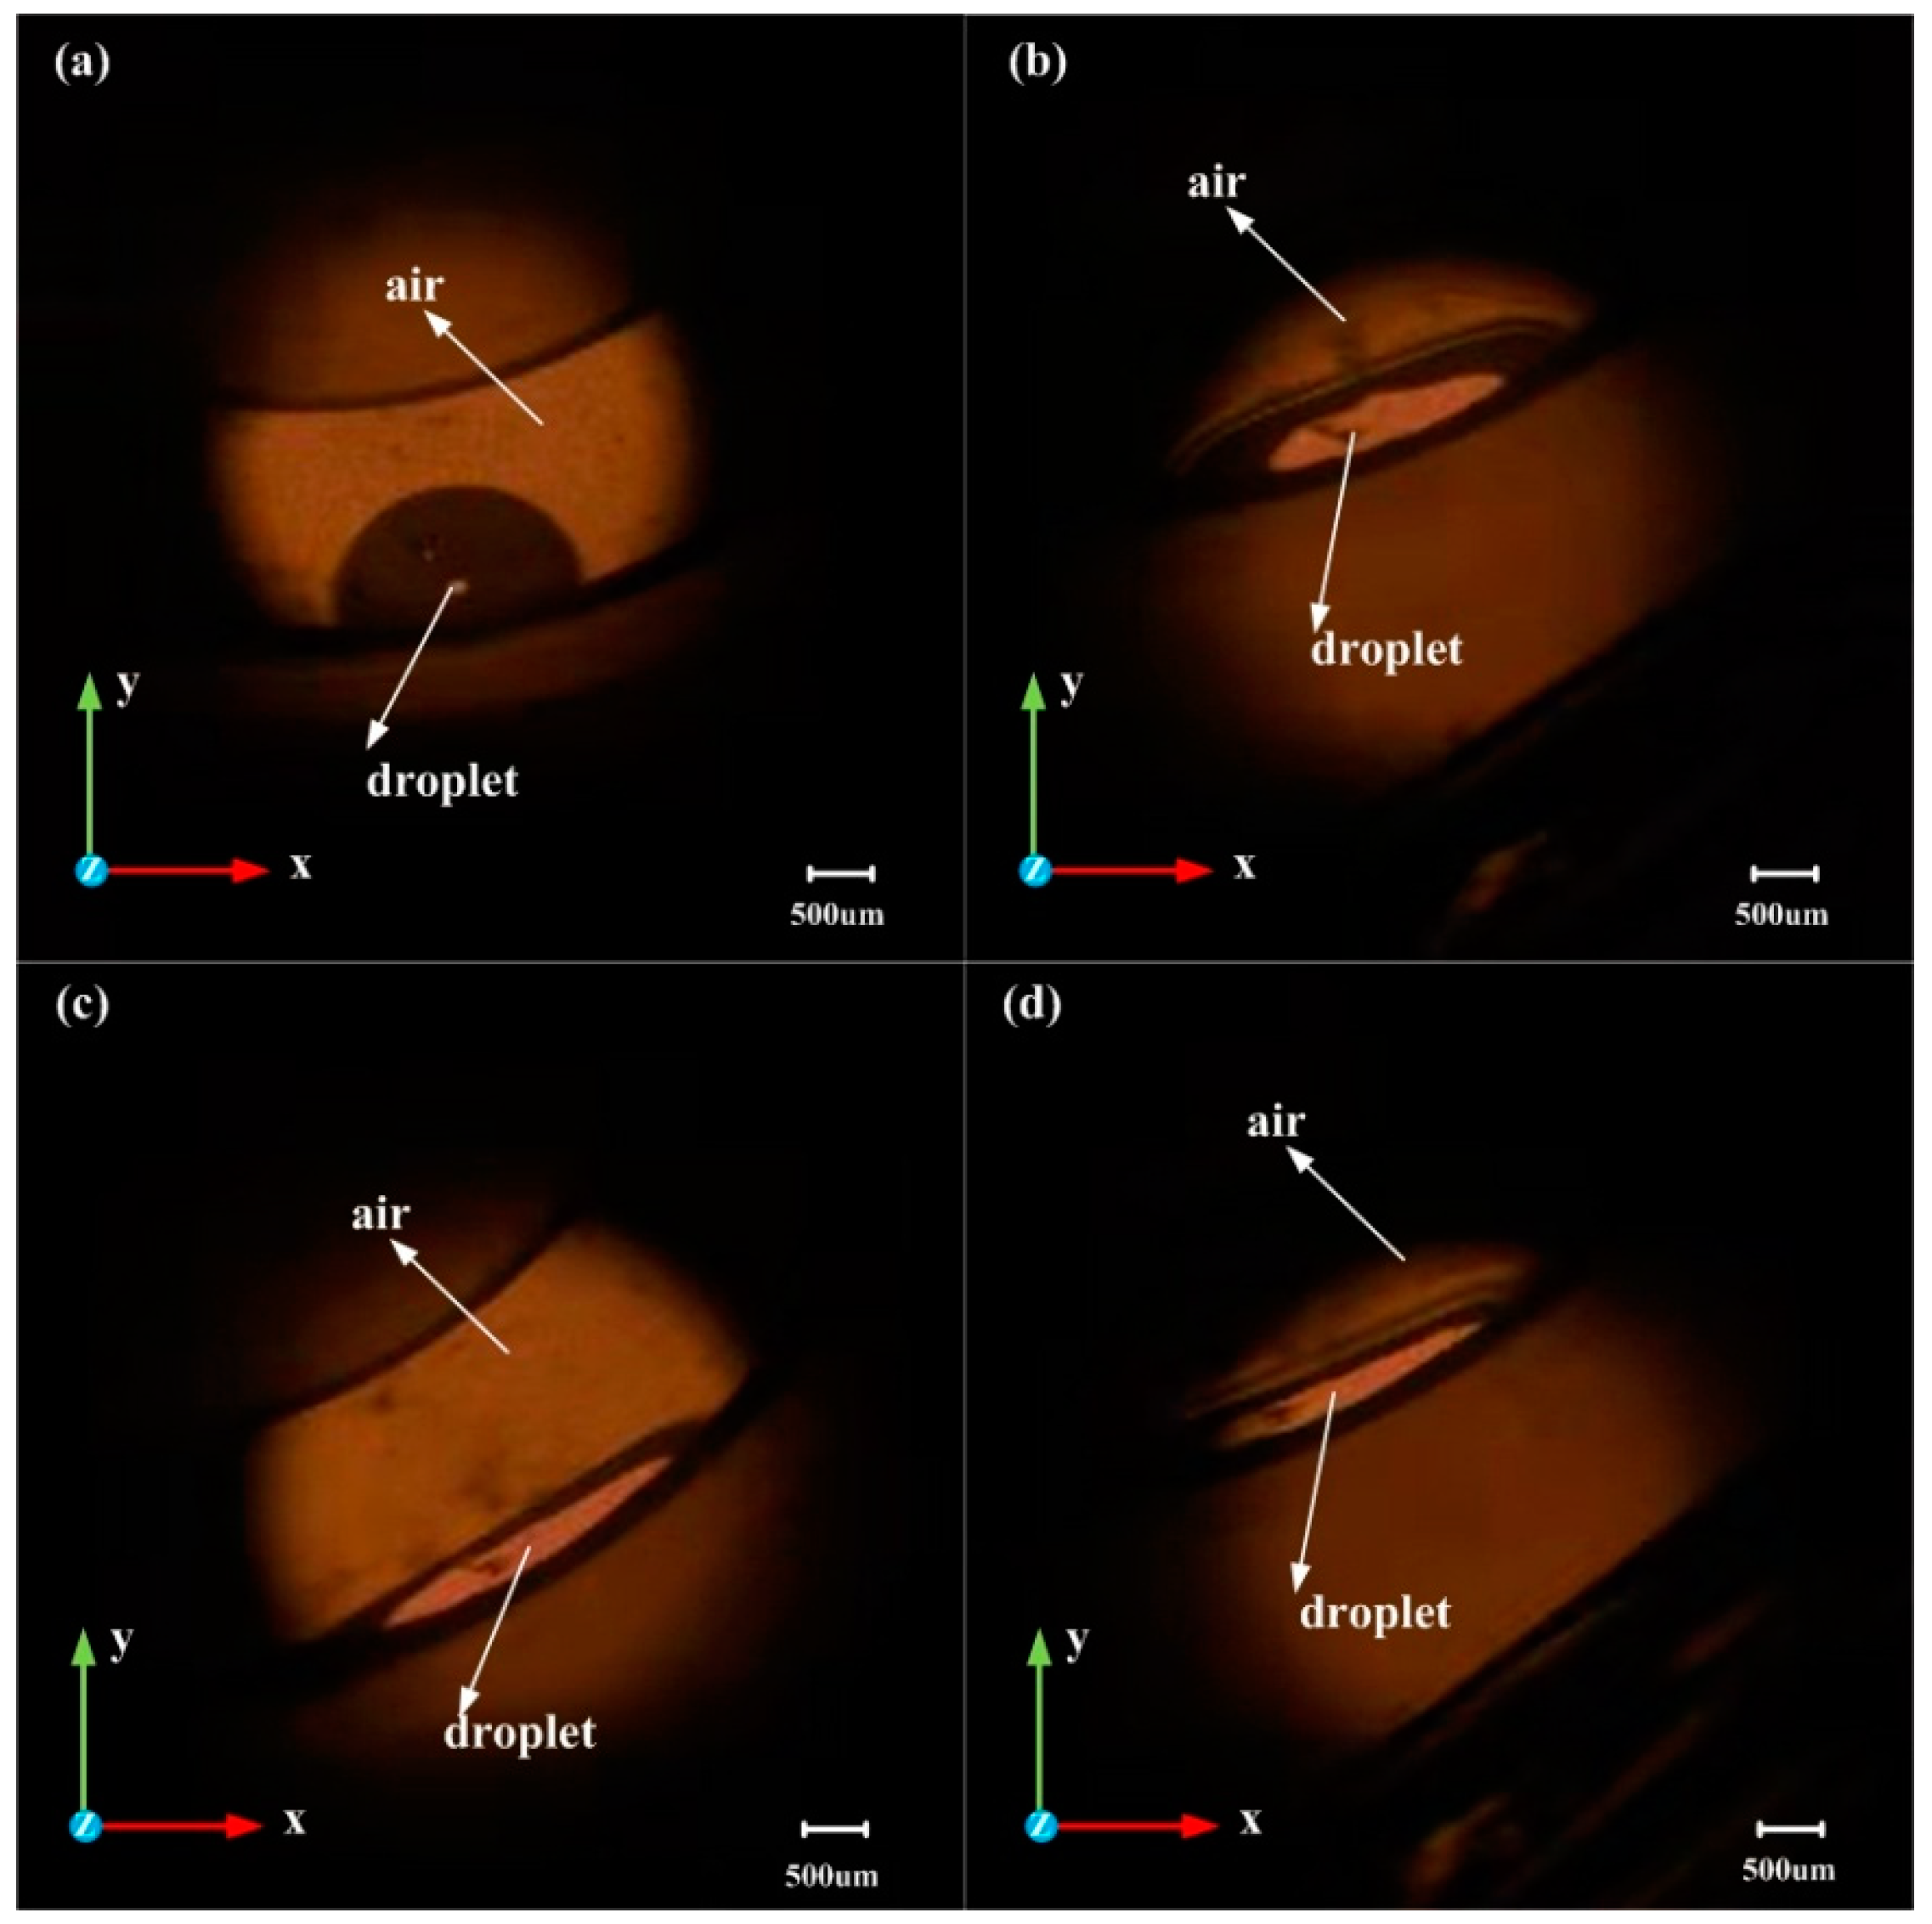
3.3. Experimental Setting and Results
4. Conclusions
Author Contributions
Funding
Acknowledgments
Conflicts of Interest
References
- Won, D.J.; Baek, S.; Huh, M.; Kim, H.; Lee, S.; Kim, J. Robust capacitive touch sensor using liquid metal droplets with large dynamic range. Sens. Actuators A Phys. 2017, 259, 105–111. [Google Scholar] [CrossRef]
- Bijarchi, M.A.; Favakeh, A.; Sedighi, E.; Shafii, M.B. Ferrofluid droplet manipulation using an adjustable alternating magnetic field. Sens. Actuators A Phys. 2020, 301, 111753. [Google Scholar] [CrossRef]
- Xu, H.; Zhao, Y.; Zhang, K.; Wang, Z.-X.; Jiang, K. A liquid MEMS inclinometer sensor with improved sensitivity. Sens. Actuators A Phys. 2019, 285, 369–377. [Google Scholar] [CrossRef]
- Park, U.; Yoo, K.; Kim, J. Development of a MEMS digital accelerometer (MDA) using a microscale liquid metal droplet in a microstructured photosensitive glass channel. Sens. Actuators A Phys. 2010, 159, 51–57. [Google Scholar] [CrossRef]
- Sen, P.; Kim, C.-J. A fast liquid-metal droplet microswitch using EWOD-driven contact-line sliding. J. Microelectromech. Syst. 2009, 18, 174–185. [Google Scholar] [CrossRef]
- Won, D.J.; Baek, S.; Kim, H.; Kim, J. Arrayed-type touch sensor using micro liquid metal droplets with large dynamic range and high sensitivity. Sens. Actuators A Phys. 2015, 235, 151–157. [Google Scholar] [CrossRef]
- Sussman, M.; Smereka, P.; Osher, S. A level set approach for computing solutions to incompressible two-phase flow. J. Comput. Phys. 1994, 114, 146–159. [Google Scholar] [CrossRef]
- Patil, N.D.; Gada, V.H.; Sharma, A.; Bhardwaj, R. On dual-grid level-set method for contact line modeling during impact of a droplet on hydrophobic and superhydrophobic surfaces. Int. J. Multiph. Flow 2016, 81, 54–66. [Google Scholar] [CrossRef]
- Villegas, L.R.; Tanguy, S.; Castanet, G.; Caballina, O.; Lemoine, F. Direct numerical simulation of the impact of a droplet onto a hot surface above the Leidenfrost temperature. Int. J. Heat Mass Transf. 2017, 104, 1090–1109. [Google Scholar] [CrossRef]
- Liu, W.; Wang, G.X.; Matthys, E.F. Thermal analysis and measurements for a molten metal drop impacting on a substrate: Cooling, solidification and heat transfer coefficient. Int. J. Heat Mass Transf. 1995, 38, 1387–1395. [Google Scholar] [CrossRef]
- Zhao, Z.; Poulikakos, D.; Fukai, J. Heat transfer and fluid dynamics during the collision of a liquid droplet on a substrate—I. Modeling. Int. J. Heat Mass Transf. 1996, 39, 2771–2789. [Google Scholar] [CrossRef]
- Shakeri, S.S. Effect of substrate properties on molten metal droplet impact. Int. J. Heat Mass Transf. 2001, 8, 1618–1620. [Google Scholar]
- Tanguy, S.; Berlemont, A. Application of a level set method for simulation of droplet collisions. Int. J. Multiph. Flow 2005, 31, 1015–1035. [Google Scholar] [CrossRef]
- Liu, C.; Li, B.; Wang, L.; Yin, S.-W.; Tong, L.-G. Numerical simulation of impact and solidification of melting dust on spherical bead surface and experimental validation. J. Iron Steel Res. Int. 2019, 26, 679–690. [Google Scholar] [CrossRef]
- Aboutalebi, M.; Bijarchi, M.A.; Shafii, M.B.; Hannani, S.K. Numerical investigation on splitting of ferrofluid microdroplets in T-junctions using an asymmetric magnetic field with proposed correlation. J. Magn. Magn. Mater. 2018, 447, 139–149. [Google Scholar] [CrossRef]
- Li, R.; Hisashi, N.; Michitsugu, M. A numerical study of impact force caused by liquid droplet impingement onto a rigid wall. Prog. Nucl. Energy 2011, 881–885. [Google Scholar] [CrossRef]
- Deshpande, K.B.; Smith, D.; Zimmerman, W.B.J. Modeling of multiphase flow using the level set method. In Multiphysics Modeling with Finite Element Methods; World Scientific Publishing Company: Singapore, 2006; pp. 277–299. [Google Scholar]
- Bergeles, K.; Hardalupas, Y.; Taylor, A. On the transient flow inside and around a deforming millimetre class oil droplet falling under the action of gravity in stagnant air. Phys. Fluids 2018, 30, 013305. [Google Scholar] [CrossRef]
- Pasandideh-Fard, M.; Aziz, S.D.; Chandra, S.; Mostaghimi, J. Cooling effectiveness of a water drop impinging on a hot surface. Int. J. Heat Fluid Flow 2001, 22, 201–210. [Google Scholar] [CrossRef]
- Ding, H.; Spelt, P.D.M. Inertial effects in droplet spreading: A comparison between diffuse-interface and level-set simulations. J. Fluid Mech. 2007, 576, 287–296. [Google Scholar] [CrossRef]
- Kolev, N.I. Fragmentation and coalescence dynamics in multiphase flows. Exp. Therm. Fluid Sci. 1993, 6, 211–251. [Google Scholar] [CrossRef]
- Marin, T. Solidification of a liquid metal droplet impinging on a cold surface. In Proceedings of the COMSOL Users Conference, Paris, France, 7 November 2006. [Google Scholar]
- Vânia, C.P.; Sousa, P.J.; Cardoso, V.F.; Minas, G. Optimized SU-8 processing for low-cost microstructures fabrication without cleanroom facilities. Micromachines 2014, 5, 738–755. [Google Scholar]


| C-Height (mm) | C-Length (mm) | |
|---|---|---|
| Entire annular groove | 1.548 | 0 |
| Half annular groove | 1.544 | 0 |
| Module | ||
|---|---|---|
| Boundary | Laminar flow | Level set |
| 1, 2, 3 | No slipping wall | Not active |
| 4,5,6 | Slipping wall | |
| Materials | ||
|---|---|---|
| Properties | Mercury | Air |
| Density (kg/m3) | 13,600 | 1.3 |
| Viscosity (Pa.s) | 1.526 × 10⁻³ | 1.79 × 10⁻⁵ |
| Surface tension (N/m) | 0.48 | |
| High Viscosity | High Density | High Surface Tension | Water Domain | Air Domain | |
|---|---|---|---|---|---|
| C-height (mm) | 0.379 | 0.362 | 0.681 | 0.798 | 0.345 |
| C-length (mm) | 2.228 | 2.231 | 2.217 | 1.895 | 2.244 |
| Module | |||
|---|---|---|---|
| Boundary | Laminar Flow | Level Set | Multiphysics Coupling |
| 1, 2, 3 | No slipping wall | Not active | |
| 4 | Not active | Not active | Wetted wall (contact angle 145°) |
| 5 | Wetted wall (contact angle 135°) | ||
| 6 | Wetted wall (contact angle 150°) | ||
| 42 m/s2 | 242 m/s2 | 438 m/s2 | 640 m/s2 | |
|---|---|---|---|---|
| Simulation height (mm) | 1.380 | 0.524 | 0.398 | 0.333 |
| Experimental height (mm) | 1.37 | 0.55 | 0.39 | 0.30 |
© 2020 by the authors. Licensee MDPI, Basel, Switzerland. This article is an open access article distributed under the terms and conditions of the Creative Commons Attribution (CC BY) license (http://creativecommons.org/licenses/by/4.0/).
Share and Cite
Xu, H.; Zhao, Y.; Zhang, K.; Wang, Z.; Jiang, K. A Deformation of a Mercury Droplet under Acceleration in an Annular Groove. Biosensors 2020, 10, 61. https://doi.org/10.3390/bios10060061
Xu H, Zhao Y, Zhang K, Wang Z, Jiang K. A Deformation of a Mercury Droplet under Acceleration in an Annular Groove. Biosensors. 2020; 10(6):61. https://doi.org/10.3390/bios10060061
Chicago/Turabian StyleXu, HanYang, Yulong Zhao, Kai Zhang, Zixi Wang, and Kyle Jiang. 2020. "A Deformation of a Mercury Droplet under Acceleration in an Annular Groove" Biosensors 10, no. 6: 61. https://doi.org/10.3390/bios10060061
APA StyleXu, H., Zhao, Y., Zhang, K., Wang, Z., & Jiang, K. (2020). A Deformation of a Mercury Droplet under Acceleration in an Annular Groove. Biosensors, 10(6), 61. https://doi.org/10.3390/bios10060061


