Use of Hypoxic Respiratory Challenge for Differentiating Alzheimer’s Disease and Wild-Type Mice Non-Invasively: A Diffuse Optical Spectroscopy Study
Abstract
:1. Introduction
2. Materials and Methods
2.1. Animal Model and Preparation
2.2. Behavioral Tests
2.2.1. Novel Object Recognition Test
2.2.2. Morris Water Maze Test
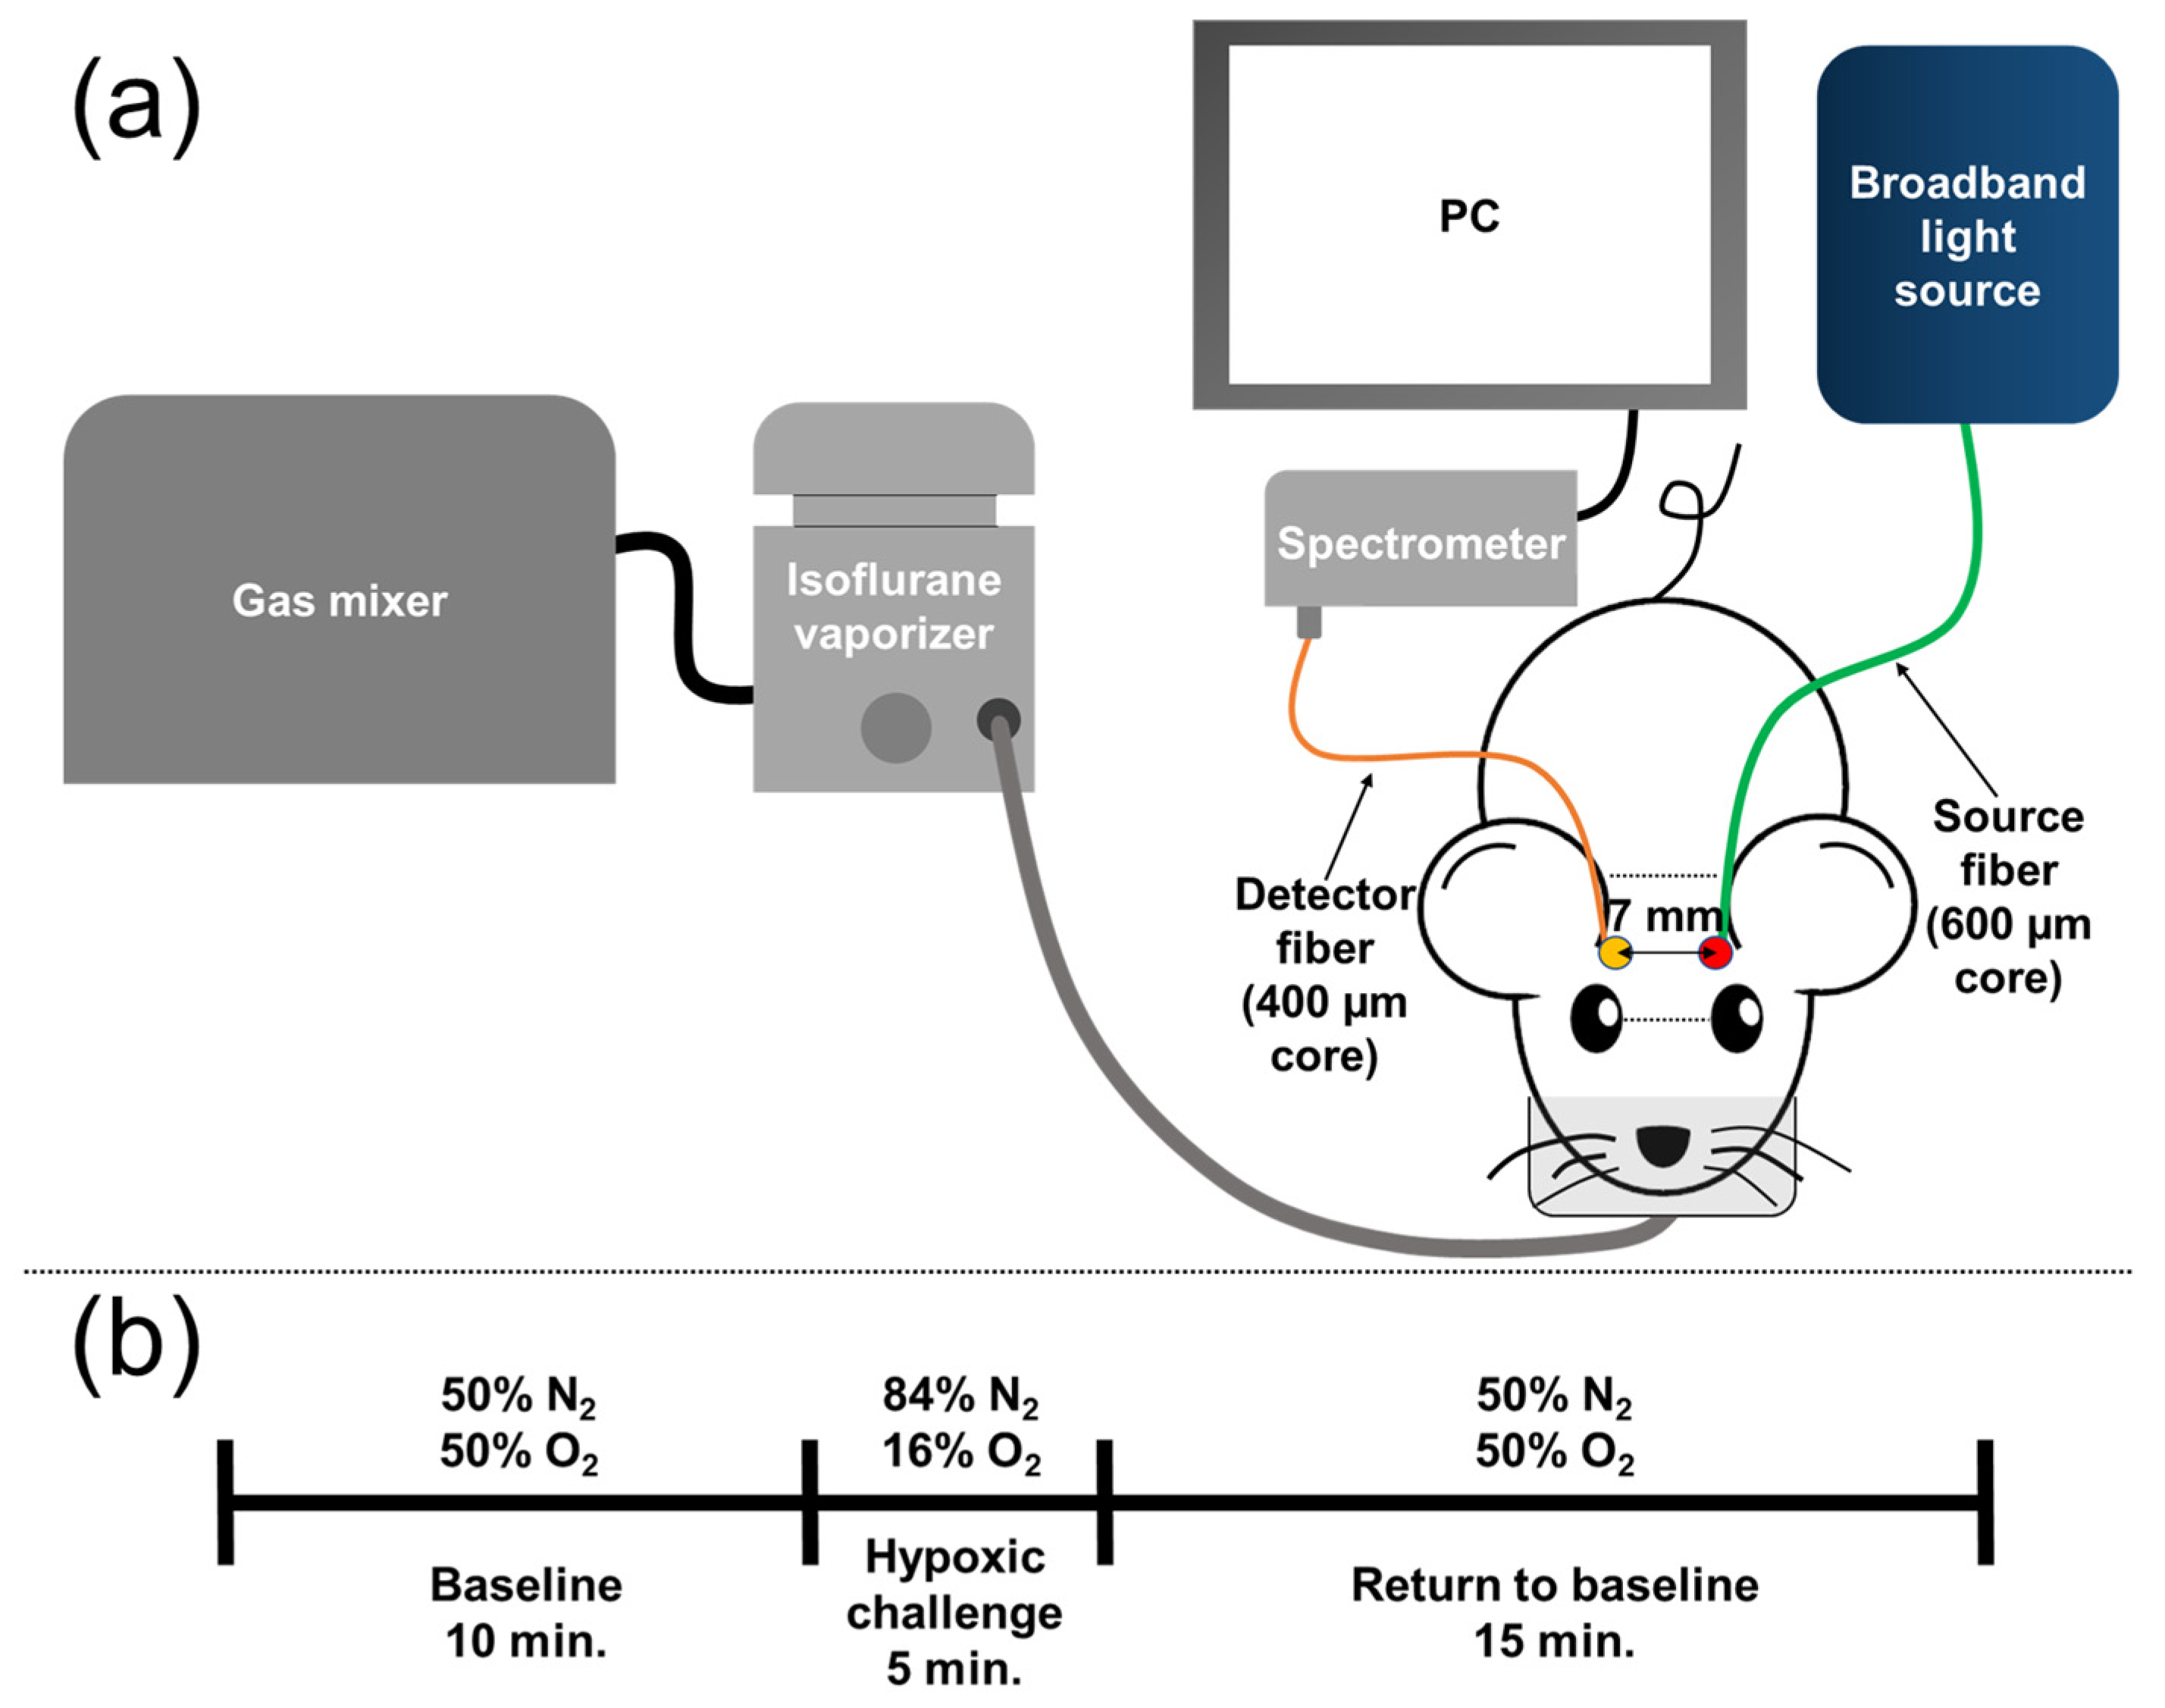
2.3. Diffuse Optical Spectroscopy for Cerebral Hemoglobin Concentration Measurement
2.4. Signal Acquisition
2.5. Modified Beer-Lambert’s Law
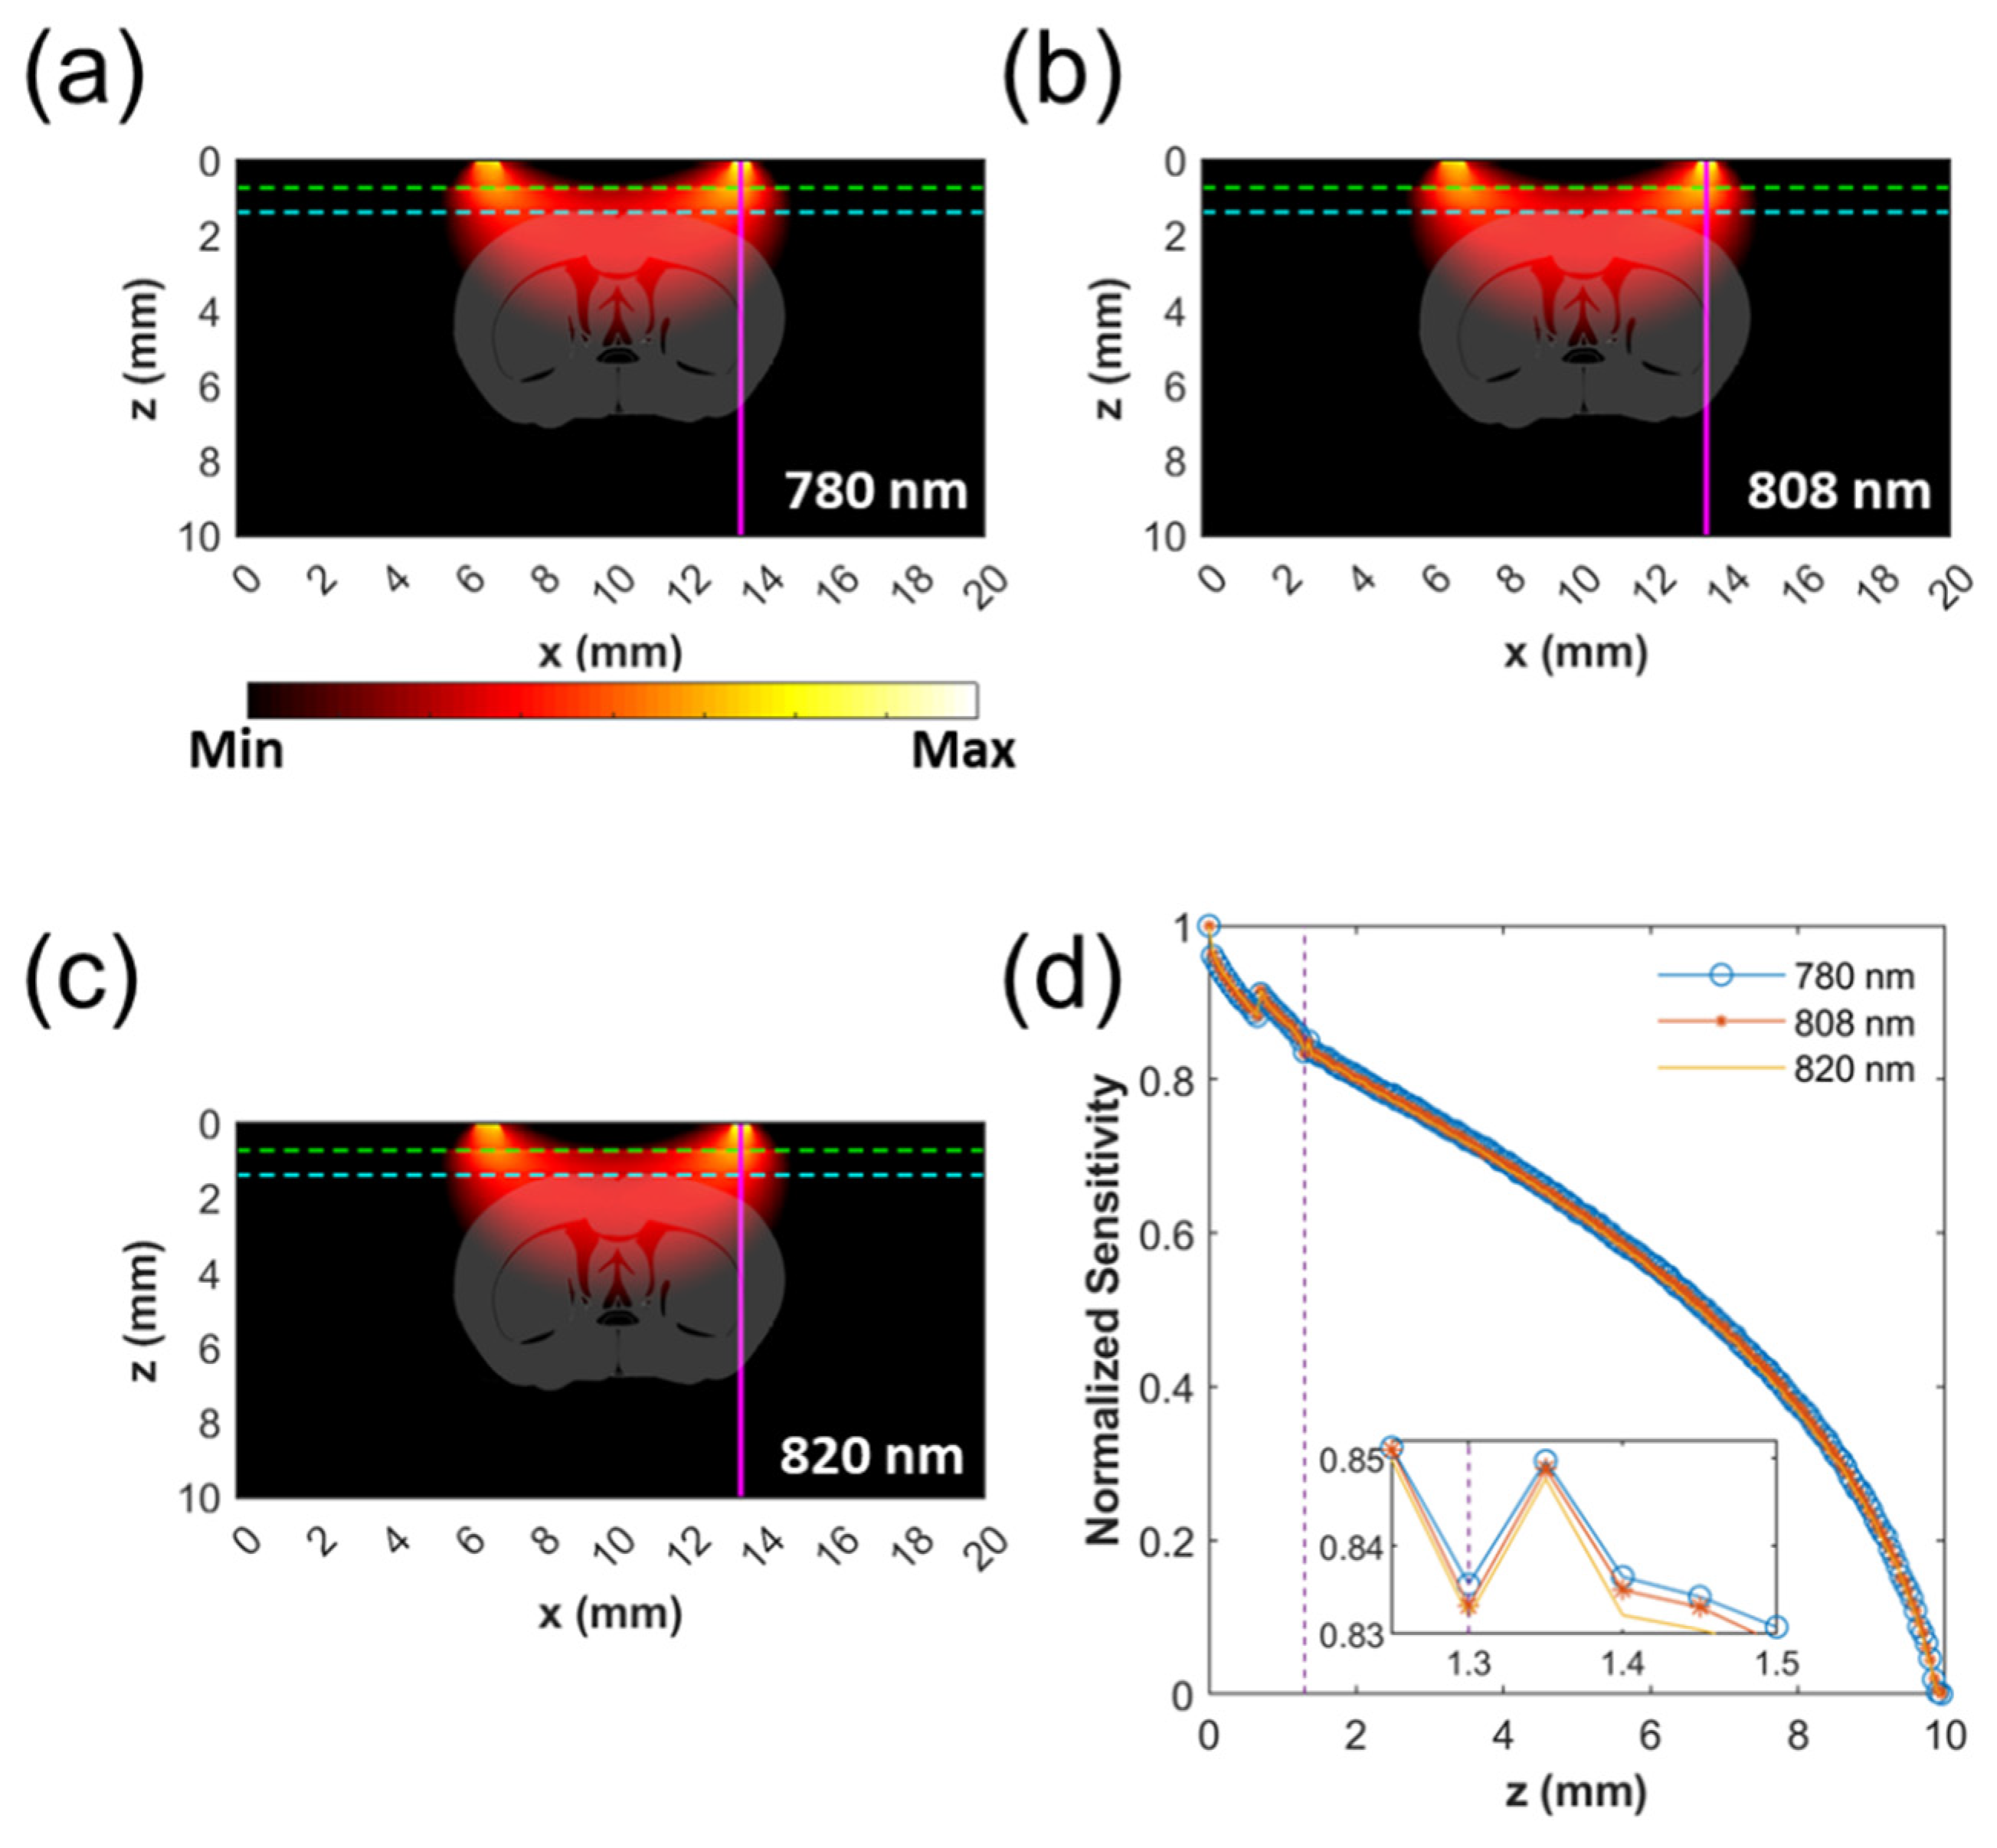
2.6. Monte Carlo Simulation of Probing Depth
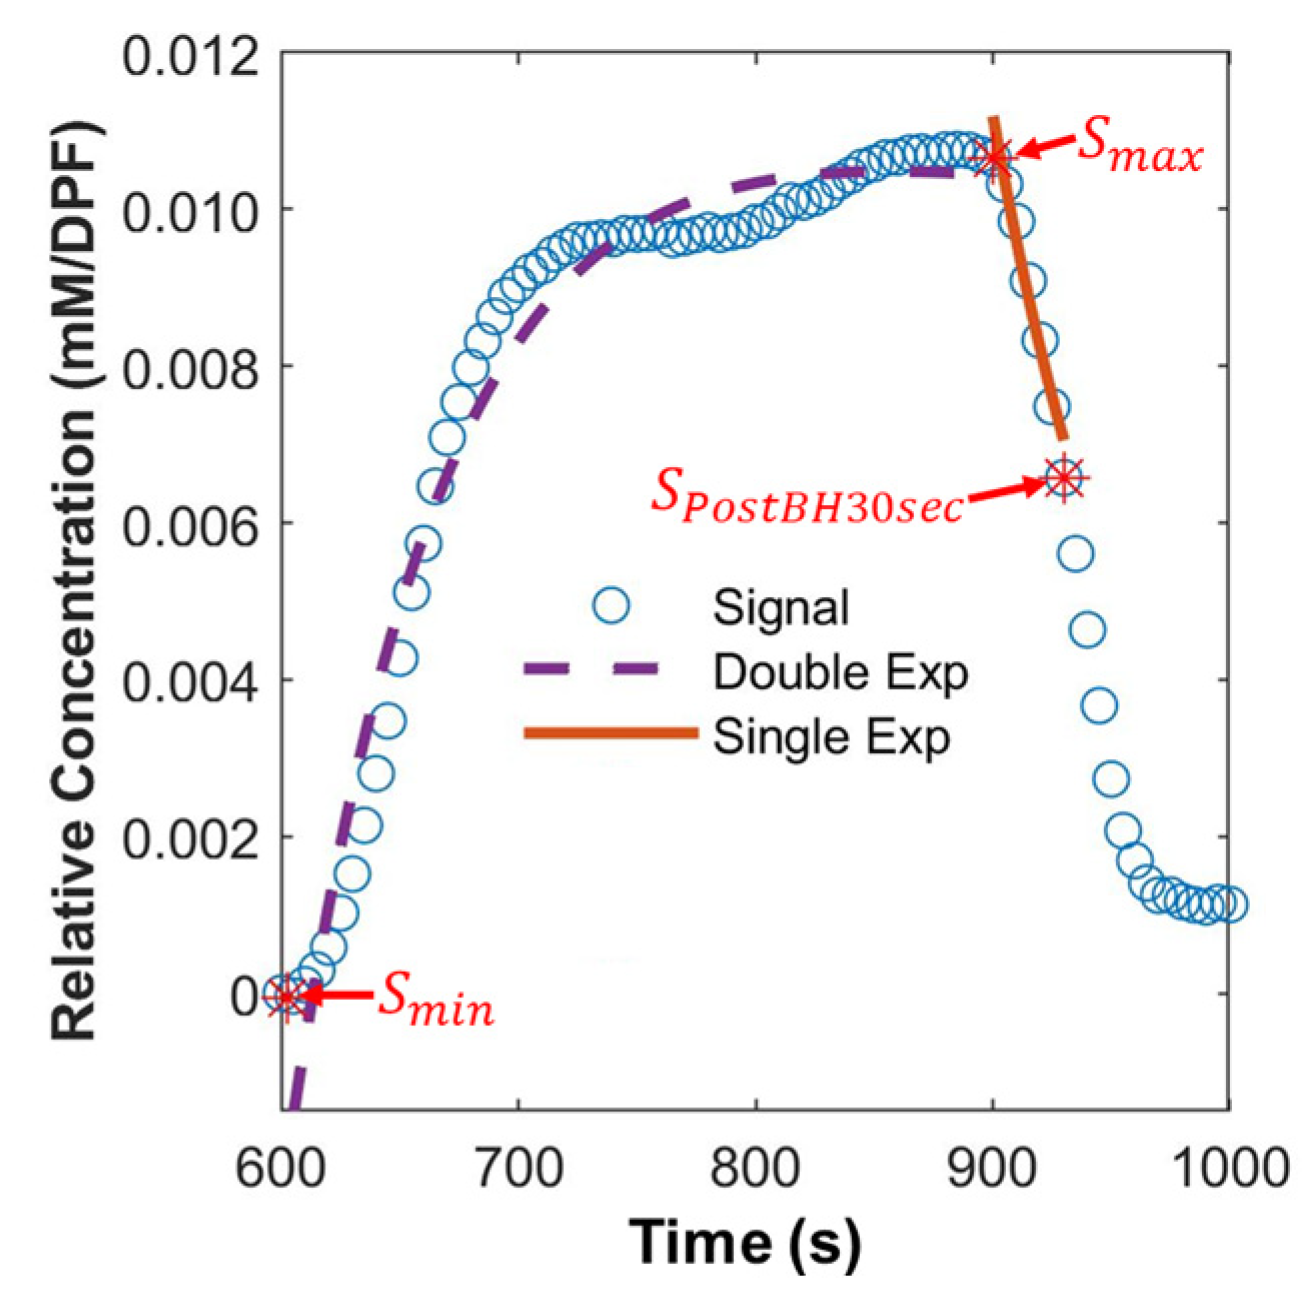
2.7. Extraction of Hemodynamic Features
2.8. Statistical Analysis
2.9. Machine Learning (ML)-Based Classification
3. Results
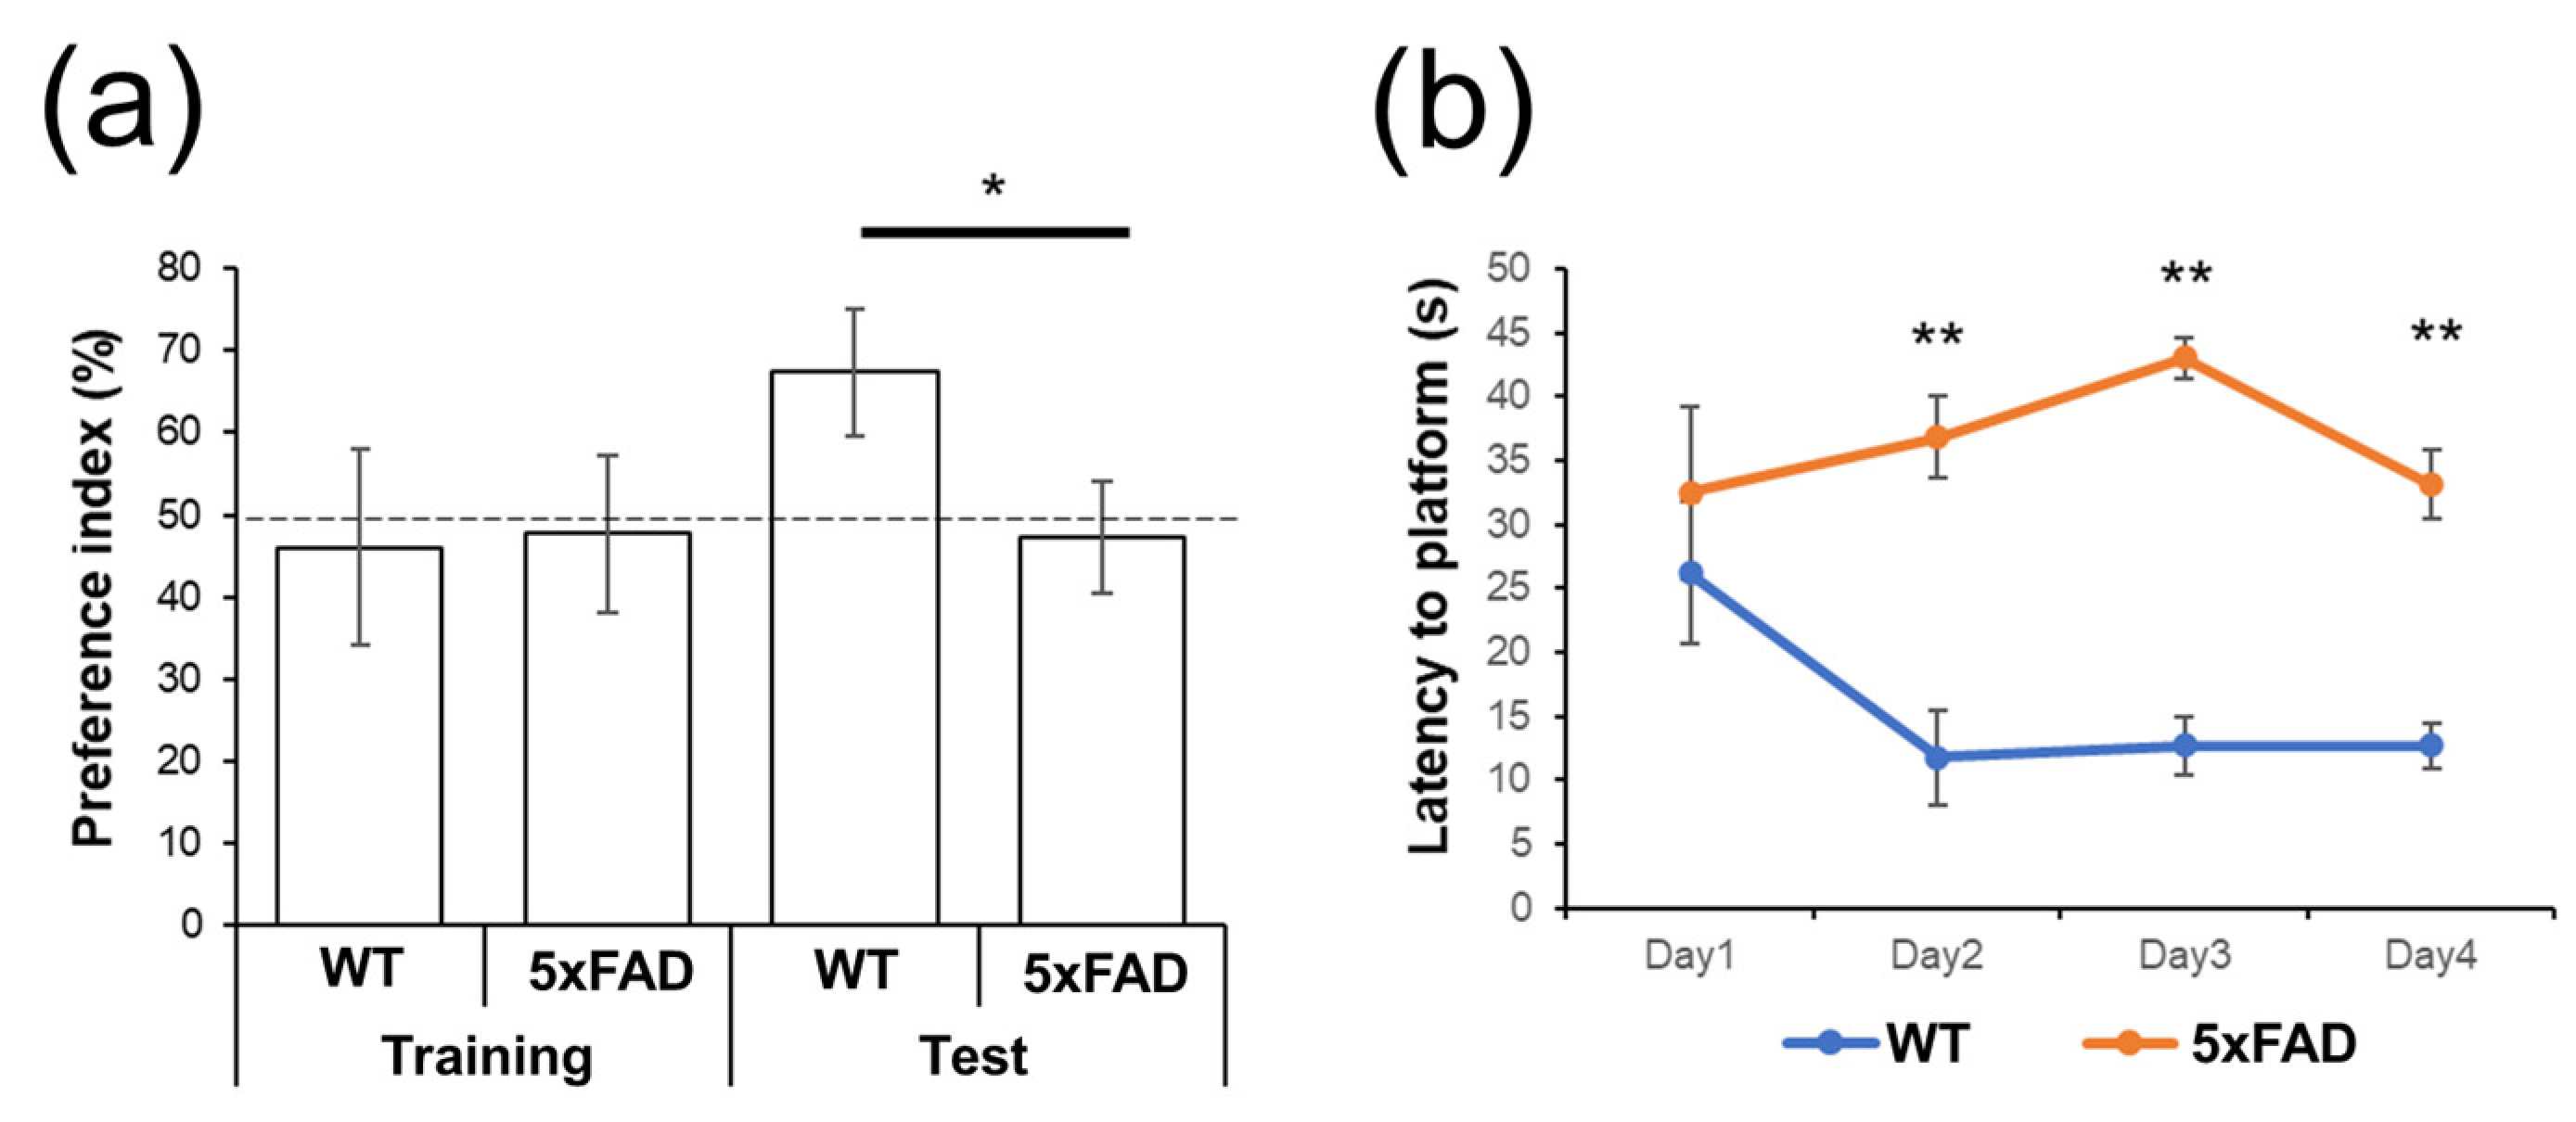
3.1. Behavioral Tests
3.2. Monte Carlo Simulation of Probing Depth
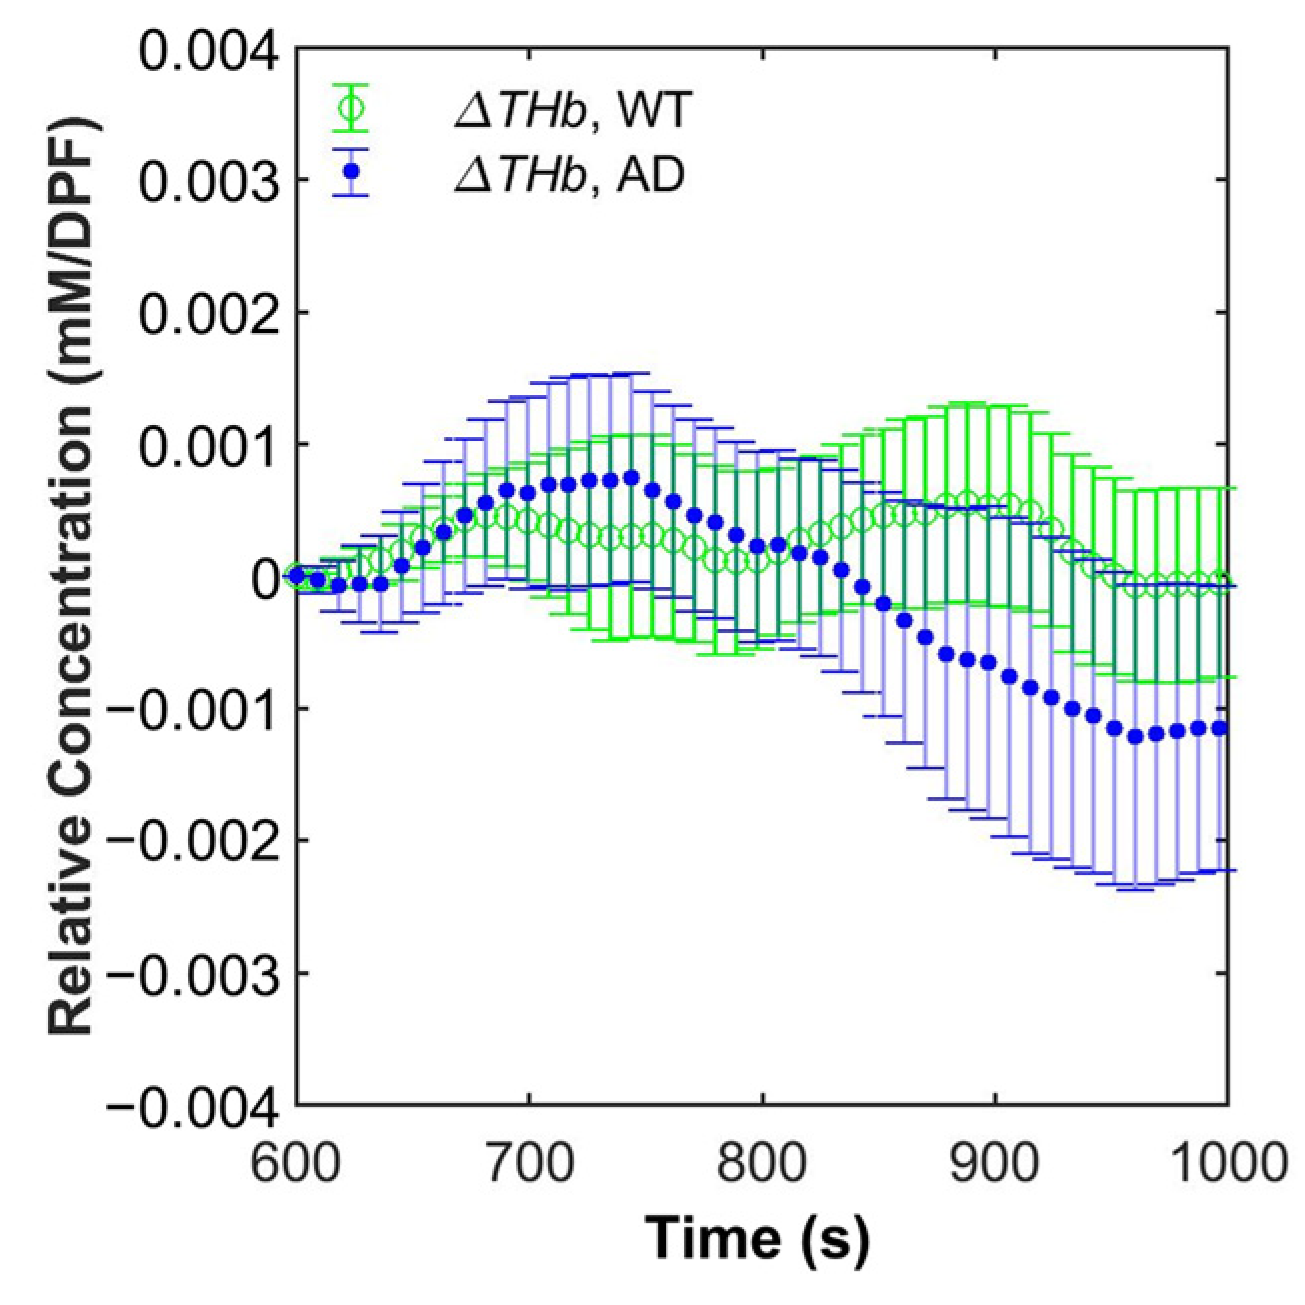
3.3. Grand Average of Hemoglobin Concentration
3.4. Statistical Analysis
3.5. Machine Learning (ML)-Based Classification
4. Discussion
5. Conclusions
Author Contributions
Funding
Institutional Review Board Statement
Informed Consent Statement
Data Availability Statement
Conflicts of Interest
References
- Alzheimer’s Association. 2020 Alzheimer’s Disease Facts and Figures. Alzheimers Dement. 2020, 16, 391–460. [Google Scholar] [CrossRef]
- Vlassenko, A.G.; Benzinger, T.L.S.; Morris, J.C. PET Amyloid-Beta Imaging in Preclinical Alzheimer’s Disease. Biochim. Biophys. Acta BBA-Mol. Basis Dis. 2012, 1822, 370–379. [Google Scholar] [CrossRef] [PubMed] [Green Version]
- Sehlin, D.; Fang, X.T.; Cato, L.; Antoni, G.; Lannfelt, L.; Syvänen, S. Antibody-Based PET Imaging of Amyloid Beta in Mouse Models of Alzheimer’s Disease. Nat. Commun. 2016, 7, 10759. [Google Scholar] [CrossRef] [PubMed] [Green Version]
- Wang, L.; Benzinger, T.L.; Su, Y.; Christensen, J.; Friedrichsen, K.; Aldea, P.; McConathy, J.; Cairns, N.J.; Fagan, A.M.; Morris, J.C.; et al. Evaluation of Tau Imaging in Staging Alzheimer Disease and Revealing Interactions between β-Amyloid and Tauopathy. JAMA Neurol. 2016, 73, 1070. [Google Scholar] [CrossRef] [Green Version]
- Cho, H.; Choi, J.Y.; Hwang, M.S.; Lee, J.H.; Kim, Y.J.; Lee, H.M.; Lyoo, C.H.; Ryu, Y.H.; Lee, M.S. Tau PET in Alzheimer Disease and Mild Cognitive Impairment. Neurology 2016, 87, 375–383. [Google Scholar] [CrossRef]
- Cantin, S.; Villien, M.; Moreaud, O.; Tropres, I.; Keignart, S.; Chipon, E.; Le Bas, J.-F.; Warnking, J.; Krainik, A. Impaired Cerebral Vasoreactivity to CO2 in Alzheimer’s Disease Using BOLD FMRI. NeuroImage 2011, 58, 579–587. [Google Scholar] [CrossRef]
- Hock, C.; Villringer, K.; Heekeren, H.; Schuh-Hofer, S.; Hofmann, M.; Minoshima, S.; Schwaiger, M.; Dirnagl, U.; Villringer, A. Decrease in Parietal Cerebral Hemoglobin Oxygenation during Performance of a Verbal Fluency Task in Patients with Alzheimer’s Disease Monitored by Means of near-Infrared Spectroscopy (NIRS)—Correlation with Simultaneous RCBF-PET Measurements. Brain Res. 1997, 755, 293–303. [Google Scholar] [CrossRef]
- Fallgatter, A.J.; Roesler, M.; Sitzmann, L.; Heidrich, A.; Mueller, T.J.; Strik, W.K. Loss of Functional Hemispheric Asymmetry in Alzheimer’s Dementia Assessed with near-Infrared Spectroscopy. Cogn. Brain Res. 1997, 6, 67–72. [Google Scholar] [CrossRef]
- Arai, H.; Takano, M.; Miyakawa, K.; Ota, T.; Takahashi, T.; Asaka, H.; Kawaguchi, T. A Quantitative Near-Infrared Spectroscopy Study: A Decrease in Cerebral Hemoglobin Oxygenation in Alzheimer’s Disease and Mild Cognitive Impairment. Brain Cogn. 2006, 61, 189–194. [Google Scholar] [CrossRef] [PubMed]
- Yang, D.; Huang, R.; Yoo, S.-H.; Shin, M.-J.; Yoon, J.A.; Shin, Y.-I.; Hong, K.-S. Detection of Mild Cognitive Impairment Using Convolutional Neural Network: Temporal-Feature Maps of Functional near-Infrared Spectroscopy. Front. Aging Neurosci. 2020, 12, 141. [Google Scholar] [CrossRef]
- Nguyen, T.; Kim, M.; Gwak, J.; Lee, J.J.; Choi, K.Y.; Lee, K.H.; Kim, J.G. Investigation of Brain Functional Connectivity in Patients with Mild Cognitive Impairment: A Functional Near-infrared Spectroscopy (FNIRS) Study. J. Biophotonics 2019, 12, e201800298. [Google Scholar] [CrossRef]
- Ho, T.K.K.; Kim, M.; Jeon, Y.; Kim, B.C.; Kim, J.G.; Lee, K.H.; Song, J.-I.; Gwak, J. Deep Learning-Based Multilevel Classification of Alzheimer’s Disease Using Non-Invasive Functional near-Infrared Spectroscopy. Front. Aging Neurosci. 2022, 14, 810125. [Google Scholar] [CrossRef] [PubMed]
- Niu, H.; Li, X.; Chen, Y.; Ma, C.; Zhang, J.; Zhang, Z. Reduced Frontal Activation during a Working Memory Task in Mild Cognitive Impairment: A Non-invasive Near-infrared Spectroscopy Study. CNS Neurosci. Ther. 2013, 19, 125–131. [Google Scholar] [CrossRef]
- Lee, M.J.; Park, B.-Y.; Cho, S.; Park, H.; Chung, C.-S. Cerebrovascular Reactivity as a Determinant of Deep White Matter Hyperintensities in Migraine. Neurology 2019, 92, e342–e350. [Google Scholar] [CrossRef] [PubMed]
- Lynch, C.E.; Eisenbaum, M.; Algamal, M.; Balbi, M.; Ferguson, S.; Mouzon, B.; Saltiel, N.; Ojo, J.; Diaz-Arrastia, R.; Mullan, M.; et al. Impairment of Cerebrovascular Reactivity in Response to Hypercapnic Challenge in a Mouse Model of Repetitive Mild Traumatic Brain Injury. J. Cereb. Blood Flow Metab. 2021, 41, 1362–1378. [Google Scholar] [CrossRef]
- Chen, S.-F.; Pan, H.-Y.; Huang, C.-R.; Huang, J.-B.; Tan, T.-Y.; Chen, N.-C.; Hsu, C.-Y.; Chuang, Y.-C. Autonomic Dysfunction Contributes to Impairment of Cerebral Autoregulation in Patients with Epilepsy. J. Pers. Med. 2021, 11, 313. [Google Scholar] [CrossRef]
- Blair, G.W.; Doubal, F.N.; Thrippleton, M.J.; Marshall, I.; Wardlaw, J.M. Magnetic Resonance Imaging for Assessment of Cerebrovascular Reactivity in Cerebral Small Vessel Disease: A Systematic Review. J. Cereb. Blood Flow Metab. 2016, 36, 833–841. [Google Scholar] [CrossRef]
- Lin, A.J.; Koike, M.A.; Green, K.N.; Kim, J.G.; Mazhar, A.; Rice, T.B.; LaFerla, F.M.; Tromberg, B.J. Spatial Frequency Domain Imaging of Intrinsic Optical Property Contrast in a Mouse Model of Alzheimer’s Disease. Ann. Biomed. Eng. 2011, 39, 1349–1357. [Google Scholar] [CrossRef] [PubMed] [Green Version]
- Lin, A.J.; Liu, G.; Castello, N.A.; Yeh, J.J.; Rahimian, R.; Lee, G.; Tsay, V.; Durkin, A.J.; Choi, B.; LaFerla, F.M.; et al. Optical Imaging in an Alzheimer’s Mouse Model Reveals Amyloid-β-Dependent Vascular Impairment. Neurophotonics 2014, 1, 011005. [Google Scholar] [CrossRef]
- Kimura, R.; Ohno, M. Impairments in Remote Memory Stabilization Precede Hippocampal Synaptic and Cognitive Failures in 5XFAD Alzheimer Mouse Model. Neurobiol. Dis. 2009, 33, 229–235. [Google Scholar] [CrossRef]
- Giannoni, P.; Arango-Lievano, M.; Neves, I.D.; Rousset, M.-C.; Baranger, K.; Rivera, S.; Jeanneteau, F.; Claeysen, S.; Marchi, N. Cerebrovascular Pathology during the Progression of Experimental Alzheimer’s Disease. Neurobiol. Dis. 2016, 88, 107–117. [Google Scholar] [CrossRef] [PubMed]
- Szu, J.I.; Obenaus, A. Cerebrovascular Phenotypes in Mouse Models of Alzheimer’s Disease. J. Cereb. Blood Flow Metab. 2021, 41, 1821–1841. [Google Scholar] [CrossRef] [PubMed]
- Tataryn, N.M.; Singh, V.; Dyke, J.P.; Berk-Rauch, H.E.; Clausen, D.M.; Aronowitz, E.; Norris, E.H.; Strickland, S.; Ahn, H.J. Vascular Endothelial Growth Factor Associated Dissimilar Cerebrovascular Phenotypes in Two Different Mouse Models of Alzheimer’s Disease. Neurobiol. Aging 2021, 107, 96–108. [Google Scholar] [CrossRef]
- Seong, M.; Mai, P.M.; Lee, K.; Kim, J.G. Simultaneous Blood Flow and Oxygenation Measurements Using an Off-the-Shelf Spectrometer. Chin. Opt. Lett. 2018, 16, 071701. [Google Scholar] [CrossRef] [Green Version]
- Seong, M.; Phillips, Z.; Mai, P.M.; Yeo, C.; Song, C.; Lee, K.; Kim, J.G. Simultaneous Blood Flow and Blood Oxygenation Measurements Using a Combination of Diffuse Speckle Contrast Analysis and Near-Infrared Spectroscopy. J. Biomed. Opt. 2016, 21, 027001. [Google Scholar] [CrossRef]
- Kim, J.G.; Lee, J.; Mahon, S.B.; Mukai, D.; Patterson, S.E.; Boss, G.R.; Tromberg, B.J.; Brenner, M. Noninvasive Monitoring of Treatment Response in a Rabbit Cyanide Toxicity Model Reveals Differences in Brain and Muscle Metabolism. J. Biomed. Opt. 2012, 17, 105005. [Google Scholar] [CrossRef] [Green Version]
- Prahl, S.; Jacques, S.; OMLC. Available online: https://omlc.org/ (accessed on 29 September 2020).
- Lee, S.; Kim, J.G. Breast Tumor Hemodynamic Response during a Breath-Hold as a Biomarker to Predict Chemotherapeutic Efficacy: Preclinical Study. J. Biomed. Opt. 2018, 23, 048001. [Google Scholar] [CrossRef]
- Choi, S.S.; Mandelis, A.; Guo, X.; Lashkari, B.; Kellnberger, S.; Ntziachristos, V. Wavelength-Modulated Differential Photoacoustic Spectroscopy (WM-DPAS) for Noninvasive Early Cancer Detection and Tissue Hypoxia Monitoring. J. Biophotonics 2016, 9, 388–395. [Google Scholar] [CrossRef]
- Dehaes, M.; Gagnon, L.; Lesage, F.; Pélégrini-Issac, M.; Vignaud, A.; Valabrègue, R.; Grebe, R.; Wallois, F.; Benali, H. Quantitative Investigation of the Effect of the Extra-Cerebral Vasculature in Diffuse Optical Imaging: A Simulation Study. Biomed. Opt. Express 2011, 2, 680. [Google Scholar] [CrossRef] [Green Version]
- Fang, Q.; Boas, D.A. Monte Carlo Simulation of Photon Migration in 3D Turbid Media Accelerated by Graphics Processing Units. Opt. Express 2009, 17, 20178. [Google Scholar] [CrossRef]
- Lee, S.Y.; Zheng, C.; Brothers, R.; Buckley, E.M. Small Separation Frequency-Domain near-Infrared Spectroscopy for the Recovery of Tissue Optical Properties at Millimeter Depths. Biomed. Opt. Express 2019, 10, 5362. [Google Scholar] [CrossRef] [PubMed]
- Choi, J.; Wolf, M.; Toronov, V.; Wolf, U.; Polzonetti, C.; Hueber, D.; Safonova, L.P.; Gupta, R.; Michalos, A.; Mantulin, W.; et al. Noninvasive Determination of the Optical Properties of Adult Brain: Near-Infrared Spectroscopy Approach. J. Biomed. Opt. 2004, 9, 221–229. [Google Scholar] [CrossRef] [Green Version]
- Brigadoi, S.; Cooper, R.J. How Short Is Short? Optimum Source–Detector Distance for Short-Separation Channels in Functional near-Infrared Spectroscopy. Neurophotonics 2015, 2, 025005. [Google Scholar] [CrossRef] [Green Version]
- Fu, X.; Richards, J.E. Age-Related Changes in Diffuse Optical Tomography Sensitivity Profiles in Infancy. PLoS ONE 2021, 16, e0252036. [Google Scholar] [CrossRef]
- Hong, G.; Diao, S.; Chang, J.; Antaris, A.L.; Chen, C.; Zhang, B.; Zhao, S.; Atochin, D.N.; Huang, P.L.; Andreasson, K.I.; et al. Through-Skull Fluorescence Imaging of the Brain in a New near-Infrared Window. Nat. Photonics 2014, 8, 723–730. [Google Scholar] [CrossRef] [PubMed] [Green Version]
- Firbank, M.; Hiraoka, M.; Essenpreis, M.; Delpy, D.T. Measurement of the Optical Properties of the Skull in the Wavelength Range 650-950 Nm. Phys. Med. Biol. 1993, 38, 503–510. [Google Scholar] [CrossRef]
- Genina, E.A.; Bashkatov, A.N.; Tuchin, V.V. Optical Clearing of Cranial Bone. Adv. Opt. Technol. 2008, 2008, 267867. [Google Scholar] [CrossRef] [PubMed] [Green Version]
- Sun, J.; Lee, S.J.; Wu, L.; Sarntinoranont, M.; Xie, H. Refractive Index Measurement of Acute Rat Brain Tissue Slices Using Optical Coherence Tomography. Opt. Express 2012, 20, 1084. [Google Scholar] [CrossRef] [Green Version]
- Jacques, S.L. Optical Properties of Biological Tissues: A Review. Phys. Med. Biol. 2013, 58, R37–R61. [Google Scholar] [CrossRef]
- Gunther, J.E.; Lim, E.A.; Kim, H.K.; Flexman, M.; Altoé, M.; Campbell, J.A.; Hibshoosh, H.; Crew, K.D.; Kalinsky, K.; Hershman, D.L.; et al. Dynamic Diffuse Optical Tomography for Monitoring Neoadjuvant Chemotherapy in Patients with Breast Cancer. Radiology 2018, 287, 778–786. [Google Scholar] [CrossRef]
- Karahaliou, A.; Vassiou, K.; Arikidis, N.S.; Skiadopoulos, S.; Kanavou, T.; Costaridou, L. Assessing Heterogeneity of Lesion Enhancement Kinetics in Dynamic Contrast-Enhanced MRI for Breast Cancer Diagnosis. Br. J. Radiol. 2010, 83, 296–309. [Google Scholar] [CrossRef] [Green Version]
- Kim, J.G.; Liu, H. Investigation of Bi-Phasic Tumor Oxygen Dynamics Induced by Hyperoxic Gas Intervention: A Numerical Study. Opt. Express 2005, 13, 4465. [Google Scholar] [CrossRef]
- Thadewald, T.; Büning, H. Jarque–Bera Test and Its Competitors for Testing Normality—A Power Comparison. J. Appl. Stat. 2007, 34, 87–105. [Google Scholar] [CrossRef]
- Cressie, N.A.C.; Whitford, H.J. How to Use the Two Sample T-Test. Biom. J. 1986, 28, 131–148. [Google Scholar] [CrossRef]
- Sawilowsky, S.S. Misconceptions Leading to Choosing the t Test Over the Wilcoxon Mann-Whitney Test for Shift in Location Parameter. J. Mod. Appl. Stat. Methods 2005, 4, 598–600. [Google Scholar] [CrossRef]
- Ali, M. PyCaret: An Open Source, Low-Code Machine Learning Library in Python. Available online: https://www.pycaret.org (accessed on 1 April 2022).
- DeMaris, A. A Tutorial in Logistic Regression. J. Marriage Fam. 1995, 57, 956–968. [Google Scholar] [CrossRef]
- Pedregosa, F.; Varoquaux, G.; Gramfort, A.; Michel, V.; Thirion, B.; Grisel, O.; Blondel, M.; Prettenhofer, P.; Weiss, R.; Dubourg, V.; et al. Scikit-Learn: Machine Learning in Python. arXiv 2012, arXiv:1201.0490v4. [Google Scholar] [CrossRef]
- Tharwat, A.; Gaber, T.; Ibrahim, A.; Hassanien, A.E. Linear Discriminant Analysis: A Detailed Tutorial. AI Commun. 2017, 30, 169–190. [Google Scholar] [CrossRef] [Green Version]
- Tharwat, A. Linear vs. Quadratic Discriminant Analysis Classifier: A Tutorial. Int. J. Appl. Pattern Recognit. 2016, 3, 145. [Google Scholar] [CrossRef]
- Noble, W.S. What Is a Support Vector Machine? Nat. Biotechnol. 2006, 24, 1565–1567. [Google Scholar] [CrossRef]
- Safavian, S.R.; Landgrebe, D. A Survey of Decision Tree Classifier Methodology. IEEE Trans. Syst. Man Cybern. 1991, 21, 660–674. [Google Scholar] [CrossRef] [Green Version]
- Bentéjac, C.; Csörgő, A.; Martínez-Muñoz, G. A Comparative Analysis of Gradient Boosting Algorithms. Artif. Intell. Rev. 2021, 54, 1937–1967. [Google Scholar] [CrossRef]
- Pal, M. Random Forest Classifier for Remote Sensing Classification. Int. J. Remote Sens. 2005, 26, 217–222. [Google Scholar] [CrossRef]
- Schapire, R.E. Explaining AdaBoost. In Empirical Inference; Schölkopf, B., Luo, Z., Vovk, V., Eds.; Springer: Berlin/Heidelberg, Germany, 2013; pp. 37–52. ISBN 978-3-642-41135-9. [Google Scholar]
- Geurts, P.; Ernst, D.; Wehenkel, L. Extremely Randomized Trees. Mach. Learn. 2006, 63, 3–42. [Google Scholar] [CrossRef] [Green Version]
- Chawla, N.V.; Bowyer, K.W.; Hall, L.O.; Kegelmeyer, W.P. SMOTE: Synthetic Minority Over-Sampling Technique. J. Artif. Intell. Res. 2002, 16, 321–357. [Google Scholar] [CrossRef]
- Raschka, S. An Overview of General Performance Metrics of Binary Classifer Systems. arXiv 2014, arXiv:1410.5330. [Google Scholar] [CrossRef]
- Gaidica, M. Mouse Brain Atlas. Available online: http://labs.gaidi.ca/mouse-brain-atlas/ (accessed on 11 November 2022).
- Paxinos, G.; Franklin, K.B. Paxinos and Franklin’s the Mouse Brain in Stereotaxic Coordinates; Academic Press: Cambridge, MA, USA, 2019. [Google Scholar]
- Abdi, H.; Williams, L.J. Principal Component Analysis. Wiley Interdiscip. Rev. Comput. Stat. 2010, 2, 433–459. [Google Scholar] [CrossRef]
- Ideguchi, H.; Ichiyasu, H.; Fukushima, K.; Okabayashi, H.; Akaike, K.; Hamada, S.; Nakamura, K.; Hirosako, S.; Kohrogi, H.; Sakagami, T.; et al. Validation of a Breath-Holding Test as a Screening Test for Exercise-Induced Hypoxemia in Chronic Respiratory Diseases. Chron. Respir. Dis. 2021, 18, 14799731211012965. [Google Scholar] [CrossRef]
- Stefani, A.; Sancesario, G.; Pierantozzi, M.; Leone, G.; Galati, S.; Hainsworth, A.H.; Diomedi, M. CSF Biomarkers, Impairment of Cerebral Hemodynamics and Degree of Cognitive Decline in Alzheimer’s and Mixed Dementia. J. Neurol. Sci. 2009, 283, 109–115. [Google Scholar] [CrossRef]
- Diomedi, M.; Rocco, A.; Bonomi, C.G.; Mascolo, A.P.; De Lucia, V.; Marrama, F.; Sallustio, F.; Koch, G.; Martorana, A. Haemodynamic Impairment along the Alzheimer’s Disease Continuum. Eur. J. Neurol. 2021, 28, 2168–2173. [Google Scholar] [CrossRef]
- Brenner, M.; Kim, J.G.; Mahon, S.B.; Lee, J.; Kreuter, K.A.; Blackledge, W.; Mukai, D.; Patterson, S.; Mohammad, O.; Sharma, V.S.; et al. Intramuscular Cobinamide Sulfite in a Rabbit Model of Sublethal Cyanide Toxicity. Ann. Emerg. Med. 2010, 55, 352–363. [Google Scholar] [CrossRef] [PubMed] [Green Version]
- Phillips, Z.; Kim, J.B.; Paik, S.-H.; Kang, S.-Y.; Jeon, N.-J.; Kim, B.-M.; Kim, B.-J. Regional Analysis of Cerebral Hemodynamic Changes during the Head-up Tilt Test in Parkinson’s Disease Patients with Orthostatic Intolerance. Neurophotonics 2020, 7, 045006. [Google Scholar] [CrossRef] [PubMed]
- Karamzadeh, N.; Amyot, F.; Kenney, K.; Anderson, A.; Chowdhry, F.; Dashtestani, H.; Wassermann, E.M.; Chernomordik, V.; Boccara, C.; Wegman, E.; et al. A Machine Learning Approach to Identify Functional Biomarkers in Human Prefrontal Cortex for Individuals with Traumatic Brain Injury Using Functional Near-infrared Spectroscopy. Brain Behav. 2016, 6, e00541. [Google Scholar] [CrossRef] [PubMed]
- Yang, D.; Hong, K.-S. Quantitative Assessment of Resting-State for Mild Cognitive Impairment Detection: A Functional Near-Infrared Spectroscopy and Deep Learning Approach. J. Alzheimers Dis. 2021, 80, 647–663. [Google Scholar] [CrossRef] [PubMed]
- Kisler, K.; Nelson, A.R.; Montagne, A.; Zlokovic, B.V. Cerebral Blood Flow Regulation and Neurovascular Dysfunction in Alzheimer Disease. Nat. Rev. Neurosci. 2017, 18, 419–434. [Google Scholar] [CrossRef] [Green Version]
- Singh, C.S.B.; Choi, K.B.; Munro, L.; Wang, H.Y.; Pfeifer, C.G.; Jefferies, W.A. Reversing Pathology in a Preclinical Model of Alzheimer’s Disease by Hacking Cerebrovascular Neoangiogenesis with Advanced Cancer Therapeutics. EBioMedicine 2021, 71, 103503. [Google Scholar] [CrossRef] [PubMed]
- Dorr, A.; Sahota, B.; Chinta, L.V.; Brown, M.E.; Lai, A.Y.; Ma, K.; Hawkes, C.A.; McLaurin, J.; Stefanovic, B. Amyloid-β-Dependent Compromise of Microvascular Structure and Function in a Model of Alzheimer’s Disease. Brain 2012, 135, 3039–3050. [Google Scholar] [CrossRef] [PubMed] [Green Version]
- Saager, R.B.; Telleri, N.L.; Berger, A.J. Two-Detector Corrected Near Infrared Spectroscopy (C-NIRS) Detects Hemodynamic Activation Responses More Robustly than Single-Detector NIRS. NeuroImage 2011, 55, 1679–1685. [Google Scholar] [CrossRef]
- Lee, J.; Kim, J.G.; Mahon, S.B.; Mukai, D.; Yoon, D.; Boss, G.R.; Patterson, S.E.; Rockwood, G.; Isom, G.; Brenner, M. Noninvasive Optical Cytochrome c Oxidase Redox State Measurements Using Diffuse Optical Spectroscopy. J. Biomed. Opt. 2014, 19, 055001. [Google Scholar] [CrossRef] [Green Version]
- Maurer, I. A Selective Defect of Cytochrome c Oxidase Is Present in Brain of Alzheimer Disease Patients. Neurobiol. Aging 2000, 21, 455–462. [Google Scholar] [CrossRef]
- Cardoso, S.M.; Proença, M.T.; Santos, S.; Santana, I.; Oliveira, C.R. Cytochrome c Oxidase Is Decreased in Alzheimer’s Disease Platelets. Neurobiol. Aging 2004, 25, 105–110. [Google Scholar] [CrossRef]

| Scalp | Skull | Brain | ||||
|---|---|---|---|---|---|---|
| Thickness (mm) [36] | 0.7 | 0.6 | 8.7 | |||
| Absorption coefficient (mm−1) [32,33,37] | λ1 | 0.0104 | 0.0250 | λ1 | 0.0132 | |
| λ2 | 0.0103 | λ2 | 0.0131 | |||
| λ3 | 0.0107 | λ3 | 0.0137 | |||
| Scattering coefficient (mm−1) [18,32,36] | λ1 | 9.9982 | λ1 | 25.2684 | λ1 | 11.9932 |
| λ2 | 9.7269 | λ2 | 24.6957 | λ2 | 11.5491 | |
| λ3 | 9.6257 | λ3 | 24.4602 | λ3 | 11.3683 | |
| Refractive index [32,38,39,40] | 1.38 | 1.55 | 1.37 | |||
| Anisotropy [32,37,40] | 0.80 | 0.92 | 0.90 | |||
| Features | WT (Mean ± std) | AD (Mean ± std) | p-Value | Both Passed Normality Test? |
|---|---|---|---|---|
| IE | 1.03 × 100 ± 1.68 × 10⁻² | 1.03 × 100 ± 3.53 × 10⁻² | 0.8429 | × |
| PIE | −4.00 × 10⁻¹ ± 6.61 × 10⁻² | −3.94 × 10⁻¹ ± 1.10 × 10⁻¹ | 0.7950 | ○ |
| mrise | 3.63 × 10⁻⁵ ± 5.45 × 10⁻⁶ | 3.79 × 10⁻⁵ ± 1.46 × 10⁻⁵ | 0.6190 | ○ |
| mfall | −1.43 × 10⁻⁴ ± 4.29 × 10⁻⁵ | −1.61 × 10⁻⁴ ± 6.47 × 10⁻⁵ | 0.2389 | ○ |
| Afall | 6.31 × 10⁴ ± 8.89 × 10⁴ | 7.21 × 10⁵ ± 1.88 × 10⁶ | 0.2798 | × |
| Arise,1 | 2.26 × 10⁻² ± 3.70 × 10⁻² | 3.81 × 10⁻² ± 6.45 × 10⁻² | 0.9298 | × |
| Arise,2 | −4.70 × 10² ± 9.70 × 10² | −4.71 × 101 ± 6.67 × 101 | 0.0086 | × |
| qfall | 1.58 × 10⁻² ± 4.09 × 10⁻³ | 1.79 × 10⁻² ± 5.23 × 10⁻³ | 0.1143 | ○ |
| qrise,1 | −1.06 × 10⁻³ ± 2.84 × 10⁻³ | −8.34 × 10⁻⁴ ± 3.77 × 10⁻³ | 0.8052 | ○ |
| qrise,2 | −1.62 × 10⁻² ± 8.82 × 10⁻³ | −9.68 × 10⁻³ ± 7.23 × 10⁻³ | 0.0066 | ○ |
| Smax | 1.02 × 10⁻² ± 1.87 × 10⁻³ | −1.09 × 10⁻² ± 4.51 × 10⁻³ | 0.4879 | ○ |
| Smin | −2.67 × 10⁻⁴ ± 1.81 × 10⁻⁴ | −2.98 × 10⁻⁴ ± 2.60 × 10⁻⁴ | 0.6340 | ○ |
| SPostBH30sec | 6.00 × 10⁻³ ± 1.23 × 10⁻³ | 6.15 × 10⁻³ ± 2.56 × 10⁻³ | 0.8050 | ○ |
| Features | WT (Mean ± std) | AD (Mean ± std) | p-Value | Both Passed Normality Test? |
|---|---|---|---|---|
| IE | 1.03 × 100 ± 2.48 × 10⁻² | 1.03 × 100 ± 2.30 × 10⁻² | 0.3207 | × |
| PIE | −3.92 × 10⁻¹ ± 1.10 × 10⁻¹ | −3.61 × 10⁻¹ ± 1.34 × 10⁻¹ | 0.3518 | ○ |
| mrise | 3.44 × 10⁻⁵ ± 8.60 × 10⁻⁶ | 4.04 × 10⁻⁵ ± 1.26 × 10⁻⁵ | 0.0499 | ○ |
| mfall | −1.33 × 10⁻⁴ ± 4.14 × 10⁻⁵ | −1.56 × 10⁻⁴ ± 6.14 × 10⁻⁵ | 0.1172 | ○ |
| Afall | 2.33 × 10⁵ ± 4.16 × 10⁵ | 3.35 × 10⁵ ± 1.02 × 10⁶ | 0.4202 | × |
| Arise,1 | 2.09 × 100 ± 4.61 × 100 | 1.33 × 10⁻² ± 1.28 × 10⁻² | 0.2485 | × |
| Arise,2 | −3.56 × 10² ± 5.98 × 10² | −4.47 × 10² ± 8.82 × 10² | 0.8004 | × |
| qfall | 1.65×10⁻² ± 5.59×10⁻³ | 1.69 × 10⁻² ± 6.79 × 10⁻³ | 0.8486 | ○ |
| qrise,1 | −1.88 × 10⁻³ ± 3.31 × 10⁻³ | −6.45 × 10⁻⁴ ± 2.69 × 10⁻³ | 0.1338 | ○ |
| qrise,2 | −1.37 × 10⁻² ± 6.79 × 10⁻³ | −1.46 × 10⁻² ± 7.35 × 10⁻³ | 0.6446 | ○ |
| Smax | 9.81 × 10⁻³ ± 2.61×10⁻³ | 1.16 × 10⁻² ± 3.83 × 10⁻³ | 0.0566 | ○ |
| Smin | −2.68 × 10⁻⁴ ± 2.45 × 10⁻⁴ | −3.29 × 10⁻⁴ ± 2.38 × 10⁻⁴ | 0.3751 | ○ |
| SPostBH30sec | 6.07 × 10⁻³ ± 2.31 × 10⁻³ | 7.49 × 10⁻³ ± 3.04 × 10⁻³ | 0.0615 | ○ |
| Method | [95% CI] | [95% CI] | [95% CI] | [95% CI] |
|---|---|---|---|---|
| Logistic regression | 62.9 [62.0, 63.9] | 35.8 [34.1, 37.4] | 71.8 [69.1, 74.5] | 45.1 [43.5, 46.8] |
| Ridge classifier | 52.4 [51.2, 53.5] | 30.0 [28.5, 31.5] | 62.2 [59.8, 64.6] | 35.9 [31.7, 37.1] |
| Linear discriminant analysis | 53.8 [52.6, 55.1] | 7.3 [6.4, 8.1] | 37.6 [33.7, 41.5] | 11.9 [10.6, 13.2] |
| K-nearest neighbor classifier | 51.9 [51.1, 52.7] | 18.3 [16.9, 19.8] | 42.1 [38.8, 45.3] | 22.3 [20.7, 23.9] |
| Support vector machine | 57.2 [56.2, 58.2] | 52.2 [50.0, 54.4] | 55.1 [52.7, 57.4] | 48.4 [46.4, 50.4] |
| Naive Bayes | 62.4 [61.2, 63.7] | 25.7 [24.5, 26.9] | 84.2 [81.3, 87.1] | 38.4 [36.8, 40.0] |
| Decision tree classifier | 50.1 [48.9, 51.4] | 0.6 [0.3, 1.0] | 1.5 [0.6, 2.3] | 0.8 [0.3, 1.2] |
| Gradient boosting classifier | 46.0 [44.9, 47.2] | 60.8 [58.4, 63.2] | 51.8 [50.0, 53.6] | 48.6 [47.4, 49.9] |
| Light gradient boosting machine | 55.1 [54.2, 55.9] | 12.7 [11.0, 14.5] | 18.0 [15.5, 20.5] | 14.7 [12.7, 16.7] |
| Random forest classifier | 44.6 [43.7, 45.5] | 41.1 [37.6, 44.6] | 32.6 [29.9, 35.4] | 28.1 [26.0, 30.3] |
| Quadratic discriminant analysis | 62.4 [61.4, 63.4] | 27.5 [26.3, 28.6] | 79.0 [76.1, 81.9] | 39.7 [38.2, 41.2] |
| Extreme gradient boosting | 49.5 [48.4, 50.7] | 63.0 [59.3, 66.8] | 32.3 [30.1, 34.5] | 41.3 [38.7, 43.9] |
| AdaBoost classifier | 59.5 [58.2, 60.8] | 24.7 [23.2, 26.2] | 67.8 [64.3, 71.2] | 34.4 [32.5, 36.4] |
| Extra trees classifier | 38.6 [37.6, 39.6] | 39.1 [35.5, 42.8] | 16.2 [14.6, 17.7] | 22.3 [20.2, 24.4] |
| CatBoost classifier | 46.7 [45.2, 48.2] | 26.7 [24.8, 28.6] | 44.8 [41.8, 47.8] | 28.5 [26.9, 30.1] |
| Method | [95% CI] | [95% CI] | [95% CI] | [95% CI] |
|---|---|---|---|---|
| Logistic regression | 71.8 [70.8, 72.8] | 69.7 [68.3, 71.0] | 65.3 [63.7, 66.9] | 65.1 [64.0, 66.2] |
| Ridge classifier | 49.7 [48.7, 50.6] | 42.0 [40.3, 43.8] | 42.9 [40.9, 44.9] | 40.3 [38.7, 41.9] |
| Linear discriminant analysis | 67.0 [65.8, 68.2] | 28.0 [26.0, 30.0] | 64.3 [60.6, 67.9] | 34.0 [31.9, 36.1] |
| K-nearest neighbor classifier | 75.1 [74.0, 76.1] | 43.5 [41.3, 45.7] | 72.4 [69.7, 75.1] | 51.9 [49.6, 54.2] |
| Support
vector machine | 66.7 [65.5, 67.8] | 69.3 [66.8, 71.7] | 50.4 [48.3, 52.5] | 56.9 [54.8, 59.0] |
| Naive Bayes | 84.3 [83.8, 84.8] | 9.7 [68.4, 71.1] | 89.9 [88.4, 91.4] | 75.4 [74.4, 76.3] |
| Decision
tree classifier | 52.7 [51.2, 54.2] | 24.6 [22.7, 26.5] | 25.6 [23.5, 27.7] | 23.4 [21.6, 25.1] |
| Gradient boosting classifier | 51.6 [50.1, 53.1] | 52.7 [50.2, 55.1] | 41.5 [39.4, 43.6] | 42.8 [40.9, 44.7] |
| Light
gradient boosting machine | 54.2 [52.5, 56.0] | 16.7 [14.1, 19.4] | 13.9 [11.9, 15.9] | 14.2 [12.1, 16.3] |
| Random
forest classifier | 54.0 [52.5, 55.5] | 28.8 [26.2, 31.5] | 27.3 [25.1, 29.5] | 24.8 [22.8, 26.8] |
| Quadratic
discriminant analysis | 81.3 [80.6, 81.9] | 75.4 [74.0, 76.8] | 76.6 [75.3, 77.8] | 74.0 [73.0, 75.0] |
| Extreme gradient boosting | 39.5 [38.4, 40.5] | 78.9 [76.1, 81.6] | 34.6 [33.1, 36.1] | 44.9 [43.1, 46.7] |
| AdaBoost classifier | 59.1 [58.1, 60.2] | 39.5 [37.1, 41.8] | 43.2 [40.5, 45.9] | 39.6 [37.3, 42.0] |
| Extra trees classifier | 54.4 [53.0, 55.8] | 19.7 [16.9, 22.5] | 17.8 [15.3, 20.4] | 13.2 [11.5, 14.9] |
| CatBoost classifier | 49.1 [47.5, 50.7] | 38.3 [36.0, 40.6] | 39.2 [36.8, 41.6] | 38.1 [35.8, 40.3] |
| Method | [95% CI] | [95% CI] | [95% CI] | [95% CI] |
|---|---|---|---|---|
| Logistic regression | 73.8 [72.9, 74.7] | 83.2 [82.0, 84.4] | 69.3 [68.0, 70.5] | 74.1 [73.1, 75.0] |
| Ridge classifier | 73.5 [72.6, 74.4] | 83.2 [82.0, 84.4] | 68.9 [67.6, 70.2] | 73.9 [73.0, 74.8] |
| Linear discriminant analysis | 73.7 [72.8, 74.6] | 83.2 [82.0, 84.4] | 69.1 [67.9, 70.4] | 74.0 [73.1, 74.9] |
| K-nearest neighbor classifier | 73.8 [72.8, 74.7] | 80.9 [79.4, 82.5] | 68.9 [67.5, 70.4] | 72.9 [71.6, 74.1] |
| Support
vector machine | 71.1 [70.3, 71.9] | 81.7 [80.2, 83.1] | 65.5 [64.2, 66.9] | 71.1 [69.9, 72.2] |
| Naive Bayes | 73.3 [72.5, 74.1] | 85.6 [84.4, 86.7] | 67.8 [66.6, 69.0] | 74.1 [73.3, 75.0] |
| Decision
tree classifier | 61.5 [60.2, 62.7] | 37.3 [34.3, 40.3] | 47.2 [44.1, 50.2] | 37.8 [35.1, 40.5] |
| Gradient boosting classifier | 72.4 [71.2, 73.5] | 67.4 [64.8, 70.0] | 69.1 [67.0, 71.2] | 64.5 [62.4, 66.7] |
| Light
gradient boosting machine | 65.7 [64.3, 67.0] | 41.2 [37.8, 44.5] | 41.9 [38.7, 45.0] | 39.2 [36.2, 42.3] |
| Random
forest classifier | 69.0 [67.7, 70.2] | 58.3 [55.5, 61.2] | 62.9 [60.5, 65.4] | 56.3 [53.9, 58.7] |
| Quadratic discriminant analysis | 72.7 [718, 73.6] | 83.8 [82.6, 85.0] | 67.6 [66.4, 68.9] | 73.4 [72.5, 74.3] |
| Extreme gradient boosting | 63.1 [62.0, 64.1] | 73.6 [71.4, 75.8] | 60.1 [58.4, 61.7] | 62.0 [60.5, 63.6] |
| AdaBoost classifier | 65.2 [63.9, 66.5] | 49.1 [46.1, 52.1] | 56.2 [53.3, 59.1] | 47.9 [45.3, 50.5] |
| Extra trees classifier | 76.0 [75.1, 76.9] | 80.1 [78.5, 81.7] | 72.3 [70.9, 73.7] | 74.2 [73.0, 75.4] |
| CatBoost classifier | 65.8 [64.6, 67.0] | 53.4 [50.5, 56.3] | 60.5 [57.9, 63.1] | 57.1 [49.3, 54.1] |
Publisher’s Note: MDPI stays neutral with regard to jurisdictional claims in published maps and institutional affiliations. |
© 2022 by the authors. Licensee MDPI, Basel, Switzerland. This article is an open access article distributed under the terms and conditions of the Creative Commons Attribution (CC BY) license (https://creativecommons.org/licenses/by/4.0/).
Share and Cite
Seong, M.; Oh, Y.; Park, H.J.; Choi, W.-S.; Kim, J.G. Use of Hypoxic Respiratory Challenge for Differentiating Alzheimer’s Disease and Wild-Type Mice Non-Invasively: A Diffuse Optical Spectroscopy Study. Biosensors 2022, 12, 1019. https://doi.org/10.3390/bios12111019
Seong M, Oh Y, Park HJ, Choi W-S, Kim JG. Use of Hypoxic Respiratory Challenge for Differentiating Alzheimer’s Disease and Wild-Type Mice Non-Invasively: A Diffuse Optical Spectroscopy Study. Biosensors. 2022; 12(11):1019. https://doi.org/10.3390/bios12111019
Chicago/Turabian StyleSeong, Myeongsu, Yoonho Oh, Hyung Joon Park, Won-Seok Choi, and Jae Gwan Kim. 2022. "Use of Hypoxic Respiratory Challenge for Differentiating Alzheimer’s Disease and Wild-Type Mice Non-Invasively: A Diffuse Optical Spectroscopy Study" Biosensors 12, no. 11: 1019. https://doi.org/10.3390/bios12111019
APA StyleSeong, M., Oh, Y., Park, H. J., Choi, W.-S., & Kim, J. G. (2022). Use of Hypoxic Respiratory Challenge for Differentiating Alzheimer’s Disease and Wild-Type Mice Non-Invasively: A Diffuse Optical Spectroscopy Study. Biosensors, 12(11), 1019. https://doi.org/10.3390/bios12111019


