Abstract
Facet and defect engineering have achieved great success in improving the catalytic performance of CeO2, but the inconsistent reports on the synergistic effect of facet and oxygen vacancy and the lack of investigation on the heavily doped oxygen vacancy keeps it an attractive subject. Inspired by this, CeO2 nanocrystals with selectively exposed crystalline facets (octahedron, cube, sphere, rod) and abundant oxygen vacancies have been synthesized to investigate the synergistic effect of facet and heavily doped oxygen vacancy. The contrasting electrochemical behavior displayed by diverse reduced CeO2 nanocrystals verifies that oxygen vacancy acts distinctly on different facets. The thermodynamically most stable CeO2 octahedron enclosed by heavily doped (111) facets surprisingly exhibited the optimum non-enzymatic H2O2 sensing performance, with a high sensitivity (128.83 µA mM−1 cm−2), a broad linear range (20 µM~13.61 mM), and a low detection limit (1.63 µM). Meanwhile, the sensor presented satisfying selectivity, repeatability, stability, as well as its feasibility in medical disinfectants. Furthermore, the synergistic effect of facet and oxygen vacancy was clarified by the inclined distribution states of oxygen vacancy and the electronic transmission property. This work enlightens prospective research on the synergistic effect of alternative crystal surface engineering strategies.
1. Introduction
Hydrogen peroxide (H2O2) is a common oxidizing agent and an essential intermediate in biomedical, pharmaceutical, industrial, and environmental fields, as well as enzymatic reactions [1,2,3,4,5]. Therefore, it is of great significance to develop efficient techniques for the reliable, accurate, and fast detection of H2O2. Although enzymatic H2O2 sensing electrodes are widely used to provide the desired specificity and sensitivity, the sophisticated immobilization processes, instability, and high cost impede their further popularization. Fortunately, the emergence of inorganic nanocatalysts blazes a new trial in the application of non-enzymatic electrochemical sensors due to their excellent enzyme-mimetic catalytic properties, high stability, and low budget [6,7,8,9]. Among the various inorganic catalysts, CeO2 has been extensively used as an active component due to its outstanding redox property, controlled morphology, abundant reserves, and non-toxic nature [10,11,12,13].
Exposed facets and oxygen vacancies (denoted as OVs hereafter) display crucial roles in achieving superior catalytic activity. Atomic arrangement, electron distribution, coordination state, and surface energy on different facets differs, which endows nanocrystals with diverse catalytic activity [14,15,16]. OVs have also been confirmed beneficial in accelerating electron transfer, facilitating adsorption of reactant, lowering barrier energy of reactions, and increasing catalytic active sites [17,18,19]. Inspired by the positive effect reported, the role of facets and OVs in CeO2 has been extensively studied. Datye and Henson explored that Pd supported on (111) surfaces of ceria rods exhibits room-temperature CO oxidation activity, while Pd on (100) surface of ceria cubes shows comparable activity at a temperature higher than 60 °C [20]. Zhang and Shi reported that Cu doping can increase the O vacancy concentration in CeO2–x and promote the photocatalytic activity of CeO2−x by ~26 times [21]. Jiang et al. proposed that CeO2 nanorods with well-defined {110} and {100} crystal facets exhibits superb catalytic activity H2S selective oxidation due to the higher concentration of surface oxygen vacancies [22]. Zhan et al. also found that a Ru/CeO2 catalyst possesses more oxygen vacancy when a CeO2 rod with a predominantly exposed {110} surface facet is used, which provides higher ability in propane combustion [23]. Peng and Si reported the roles of different OVs in toluene combustion, which unraveled that surface vacancies tend to adsorb and activate gaseous O2 to form adsorbed oxygen species, whereas bulk vacancies improve the mobility and activity of lattice oxygen species [24]. Although great successes have been achieved in studying the multiple features of facets and OVs in CeO2, the relationship between facets and OVs, especially heavy-doped OVs, is still unclear since the majority of previous studies focused on the spontaneously generated OVs with low concentration and random distribution.
In 2005, Esch et al. discovered the unraveled oxygen vacancy clusters in CeO2 via high-resolution STM and found the cluster play crucial roles in the redox properties of CeO2 catalysts [25]. Li et al. further proved that the vacancy clusters were more active than the mono-dispersed vacancies in CO oxidation [26]. According to previous literature, OVs tend to cluster on reduced CeO2 (111) planes and preferentially align in the <111> direction, which has been proposed in theoretical explorations [27] and proved by observations through high-resolution STM [25], atom-resolved noncontact atomic force microscopy [28], and dynamic force microscopy [29]. However, OVs in an octahedral CeO2 nanocrystal with a (111) surface always failed to provide superior performance [22,23,24], which makes it an interesting research subject to discover the technique of efficiently introducing sufficient OVs into CeO2 (111) and to verify the synergistic interactions between heavily doped OVs and facets.
In this work, CeO2 octahedrons with selectively exposed (111) facets were synthesized and subsequently introduced with abundant OVs through aluminothermic reduction. Systematic characterizations, including morphology, phase, electron structure, and H2O2 sensing performance, were carried out on CeO2 octahedrons before/after reduction to determine the effect of injected OVs on a (111) facet. In order to verify the synergistic effect of OVs and facets, the comparative electrocatalytic investigation was conducted on CeO2 nanocrystals with diverse exposed facets before and after reduction. Furthermore, the mechanism of the extraordinary effect of OVs in CeO2 octahedron was elaborated from the perspective of the distribution states of OVs and the electron-transfer characteristic. Our work provides a new idea to developing high-efficiency catalysts and might enlighten the prospective research regarding the synergistic effect of different crystal surface engineering strategies.
2. Materials and Methods
2.1. Reagents and Apparatus
All reagents were purchased from suppliers and were used directly without purification. Cerium nitrate hexahydrate (Ce(NO3)3.6H2O, 99.95%), sodium phosphate tribasic dodecahydrate (Na3PO4·12H2O, 98.0%, AR), D-(+)-galactose (C6H12O6, 99%), D-Fructose (C6H12O6, 99%), ascorbic acid (AA, C6H8O6, 99.99%), uric acid (UA, C5H4N4O3, 99%), and dopamine hydrochloride (DA, C8H11NO2·HCl, 98%) were purchased from Aladdin Reagent. Sodium hydroxide (NaOH, ≥98%), ethylene glycol (C2H6O2, >99.5%, AR), aluminum powder (Al, 100–200 mesh, 99%), acetone (C3H6O, ≥99.5%, AR), iodine (I2, ≥99.8%, AR), sodium dihydrogen phosphate dihydrate (NaH2PO4·2H2O, >99.5%, AR), disodium hydrogen phosphate dodecahydrate (Na2HPO4·12H2O, ≥99.0%, AR), sodium chloride (NaCl, ≥99.5%, AR), and ethanol absolute (C2H6O, ≥99.7%, AR) were purchased from Sinopharm Chemical Reagent. Polyvinylpyrrolidone (PVP, MW = 40000) was purchased from VETEC Reagent. Potassium chloride (KCl, ≥99.5%) and hydrogen peroxide 30% (H2O2, 30%, GR) were purchased from Tianjin Kermel Chemical Reagent. α-D-glucose (C6H12O6, 96%) was purchased from Sigma Aldrich Reagent. Fluorine-doped Tin Oxide (FTO) was purchased from Zhuhai Kaivo Optoelectronic Technology Co., Ltd. (Zhuhai, China). The real medical disinfectant, mainly composed of sodium hypochlorite, surfactants, NaOH, and compound essences was purchased in the supermarket.
X-ray diffraction patterns (XRD) were recorded by a Rigaku DMAX-2500PC diffractometer with Cu Kα radiation (λ = 0.15406 nm) (scanning rate: 10°/min). Field emission scanning electron micrograph (FE-SEM) was acquired on a JEOL JEM-7800F. Transmission Electron Microscopy (TEM) images were taken with JOEL JEM-2100F operated at 200 kV. Electron paramagnetic resonance (EPR) test was carried out on a JES-X320 electron spin resonance spectrometer at room temperature. X-ray photoelectron spectroscopy were analyzed by a Kratos AXIS Supra using Mg Kα radiation of 1253.6 eV. The XPS spectra were charge corrected with the C 1s peak at 284.8 eV.
2.2. Preparation of CeO2 with Selectively Exposed Facet
The fabrication procedures, including hydrothermal reaction, aluminothermic reduction, and electrophoretic deposition (EPD), are outlined in Scheme 1.
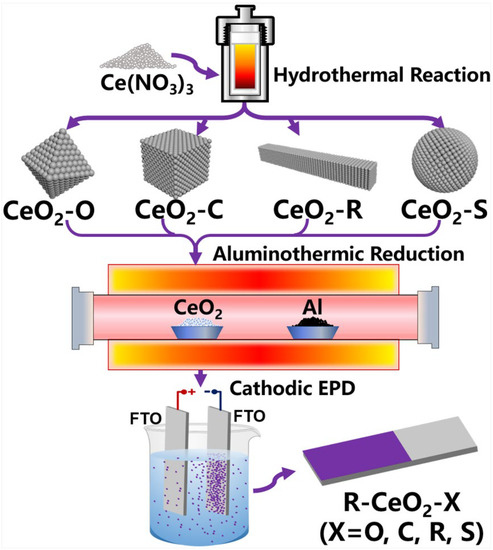
Scheme 1.
Schematic diagram of the fabrication procedures.
2.2.1. Preparation of CeO2 with Selectively Exposed Facet
CeO2 octahedron: Firstly, 0.08 mmol Na3PO4·12H2O was dissolve in 64 mL deionized water. After complete dissolution, 8 mmol Ce(NO3)3·6H2O was added. The solution was kept under magnetic stirring for 1 h at room temperature. Then the solution was transferred into an 80 mL Teflon-lined stainless-steel autoclave and heated at 160 °C for 12 h. After hydrothermal reaction, the powder at the bottom of the Teflon-lined autoclave was centrifuged and washed with deionized water and ethanol until pH = 7. Finally, the samples were dried at 60 °C for 24 h and then calcined at 600 °C for 5 h at a ramp rate of 5 °C/min in a muffle furnace. The obtained CeO2 octahedral samples are marked as CeO2-O.
CeO2 cube and rod: Firstly, 3.2 mmol Ce(NO3)3·6H2O and 0.384 mol NaOH were dissolved in 64 mL deionized water under magnetic stirring for 30 min. Then the solution was transferred to an 80 mL Teflon-lined stainless steel autoclave and heated for 24 h (cube: at 180 °C, rod: at 100 °C). After hydrothermal reaction, the powder was centrifuged and washed with deionized water and ethanol until pH = 7. Finally, the samples were dried at 60 °C for 24 h and then calcined at 600 °C for 5 h at a ramp rate of 5 °C/min in a muffle furnace. The obtained CeO2 cube and rod samples are marked as CeO2-C and CeO2-R, respectively.
CeO2 sphere: Firstly, 4.6 mmol Ce(NO3)3·6H2O and 0.8 g PVP were dissolved in 56 mL ethylene glycol, then 8 mL deionized water was added into the solution under magnetic stirring for 30 min. Then the solution was transferred to an 80 mL Teflon-lined stainless steel autoclave and heated at 160 °C for 24 h. After hydrothermal reaction, the powder was centrifuged and washed with deionized water and ethanol until pH = 7. Finally, dried at 60 °C for 24 h, calcined at 600 °C for 5 h at a rate of 5 °C/min in a muffle furnace. The obtain CeO2 sphere samples are marked as CeO2-S.
2.2.2. Non-Contacting Reduction Process of CeO2
Rapid aluminothermic reaction is an efficient technology recently applied to reduce various oxides [30] and was adopted to introduce abundant OVs into CeO2. An alumina calcination boat, on the bottom of which the prepared CeO2 samples were evenly spread, was placed at the far-end of the quartz tube. Another calcination boat containing excess aluminum powder was placed at the near-end of the pump. The tube was pre-evacuated to a pressure of less than 6 × 10⁻⁴ Pa. Then the CeO2 samples and aluminum powder were both heated to 700 °C for 3 h at a heating rate of 5 °C/min. After cooling to room temperature, the reduced CeO2 samples were obtained and denoted as R-CeO2-X (X = O, C, R or S).
2.2.3. Preparation of Electrode
Before the formal filming process, the FTO substrates were cleaned with following the previous reports [31,32,33]. CeO2-assembled FTO electrodes were prepared through electrophoretic deposition. CeO2 powder (9.6 mg) and iodine (2.4 mg) were dispersed in acetone (20 mL) by ultrasonic treatment. The reaction of acetone and iodine produces free protons that will adsorb on the CeO2 particles in the suspension and increase their surface charges, thus facilitating the electrophoretic process. Two pieces of FTO were placed parallel and held in the above solution for 5 min under a bias voltage of 10 V. The deposition area was fixed at 1 cm2 by controlling the immersion area during the electrophoretic process. Finally, the uniformly deposited FTO on the cathode was dried in a vacuum oven at 150 °C for 2 h to remove iodine.
2.3. Electrochemical Measurements
All electrochemical measurements were performed on an Ivium Vertex One EIS electrochemical workstation. The electrochemical tests were carried out in a conventional three-electrode system with a 1.5 cm × 1.5 cm Pt plate as counter electrode, an Ag/AgCl electrode as reference electrode, CeO2-assembled FTO as working electrode, and 0.1 M PBS as electrolyte. The electrolyte for the electrochemical measurements was a N2-saturated 0.1 M phosphate buffer (PBS, pH = 7.4) in the absence/presence of H2O2.
3. Results and Discussion
3.1. Characterization of OVs in CeO2-O
The effect of OVs on the morphology of CeO2 nanocrystals was investigated by comparable studies on CeO2-O and R-CeO2-O. As shown in the scanning electron microscope (SEM) and transmission electron microscopy (TEM) images (Figure 1a,b), the monodispersed nanocrystals (CeO2-O), with a side length of about 150 nm, were successfully fabricated. After aluminothermic reduction, the octahedral morphology is well-preserved (Figure S1). In the view of high-resolution transmission electron microscopy (HRTEM) (Figure 1c,d), the lattice fringe of both samples almost reaches the edge of crystals, indicating high crystallinity across the whole grain. According to Figure 1c, CeO2-O presents a determined interplanar spacing of 0.27 nm, which corresponds to the {100} crystal plane group. Since the electron beam of TEM was irradiated on the octahedron along the ⟨001⟩ direction, the exposed facets of CeO2-O can be indexed as {111} crystal plane group through simple crystallographic calculation. The inset SAED patterns reveal clear diffraction spots, indicating the monocrystalline structure for both samples. In Figure 1d, no trace of surface disorder layer, which was usually detected in thermally reduced nanomaterials in previous reports [30,34], can be verified in R-CeO2-O. However, the close observation of atom configuration discovers the imperfect periodicity of the lattice. On the one hand, both samples show a transition layer, with a thickness of 4–6 atomic layers, between the surface layer (3–5 atomic layers) and bulk, as separated with red lines. Lattice fringes are cut off by the transition layer, presenting numerous mismatched atomic layers (marked with green or blue arrows) as a typical Shockley stacking fault. On the other hand, some additional indistinct and uneven areas (marked with yellow dotted circles) can be verified according to the contrast difference in Figure 1d, confirming the higher concentration of OVs in R-CeO2-O.
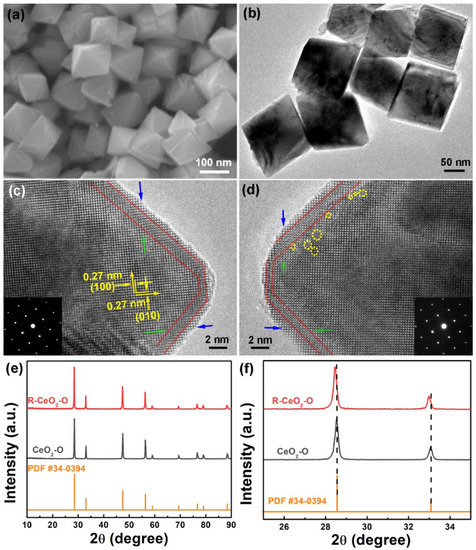
Figure 1.
(a) SEM, (b) TEM, and (c) HRTEM images of CeO2-O. (d) HRTEM image of R-CeO2-O. (e,f) XRD patterns of CeO2-O and R- CeO2-O.
Besides direct observation through high-resolution imaging instruments like TEM, STEM, AFM, etc., the defects can also be indirectly detected through multiple conventional strategies. Firstly, the lattice stretching induced by OVs can be monitored by XRD patterns of R-CeO2-O and CeO2-O, as shown in Figure 1e. Both samples show identical diffraction patterns with nine characteristic peaks at 2 θ = 28.6°, 33.1°, 47.5°, 56.3°, 59.1°, 69.4°, 76.7°, 79.1°, and 88.4°, corresponding to (111), (200), (220), (311), (222), (400), (331), (420), and (422) facets of face-centered cubic (FCC) fluorite structure with space group Fm-3m of CeO2 crystal (PDF #34-0394), respectively. In order to get a clear view, the regions with the diffraction angle of 25°–35° are magnified and shown in Figure 1f. The slight shift of characteristic peaks towards lower angle direction for R-CeO2-O implies an expansion of lattice after aluminothermic reduction reaction, which can be ascribed to the repulsive force of charged OVs [25,26,27,28,29].
Secondly, according to previous report [24], the concentration of OVs in CeO2 samples can be evaluated by a Raman test, which was conducted on CeO2-O and R-CeO2-O and the normalized spectra were recorded in Figure 2a. Four obvious peaks can be observed in both curve, which are located at 257 cm−1, 462 cm−1, 600 cm−1, and 1170 cm−1. Among them, the distinct characteristic peak at 462 cm−1 belongs to the F2g mode in fluorite structure CeO2 [35], which is attributed to a symmetrical stretching mode of the vibrating unit between Ce4+ and the surrounding eight oxygen atoms [36,37,38]. The weak characteristic peak at 257 cm−1, 600 cm−1, and 1170 cm−1 is attributed to the second-order transverse acoustic (2TA), defect-induced (D), and longitudinal optical (2LO) modes [22]. The presence of OVs in CeO2 crystal can be reflected in the peak intensity of D mode [36,39,40]. Generally, the ratio of the intensity of the strong characteristic peak at 600 cm−1 to the weak characteristic peak at 462 cm−1 (I600/I462) can be applied to evaluate the concentration of OVs [24]. In Figure 2a, R-CeO2-O shows obviously higher intensity at D mode peak. Since the peak intensity at 600 cm−1 has been normalized, R-CeO2-O obtains much higher ratio of I600/I462, indicating increased OVs in CeO2-O. The relative concentration of OVs was further confirmed by calculating the nature of the major peak at 462 cm−1 based on the spatial correlation model [37,41]. The relative values are 6.3 × 1021 cm−3 (CeO2-O) and 13.3 × 1021 cm−3 (R-CeO2-O), respectively, which is consistent with the result of I600/I462.
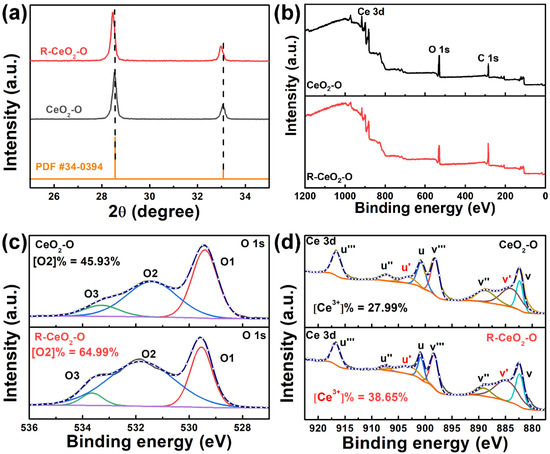
Figure 2.
(a) Raman, XPS (b) survey, (c) O 1s, and (d) Ce 3d spectra of CeO2-O and R-CeO2-O.
Thirdly, the residual electrons from the extracted oxygen atoms are commonly believed to transfer to the neighboring Ce atoms and partially fill Ce f orbit [25,29,42], inducing modifications of magnetic properties. Electron paramagnetic resonance (EPR) has been widely applied to semi-quantitatively analyze the OVs in transition metal oxide [30,34]. As shown in Figure S2, the recorded spectra of CeO2-O and R-CeO2-O both have a fingerprint signal at g = 1.997, which originates from the unpaired electrons on the f orbit of Ce3+ [43]. The obviously stronger signal for R-CeO2-O suggests that abundant OVs and Ce3+ are generated in R-CeO2-O.
Lastly, the electron transportation from OVs to neighboring Ce atoms naturally changes the electronic structure, which brings X-ray photoelectron spectroscopy (XPS) an effective approach to investigate OVs. Figure 2b shows the wide XPS survey spectra of CeO2-O and R-CeO2-O, which confirm the identical pure composition of Ce and O elements. The O 1s spectra shown in Figure 2c can be deconvoluted into three individual peaks, which are denoted as O1, O2, and O3, respectively [44]. The O1 peak at 529.5 eV represents the metal–oxygen bond (Ce-O bond) and the O2 peak at 531.4 eV is attributed to the OVs, while the O3 peak at 533.3 eV can be ascribed to the oxygen in the adsorbed hydroxyl group on the surface [45]. The concentration of OVs can be determined through dividing the total peak area of (O1 + O2 + O3) by the peak area of O2, which reveals that the proportion of O2 in R-CeO2-O (64.99%) is higher than that in CeO2-O (45.93%). The higher concentration of O2 indicates that extra OVs are created in R-CeO2-O. The spectra of Ce 3d can be deconvoluted into two groups of partially overlapping peaks. The peaks corresponding to Ce 3d3/2 are labeled with group u (u-u’’’), while peaks related with Ce 3d5/2 are labeled with group v (v-v’’’). All peaks are specifically expressed as u’’’ (916.6 eV), u‘‘ (907.2 eV), u‘‘ (903.1 eV), u (900.7 eV), v’’ (898.1 eV), v’’ (888.7 eV), v’’ (884.0 eV), and v (882.4 eV), where u’ and v’ correspond to Ce3+ and the remaining six peaks correspond to Ce4+ (Figure 2d) [46]. The content of Ce3+ can be estimated by the peak area ratio of Ce3+ (u’ and v’) to all the fitted peaks, which is calculated to be 27.99% for CeO2-O and 38.65% for R-CeO2-O, respectively. The superior concentration of Ce3+ in R-CeO2-O, inconsistent with its higher proportion of O2, verifies the efficient injection of OVs, which is of great significance and may contribute to improving catalytic performance.
Above all, abundant additional OVs and Ce3+, which will play an important role in improving H2O2 electrochemical performance, are efficiently introduced into R-CeO2-O by aluminothermic reaction, as proved by multiple characterizations.
3.2. Effect of OVs on H2O2 Sensing Performance
In order to present a comprehensive and precise view of the electrochemical behavior of R-CeO2-O, systematic electrochemical tests were carried out in a three-electrode system. At first, CV tests were conducted in electrolytes containing different amounts of H2O2 in order to preliminarily evaluate the linearity of current response, which is a key index for sensors. As shown in Figure 3a, the cathodic peak currents of the CV curves gradually increase with the elevating concentration of H2O2 (1 mM–5 mM). Meanwhile, the peak position gradually shifts to the negative direction, which is attributed to the restricted diffusion process of H2O2. R-CeO2-O shows an excellent linear relationship between cathodic peak current density and the concentration of H2O2 in Figure 3b, which indicates its potential to achieve superior H2O2 catalytic performance.
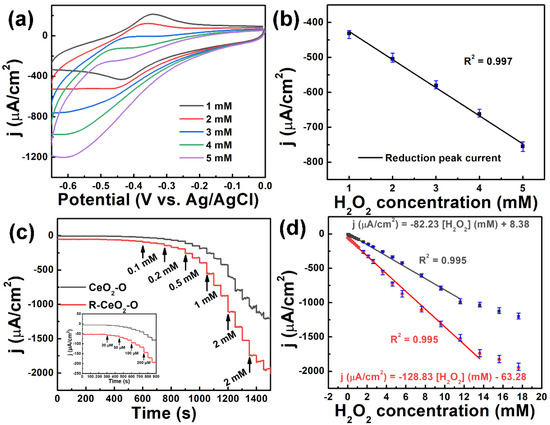
Figure 3.
(a) CV scans of R-CeO2-O in 0.1 M PBS with different concentration of H2O2 and (b) linear plot of cathodic peak current density versus H2O2 concentrations. (c) Amperometric response of R-CeO2-O after continuous injection of H2O2 in 0.1 M PBS solution with a bias of −0.5 V. (d) Linear plots of current density versus H2O2 concentrations.
Further evaluation of the sensing performance relies on the precise measurement of key indexes, such as sensitivity, linear range, detection limit, selectivity, stability, and reproducibility, which were all investigated via chronoamperometry (CA) method in this work. Before the formal CA test, the optimal operation voltage of chronoamperometry test was determined by recording the Current density vs. Time curves with continuous injection of H2O2 (1 mM) into 0.1 M PBS per 50s under different bias voltages (−0.3~0.6 V). As shown in Figure S3, the current responds as soon as the H2O2 is injected and quickly reaches a steady state, which indicates that H2O2 can be rapidly adsorbed, activated, and decomposed on the surface of R-CeO2-O. The current density elevates with the increasing bias voltage until the voltage reaches −0.6 V, at which the amperometric curve can hardly be distinguished from the curve recorded at −0.5 V. In order to prevent excessive negative potential and possible interference [47], a bias of −0.5 V was applied as the operation potential for further CA tests. As presented by Figure 3c, the amperometric response of CeO2-O and R-CeO2-O both increases with continuous injection of H2O2, while R-CeO2-O obtains significantly higher current density than CeO2-O, testifying the boosted activity of R-CeO2-O in catalyzing H2O2 reduction. The calibration curve shown in Figure 3d evidences the well-fitted linear relationship between H2O2 concentration and current density. The sensitivity of R-CeO2-O is calculated to be 128.83 μA·mM−1·cm−2 with a wide linear detection range of 20 μM–13.61 mM and a low detection limit of 1.63 μM (S/N = 3) (linear regression equation: j (μA/cm2) = −128.83 [H2O2] (mM) − 63.28 (R2 = 0.995)). For comparison, CeO2-O presents a decaying sensitivity (82.23 μA·mM−1·cm−2) with narrowed linear detection range (20 μM–1.61 mM) and higher detection limit of 2.45 μM (S/N = 3) (linear regression equation: j(μA/cm2) = −82.23 [H2O2] (mM) + 8.38 (R2 = 0.995)).
In order to obtain an objective evaluation of CeO2-O and R-CeO2-O sensors in our work, their typical sensing-performance indicators were compared with other CeO2-containing H2O2 sensors available in previous reports [38,48,49,50,51,52,53]. The collected data shown in Table 1 verifies the leading position of R-CeO2-O and CeO2-O sensor with impressive sensitivity and wide linear range among recent CeO2-dominated H2O2 sensors [48,49,50]. Furthermore, the R-CeO2-O and CeO2-O sensors show comparable (even better) performance to some CeO2-containing sensors assembled with other electro-active catalysts such as noble metal [38,49,51,52] and conductive nanocarbon species [38,53]. Thus, the synergistic design of crystal facet and defect dependent nano-ceria, realizes the superior H2O2 electrochemical sensing performance, providing a facile and cost-effective approach in developing high-quality non-enzymatic electrochemical sensors.

Table 1.
Comparison of sensitivity, linear range, and detection limit of various H2O2 sensors constructed on the basis of CeO2-dominated electrode nanomaterials.
3.3. Synergistic Effect of Facets and Oxygen Vacancies
In order to investigate the comprehensive effect of facet and oxygen vacancy on H2O2 sensing performance, CeO2 nanocrystals with other different exposed facets were successfully fabricated and their morphologies and phase were characterized by SEM and XRD (Figure S4). According to the previous reports, the surface of CeO2-C, CeO2-R, and CeO2-S are dominated by (100), (110) + (100), (111 + 100) facets, respectively [22,54,55,56]. The N2 adsorption–desorption isotherms test was also conducted, as shown in Figure S5a. All samples exhibit the H3 type hysteresis loop due to the accumulation of nanoparticles. The specific surface area was calculated and ranks in the order of R-CeO2-S (117.5 cm3/g) > R-CeO2-R (57.2 cm3/g) > R-CeO2-C (21.7 cm3/g) > R-CeO2-O (10.6 cm3/g). The Raman spectra of reduced CeO2 nanocrystals (Figure S5b) were recorded to determine the concentration of OVs, which was calculated to be 13.3 × 1021 cm−3 (R-CeO2-O), 20.3 × 1021 cm−3 (R-CeO2-C), 15.9 × 1021 cm−3 (R-CeO2-R), and 28.5 × 1021 cm−3 (R-CeO2-S) respectively.
In order to explore the synergistic effect of facets and OVs, the electrochemical performance of CeO2 samples with different morphologies before/after reduction was studied by cyclic voltammetry (CV) test in N2-saturated PBS solutions in the absence/presence of 1 mM H2O2 at the scan rate of 50 mV/s. Specifically, in Figure 4a, the CV curves of all pristine samples show low current density and identical oval shape with no shape redox peaks. After adding 1 mM H2O2, the reduction current density of all pristine samples increases slightly; however, the CV curves turn more oblique in shape (Figure 4b), indicating low catalytic activity and poor electrochemical kinetics. After aluminothermic reduction, the current response of all samples increases significantly (Figure 4c), which can be ascribed to the injection of abundant Ce3+ and OVs. Generally speaking, the removal of oxygen atoms from lattice improves electrochemical catalytic performance in two aspects. Firstly, two electrons previously bound to the discharged oxygen remain in the oxide and populate defect states located inside the bandgap (in-gap states). When these donor states are shallow, some electrons can delocalize into the conduction band, where they can conduct electrons in a nominally insulating material. Therefore, the conductivity of n-type oxides can be improved by introducing OVs into the lattice, which is also observed in SrTiO3 [57]. Secondly, the discharge of oxygen atoms leaves abundant unsaturated dangling bonds on the surface or sub-surface, hence facilitating the adsorption of reactants. Meanwhile, the charge accumulation regions around OVs, induced by localized electrons, can activate the adsorbed species and decrease the reaction energy barrier. Consequently, OVs are capable of acting as active reaction centers.
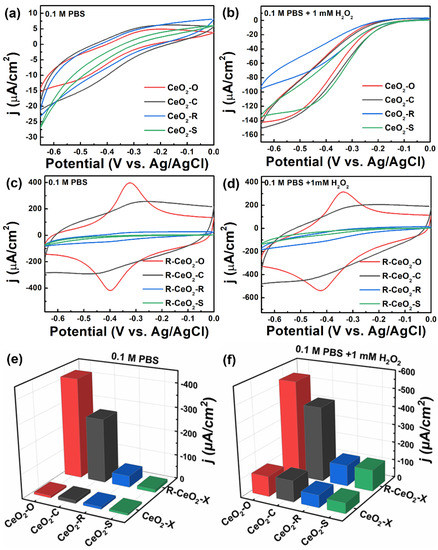
Figure 4.
CV curves of CeO2-X samples in N2-saturated 0.1 M PBS containing (a) 0 mM and (b) 1 mM H2O2; CV curves of R-CeO2-X samples in N2-saturated 0.1 M PBS containing (c) 0 mM and (d) 1 mM H2O2. 3D histograms of reduction peak currents for CeO2 with four different morphologies before and after reduction in N2-saturated 0.1 M PBS containing (e) 0 mM and (f) 1 mM H2O2.
Based on the mechanisms above, the current density should show a positive correlation with the concentration of OVs. However, R-CeO2-O enclosed by (111) planes are thermodynamically most stable and less prone to accommodate OVs, as can be seen from the order of vacancy formation energy on the low index surfaces ((111) > (100) > (110)) [58,59,60], obtain boosted current density, which is comparable with R-CeO2-C and much higher than R-CeO2-R and R-CeO2-S. Besides the elevated current density, it is interesting that the CV curves of R-CeO2-O and R-CeO2-C are distinct in shape (Figure 4c,d). The CV curve of R-CeO2-C is quasi-rectangle in shape with a dimly visible oxidation peak at −0.2 V to −0.35 V and a reduction peak at −0.35 V to −0.5 V, which corresponds to the redox reaction between Ce3+ and Ce4+. In contrast, the CV curve of R-CeO2-O shows two noteworthy redox peaks centered in −0.32 V and −0.40 V. The narrow peaks of Ce3+ ↔ Ce4+ have high intensity which illustrates that the redox reaction is completed in a restricted potential region, and favors the application as a signal amplifier of sensor.
The diverse effect of OVs on different facets can be distinguished from the abnormally elevated current density and the distinct shape of CV curves of R-CeO2-O. Firstly, OVs prefer to be generated in the surface layer of CeO2 (110) and (100) planes, but in the subsurface layer of (111) planes, as widely validated by DFT+U (density functional theory corrected for on-site Coulomb interactions) calculations [61,62] and experimental methods [63]. Moreover, OVs in the surface layer, directly exposed to environment species, are much likely to be occupied by adsorbed molecules, thus, deactivated for the redox catalysis. However, OVs located at the adjacent subsurface layer can be protected partially from the access of external substances, thus, available for the role of catalytic active center [42]. Therefore, the superior electrochemical performance of R-CeO2-O enclosed by (111) planes can be ascribed to the preferentially generated and well-preserved OVs-sub. Secondly, the interesting distinction in the shape of CV curves for R-CeO2-O and R-CeO2-C can be interpreted from the distribution of OVs, which has a direct impact on the electronic structure of the lattice around the OVs. As discussed in the Introduction, OVs tend to cluster on reduced CeO2 (111) planes and preferentially align in the <111> direction. Esch et al. found that almost all OVs (92% in the observation range) on CeO2 (111) planes induced by reduction are linear [25]. The high uniformity of the distribution of OVs on (111) will build identical electronic structures around all OVs, which contributes to the sharp redox peaks of the catalytic reaction. However, the distribution of OVs on CeO2 (100) is quite different. Owing to the close formation energy of OVs-sur and OVs-sub and the multiple distribution patterns of OVs, the electronic structure around each oxygen vacancy varies on CeO2 (100), which leads to the dispersive driving force (bias voltage) for the catalytic reaction and presents a CV curve with no characteristic peak.
After adding 1 mM H2O2 (Figure 4d), R-CeO2-O obtained the highest electrochemical response among four electrodes. The current density of the reduction peak for all samples were recorded as a histogram in Figure 4e,f. The proposed sensing reaction mechanism was shown as follows [64]:
Ce4+ + e− → Ce3+
Ce3+ + H2O2 → Ce4+ + 2OH
3.4. Mechanism of Boosted Sensing Performance on R-CeO2-O
Firstly, the CV curves recorded at different scan rates was applied to study the reaction kinetics of R-CeO2-O, as shown in Figure 5a. With the increasing scan rate, the anodic peak of the CV curve gradually moves to the positive direction, while the cathodic peak shifts towards the negative direction. The good linear relation between the current density of the redox peak and the square root of the scan rate (Figure 5b) suggests that the H2O2 catalytic reduction on the surface of R-CeO2-O is a diffusion-controlled process, which means that the current response is closely related to the concentration of H2O2 and is limited by the diffusion of H2O2 in PBS.
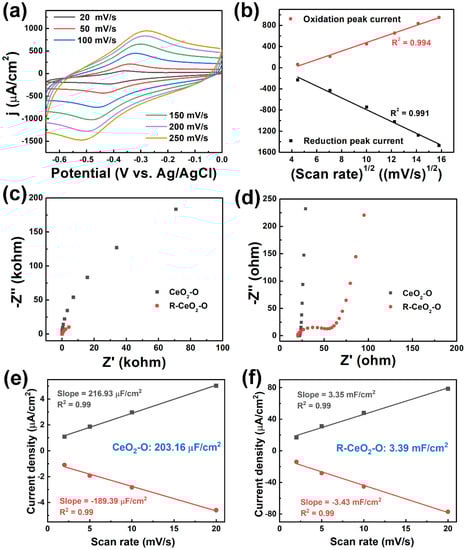
Figure 5.
(a) CV scans of R-CeO2-O in 0.1 M PBS with 1 mM H2O2 at different scan rate and (b) linear plots of peak current density versus square root of scan rate. Nyquist plots of CeO2-O and R-CeO2-O (c) in full range and (d) in high-frequency region. The corresponding linear plot (derived from Figure S6) of the capacitive currents of (e) CeO2-O and (f) R-CeO2-O vs. scan rates for EASA calculation.
Secondly, the electrochemical impedance spectroscopy (EIS) experiments were conducted to investigate the favorable effect of OVs on the electron transport characteristics of the electrodes. The obtained Nyquist plots are given in Figure 5c,d, in which the semicircle part in the high-frequency region represents the electron limited process. In the full range view (Figure 5c), a semicircle with an extremely large diameter was faintly displayed on the plot of CeO2-O, implying its huge charge transfer resistance (Rct), which is attributed to the insulating nature of pristine CeO2. The plot of R-CeO2-O can hardly be distinguished in Figure 5c. Therefore, the high-frequency part of the Nyquist plots were enlarged and a typical semicircle is discernible (Figure 5d), which verifies the dramatically decreasing Rct for R-CeO2-O, suggesting that the high concentration of OVs in R-CeO2-O promote the electron transfer process. Moreover, judging from the intercept of the plots, which represents internal resistance (Rs), R-CeO2-O also possesses relatively lower Rs than CeO2-O. The enhanced electron transport characteristics are ascribed to the delocalized electrons released from OVs by reduction.
Thirdly, the electrochemical active surface area (EASA) of CeO2-O and R-CeO2-O electrode was conducted on CeO2-O and R-CeO2-O electrode in N2-saturated 0.1 M PBS. The CV curves of CeO2-O and R-CeO2-O electrodes at different scanning rates in the non-faradic regions (−0.1 V–0 V) are shown in Figure S6. By taking the anode current density at −0.02 V and the cathode current density at −0.08 V, the slope was obtained after linear fitting (Figure 5e,f). Following the detailed method in the Supplementary Materials, EASA of the corresponding samples are 5.08 cm2 (CeO2-O) and 84.75 cm2 (R-CeO2-O), which verifies the obvious activation effect of OVs on (111) facet.
Given the above, the introduced OVs on the (111) surface of R-CeO2-O are capable of lowering the resistance and enhancing the concentration of active reaction sites, thus, achieving boosted H2O2 electrochemical sensing performance.
3.5. Investigation of Selectivity, Stability, Reproducibility and Practicability
The selectivity, one of the most essential application indicators of a sensor, was evaluated by recording the current response to a group of common physiological-level electroactive substances, such as fructose, galactose, glucose, ascorbic acid (AA), uric acid (UA), dopamine (DA), and sodium chloride, by means of a CA test at the voltage of −0.5 V. As depicted in Figure 6a, after a regular step-wise amperometric response brought by the initial injection of 1 mM H2O2, the successive injection of interfering substances engenders no evident response, while a subsequent injection of 1 mM H2O2 prompts an identical increase to the first injection. Typical metal ions were also involved in the test, as shown in Figure S7. The superior current response towards the H2O2 injection in Figure 6a and Figure S7 proves the high selectivity of R-CeO2-O from two aspects. On the one hand, these disturbing substances cannot produce a comparable signal to H2O2; on the other hand, these disruptors are incapable of affecting the sensitivity of R-CeO2-O. The storage stability of R-CeO2-O electrodes was checked by storing them at room temperature (15–25 °C) in a general atmospheric environment and recording their current response in 0.1 M PBS with 1 mM H2O2 every five days. The histogram, shown as Figure 6b, verifies a retention of 90.4% of its initial amperometric response after 21 days, indicating its high storage stability. The stability in long-term consecutive operation was appraised by recording the CA curve after injecting 1 mM H2O2 to 0.1 M PBS (Figure 6c). The inject of H2O2 at 200 s induced a downward step on the current response, which keeps steady afterward and maintains 95.05% of the initial value after 30 min. Moreover, the octahedral morphology (inset of Figure 6c) is well preserved after the 2000 s CA test, corroborating the satisfactory stability. The investigation of reproducibility was carried out on five electrodes prepared independently following the same procedure. The amperometric response of five electrodes was measured in the presence of 1 mM H2O2, and a satisfied relative standard deviation (RSD) of 2.85% was achieved (Figure 6d). In summary, the above CA tests demonstrate that the R-CeO2-O sensor possesses good selectivity, high stability, and excellent reproducibility.
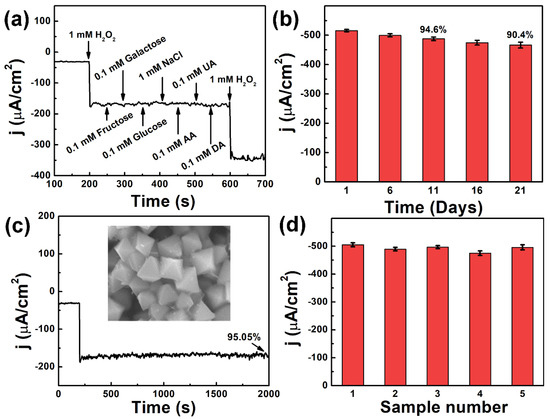
Figure 6.
(a) Amperometric response of R-CeO2-O upon the successive addition of 1 mM H2O2, 0.1 mM fructose, 0.1 mM galactose, 0.1 mM glucose, 1 mM NaCl, 0.1 mM AA, 0.1 mM UA, 0.1 mM DA, and 1 mM H2O2 in 0.1 M PBS at a bias voltage of −0.5 V. (b) The current density response toward 1 mM H2O2 after different durations. (c) Response current density of R-CeO2-O during 2000 s upon addition of 1 mM H2O2. The inset in (c) shows the SEM image of R-CeO2-O after sensing. (d) Current density of five electrodes in response to 1 mM H2O2.
Furthermore, the sensing performance of our R-CeO2-O electrode in real medical disinfectant was investigated to find its feasibility in practical applications. Since H2O2 plays the role of sterilization, which can dominate the performance of disinfectant and guarantee medical safety, the content of H2O2 in medical disinfectant should be strictly monitored. After H2O2 solutions with known concentration was spiked to diluted disinfectant samples, the produced current signal was recorded by CA test (Figure S8), through which the H2O2 concentration was detected and calculated according to a regression equation obtained from the linear relationship in Figure 3d. The results are listed in Table 2, and the calculated recovery ratios of R-CeO2-O in medical disinfectants range from 98.16% to 101.95%, demonstrating its good detection accuracy towards H2O2 in real biological samples and its potential for large-scale applications.
Table 2.
Analytical results for the determination of H2O2 in medical disinfectant samples.
4. Conclusions
In summary, CeO2 nanocrystals with selectively exposed facets were prepared by hydrothermal method and surface-modified with OVs through aluminothermic reduction. The synergistic effect of OVs and facets was investigated by the comparative analysis of the H2O2 non-enzymatic electrochemical sensing performance. Among all samples, R-CeO2-O exhibited the best sensing performance towards H2O2, which should give the credit to two reasons. Firstly, the (111) facet of CeO2 favors the generation of sub-surface OVs, which are more stable in the conventional environment and less prone to being re-occupied by oxygen-containing species. Secondly, linear OVs represent the dominant percentage on the (111) facet and generates highly identical electronic structures on the surface of R-CeO2-O, thus, unifying the proper bias voltage for a catalytic reaction, amplifying the sensing signal, and elevating the sensitivity. Moreover, the working mechanism of OVs on the (111) facet of CeO2 was investigated, and proved that OVs are beneficial in accelerating electronic transmission and producing new active sites, thus, facilitating the catalytic sensing reaction towards H2O2 molecules. Our investigation of the synergistic effect of OVs and facets provides necessary experimental and theoretical foundation for the future design of convenient, low-cost, and high-performance catalysts.
Supplementary Materials
The following supporting information can be downloaded at: https://www.mdpi.com/article/10.3390/bios12080592/s1, Figure S1: SEM and TEM images of R-CeO2-O; Figure S2: Electron paramagnetic resonance (EPR) spectra of CeO2-O and R-CeO2-O; Figure S3: CA curves of R-CeO2-O by continuously adding 1 mM H2O2 into 0.1 M PBS per 50 s at the bias voltage of −0.3 V, −0.4 V, −0.5 V and −0.6 V; Figure S4: SEM images of CeO2 catalysts with different morphologies: (a) CeO2-C (cube), (b) CeO2-R (rod) and (d) CeO2-S (sphere). (d) XRD patterns of CeO2 catalysts with different morphologies; Figure S5: (a) N2 adsorption-desorption isotherms and (b) Raman spectra of CeO2 nanocatalysts; Figure S6: Cyclic voltammetry curves of (a) CeO2-O and (b) R-CeO2-O; Figure S7: Amperometric response of R-CeO2-O upon the successive addition of 1 mM H2O2, Fe(NO3)3, Mn(NO3)2, Ca(NO3)2, Mg(NO3)2, AA, DA, and H2O2 in 0.1 M PBS at a bias voltage of −0.5 V; Figure S8: Amperometric response of R-CeO2-O after continuous addition of H2O2 solution to medical disinfectant with a bias of −0.5 V.
Author Contributions
T.L. and Q.W. contributed equally to this work. Conceptualization, Z.W. and Q.W.; methodology, T.L. and Q.W.; software, Q.W. and T.L.; validation, Q.W. and Z.W.; formal analysis, Q.W.; investigation, T.L., Q.W. and Z.W.; resources, Z.W.; data curation, Q.W. and T.L.; writing—original draft preparation, T.L.; writing—review and editing, Q.W. and Z.W.; visualization, T.L. and Z.W.; supervision, Z.W.; project administration, Z.W.; funding acquisition, Q.W. and Z.W. All authors have read and agreed to the published version of the manuscript.
Funding
This research was funded by the National Natural Science Foundation of China (No. 51702188, No. 51502159), the Young Scholars Program of Shandong University (No. 2018WLJH25), the Fundamental Research Funds of Shandong University (No. 2017TB0024), and the Natural Science Foundation of Shandong Province (No. BS2015CL001).
Institutional Review Board Statement
Not applicable.
Informed Consent Statement
Not applicable.
Data Availability Statement
Not applicable.
Conflicts of Interest
The authors declare no conflict of interest.
References
- Yang, N.; Xiao, W.; Song, X.; Wang, W.; Dong, X. Recent Advances in Tumor Microenvironment Hydrogen Peroxide-Responsive Materials for Cancer Photodynamic Therapy. Nano-Micro Lett. 2020, 12, 15. [Google Scholar] [CrossRef] [PubMed]
- Yabuta, K.; Futamura, H.; Kawasaki, K.; Sugiyama, H. Impact of H2O2 Sorption by Polymers on the Duration of Aeration in Pharmaceutical Decontamination. J. Pharm. Sci. 2020, 109, 2767–2773. [Google Scholar] [CrossRef] [PubMed]
- Collivignarelli, M.C.; Abbà, A.; Miino, M.C.; Arab, H.; Bestetti, M.; Franz, S. Decolorization and biodegradability of a real pharmaceutical wastewater treated by H2O2-assisted photoelectrocatalysis on TiO2 meshes. J. Hazard. Mater. 2019, 387, 121668. [Google Scholar] [CrossRef] [PubMed]
- Zlatev, R.; Ramos, R.; Stoytcheva, M.; Valdez, B.; Curiel, M. LabView based virtual calorimetric etching solution analyzer (CESA) for the online quantification of hydrogen peroxide for the semiconductor industry. Instrum. Sci. Technol. 2021, 50, 397–413. [Google Scholar] [CrossRef]
- Rajput, V.D.; Singh, R.K.; Verma, K.K.; Sharma, L.; Quiroz-Figueroa, F.R.; Meena, M.; Gour, V.S.; Minkina, T.; Sushkova, S.; Mandzhieva, S. Recent Developments in Enzymatic Antioxidant Defence Mechanism in Plants with Special Reference to Abiotic Stress. Biology 2021, 10, 267. [Google Scholar] [CrossRef] [PubMed]
- Zhang, Y.; Wang, Q.; Liu, D.; Wang, Q.; Li, T.; Wang, Z. Cu2O-BiOI isotype (p-p) heterojunction: Boosted visible-light-driven photoelectrochemical activity for non-enzymatic H2O2 sensing. Appl. Surf. Sci. 2020, 521, 146434. [Google Scholar] [CrossRef]
- Wang, Q.; Wang, Q.; Li, M.; Szunerits, S.; Boukherroub, R. One-step synthesis of Au nanoparticle–graphene composites using tyrosine: Electrocatalytic and catalytic properties. New J. Chem. 2016, 40, 5473–5482. [Google Scholar] [CrossRef]
- Yang, H.; Zhou, C.; An, J.; Yang, L.; Yang, Y.; Liu, X. Ultra-fast synthesis of iron decorated multiwalled carbon nanotube composite materials: A sensitive electrochemical sensor for determining dopamine. J. Alloy. Compd. 2021, 897, 163257. [Google Scholar] [CrossRef]
- Imran, H.; Vaishali, K.; Francy, S.A.; Manikandan, P.N.; Dharuman, V. Platinum and zinc oxide modified carbon nitride electrode as non-enzymatic highly selective and reusable electrochemical diabetic sensor in human blood. Bioelectrochemistry 2020, 137, 107645. [Google Scholar] [CrossRef] [PubMed]
- Jin, X.; Duan, Y.; Liu, D.; Feng, X.; Li, W.; Zhang, Z.; Zhang, Y. CO Oxidation Catalyzed by Two-Dimensional Co3O4/CeO2 Nanosheets. ACS Appl. Nano Mater. 2019, 2, 5769–5778. [Google Scholar] [CrossRef]
- Wen, X.-J.; Niu, C.-G.; Zhang, L.; Liang, C.; Zeng, G.-M. A novel Ag2O/CeO2 heterojunction photocatalysts for photocatalytic degradation of enrofloxacin: Possible degradation pathways, mineralization activity and an in depth mechanism insight. Appl. Catal. B Environ. 2017, 221, 701–714. [Google Scholar] [CrossRef]
- Sun, H.; Tian, C.; Fan, G.; Qi, J.; Liu, Z.; Yan, Z.; Cheng, F.; Chen, J.; Li, C.; Du, M. Boosting Activity on Co4N Porous Nanosheet by Coupling CeO2 for Efficient Electrochemical Overall Water Splitting at High Current Densities. Adv. Funct. Mater. 2020, 30, 1910596. [Google Scholar] [CrossRef]
- Yuan, K.; Wang, C.-Y.; Zhu, L.-Y.; Cao, Q.; Yang, J.-H.; Li, X.-X.; Huang, W.; Wang, Y.-Y.; Lu, H.-L.; Zhang, D.W. Fabrication of a Micro-Electromechanical System-Based Acetone Gas Sensor Using CeO2 Nanodot-Decorated WO3 Nanowires. ACS Appl. Mater. Interfaces 2020, 12, 14095–14104. [Google Scholar] [CrossRef] [PubMed]
- Gao, Y.; Wu, Q.; Liang, X.; Wang, Z.; Zheng, Z.; Wang, P.; Liu, Y.; Dai, Y.; Whangbo, M.; Huang, B. Cu2O Nanoparticles with Both {100} and {111} Facets for Enhancing the Selectivity and Activity of CO2 Electroreduction to Ethylene. Adv. Sci. 2020, 7, 1902820. [Google Scholar] [CrossRef] [PubMed]
- Ni, C.; Li, Y.; Meng, X.; Liu, S.; Luo, S.; Guan, J.; Jiang, B. Synergistic role of electron-trapped oxygen vacancy and exposed TiO2 [0 0 1] facets toward electrochemical p-nitrophenol reduction: Characterization, performance and mechanism. Chem. Eng. J. 2021, 411, 128485. [Google Scholar] [CrossRef]
- Chen, S.; Huang, D.; Zeng, G.; Xue, W.; Lei, L.; Xu, P.; Deng, R.; Li, J.; Cheng, M. In-situ synthesis of facet-dependent BiVO4/Ag3PO4/PANI photocatalyst with enhanced visible-light-induced photocatalytic degradation performance: Synergism of interfacial coupling and hole-transfer. Chem. Eng. J. 2019, 382, 122840. [Google Scholar] [CrossRef]
- Zhu, K.; Shi, F.; Zhu, X.; Yang, W. The roles of oxygen vacancies in electrocatalytic oxygen evolution reaction. Nano Energy 2020, 73, 104761. [Google Scholar] [CrossRef]
- Gunkel, F.; Christensen, D.V.; Chen, Y.Z.; Pryds, N. Oxygen vacancies: The (in)visible friend of oxide electronics. Appl. Phys. Lett. 2020, 116, 120505. [Google Scholar] [CrossRef]
- Al-Hashem, M.; Akbar, S.; Morris, P. Role of Oxygen Vacancies in Nanostructured Metal-Oxide Gas Sensors: A Review. Sens. Actuators B Chem. 2019, 301, 126845. [Google Scholar] [CrossRef]
- Spezzati, G.; Benavidez, A.D.; DeLaRiva, A.T.; Su, Y.; Hofmann, J.P.; Asahina, S.; Olivier, E.J.; Neethling, J.H.; Miller, J.T.; Datye, A.K.; et al. CO oxidation by Pd supported on CeO2(100) and CeO2(111) facets. Appl. Catal. B Environ. 2018, 243, 36–46. [Google Scholar] [CrossRef]
- Wang, M.; Shen, M.; Jin, X.; Tian, J.; Li, M.; Zhou, Y.; Zhang, L.; Li, Y.; Shi, J. Oxygen Vacancy Generation and Stabilization in CeO2–x by Cu Introduction with Improved CO2 Photocatalytic Reduction Activity. ACS Catal. 2019, 9, 4573–4581. [Google Scholar] [CrossRef]
- Zheng, X.; Li, Y.; Zhang, L.; Shen, L.; Xiao, Y.; Zhang, Y.; Au, C.; Jiang, L. Insight into the effect of morphology on catalytic performance of porous CeO2 nanocrystals for H2S selective oxidation. Appl. Catal. B Environ. 2019, 252, 98–110. [Google Scholar] [CrossRef]
- Wang, Z.; Huang, Z.; Brosnahan, J.T.; Zhang, S.; Guo, Y.; Guo, Y.; Wang, L.; Wang, Y.; Zhan, W. Ru/CeO2 Catalyst with Optimized CeO2 Support Morphology and Surface Facets for Propane Combustion. Environ. Sci. Technol. 2019, 53, 5349–5358. [Google Scholar] [CrossRef]
- Su, Z.; Yang, W.; Wang, C.; Xiong, S.; Cao, X.; Peng, Y.; Si, W.; Weng, Y.; Xue, M.; Li, J. Roles of Oxygen Vacancies in the Bulk and Surface of CeO2 for Toluene Catalytic Combustion. Environ. Sci. Technol. 2020, 54, 12684–12692. [Google Scholar] [CrossRef]
- Esch, F.; Fabris, S.; Zhou, L.; Montini, T.; Africh, C.; Fornasiero, P.; Comelli, G.; Rosei, R. Electron Localization Determines Defect Formation on Ceria Substrates. Science 2005, 309, 752–755. [Google Scholar] [CrossRef] [PubMed]
- Liu, X.; Zhou, K.; Wang, L.; Wang, B.; Li, Y. Oxygen Vacancy Clusters Promoting Reducibility and Activity of Ceria Nanorods. J. Am. Chem. Soc. 2009, 131, 3140–3141. [Google Scholar] [CrossRef] [PubMed]
- Han, X.; Amrane, N.; Zhang, Z.; Benkraouda, M. Unraveling the Negative Role of Oxygen-Vacancy Cluster in Ionic Conductivity in CeO2: Hybrid Functional Study. J. Phys. Chem. C 2018, 122, 5871–5880. [Google Scholar] [CrossRef]
- Namai, Y.; Fukui, K.-I.; Iwasawa, Y. Atom-Resolved Noncontact Atomic Force Microscopic Observations of CeO2 (111) Surfaces with Different Oxidation States: Surface Structure and Behavior of Surface Oxygen Atoms. J. Phys. Chem. B 2003, 107, 11666–11673. [Google Scholar] [CrossRef]
- Torbrügge, S.; Reichling, M.; Ishiyama, A.; Morita, S.; Custance, O. Evidence of Subsurface Oxygen Vacancy Ordering on Reduced CeO2 (111). Phys. Rev. Lett. 2007, 99, 056101. [Google Scholar] [CrossRef] [PubMed]
- Wang, Z.; Yang, C.; Lin, T.; Yin, H.; Chen, P.; Wan, D.; Xu, F.; Huang, F.; Lin, J.; Xie, X.; et al. Visible-light photocatalytic, solar thermal and photoelectrochemical properties of aluminium-reduced black titania. Energy Environ. Sci. 2013, 6, 3007–3014. [Google Scholar] [CrossRef]
- Ribicki, A.C.; Chemin, B.G.; Van Haandel, V.J.; Winiarski, J.P.; Rozada, T.D.C.; Pessoa, C.A.; Estrada, R.A.; Fiorin, B.C.; Fujiwara, S.T. Sol gel synthesis of 3-n-propyl(4-aminomethyl)pyridinium silsesquioxane chloride and the enhanced electrocatalytic activity of LbL films. J. Sol-Gel Sci. Technol. 2018, 87, 216–229. [Google Scholar] [CrossRef]
- Calaça, G.N.; Erdmann, C.A.; Soares, A.L.; Pessôa, C.A.; Fujiwara, S.T.; Garcia, J.R.; Vidotti, M.; Wohnrath, K. Layer-by-Layer AuNPs-SiPy+/Prussian blue nanoparticles modified electrodes: Characterization and electrocatalytic effects. Electrochim. Acta 2017, 249, 104–112. [Google Scholar] [CrossRef]
- de Jesus, C.G.; Lima, D.; dos Santos, V.; Wohnrath, K.; Pessôa, C.A. Glucose biosensor based on the highly efficient immobilization of glucose oxidase on layer-by-layer films of silsesquioxane polyelectrolyte. Sens. Actuators B Chem. 2013, 186, 44–51. [Google Scholar] [CrossRef]
- Wang, Z.; Yang, C.; Lin, T.; Yin, H.; Chen, P.; Wan, D.; Xu, F.; Huang, F.; Lin, J.; Xie, X.; et al. H-Doped Black Titania with Very High Solar Absorption and Excellent Photocatalysis Enhanced by Localized Surface Plasmon Resonance. Adv. Funct. Mater. 2013, 23, 5444–5450. [Google Scholar] [CrossRef]
- Shyu, J.Z.; Weber, W.H.; Gandhi, H.S. Surface characterization of alumina-supported ceria. J. Phys. Chem. 1988, 92, 4964–4970. [Google Scholar] [CrossRef]
- Tan, H.; Wang, J.; Yu, S.; Zhou, K. Support Morphology-Dependent Catalytic Activity of Pd/CeO2 for Formaldehyde Oxidation. Environ. Sci. Technol. 2015, 49, 8675–8682. [Google Scholar] [CrossRef]
- Kosacki, I.; Suzuki, T.; Anderson, H.U.; Colomban, P. Raman scattering and lattice defects in nanocrystalline CeO2 thin films. Solid State Ion. 2002, 149, 99–105. [Google Scholar] [CrossRef]
- Uzunoglu, A.; Ipekci, H.H. The use of CeO2-modified Pt/C catalyst inks for the construction of high-performance enzyme-free H2O2 sensors. J. Electroanal. Chem. 2019, 848, 113302. [Google Scholar] [CrossRef]
- Spanier, J.E.; Robinson, R.D.; Zhang, F.; Chan, S.-W.; Herman, I.P. Size-dependent properties of CeO2−ynanoparticles as studied by Raman scattering. Phys. Rev. B 2001, 64, 245407. [Google Scholar] [CrossRef]
- Taniguchi, T.; Watanabe, T.; Sugiyama, N.; Subramani, A.K.; Wagata, H.; Matsushita, N.; Yoshimura, M. Identifying Defects in Ceria-Based Nanocrystals by UV Resonance Raman Spectroscopy. J. Phys. Chem. C 2009, 113, 19789–19793. [Google Scholar] [CrossRef]
- Lu, J.; Wang, J.; Zou, Q.; He, D.; Zhang, L.; Xu, Z.; He, S.; Luo, Y. Unravelling the Nature of the Active Species as well as the Doping Effect over Cu/Ce-Based Catalyst for Carbon Monoxide Preferential Oxidation. ACS Catal. 2019, 9, 2177–2195. [Google Scholar] [CrossRef]
- Mehmood, R.; Mofarah, S.S.; Chen, W.-F.; Koshy, P.; Sorrell, C.C. Surface, Subsurface, and Bulk Oxygen Vacancies Quantified by Decoupling and Deconvolution of the Defect Structure of Redox-Active Nanoceria. Inorg. Chem. 2019, 58, 6016–6027. [Google Scholar] [CrossRef] [PubMed]
- Wang, L.; Yu, Y.; He, H.; Zhang, Y.; Qin, X.-B.; Wang, B. Oxygen vacancy clusters essential for the catalytic activity of CeO2 nanocubes for o-xylene oxidation. Sci. Rep. 2017, 7, 12845. [Google Scholar] [CrossRef]
- Zhidkov, I.S.; Maksimov, R.N.; Kukharenko, A.I.; Finkelstein, L.D.; Cholakh, S.O.; Osipov, V.V.; Kurmaev, E.Z. Effect of post-annealing in air on optical and XPS spectra of Y2O3 ceramics doped with CeO2. Mendeleev Commun. 2019, 29, 102–104. [Google Scholar] [CrossRef]
- Qiu, B.; Wang, C.; Zhang, N.; Cai, L.; Xiong, Y.; Chai, Y. CeO2-Induced Interfacial Co2+ Octahedral Sites and Oxygen Vacancies for Water Oxidation. ACS Catal. 2019, 9, 6484–6490. [Google Scholar] [CrossRef]
- He, W.; Ran, J.; Niu, J.; Yang, G.; Ou, Z.; He, Z. Insight into the effect of facet-dependent surface and oxygen vacancies of CeO2 for Hg removal: From theoretical and experimental studies. J. Hazard. Mater. 2020, 397, 122646. [Google Scholar] [CrossRef]
- Uzunoglu, A. The Use of CeO2-TiO2 Nanocomposites as Enzyme Immobilization Platforms in Electrochemical Sensors. J. Turk. Chem. Soc. Sect. A Chem. 2017, 4, 855–868. [Google Scholar] [CrossRef][Green Version]
- Jha, S.K.; Kumar, C.N.; Raj, R.P.; Jha, N.S.; Mohan, S. Synthesis of 3D porous CeO2/reduced graphene oxide xerogel composite and low level detection of H2O2. Electrochim. Acta 2014, 120, 308–313. [Google Scholar] [CrossRef]
- Zhao, S.; Riedel, M.; Patarroyo, J.; Bastús, N.G.; Puntes, V.; Yue, Z.; Lisdat, F.; Parak, W.J. Introducing visible-light sensitivity into photocatalytic CeO2 nanoparticles by hybrid particle preparation exploiting plasmonic properties of gold: Enhanced photoelectrocatalysis exemplified for hydrogen peroxide sensing. Nanoscale 2020, 13, 980–990. [Google Scholar] [CrossRef] [PubMed]
- Ujjain, S.K.; Das, A.; Srivastava, G.; Ahuja, P.; Roy, M.; Arya, A.; Bhargava, K.; Sethy, N.; Singh, S.K.; Sharma, R.K.; et al. Nanoceria based electrochemical sensor for hydrogen peroxide detection. Biointerphases 2014, 9, 031011. [Google Scholar] [CrossRef] [PubMed]
- Ampelli, C.; Leonardi, S.G.; Bonavita, A.; Genovese, C.; Papanikolaou, G.; Perathoner, S.; Centi, G.; Neri, G. Electrochemical H2O2 sensors based on Au/CeO2 nanoparticles for industrial applications. Chem. Eng. Trans. 2015, 43, 733–738. [Google Scholar] [CrossRef]
- Yang, X.; Ouyang, Y.; Wu, F.; Hu, Y.; Ji, Y.; Wu, Z. Size controllable preparation of gold nanoparticles loading on graphene sheets@cerium oxide nanocomposites modified gold electrode for nonenzymatic hydrogen peroxide detection. Sens. Actuators B Chem. 2017, 238, 40–47. [Google Scholar] [CrossRef]
- Yang, S.; Li, G.; Wang, G.; Liu, L.; Wang, D.; Qu, L. Synthesis of highly dispersed CeO2 nanoparticles on N-doped reduced oxide graphene and their electrocatalytic activity toward H2O2. J. Alloy. Compd. 2016, 688, 910–916. [Google Scholar] [CrossRef]
- Chen, J.; Zhao, W.; Wu, Q.; Mi, J.; Wang, X.; Ma, L.; Jiang, L.; Au, C.; Li, J. Effects of anaerobic SO2 treatment on nano-CeO2 of different morphologies for selective catalytic reduction of NOx with NH3. Chem. Eng. J. 2019, 382, 122910. [Google Scholar] [CrossRef]
- Jiang, F.; Wang, S.; Liu, B.; Liu, J.; Wang, L.; Xiao, Y.; Xu, Y.; Liu, X. Insights into the Influence of CeO2 Crystal Facet on CO2 Hydrogenation to Methanol over Pd/CeO2 Catalysts. ACS Catal. 2020, 10, 11493–11509. [Google Scholar] [CrossRef]
- Tong, T.; Liu, X.; Guo, Y.; Banis, M.N.; Hu, Y.; Wang, Y. The critical role of CeO2 crystal-plane in controlling Pt chemical states on the hydrogenolysis of furfuryl alcohol to 1,2-pentanediol. J. Catal. 2018, 365, 420–428. [Google Scholar] [CrossRef]
- Trabelsi, H.; Bejar, M.; Dhahri, E.; Sajieddine, M.; Khirouni, K.; Prezas, P.; Melo, B.; Valente, M.; Graca, M.P. Effect of oxygen vacancies on SrTiO electrical properties. J. Alloy. Compd. 2017, 723, 894–903. [Google Scholar] [CrossRef]
- Paier, J.; Penschke, C.; Sauer, J. Oxygen Defects and Surface Chemistry of Ceria: Quantum Chemical Studies Compared to Experiment. Chem. Rev. 2013, 113, 3949–3985. [Google Scholar] [CrossRef] [PubMed]
- Trovarelli, A.; Llorca, J. Ceria Catalysts at Nanoscale: How Do Crystal Shapes Shape Catalysis? ACS Catal. 2017, 7, 4716–4735. [Google Scholar] [CrossRef]
- Nolan, M.; Parker, S.C.; Watson, G.W. The electronic structure of oxygen vacancy defects at the low index surfaces of ceria. Surf. Sci. 2005, 595, 223–232. [Google Scholar] [CrossRef]
- Wu, T.; Vegge, T.; Hansen, H.A. Improved Electrocatalytic Water Splitting Reaction on CeO2 (111) by Strain Engineering: A DFT+U Study. ACS Catal. 2019, 9, 4853–4861. [Google Scholar] [CrossRef]
- Wu, T.; López, N.; Vegge, T.; Hansen, H.A. Facet-dependent electrocatalytic water splitting reaction on CeO2: A DFT + U study. J. Catal. 2020, 388, 1–10. [Google Scholar] [CrossRef]
- Gao, Y.; Li, R.; Chen, S.; Luo, L.; Cao, T.; Huang, W. Morphology-dependent interplay of reduction behaviors, oxygen vacancies and hydroxyl reactivity of CeO2 nanocrystals. Phys. Chem. Chem. Phys. 2015, 17, 31862–31871. [Google Scholar] [CrossRef] [PubMed]
- Ensafi, A.A.; Mahmoodi, A.; Rezaei, B. Pd@CeO2-SnO2 nanocomposite, a highly selective and sensitive hydrogen peroxide electrochemical sensor. Sens. Actuators B Chem. 2019, 296, 126683. [Google Scholar] [CrossRef]


Publisher’s Note: MDPI stays neutral with regard to jurisdictional claims in published maps and institutional affiliations. |
© 2022 by the authors. Licensee MDPI, Basel, Switzerland. This article is an open access article distributed under the terms and conditions of the Creative Commons Attribution (CC BY) license (https://creativecommons.org/licenses/by/4.0/).