Optofluidic Particle Manipulation: Optical Trapping in a Thin-Membrane Microchannel

 , , ,
, , , 

Abstract
:1. Introduction
2. Experimental and Methods
3. Results
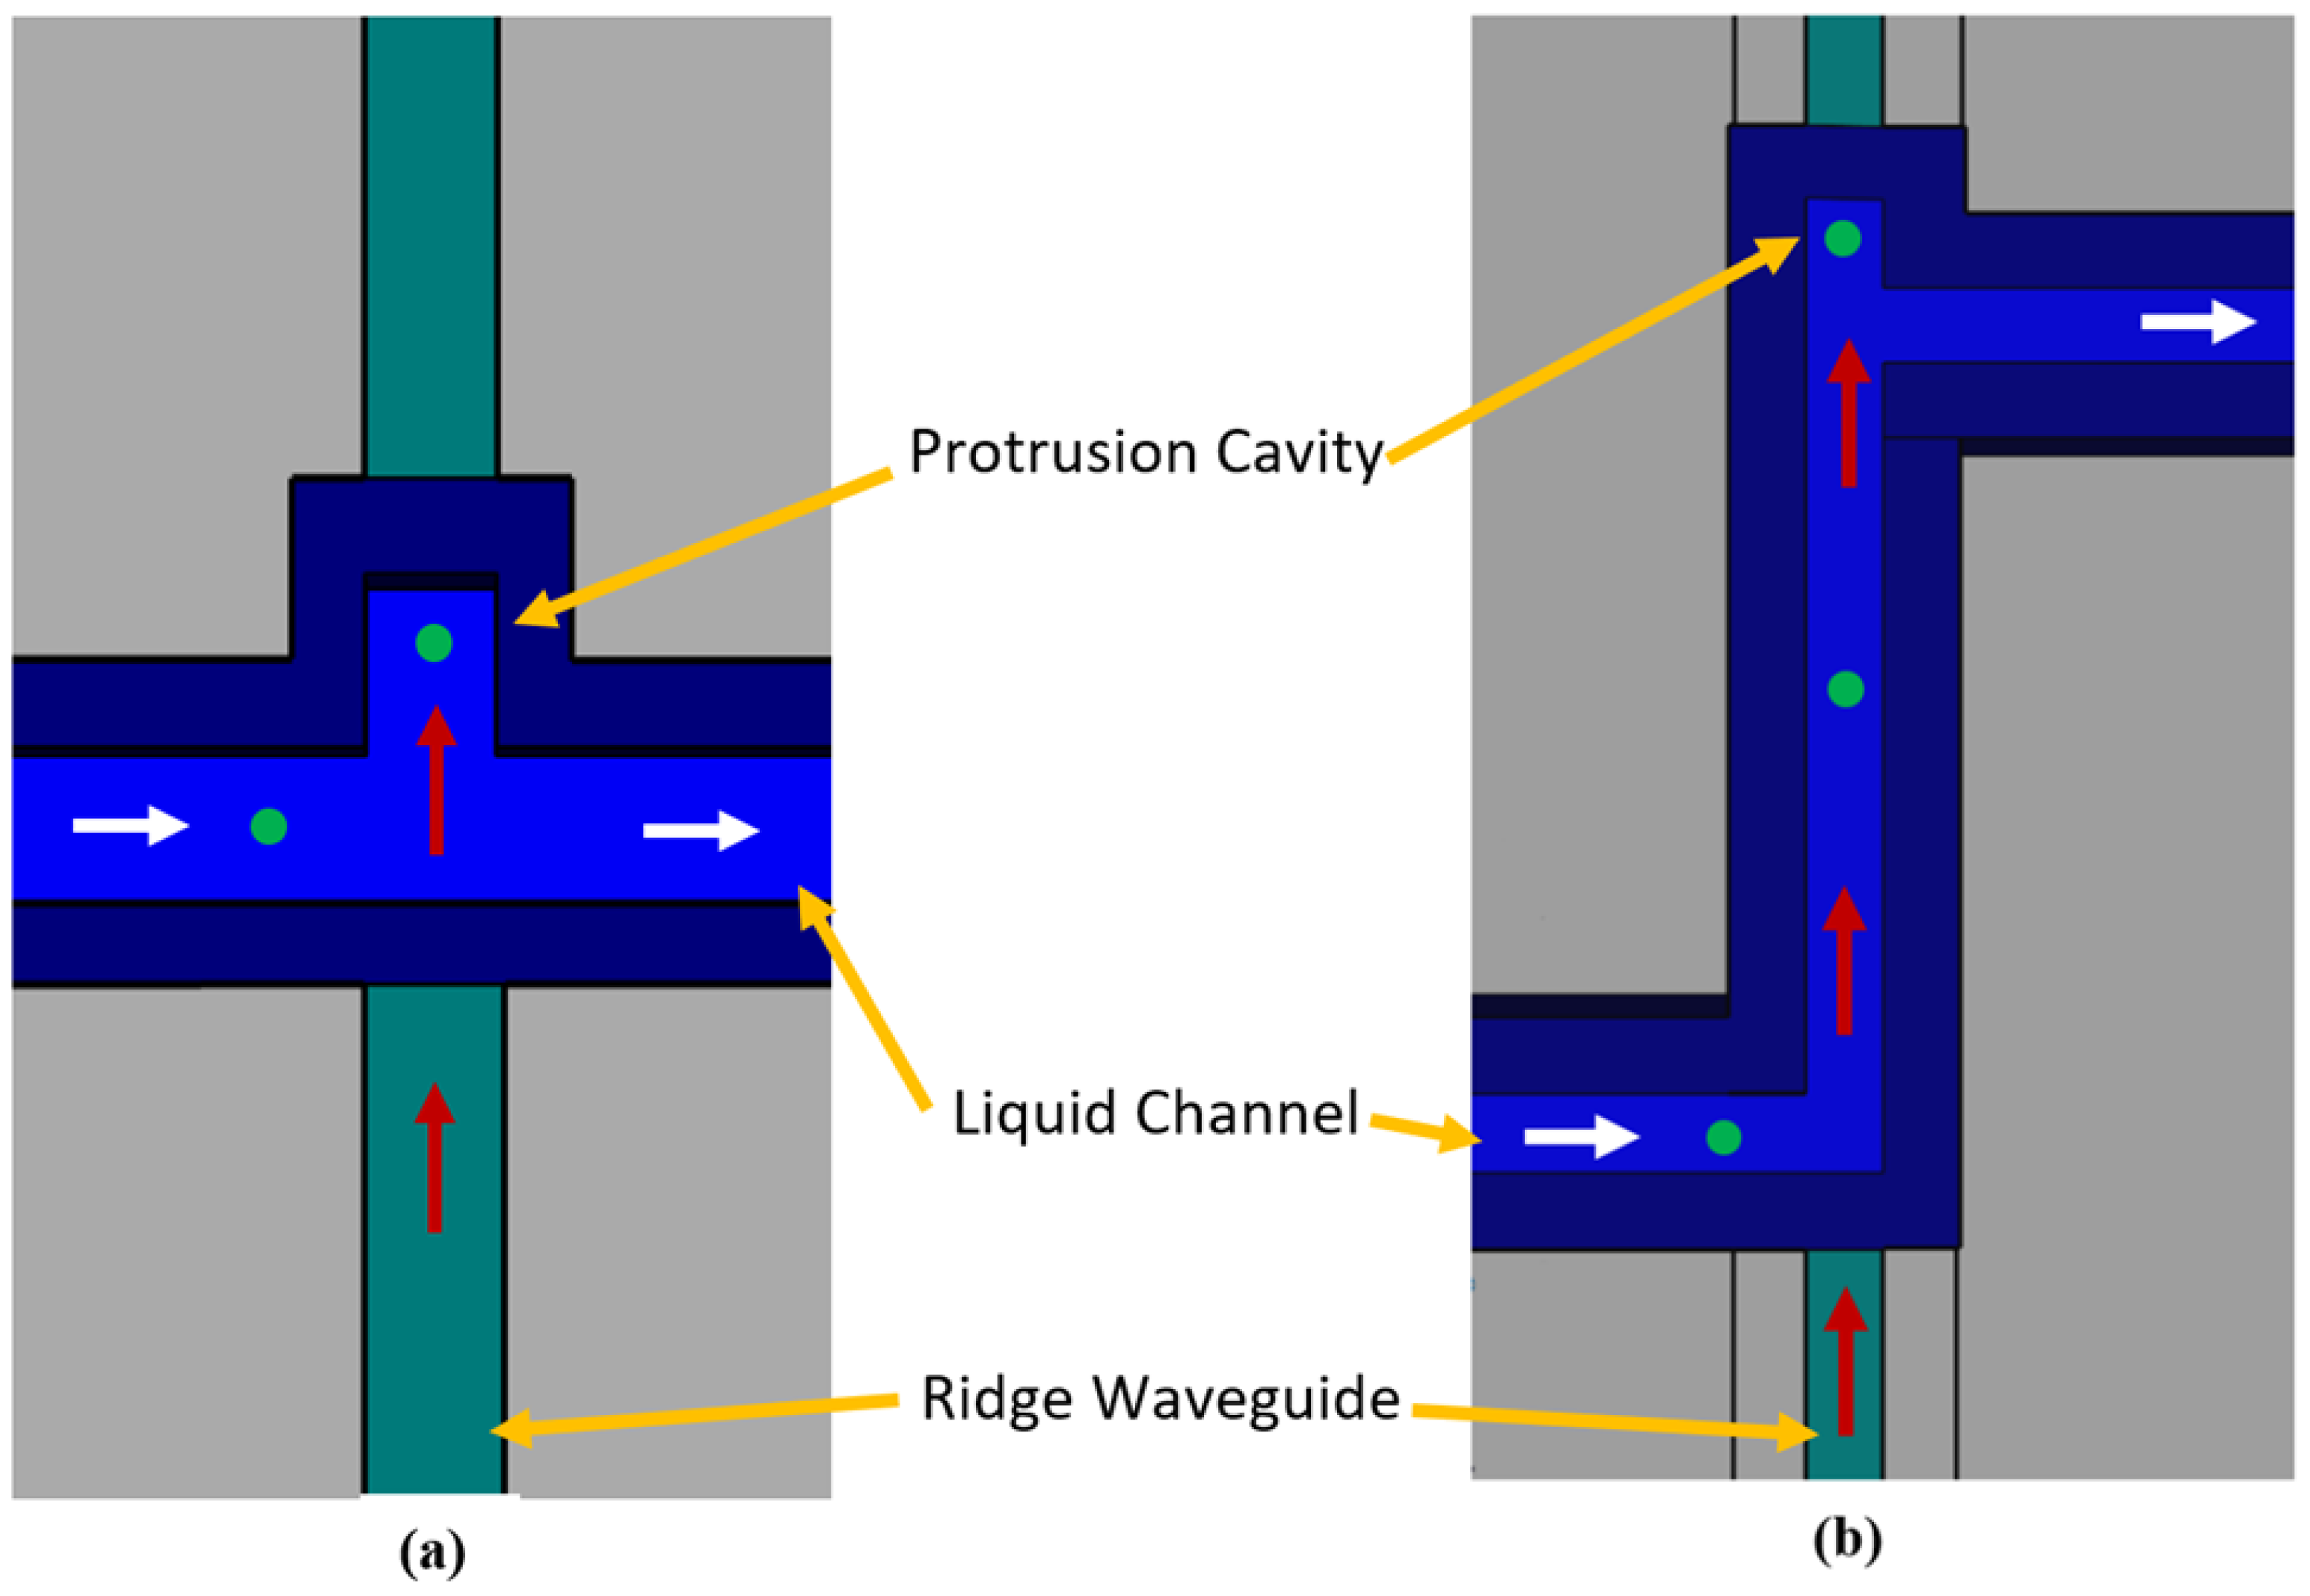
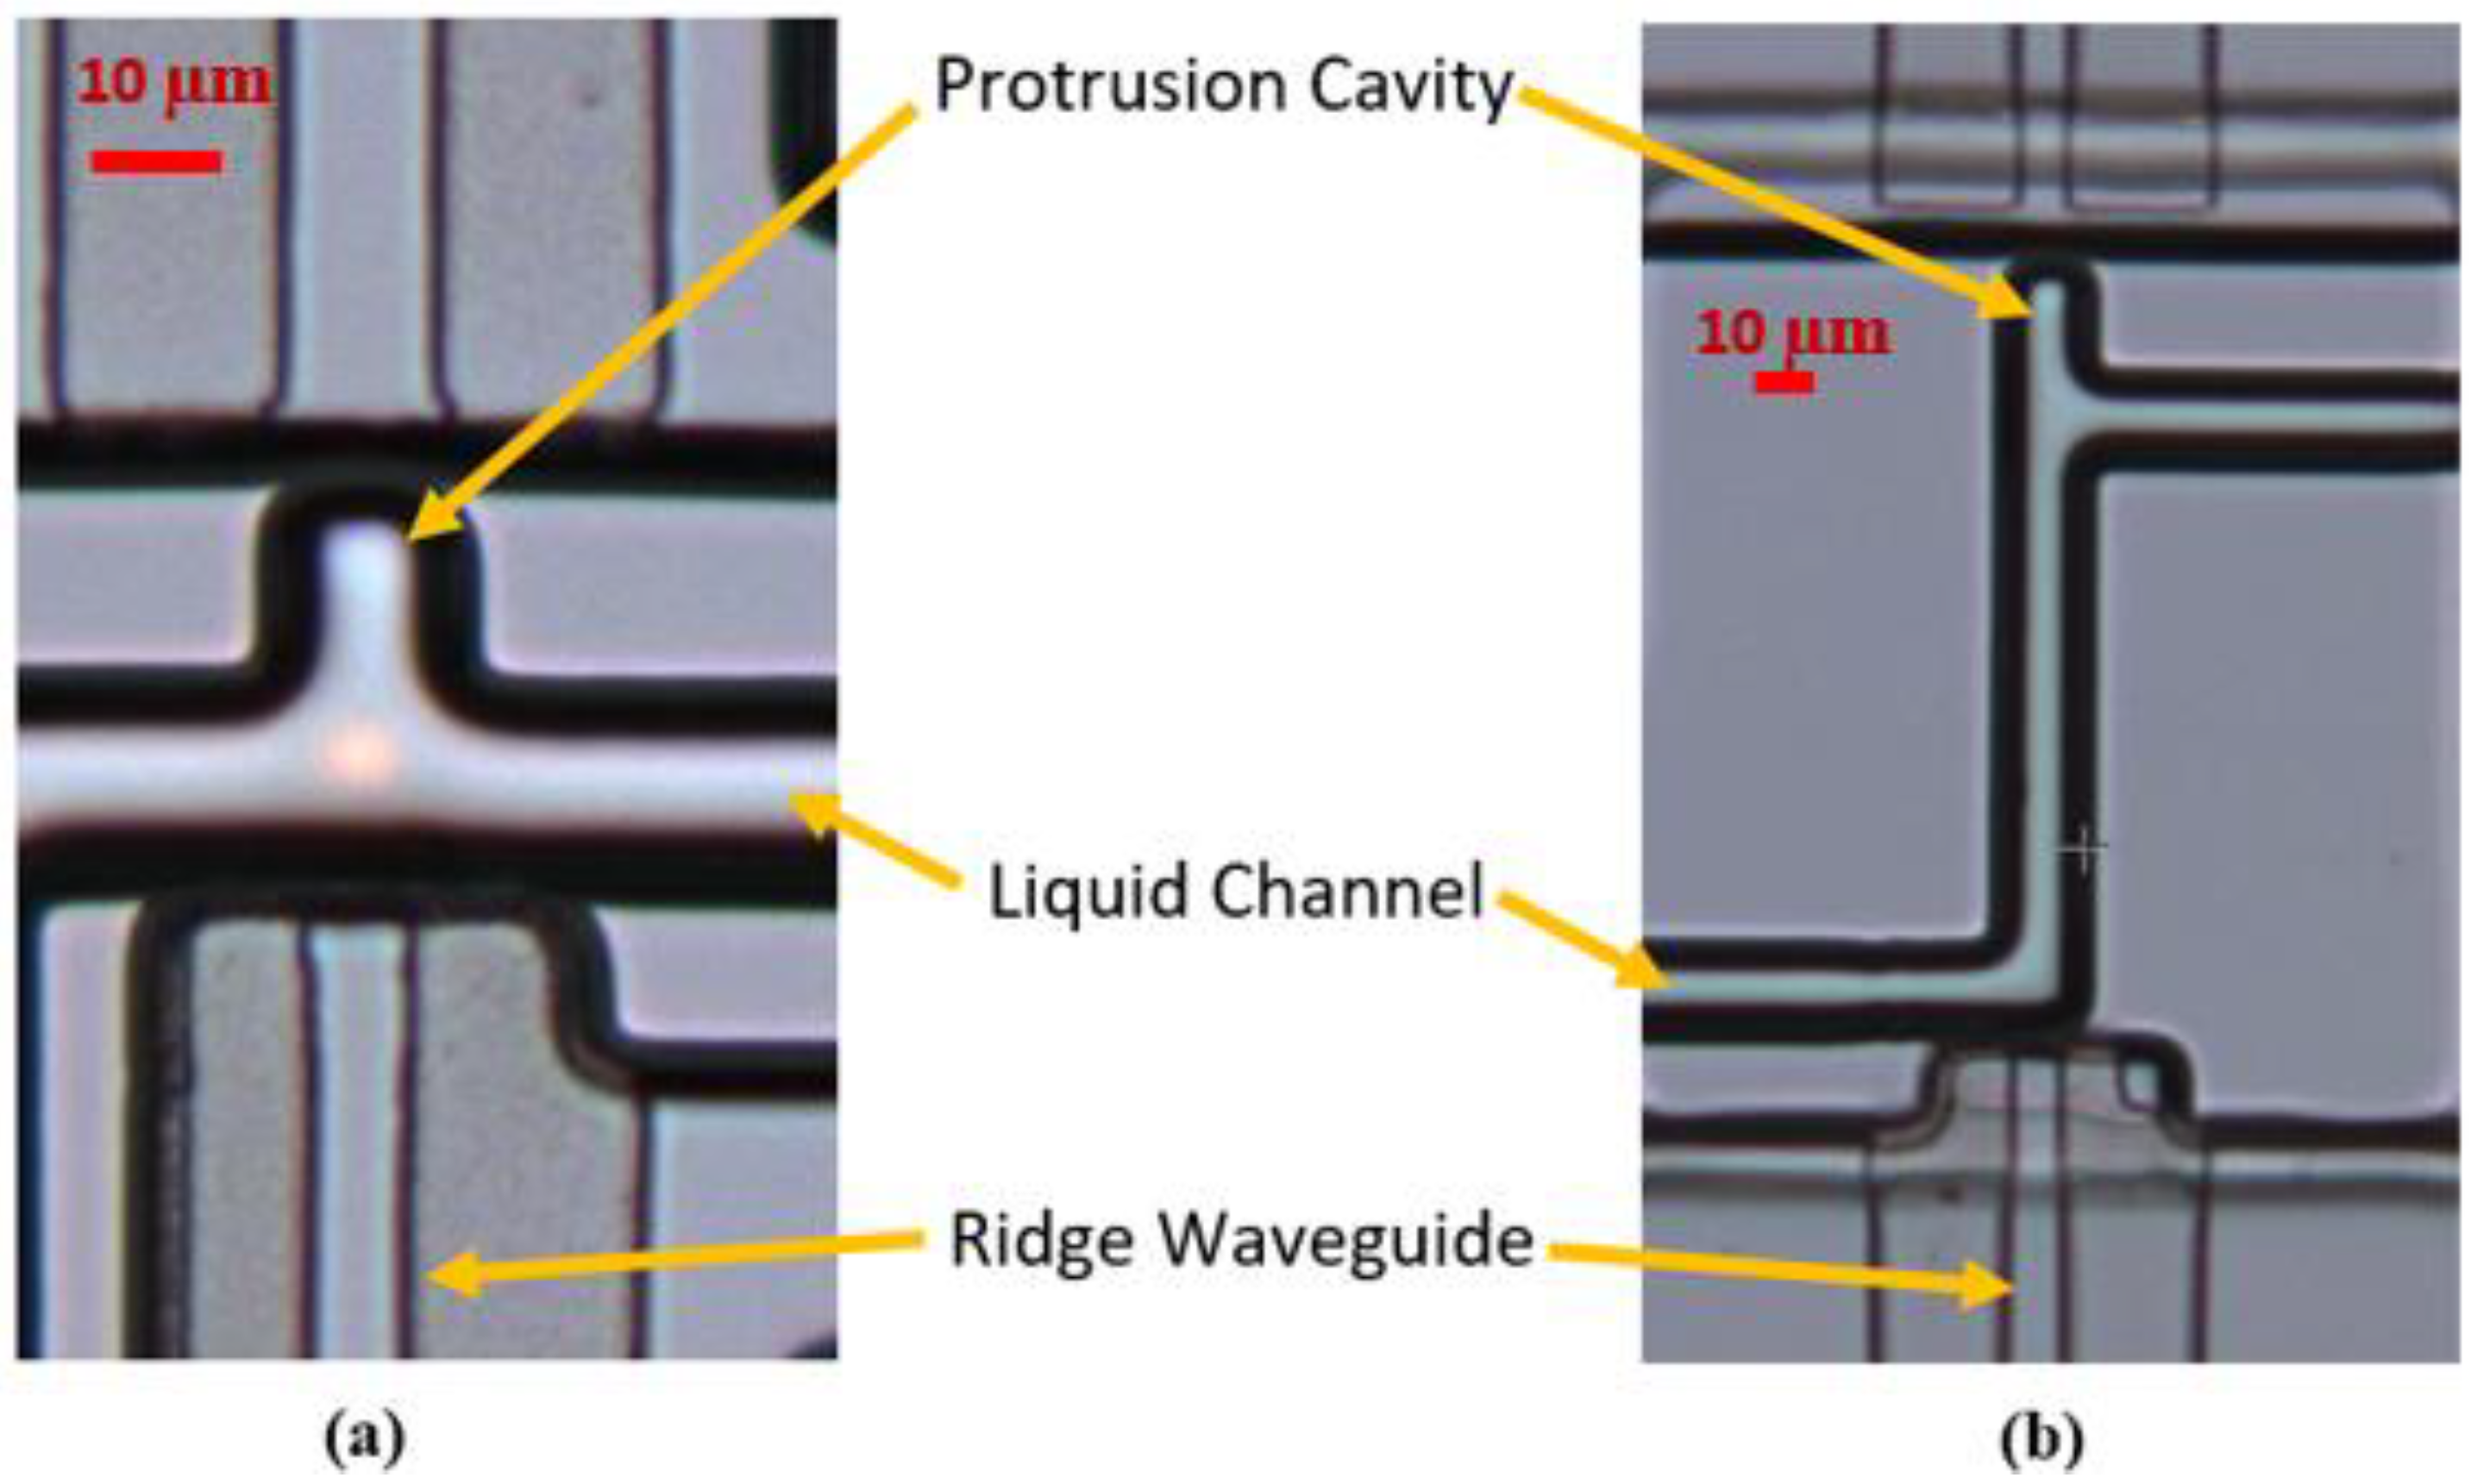
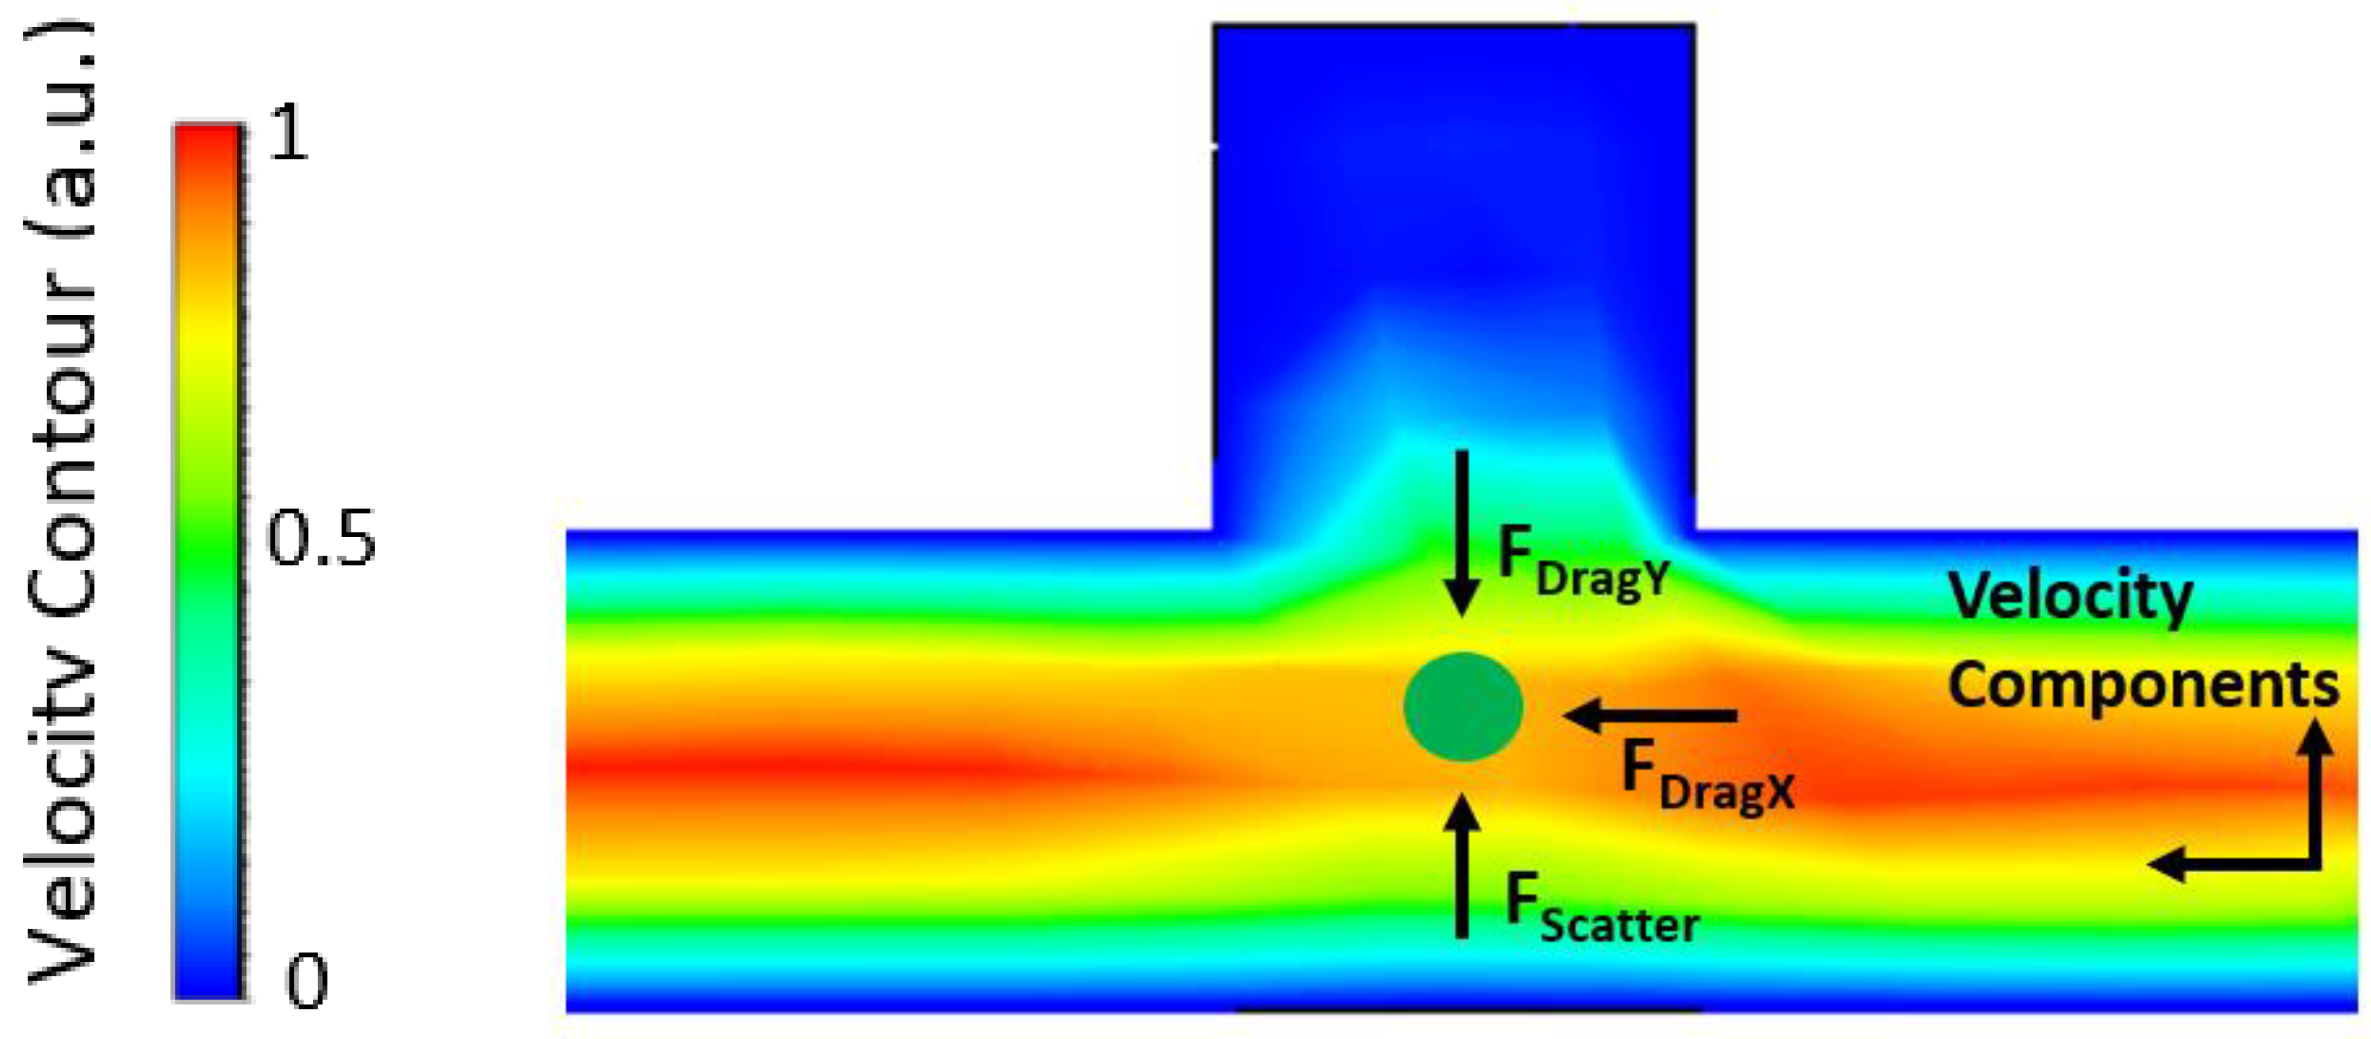
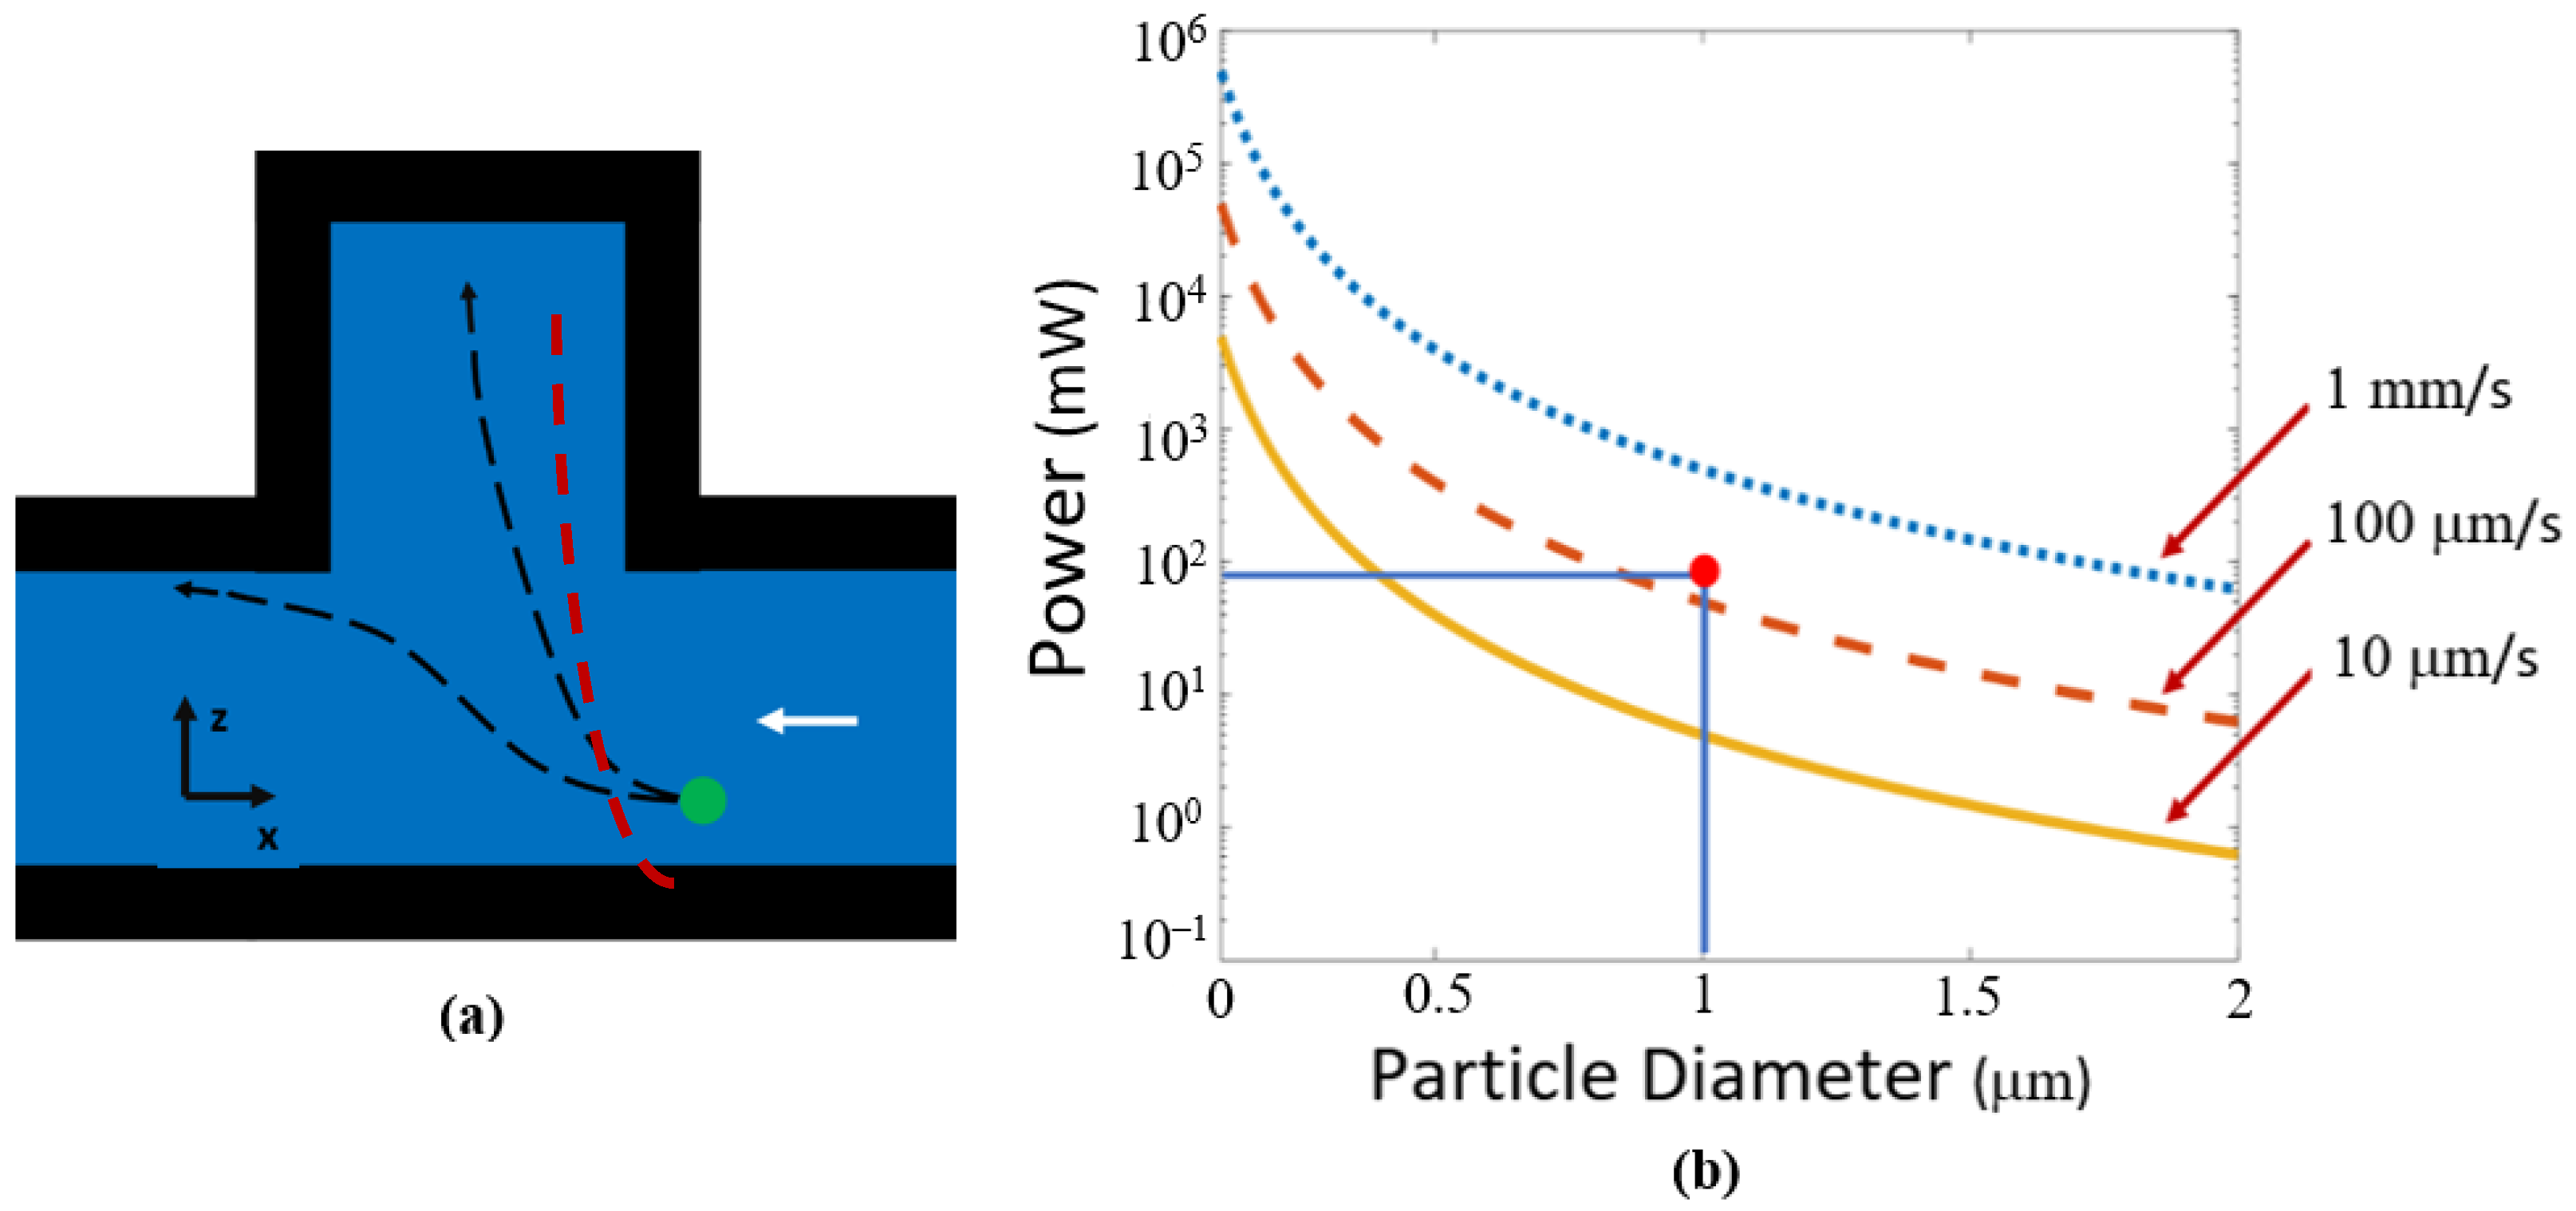
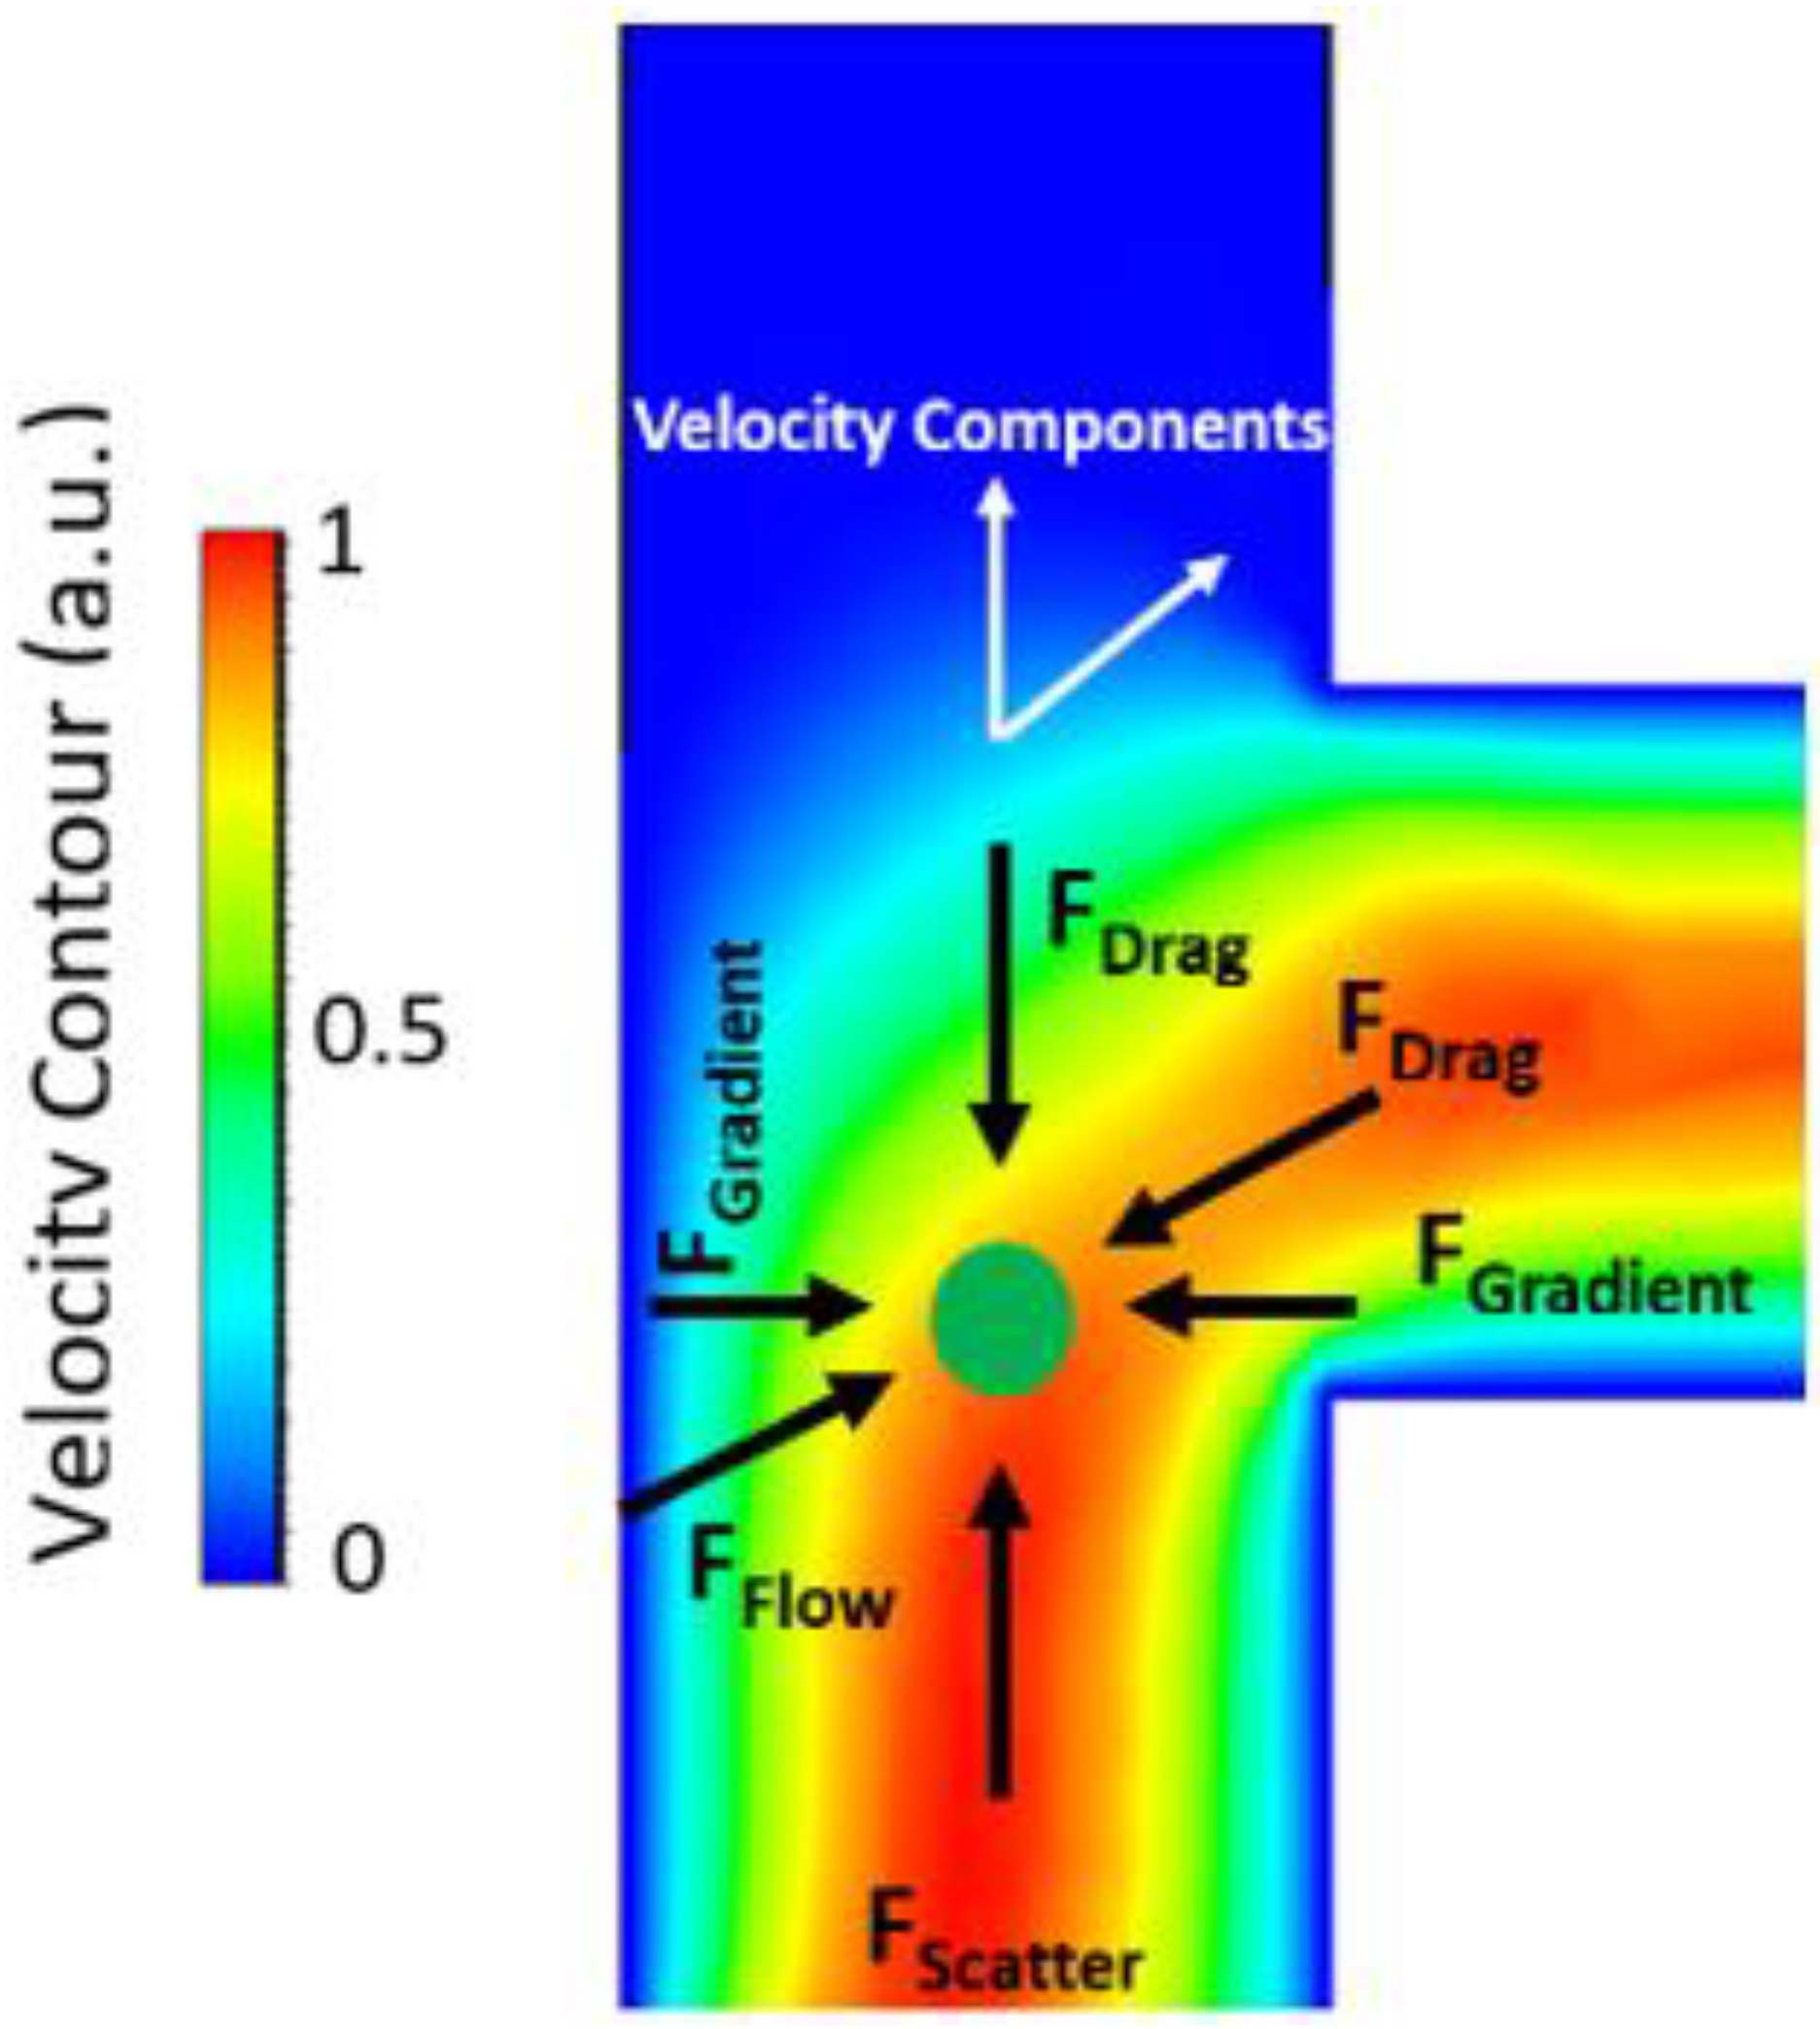
3.1. Particle Manipulation in the Orthogonal Force Design
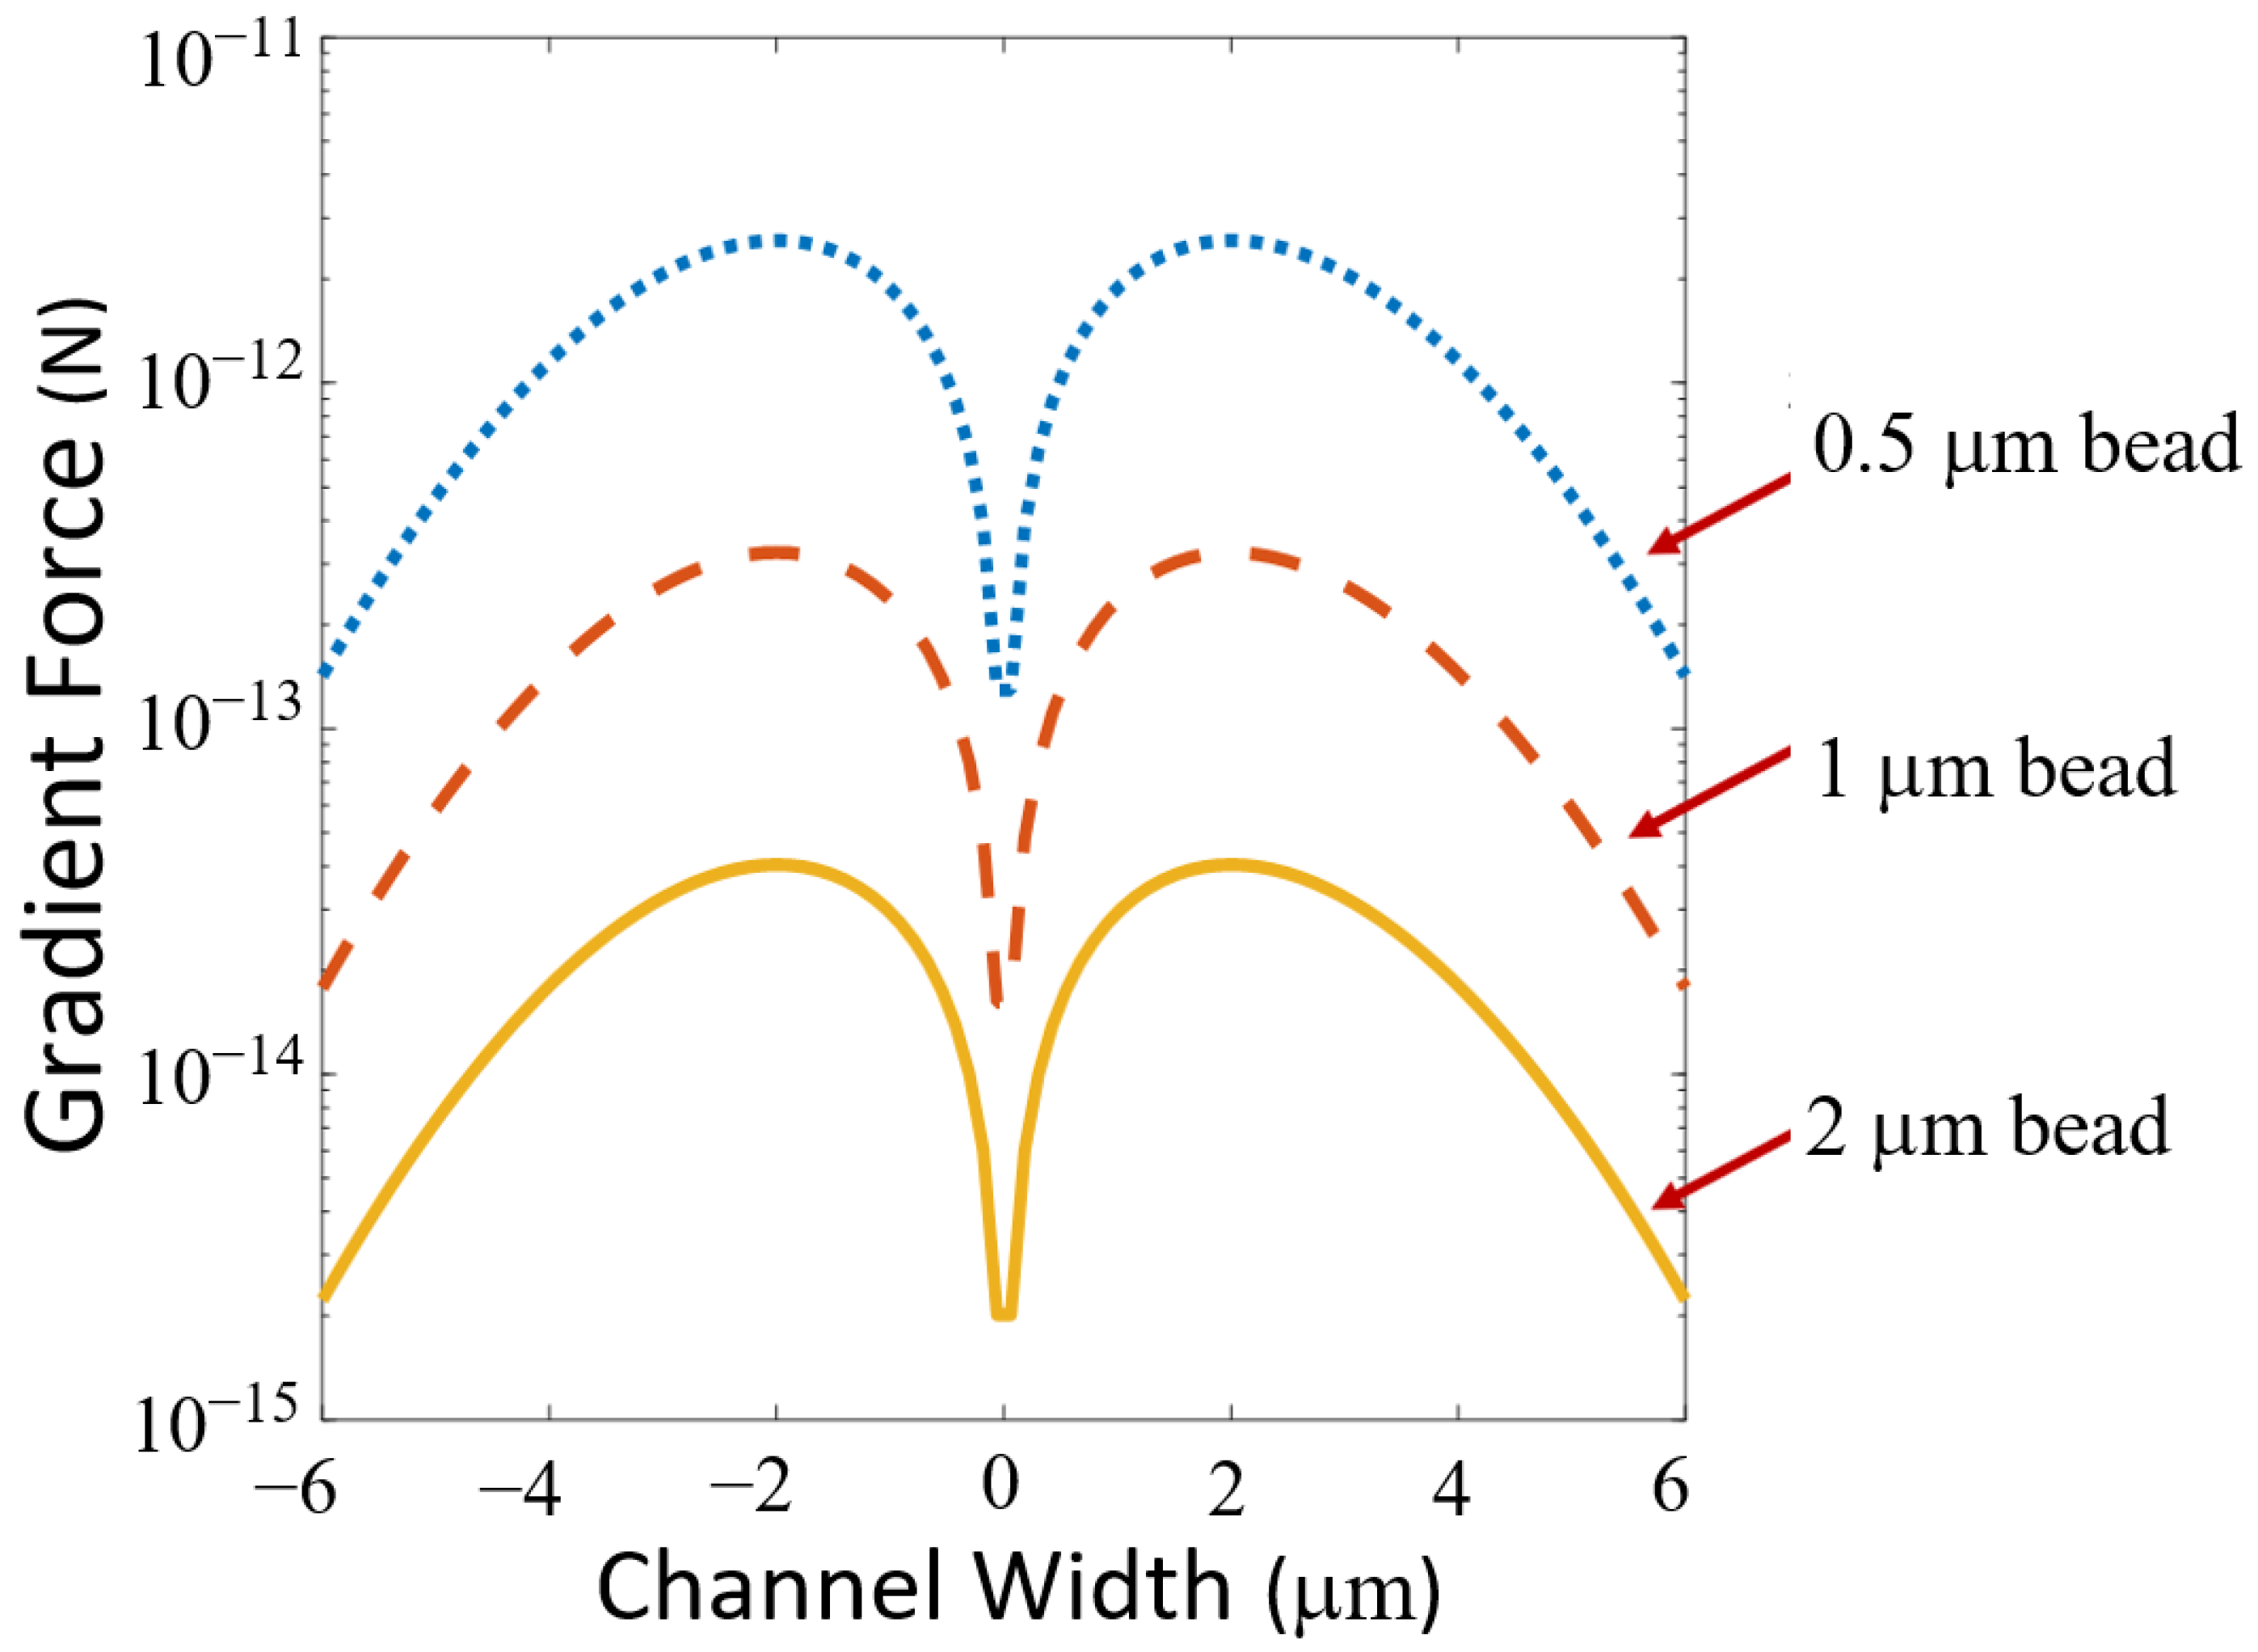
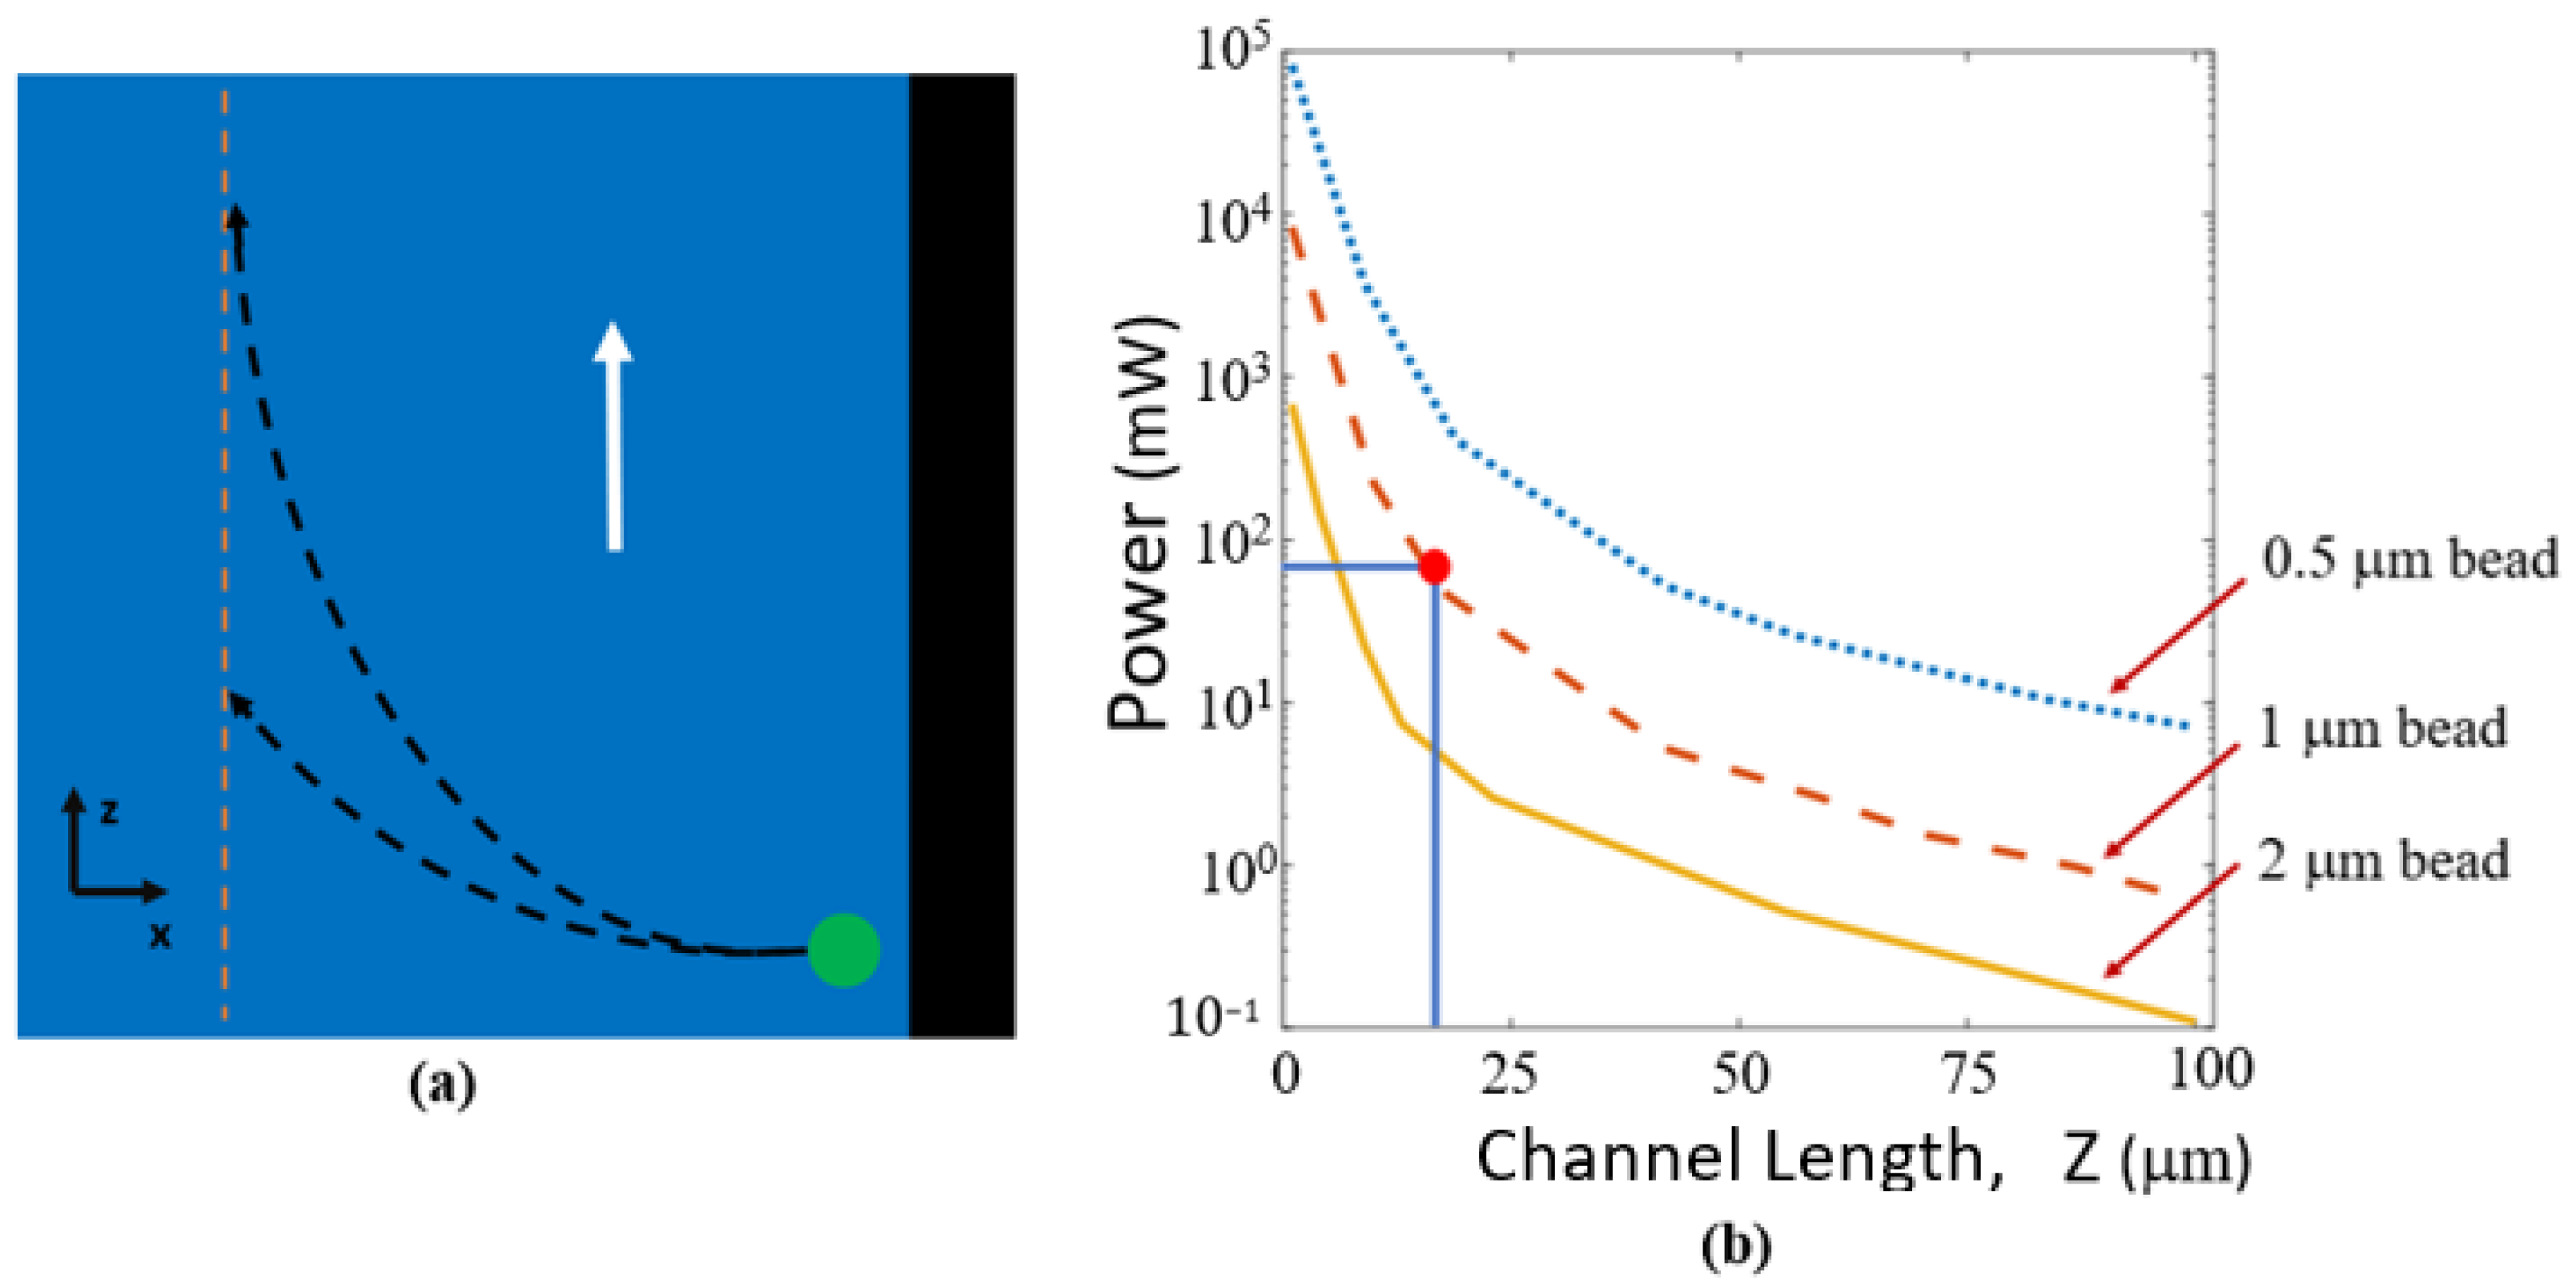
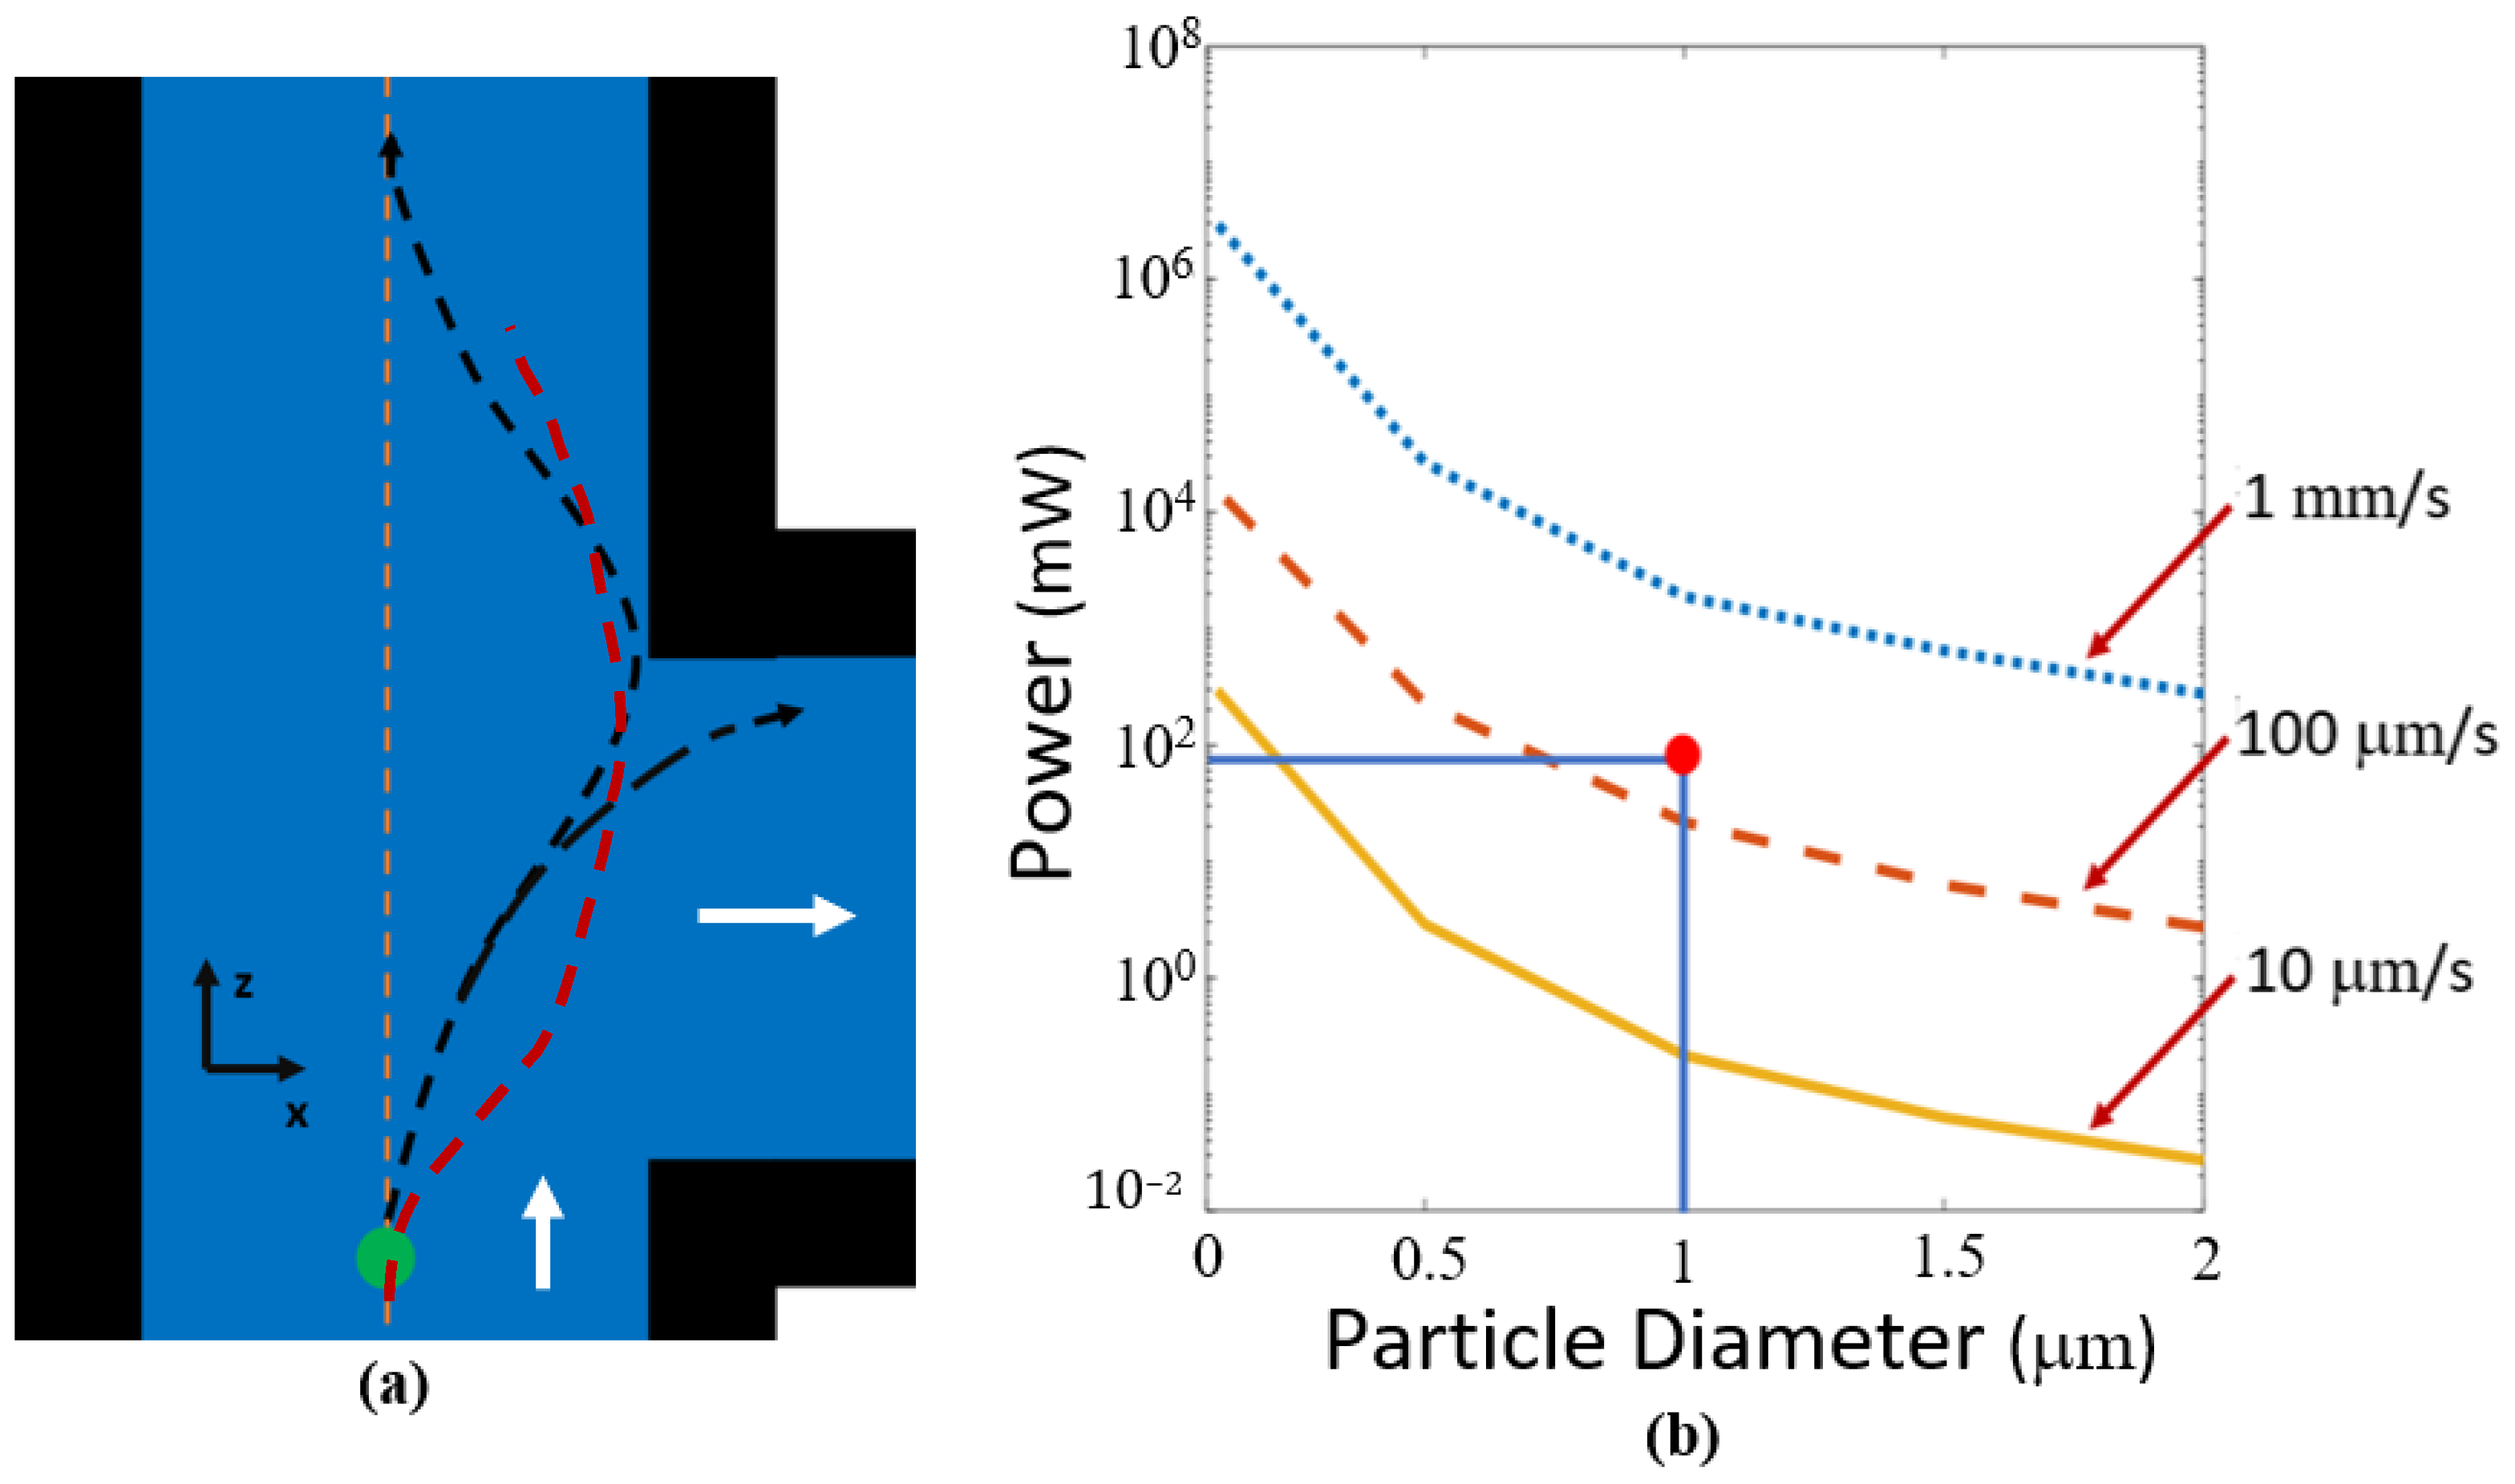
3.2. Particle Manipulation in the Gradient Force Design
4. Discussion
5. Conclusions
Supplementary Materials
Author Contributions
Funding
Institutional Review Board Statement
Informed Consent Statement
Data Availability Statement
Conflicts of Interest
References
- Nilsson, J.; Evander, M.; Hammarström, B.; Laurell, T. Review of cell and particle trapping in microfluidic systems. Anal. Chim. Acta 2009, 649, 141–157. [Google Scholar] [CrossRef] [PubMed]
- Pergande, M.R.; Cologna, S.M. Isoelectric Point Separations of Peptides and Proteins. Proteomes 2017, 5, 4. [Google Scholar] [CrossRef] [PubMed]
- Farmerie, L.; Rustandi, R.R.; Loughney, J.W.; Dawod, M. Recent advances in isoelectric focusing of proteins and peptides. J. Chromatogr. A 2021, 1651, 462274. [Google Scholar] [CrossRef] [PubMed]
- Li, Y.; Wang, Y.; Wan, K.; Wu, M.; Guo, L.; Liu, X.; Wei, G. On the design, functions, and biomedical applications of high-throughput dielectrophoretic micro/nanoplatforms: A review. R. Soc. Chem. 2021, 13, 4330–4358. [Google Scholar] [CrossRef] [PubMed]
- Guevara-Pantoja, P.E.; Sánchez-Domínguez, M.; Caballero-Robledo, G.A. Micro-nanoparticles magnetic trap: To-ward high sensitivity and rapid microfluidic continuous flow enzyme immunoassay. Biomicrofluidics 2020, 14, 014111. [Google Scholar] [CrossRef]
- Kühn, S.; Measor, P.; Lunt, E.J.; Phillips, B.S.; Deamer, D.W.; Hawkins, A.; Schmidt, H. Loss-based optical trap for on-chip particle analysis. Lab A Chip 2009, 9, 2212–2216. [Google Scholar] [CrossRef]
- Kühn, S.; Measor, P.; Schmidt, H.; Lunt, E.J.; Hawkins, A.R.; Kuehn, S. Two-beam optical trap in a waveguide. Front. Opt. 2007, PDP_B7. [Google Scholar] [CrossRef]
- Grosser, S.; Fritsch, A.W.; Kießling, T.R.; Stange, R.; Käs, J.A. The lensing effect of trapped particles in a dual-beam optical trap. Opt. Express 2015, 23, 5221–5235. [Google Scholar] [CrossRef]
- Kühn, S.; Measor, P.; Lunt, E.J.; Phillips, B.S.; Deamer, D.W.; Hawkins, A.R.; Schmidt, H. Active trapping of individual particles on an optofluidic analysis platform. In Proceedings of the Conference on Lasers and Electro-Optics/International Quantum Electronics, Baltimore, MD, USA, 2–4 June 2009; Volume CTuM4. [Google Scholar] [CrossRef]
- Kampmann, R.; Sinzinger, S.; Korvink, J. Optical tweezers for trapping in a microfluidic environment. Appl. Opt. 2018, 57, 5733–5742. [Google Scholar] [CrossRef]
- Pesce, G.; Jones, P.H.; Maragò, O.M.; Volpe, G. Optical tweezers: Theory and practice. Eur. Phys. J. Plus 2020, 135, 949. [Google Scholar] [CrossRef]
- Narayanamurthy, V.; Nagarajan, S.; Khan, A.Y.F.; Samsuri, F.; Sridhar, T.M. Microfluidic hydrodynamic trapping for single cell analysis: Mechanisms, methods and applications. Anal. Methods 2017, 9, 3751–3772. [Google Scholar] [CrossRef]
- Rahman, M.; Sampad, M.J.N.; Hawkins, A.; Schmidt, H. Recent advances in integrated solid-state nanopore sensors. Lab A Chip 2021, 21, 3030–3052. [Google Scholar] [CrossRef] [PubMed]
- DeSantis, M.; Cheng, W. Label-free detection and manipulation of single biological nanoparticles. WIREs Nanomed. Nanobiotechnol. 2016, 8, 717–729. [Google Scholar] [CrossRef]
- Huang, G.; Su, C.; Wang, L.; Fei, Y.; Yang, J. The Application of Nucleic Acid Probe–Based Fluorescent Sensing and Imaging in Cancer Diagnosis and Therapy. Front. Chem. 2021, 9, 705458. [Google Scholar] [CrossRef] [PubMed]
- Sampad, M.J.N.; Zhang, H.; Yuzvinsky, T.D.; Stott, M.A.; Hawkins, A.R.; Schmidt, H. Optical trapping assisted label-free and amplification-free detection of SARS-CoV-2 RNAs with an optofluidic nanopore sensor. Biosens. Bioelectron. 2021, 194, 113588. [Google Scholar] [CrossRef]
- Leartprapun, N.; Iyer, R.; Adie, S. Depth-resolved measurement of optical radiation-pressure forces with optical coherence tomography. Opt. Express 2018, 26, 2410–2426. [Google Scholar] [CrossRef] [PubMed]
- Bliokh, K.; Bekshaev, A.Y.; Nori, F. Optical Momentum, Spin, and Angular Momentum in Dispersive Media. Phys. Rev. Lett. 2017, 119, 073901. [Google Scholar] [CrossRef]
- Leake, K.D.; Phillips, B.S.; Yuzvinsky, T.D.; Hawkins, A.R.; Schmidt, H. Optical particle sorting on an optofluidic chip. Opt. Express 2013, 21, 32605–32610. [Google Scholar] [CrossRef]
- Du, J.; Yuen, C.H.; Li, X.; Ding, K.; Du, G.; Lin, Z.; Chan, C.T.; Ng, J. Tailoring Optical Gradient Force and Optical Scattering and Absorption Force. Sci. Rep. 2017, 7, 18042. [Google Scholar] [CrossRef] [Green Version]
- Deng, T.; Li, M.; Wang, Y.; Liu, Z. Development of solid-state nanopore fabrication technologies. Sci. Bull. 2015, 60, 304–319. [Google Scholar] [CrossRef]
- Walker, Z.J.; Wells, T.; Belliston, E.; Romney, S.; Walker, S.B.; Sampad, M.J.N.; Saiduzzaman, S.M.; Losakul, R.; Schmidt, H.; Hawkins, A.R. Optofluidic Particle Manipulation Platform with Nanomembrane. Micromachines 2022, 13, 721. [Google Scholar] [CrossRef] [PubMed]
- Walker, Z.; Wells, T.; Lay, K.; Sampad, M.J.N.; Schmidt, H.; Hawkins, A. Solid-state membranes formed on natural menisci. Nanotechnology 2020, 31, 445303. [Google Scholar] [CrossRef] [PubMed]
- Phillips, B.S.; Jenkins, M.H.; Liu, S.; Schmidt, H.; Hawkins, A.R. Selective Thin-Film Deposition for Optofluidic Platforms with Optimized Transmission. IEEE Photon-Technol. Lett. 2011, 23, 721–723. [Google Scholar] [CrossRef]
- Holmes, M.R. Integration of Micropore and Nanopore Features with Optofluidic Waveguides for Single Particle Sensing; BYU Publishing: Provo, UT, USA, 2011; pp. 2572–4479. [Google Scholar]
- Harada, Y.; Asakura, T. Radiation forces on a dielectric sphere in the Rayleigh scattering regime. Opt. Commun. 1996, 124, 529–541. [Google Scholar] [CrossRef]


Publisher’s Note: MDPI stays neutral with regard to jurisdictional claims in published maps and institutional affiliations. |
© 2022 by the authors. Licensee MDPI, Basel, Switzerland. This article is an open access article distributed under the terms and conditions of the Creative Commons Attribution (CC BY) license (https://creativecommons.org/licenses/by/4.0/).
Share and Cite
Walker, Z.J.; Wells, T.; Belliston, E.; Walker, S.B.; Zeller, C.; Sampad, M.J.N.; Saiduzzaman, S.M.; Schmidt, H.; Hawkins, A.R. Optofluidic Particle Manipulation: Optical Trapping in a Thin-Membrane Microchannel. Biosensors 2022, 12, 690. https://doi.org/10.3390/bios12090690
Walker ZJ, Wells T, Belliston E, Walker SB, Zeller C, Sampad MJN, Saiduzzaman SM, Schmidt H, Hawkins AR. Optofluidic Particle Manipulation: Optical Trapping in a Thin-Membrane Microchannel. Biosensors. 2022; 12(9):690. https://doi.org/10.3390/bios12090690
Chicago/Turabian StyleWalker, Zachary J., Tanner Wells, Ethan Belliston, Seth B. Walker, Carson Zeller, Mohammad Julker Neyen Sampad, S. M. Saiduzzaman, Holger Schmidt, and Aaron R. Hawkins. 2022. "Optofluidic Particle Manipulation: Optical Trapping in a Thin-Membrane Microchannel" Biosensors 12, no. 9: 690. https://doi.org/10.3390/bios12090690
APA StyleWalker, Z. J., Wells, T., Belliston, E., Walker, S. B., Zeller, C., Sampad, M. J. N., Saiduzzaman, S. M., Schmidt, H., & Hawkins, A. R. (2022). Optofluidic Particle Manipulation: Optical Trapping in a Thin-Membrane Microchannel. Biosensors, 12(9), 690. https://doi.org/10.3390/bios12090690