Abstract
Signal readout technologies that do not require any instrument are essential for improving the convenience and availability of paper-based sensors. Thanks to the remarkable progress in material science and nanotechnology, paper-based sensors with instrument-free signal readout have been developed for multiple purposes, such as biomedical detection, environmental pollutant tracking, and food analysis. In this review, the developments in instrument-free signal readout technologies for paper-based sensors from 2020 to 2023 are summarized. The instrument-free signal readout technologies, such as distance-based signal readout technology, counting-based signal readout technology, text-based signal readout technology, as well as other transduction technologies, are briefly introduced, respectively. On the other hand, the applications of paper-based sensors with instrument-free signal readout technologies are summarized, including biomedical analysis, environmental analysis, food analysis, and other applications. Finally, the potential and difficulties associated with the advancement of paper-based sensors without instruments are discussed.
1. Introduction
Paper-based sensors have become increasingly popular for a range of analytical applications in recent years due to their convenience, affordability, portability, and user-friendliness. Since the paper-based sensors were first reported in 2007 [1], they have been widely employed in biomedical analysis [2,3], environmental pollutant tracking [4,5], food analysis [6], and other fields [7] for many years. Nevertheless, these quantitative processes typically involve a range of technologies such as electrochemistry [8], fluorescence [9], chemiluminescence [10], or electrochemiluminescence [11], which usually require some specialized instrument and skilled personnel. Thus, developing quantitative analysis techniques that do not require specific instruments yet still provide precise and dependable results is a challenge in the application of paper-based sensors.
Instrument-free readout technologies are indispensable for increasing the usability and accessibility of paper-based sensors. Traditional spectroscopic analysis technologies rely on the variations in color difference or intensity before and after the reaction to perform a qualitative or quantitative analysis of the analyte. This process, however, necessitates the use of specialized instrumentation [12], which can be inconvenient and inefficient. Paper-based colorimetric assays rely on the color change caused by the interaction between the chromogenic reagent and the analyte for instrument-free visual qualification or quantification. A variety of paper-based sensors with instrument-free signal readout have been developed, including the transformation of the detection signal into a measurement of color distance changes [13], counting the number of color change areas [14], readout of display text [15], or other technologies [16], which can be directly or indirectly quantified or semi-quantitatively assessed with the naked eye.
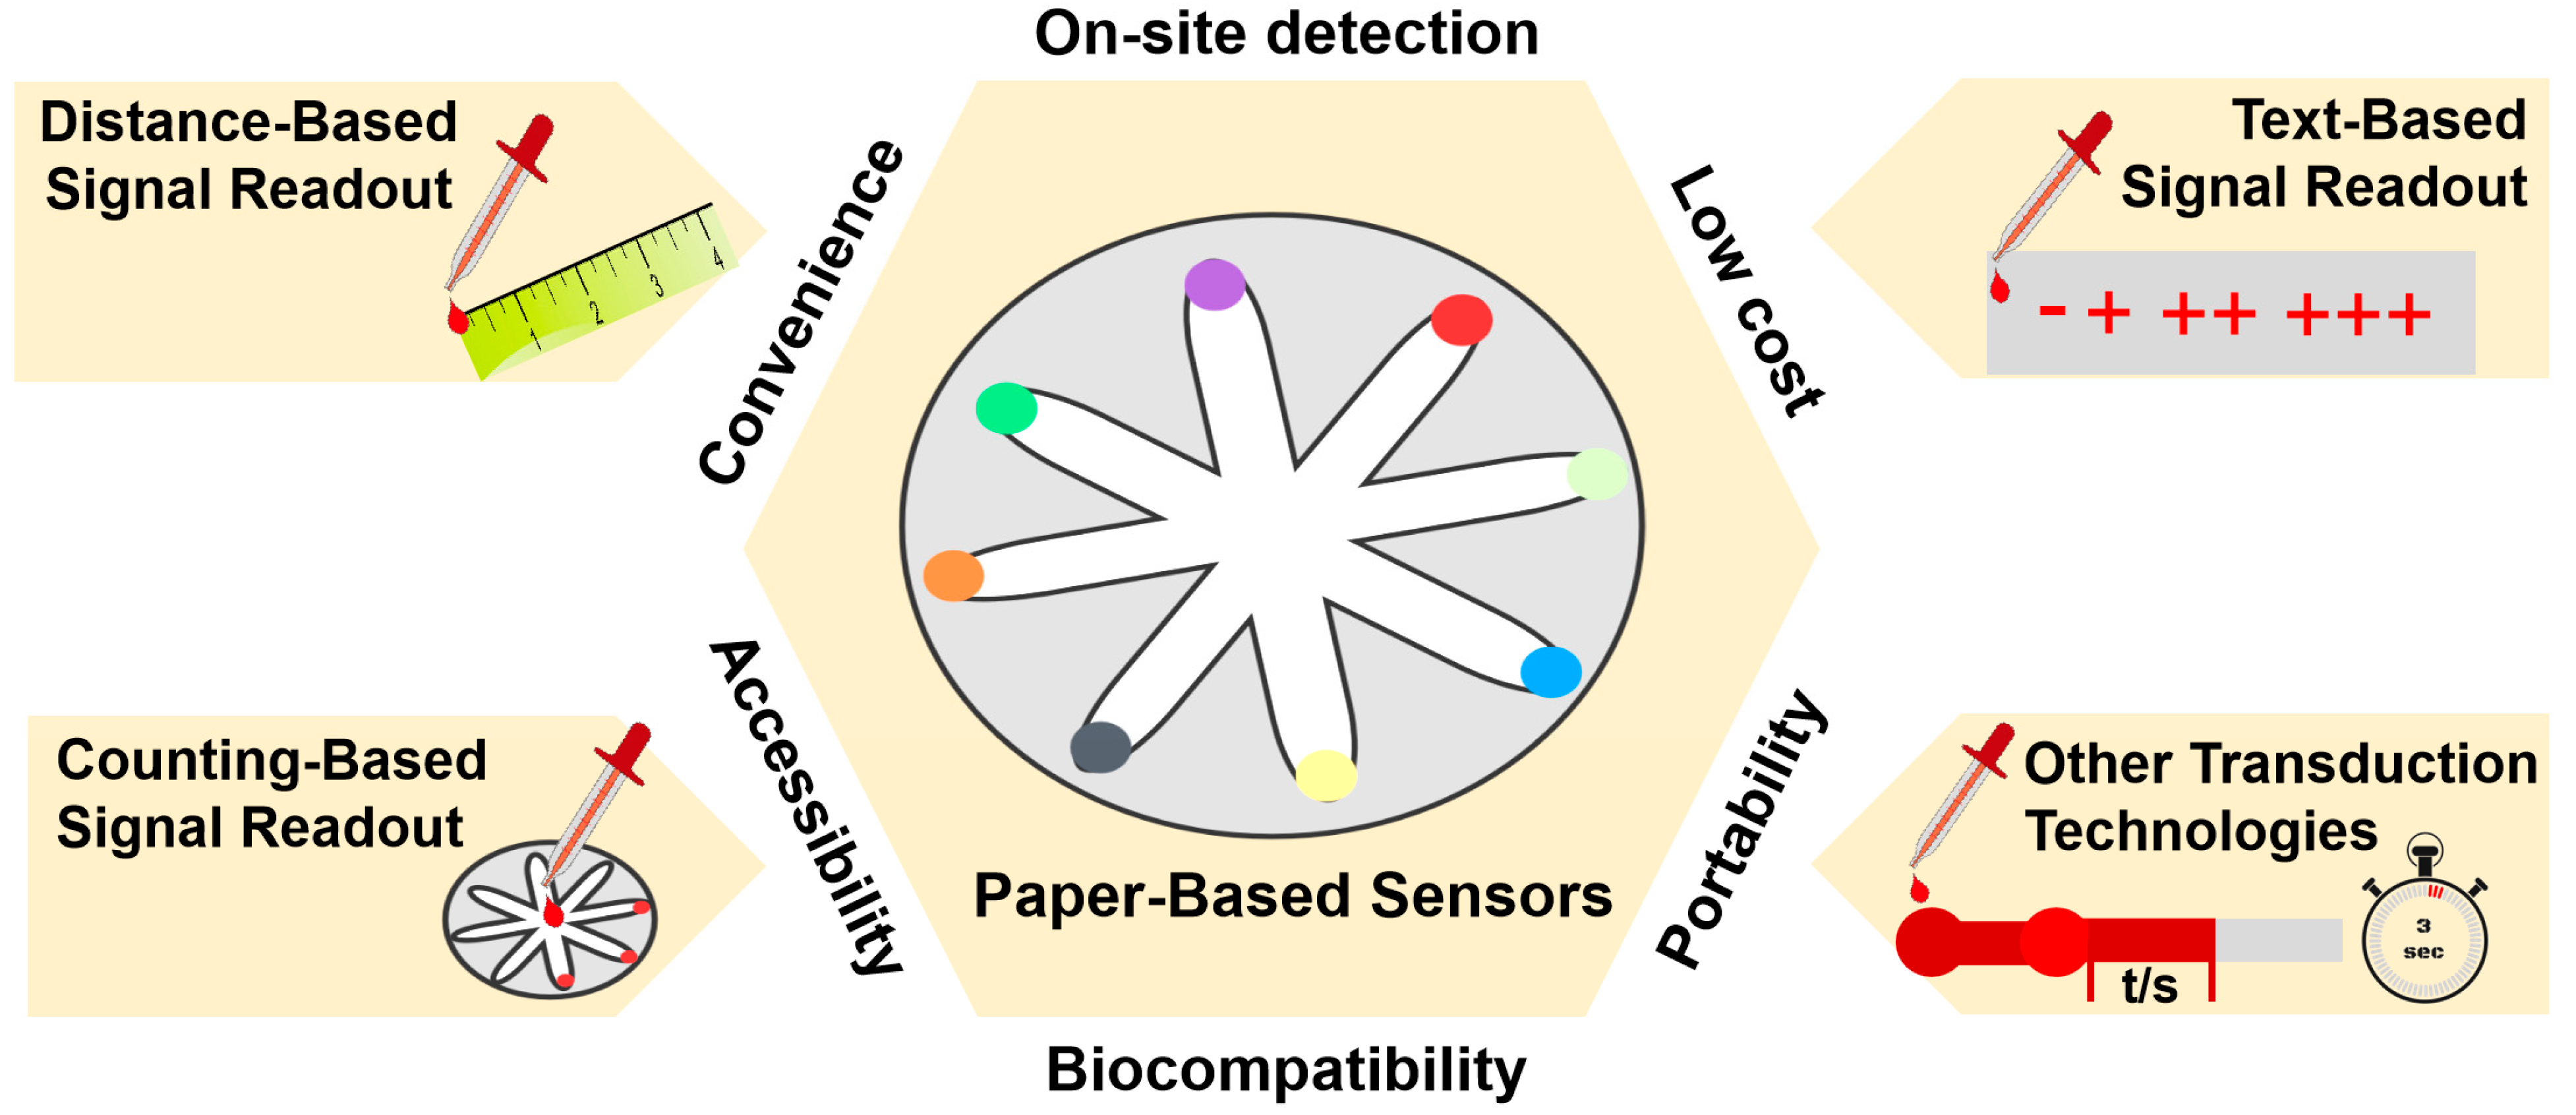
Paper-based sensors with instrument-free signal readout have been gaining attention as a technology that could be utilized for a variety of point-of-care testing applications. To date, there have been several reviews on paper-based sensors, mainly focusing on distance-based microfluidics [17,18]. Moreover, the applications of paper-based sensors with instrument-free signal readout have been reviewed in 2019 by Li et al. [19]. In this review, we focus on the different instrument-free signal readout technologies, including distance-based signal readout technology, counting-based signal readout technology, text-based signal readout technology, and other transduction technologies in the last three years (2020–2023) (Figure 1). Then, the applications of paper-based sensors with instrument-free signal readout are summarized, including biomedical analysis, environmental analysis, food analysis, and other applications. Finally, the potential and difficulties associated with the advancement in paper-based sensors without instruments are discussed.
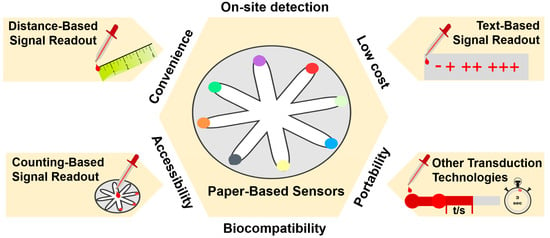
Figure 1.
Schematic of paper-based sensors with instrument-free signal readout technologies.
2. Instrument-Free Signal Readout Technologies of Paper-Based Sensors
Recent progress in instrument-free signal readout technologies has enabled the simplification of the use and acquisition of paper-based sensors. The technologies for signal acquisition can be classified into four general categories: the distance-based signal readout technology utilizes migration distance of color change; the counting-based signal readout technology relies on numerical counting or quantification of visual indicators; the text-based signal readout technology utilizes printed texts; and other transduction technologies explore alternative detection technologies. These technologies, which are simple and cost-effective, offer great potential for applications in various fields that require rapid and on-site analysis.
2.1. Distance-Based Signal Readout Technology
This technique achieves instrument-free signal readout on a paper-based sensor by quantifying the change in solution migration distance caused by the analyte. The paper substrate is often equipped with hydrophilic channels or patterned areas to facilitate the rapid flow of liquids, thereby increasing the efficiency of sample transfer. Additionally, the use of patterned areas on the paper substrate allows for a more uniform distribution of the sample, resulting in more accurate results. As the sample solution containing the analyte walks through these channels or areas via capillary action, a visible color change occurs due to chemical reactions between the analyte and reagents impregnated in these regions. Finally, quantitative analysis can be accomplished without any apparatus by assessing the migration distance of color change in combination with a previously established calibration curve.
To obtain a more convenient and less resource-consuming quantitative method, a distance-based signal readout technology, first reported in 2013 [20], is used to measure glucose, nickel, and glutathione, respectively. Since then, numerous distance-based instrument-free signal readout techniques that make use of length measurements have been widely established. For instance, Ogawa et al. [21] designed a foldable origami paper-based device that utilizes the molybdenum blue reaction to enable the semi-quantitative monitoring of ionic silica. Initially, the modified paper strips were treated with cationic poly(allylamine hydrochloride) followed by indicator heptamolybdate, and then the analytes containing ionic silica were pipetted into the reduction area for 30 min, a yellow silicomolybdic complex was reduced by ascorbic acid and turned blue. The ionic silica sample was detectable between 50 mg/L and 1000 mg/L with the lowest detection level being 50 mg/L. In addition, Phoonsawat et al. [22] developed silver hexagonal nanoprism (AgNPrs)-modified distance-based paper sensors with a view to achieving high levels of sensitivity and selectivity for identifying the presence of Br− and BrO3− (Figure 2A). The concentration of BrO3− can be determined by coupling a paper-based sensor with a headspace extractor method to convert it to Br2. The detection of Br− involves its conversion to Br2 in the presence of oxygen, which then quickly transforms into the strong oxidizing agent HBrO of AgNPrs when mixed with water. The AgNPrs (pink color) react with the BrO3− obtained via headspace extraction and the Br− in solution to produce silver nanospheres (yellow color) and AgBr through an oxidative process. Finally, the yellow bands can be used to quantify Br− and BrO3− by visually measuring their lengths. This method enables the analysis of Br− and BrO3− at concentrations ranging from 25 to 2000 μg/L and 0.5 to 50 μg/L, respectively. The limit of detection (LOD) for Br− was 10 μg/L, while that for BrO3− was 0.5 μg/L.
Another distance-based instrument-free signal readout technology by measuring the radial distance has also attracted attention. That is, the sample solution undergoes radial diffusion on the filter paper via capillary force, leading to the formation of a circular colored spot. The radius of the circular spot is in direct correlation to the quantity of the analyte (Figure 2B). A radial distance-based instrument-free signal readout technology was developed by Zhang et al. [23] to measure urea concentration based on the pH-dependent and high viscosity variation characteristics of chitosan in a solution state. The measurement of urea levels in this study can be accomplished by utilizing urease, an enzyme that catalyzes the decomposition of urea into ammonia, thereby elevating the pH of the solution and altering the viscosity of chitosan. Finally, the amount of urea is connected to the radial diffusion distance on the paper substrate, which can be ascertained with a vernier caliper. Under optimal conditions, the developed method is capable of analyzing urea concentrations between 3.8 mM and 15.1 mM, with a limit of quantitation (LOQ) of 3.8 mM. In addition, a similar study was also reported by Zhang et al. [24] to measure glucose concentration using a glucose oxidase-catalyzed reaction to cause a decrease in the solution’s pH to release calcium ions from calcium carbonate, and the released calcium ions combined with sodium alginate to form a calcium alginate hydrogel, thereby increasing the viscosity of the solution. Finally, a vernier caliper was employed to measure the radial diffusion diameter of the mixed solution that was pipetted onto the filter paper. Employing this approach, glucose concentrations between 1.4 mM and 7.0 mM can be analyzed, with an LOQ of 1.4 mM.
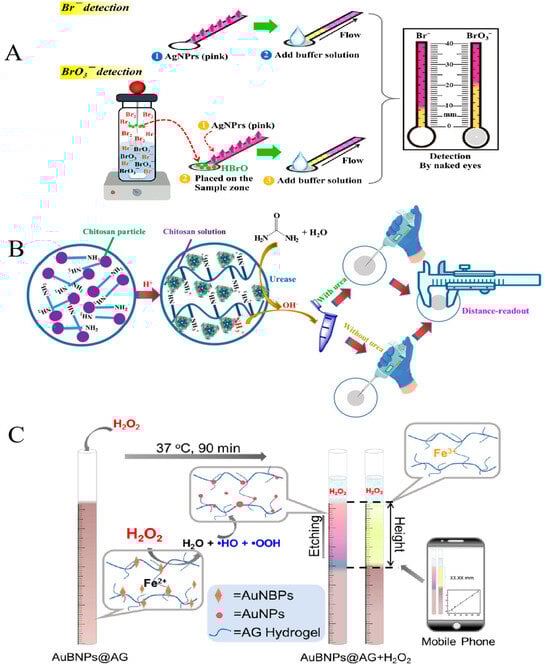
Figure 2.
(A) Schematic of length distance-based instrument-free signal readout technology for the detection of Br− and BrO3−. Reprinted with permission from Ref. [22]. (B) Schematic of radial distance-based instrument-free signal readout technology. Reprinted with permission from Ref. [23]. (C) Schematic of height distance-based instrument-free signal readout technology. Reprinted with permission from Ref. [25].
Apart from the above technologies, a distance-based instrument-free readout technology for measuring height has been reported by Shou et al. [25], who created a multicolored hydrogel sensor with the aim of recognizing H2O2 through the process of etching gold nanobipyramids (AuNBPs) (Figure 2C). The introduction of H2O2 caused a marked alteration in the color of AuNBPs@agarose hydrogel as the concentration of H2O2 increased. Finally, the height of the color change reflected the amount of H2O2 in the solution. It was observed that a linear relationship existed within ranges of 20–100 μM, 200–1000 μM, 1–10 mM, and 10–100 mM when this approach was utilized. Signal readout technology based on length measurement, which does not require modification of the paper substrate, is suitable for detecting analytes that cause changes in solution viscosity. On the other hand, signal readout technologies based on radial distance and height require modification of the paper substrate and are suitable for detecting analytes that trigger color development reactions.
2.2. Counting-Based Signal Readout Technology
Digital counting or quantification of visual indicators is used in counting-based signal readout technology to obtain signal readout from paper-based sensors. This approach usually involves incorporating indicator molecules that undergo specific reactions with the target analytes, resulting in color changes or the formation/disappearance of distinct patterns or symbols. The amount of occurrences or presence/absence of these indicators is then related to the quantity of the analyte through the quantitative relationships or the established standards.
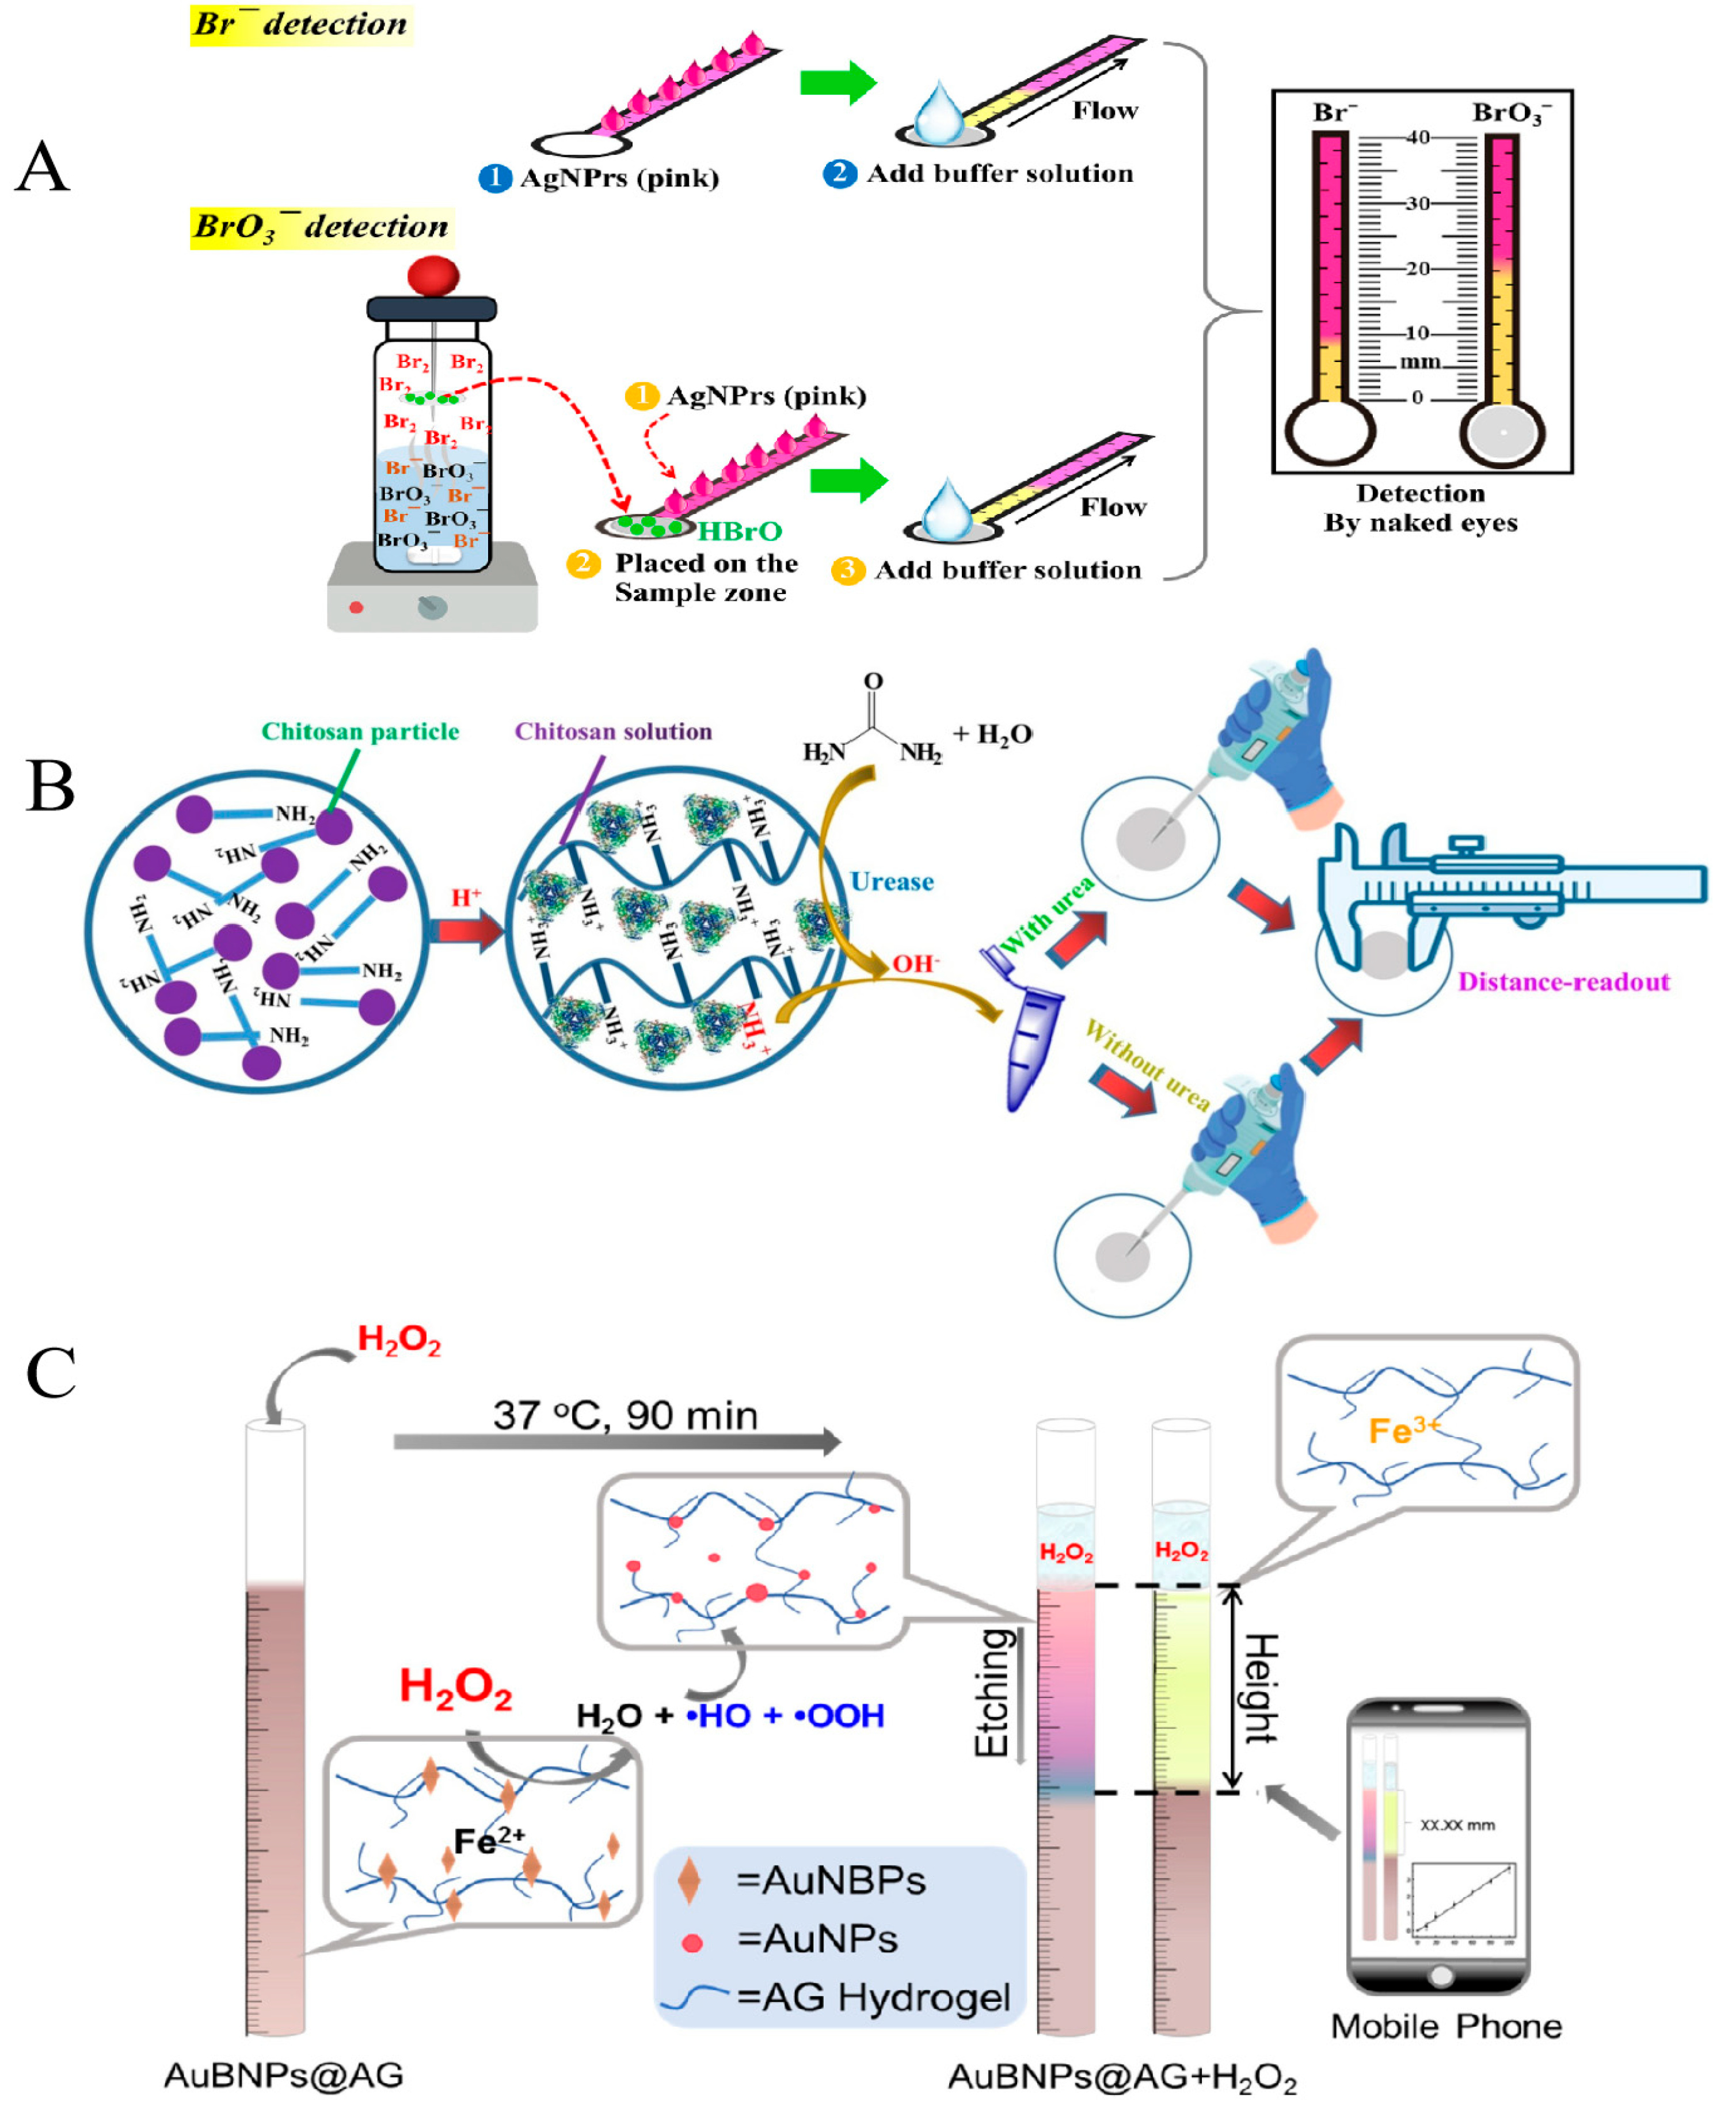
The counting-based signal readout sensor was first reported by Lewis et al. [26]. In this study, the number of colored bars can be employed to identify the amount of H2O2. A similar study was also reported by Khachornsakkul et al. [27], who employed a novel counting-based instrument-free signal readout device designed to detect the Cu2+ and carbaryl (CBR) in real samples. The paper analytical device, depicted in Figure 3, is constructed with two layers of filter paper; the initial layer is equipped with twelve detection zones, all of which have been pre-loaded with specific reagents to measure Cu2+ and CBR, and the subsequent layer is used to establish a pathway between the sample and detection zones. After the introduction of samples containing Cu2+ or CBR, they can react with the reagent that had been previously deposited and produce a color change in each successive zone. The concentration of Cu2+ and CBR can be ascertained by measuring the number of blue and orange detection areas, respectively. Finally, this method has demonstrated its capacity to analyze Cu2+ and CBR in the ranges of 1.25–15.0 μg/mL and 0.01–0.12 μg/mL, with an LOQ of 1.25 μg/mL and 0.01 μg/mL, respectively. To overcome the challenges of using sub-microliter sample volumes for semi-quantitative assay, a paper-based microfluidic sensor was innovatively created to enable the semi-quantitative detection of both immunoglobulin (IgE) and glucose through the use of a counting-based lateral flow assay [28]. In this study, three points along the sample flow path were supplied with 0.2 μL of the assay reagent, resulting in a count-based colorimetric assay signal. After the introduction of the analyte, they can react with the reagent that had been previously deposited at the test points and produce a color change at each point. The levels of IgE and glucose can be determined by counting the colored points. Through the developed method, it is possible to analyze IgE and glucose concentrations ranging from 0 to 400 ng/mL and 0 to 12 mmol/L, respectively.
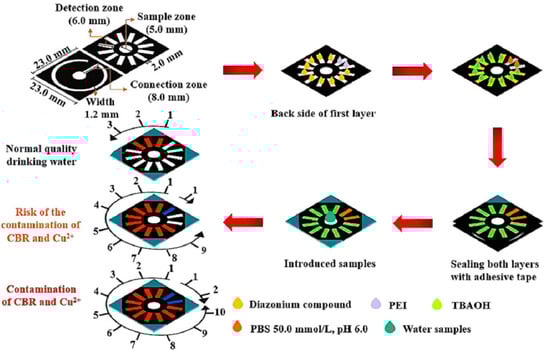
Figure 3.
Schematic of counting-based instrument-free signal readout technology. Reprinted with permission from Ref. [27].
2.3. Text-Based Signal Readout Technology
Text-based signal readout techniques necessitate the use of paper-based sensors that have been printed or pre-loaded with text. This process typically requires the addition of a reagent that interacts with the substance being analyzed, leading to the production of a distinct textual response, such as a number, letter, or symbol. Through visual comparison of the generated text with a reference scale, or by interpreting its variations, quantitative data can be obtained without the requirement of any additional apparatus.
The text-based signal readout technology necessitates the use of pre-patterned on a paper substrate, such as those with and without obstacle patterns, which are usually produced through inkjet printing and pen writing. For example, Yamada et al. [29] designed a paper-based text-displaying sensor involving an obstacle pattern for the semi-quantitative detection of human serum albumin. The developed method allows for a direct readout of the values without the need for matching the colors to a reference chart, thus decreasing the chance of an inaccurate assessment. Despite the simplicity and convenience of text-based signal readout technology being based on an obstacle-involved pattern, the need for pre-loaded obstacles to form the flow channels renders the mass production of the patterned paper a laborious process. To overcome this problem, Chauhan et al. [30] designed a paper-based microfluidic sensor without any obstacle pattern that can recognize salivary thiocyanate, proteins, glucose, and nitrite via colorimetric analysis (Figure 4). The sensor is constructed from two layers: a liquid distribution layer and a reagent layer for detection, both of which have different wicking rates. In this study, a pH indicator containing bromophenol blue solution was first deposited on the detection layer, and then the distribution, detection, and base layers were bonded together. Subsequently, the clinically relevant analytes were introduced into the sample wells and diffused from the diffusion layer to the detection layer using different adsorption rates. Finally, an image analysis software was used for quantitative and semi-quantitative analysis.
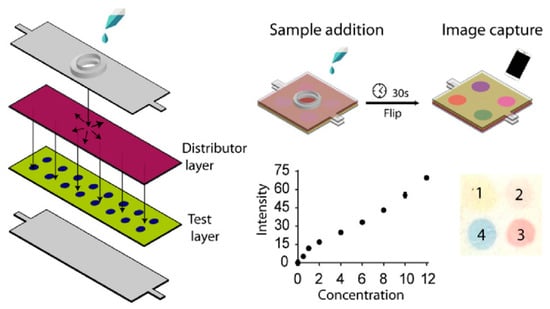
Figure 4.
Schematic of text-based instrument-free signal readout technology. Reprinted with permission from Ref. [30].
2.4. Other Transduction Technologies
Besides the technologies mentioned above, other transduction techniques have been documented for instrument-free signal readout in paper-based sensors such as time-based and self-powered signal readout technologies. Wu et al. [16] developed a quantitative thrombin assay using a time signal output technique. In this study, the thrombin aptamer was demonstrated to be an effective method for the accurate detection of thrombin, due to its capability to transition from a loose form to a rigid G-quadruplex structure, thus partially concealing the surface of the Au NPs. Thrombin could be determined between 1.3 nM and 43 nM with an LOD of 0.9 nM. In addition, Liu et al. [31] designed an origami paper-based device, powered by itself, which can detect adenosine-5′-triphosphate (ATP) through a reaction initiated by glucose oxidase (GOx). Firstly, a sandwich structure is formed in the detection zone via the combination of DNA sequence, aptamer, and GOx modified by DNA2. Subsequently, the binding between ATP and aptamers is activated when varying concentrations of ATP are added, which in turn causes the liberation of GOx-DNA. This released GOx-DNA then traverses the hollow region to the reaction zone, where it catalyzes glucose oxidation and produces electrons, thus changing the amount of K3[Fe(CN)6]. The proposed device has the capability to identify ATP concentration in the interval of 10–5000 nM.
3. Application of Paper-Based Sensors with an Instrument-Free Signal Readout
Over the last few years, paper-based sensors have gained increasing attention, with a range of paper-based analytical tools being designed for different applications. The reasons for this are as follows: (1) paper is one of the cheapest and most unique materials; (2) based on different design principles such as surface wettability, viscosity, flow control, and colorimetry [32,33,34,35], as well as preparation technologies, including screen printing, laser printing, and wax printing [36,37,38], paper or modified paper have been used as microreactors with specific functions and to realize the detection of different analytes. Currently, paper-based sensors with instrument-free signal readout technologies are a popular choice in biomedical analysis, environmental pollutant tracking, food analysis, and other aspects.
3.1. Biomedical Analysis
Paper-based sensors, which do not require instrument signal readout technologies, are popular for their cost-effectiveness, ease of use, and portability in biomedical analysis, especially in monitoring physiological parameters and detecting biomarkers. The application of paper-based sensors with instrument-free signal readout technologies in biomedical analysis is shown in Table 1.

Table 1.
Application of paper-based sensors with instrument-free signal readout technologies in biomedical analysis.
Cancer is a crucial global health issue that is currently affecting people everywhere. Tumors are formed when cancer cells grow abnormally and uncontrollably. Traditionally, cancer diagnosis was carried out using nuclear magnetic resonance, or computed tomography, which relies on some special instruments and professional operators. Therefore, recognizing cancer in its early stages is vital for decreasing the severity of the illness and improving the quality of life for patients. The detection of relevant biomarkers during cancer development can be used in the diagnosis and treatment of cancer. MicroRNA, which is released from cells and organs, has been determined to be strongly associated with the occurrence and growth of cancer and is thus being used as a cancer biomarker. Zhang et al. [51] combined catalytic hairpin assembly (CHA) and hybridization chain reaction (HCR) techniques to develop a paper substance sensor for the quantitative measurement of miRNA-21 based on distance signal readout. In the presence of miRNA, CHA initiates HCR amplification to generate substantial amounts of G-quadruplex, which binds to heme to produce the Hemin/G-quadruplex peroxidase-mimicking DNAzyme. This peroxidase-mimicking then catalyzes the transformation of iodide to iodine when it is mixed with H2O2. As a result of the starch–iodide reaction, the paper shows a bright blue/purple-hued band that can be accurately determined using a ruler. Finally, the proposed method is capable of detecting miRNA-21 concentrations between 1.0 pM and 1000 pM, with an LOD of 0.2 pM. Tai et al. [52] created a paper-based sensor that interprets the changes in viscosity brought about by the breakdown of hydrogel into a visual signal that is determined by the distance. This study has shown that combining Cu2+ and alginate can create a copper-alginate hydrogel, and the presence of pyrophosphate ions has a strong attraction to Cu2+ that causes the gel–sol transition. The hydrogel’s disintegration alters the viscosity of the solution, which is then reflected in a shift in the distance on pH test papers, thus allowing for the identification of ALP and alpha-fetoprotein. Finally, the proposed method enables the measurement of ALP from 1 to 100 mU/mL with an LOD of 1.7 mU/mL, and alpha-fetoprotein from 0.5 to 30 ng/mL with an LOD of 0.8 ng/mL.
Viruses, as a widespread biological entity in nature, especially in the past three years, have posed a major security threat to the world with the emergence of COVID-19. Qian et al. [40] proposed a combination of the manual centrifugal micropipette tip approach and distance-based signal readout to facilitate the identification of SARS-CoV-2. When viral antigens were present, nanoparticles encapsulating monoclonal antibodies coalesced to form larger complexes. After incubation and centrifugation, the complexes that have formed aggregates settle out of the solution, while the free nanoparticles remain in suspension due to their lower density. Finally, quantitatively measuring the length of the aggregates that have been formed is easily achieved with visual inspection. The proposed strategy has the capacity to recognize SARS-CoV-2 viral antigens at a level of 1 ng/mL, with a linear range between 1 ug/mL and 10 μg/mL.
Diabetes, a metabolic disease that is currently widely prevalent in the world, is mainly caused by abnormal glucose metabolism of the organism itself and is also clinically diagnosed mainly by detecting the glucose content in the blood. Paper-based sensors with a distance-based signal readout have also been widely used for glucose determination. Allameh et al. [41] employed a cellulose paper-based sensor constructed by a carbon dioxide laser to visually detect the concentration of glucose in tear fluid. To complete the process, the first circular area should be filled with a solution containing GOx and HRP, while the detection channel should be supplemented with a solution of 3,3′,5,5′-tetramethylbenzidine (TMB) that is able to color the development. When a sample containing glucose is added to the sample area, it migrates to the first circular area via capillary action and interacts with GOx to produce hydrogen peroxide, which then reacts with the TMB on the detection channel with the help of HRP to produce a hued band related to the glucose level. Results indicated a linear response from the distance-based paper sensors when testing glucose levels from 0.1 mM to 1.2 mM, with an LOD of 0.1 mM. In addition, a paper-based device was designed by Prapaporn et al. [53], which incorporated a distance signal readout and nanocellulose filter to identify glucose levels. Through catalysis, GOx facilitates the transformation of glucose to H2O2, which then causes the silver nanoparticle to lose its purple hue and become colorless. Glucose was detectable in the interval between 2.5 mM and 30 mM, with the lowest amount that could be detected being 0.1 mM.
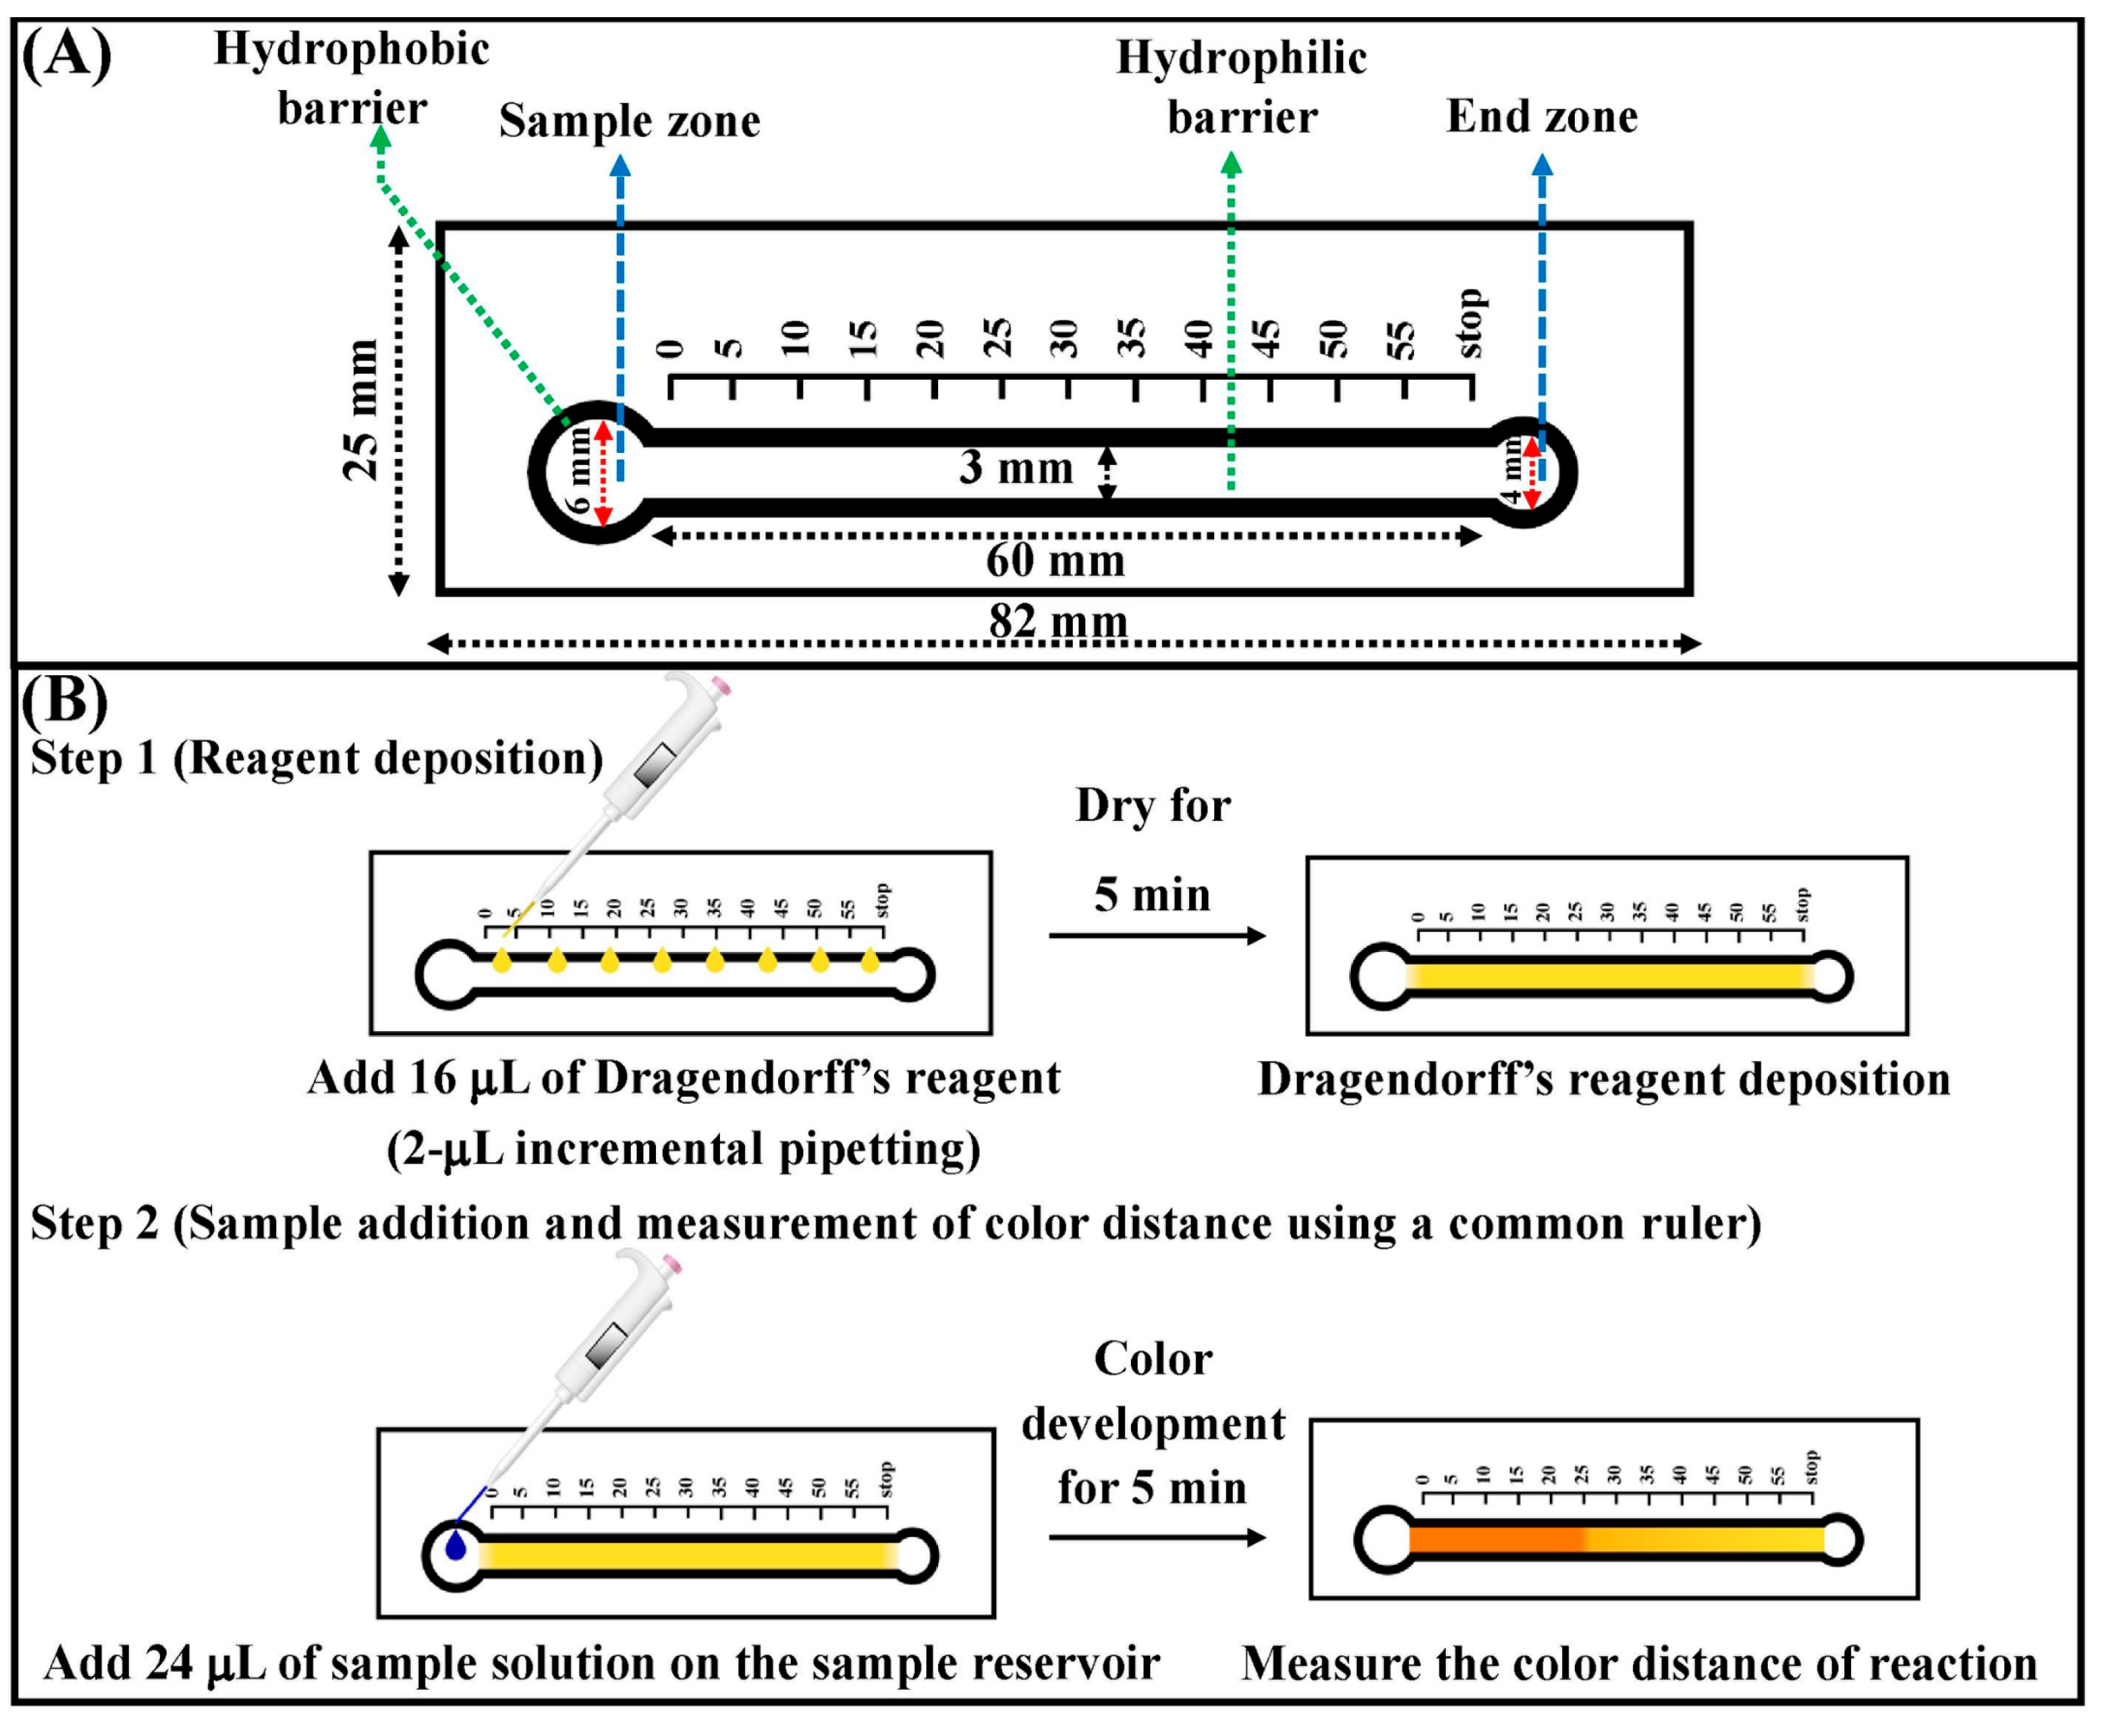
Moreover, Karamahito et al. [54] designed a filter paper device that utilized the principle of distance signal readout to quantitatively measure the amount of sibutramine present in slimming products, which could be also identified through visual assessment (Figure 5). The presence of sibutramine in a sample can be determined by the formation of an orange-red precipitate when reacted with Dragendorff’s reagent. The length of the orange-red complex was gauged with a ruler and was found to be proportional to the amount of sibutramine. Sibutramine was detectable in the interval between 0.22 mM and 0.9 mM, with the lowest amount that could be detected being 0.22 mM. Ping et al. [55] prepared a portable paper-based hydrogel sensor to recognize trypsin and its inhibitor. In this study, the gelatin hydrogel is capable of being hydrolyzed by trypsin, leading to the liberation of the water molecules that were entrapped within the hydrogel. The incorporation of a hydrogel mixture onto the surface of the pH test papers enabled the quantification of trypsin and its inhibitor aprotinin by utilizing a smartphone to measure the lateral flow distance. Finally, it is possible to detect trypsin quantitatively in the ranges from 1 × 10⁻⁶ to 1 × 10⁻³ mg/mL, with an LOD of 1.0 × 10⁻⁶ mg/mL. The measurement of the IC50 of aprotinin yielded a value of 11.07 ± 0.64 μg/mL.
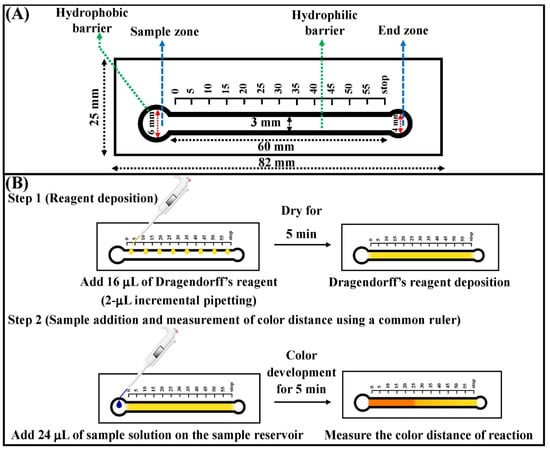
Figure 5.
(A) The size of the distance-based paper sensor. (B) Schematic of distance-based instrument-free signal readout technology for the detection of sibutramine. Reprinted with permission from Ref. [54].
3.2. Environmental Analysis
Environmental pollution has become an important threat to the construction of a green Earth. With the intensification of human activities and the development of industry, more and more pollutants are being directly released into the environment, especially the pollution of metal ions in water. Therefore, the rapid and accurate analysis of these environmental pollutants has become an increasingly important focus for scientists. The application of paper-based sensors with instrument-free signal readout technologies in environmental analysis and food safety is shown in Table 2.
Table 2.
Application of paper-based sensors with instrument-free signal readout technologies in environmental analysis and food safety.
Liu et al. [66] designed a paper-based sensor that utilizes a distance-based signal readout to detect Pb2+ (Figure 6). The incorporation of Pb2+ into the DNAzyme caused the DNA hydrogel to disintegrate, thus allowing for water molecules to be transported on the patterned paper via capillary forces. The water flow distance was correlated with the amount of Pb2+ concentration. The lowest concentration of Pb2+ that could be identified is 3.0 nM. Ninwong et al. [67] established the potential of using a fluorescent paper-based device along with an evaporative pre-concentration system for the identification of Hg2+. In this study, nitrogen-doped carbon nanotubes (NCDs) were employed to interact with Hg2+ to form Hg2+-NCDs complexes, which in turn caused the fluorescence of the NCDs to be quenched, and the level of Hg2+ can be quantified by measuring the distance signal of the quenched fluorescence. The LOD of Hg2+ was 5 μg/L by the naked eye. To facilitate the analysis of K+ and Cl−, Phoonsawat et al. [68] developed a potentiometric ion-selective electrode that incorporated distance-based colorimetric detection. In this study, the concentration range of K+ and Cl− ions that could be accurately measured were 0.1–100 mM and 0.5–50 mM, respectively, with LODs of 0.01 mM and 0.16 ± 0.05 mM. Nguyen et al. [60] also designed two kinds of paper-based devices coupled with the distance-based signal readout (“chemometer” format and radial design) for the quantitative of Al3+. The chemometer has the capacity to identify a concentration of 2.5 ppm (100 μM) and its linear range is between 2 and 54 ppm (100 μM–1 mM). Similarly, the radial device is able to recognize a concentration of 0.9 ppm (33 μM), and its linear range is between 2 and 24 ppm (100–900 μM).
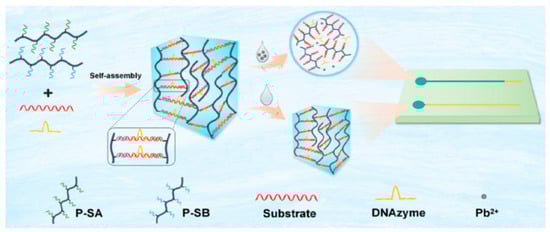
Figure 6.
Schematic of distance-based instrument-free signal readout technology for the determination of Pb2+. Reprinted with permission from Ref. [66].
3.3. Food Analysis
Food safety is a fundamental requirement for human sustenance, particularly in developing countries. Therefore, the development of a portable, economical, and user-friendly food safety testing platform is imperative. The application of paper-based sensors with instrument-free signal readout in food analysis is shown in Table 2.
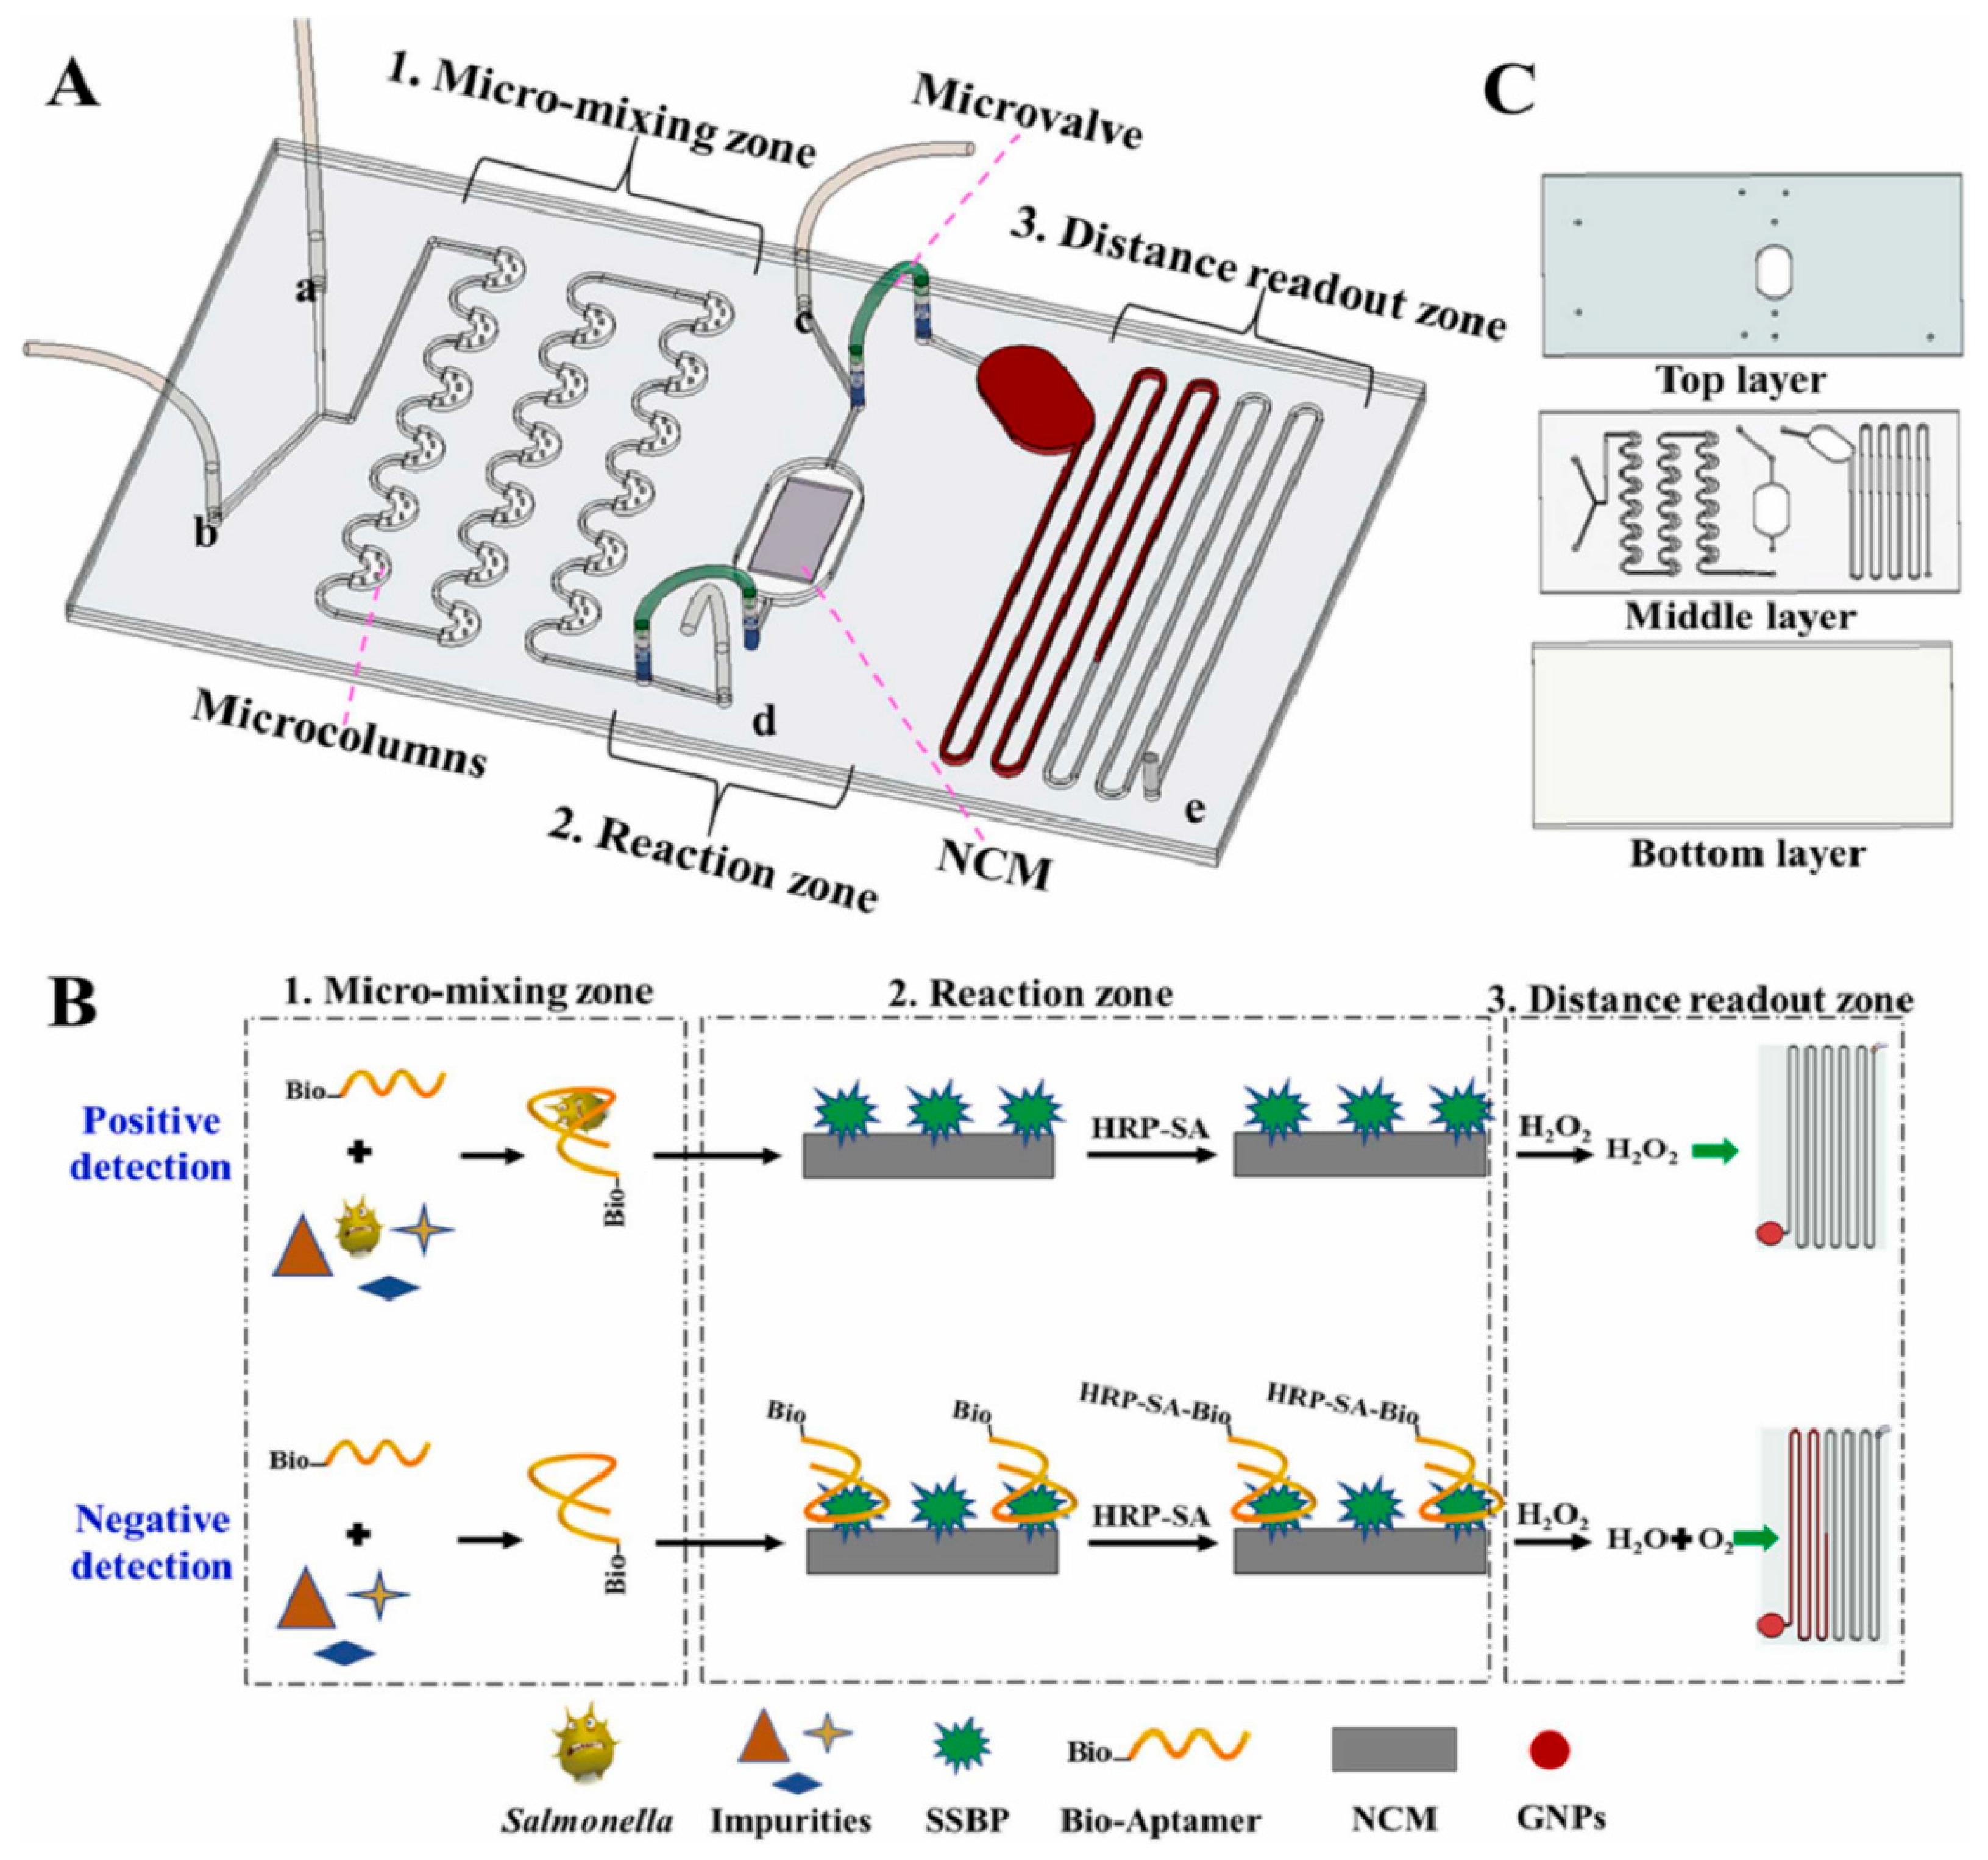
A paper-based lateral flow sensor utilizing the variation in viscosity of pectin was developed by us [61] to identify the activity of polygalacturonase in cucumber. In this study, the hydrolysis of pectin by polygalacturonase alters its viscosity, which is evaluated with the aid of a smartphone by means of the diffusion distance on the pH test papers. Finally, polygalacturonase can be quantified between 0.025 and 0.80 U/mL, with an LOQ of 0.025 U/mL. To improve the reproducibility of the deposited sample volume, Al-Jaf et al. [62] developed a paper-based sensor that utilizes a ratiometric distance-based signal readout method to detect ascorbic acid with good precision and accuracy. To enhance the detection resolution and avoid excessive mixing of reagents, a three-dimensional spacing was established between the sampling and detection zones. The mixture solution containing Fe3+ and 1,10-phenanthroline, and the oxidized 3,3′,5,5′-tetramethylbenzidine were deposited in the first and second channels, respectively. Upon the addition of ascorbic acid, the color of the first channel shifted from a pale yellow to an orange-red, while the second channel changed from a greenish blue to colorless. Finally, the concentration of ascorbic acid can be measured between 0.05 mM and 1.2 mM, with an LOQ of 16 μM. In addition, Katelakha et al. [69] proposed a paper-based analytical tool that utilizes a distance-based signal readout to recognize lead ions in food matrices. This tool functions by taking advantage of the competitive binding between lead ions and carminic acid (CA) and polyethyleneimine (PEI). When a combination of lead ions and CA is introduced into PEI-modified paper, the length of red deposits along the flow path is reduced, as the lead ions are bound by both PEI and CA competitively. Finally, the detection of lead ions was found to be linear in the range of 5 µg/mL to 100 µg/mL, with the lowest detectable amount being 12.3 µg/mL. Salmonella is a common contaminant in various food items, including meat, eggs, milk, and vegetables. Man et al. [70] introduced a distance-based microfluidic aptasensor that is portable and can be used to quantitatively detect Salmonella (Figure 7). In this study, biotin-modified aptamers (bio-aptamers) were employed as recognition elements for Salmonella typhimurium to prepare bio-aptamer single strand-binding protein-modified nitrocellulose membranes. The binding of horseradish peroxidase-conjugated streptavidin to the modified nitrocellulose membrane initiates the decomposition of H2O2, thereby releasing O2 and propelling the gold nanoparticles forward. Thus, the distance signal readout can be used to determine the minimum concentration of Salmonella, which is 3.7 × 101 cfu/mL.

Figure 7.
Schematic illustration of the principle of distance-based microfluidic aptasensor for the visual quantitative detection of Salmonella. (A) Structure and functional area distribution of a distance-based microfluidic aptasensor. (B) The detection principle of a distance-based microfluidic aptasensor. (C) The structure of the designed microfluidic chip. Reprinted with permission from Ref. [70].
3.4. Other Applications
In addition to biomedical, environmental, and food analyses, paper-based sensors with instrument-free signal readout have found utility in various other fields. For instance, Dias et al. [6] designed a paper-based sensor that was connected to a distance signal readout to observe acid-base titrations. The titrant and indicator were added to the paper and produced a visible paper channel. Then, the solution was delivered into the detection zone, where different concentrations of titrant would lead to different distances in the detection zone, thereby causing a change in the color or discoloration of the channel. Finally, this proposed paper-based sensor was utilized to evaluate the acetic acid levels of commercially available vinegars ranging from 4.3 to 4.6%. Inorganic carbon that is dissolved in water has a major influence on the balance of the carbon cycle on Earth. A paper apparatus that relies on distance signal readout was designed by Giménez-Gómez et al. [71] for the detection of dissolved inorganic carbon in freshwater. Initially, the titration reagents are introduced to the detection area, after which the sample is propelled up the whole area via capillary action, resulting in a color change of the indicator from yellow to blue. Finally, the length of the colored band can be recorded by a ruler. The developed device is able to detect DIC levels from 50 mg/L to 1000 mg/L.
4. Conclusions
In this review, we summarized some kinds of paper-based sensors with an instrument-free signal readout, including distance-based signal readout technology, counting-based signal readout technology, text-based signal readout technology, and other transduction technologies. On the other hand, the applications were also described based on these instrument-free signal readout technologies, such as biomedical analysis, environmental pollutant monitoring, and food safety analysis. However, each instrument-free signal readout technology has its own advantages and disadvantages. For example, distance-based signal readout technology has the advantage of high sensitivity, but it also has long analysis times and a narrow linear range. Count-based signal readout technology has the advantage of short analysis times, but it has low detection sensitivity and a narrow detection range. Time-based signal readout technology has the advantage of a wide detection range, but it suffers from long analysis times and low detection sensitivity. Thus, paper-based sensors with instrument-free signal readout technology still face some challenges and limitations: (1) To fulfill the requirements of more intricate, low-level, or multi-component samples, it is imperative to boost the accuracy and precision of paper-based sensors. (2) To make large-scale applications, paper-based sensors must be standardized and commercialized. Thus, it is necessary to establish unified testing standards and quality control procedures, and develop commercial products suitable for different fields. (3) The capability of paper-based sensors to perform multiple channels of operation makes them suitable for more complex analysis and detection tasks.
Additional research and development are required for paper-based sensors with an instrument-free signal readout in the future aiming to achieve the following: (1) explore new paper materials and preparation technologies to achieve higher sensitivity, selectivity, and stability; (2) paper-based sensors can be integrated with other sensor technologies, including optical, electrochemical, and multimodal analysis, to create a comprehensive sensing system; (3) automation and digitization technologies can be utilized to enhance operational convenience, repeatability, and data-processing capabilities of paper-based sensors. In summary, paper-based sensors with instrument-free signal readout have great potential in scientific research and practical applications. It is anticipated that paper-based sensors will become more accessible in the future as technological challenges are addressed and further research is conducted.
Author Contributions
Conceptualization, H.Z. and S.G.; writing—original draft preparation, D.Y. and C.H.; visualization, D.Y. and C.H.; writing—review and editing, H.Z. and S.G.; supervision, H.Z. and S.G.; project administration, H.Z. and S.G.; funding acquisition, H.Z. and D.Y. All authors have read and agreed to the published version of the manuscript.
Funding
This research was funded by the Chongqing Postdoctoral Science Foundation, China, grant number CSTB2022NSCQ-BHX0687, Chongqing Medical Scientific Research Project (joint project of Chongqing Health Commission and Science and Technology Bureau), China, grant number 2023MSXM006, Chongqing Shapingba Medical Scientific Research Project (joint project of Chongqing Shapingba Health Commission and Science and Technology Bureau), China, grant number 2023SQKWLH037, the Chongqing Medical and Pharmaceutical College, China, grant number ygz2023117, and the Chongqing Medical and Pharmaceutical College, China, grant number ygzrc2023102.
Institutional Review Board Statement
Not applicable.
Informed Consent Statement
Not applicable.
Data Availability Statement
Not applicable.
Conflicts of Interest
The authors declare no conflicts of interest.
References
- Martinez, A.W.; Phillips, S.T.; Butte, M.J.; Whitesides, G.M. Patterned paper as a platform for inexpensive, low-volume, portable bioassays. Angew. Chem. Int. Edit. 2007, 46, 1318–1320. [Google Scholar] [CrossRef] [PubMed]
- Tavakoli, H.; Hirth, E.; Luo, M.; Timilsina, S.S.; Dou, M.; Dominguez, D.C.; Li, X.J. A microfluidic fully paper-based analytical device integrated with loop-mediated isothermal amplification and nano-biosensors for rapid, sensitive, and specific quantitative detection of infectious diseases. Lab Chip 2022, 22, 4693–4704. [Google Scholar] [CrossRef] [PubMed]
- Larpant, N.; Niamsi, W.; Noiphung, J.; Chanakiat, W.; Sakuldamrongpanich, T.; Kittichai, V.; Tongloy, T.; Tongloy, S.; Boonsang, S.; Laiwattanapaisal, W. Simultaneous phenotyping of five Rh red blood cell antigens on a paper-based analytical device combined with deep learning for rapid and accurate interpretation. Anal. Chim. Acta 2022, 1207, 339807. [Google Scholar] [CrossRef] [PubMed]
- Cioffi, A.; Mancini, M.; Gioia, V.; Cinti, S. Office paper-based electrochemical strips for organophosphorus pesticide monitoring in agricultural soil. Environ. Sci. Technol. 2021, 55, 8859–8865. [Google Scholar] [CrossRef]
- Sharifi, H.; Tashkhourian, J.; Hemmateenejad, B. A 3D origami paper-based analytical device combined with PVC membrane for colorimetric assay of heavy metal ions: Application to determination of Cu(II) in water samples. Anal. Chim. Acta 2020, 1126, 114–123. [Google Scholar] [CrossRef] [PubMed]
- Fahimi-Kashani, N.; Hormozi-Nezhad, M.R. A smart-phone based ratiometric nanoprobe for label-free detection of methyl parathion. Sens. Actuator B Chem. 2020, 322, 128580. [Google Scholar] [CrossRef]
- Dias, L.G.A.; Duarte, L.C.; Pinheiro, K.M.P.; Moreira, N.S.; Coltro, W.K.T. Distance-based paper microfluidics as environmentally friendly platforms for monitoring acid-base titrations. Talanta Open 2023, 7, 100216. [Google Scholar] [CrossRef]
- He, T.; Li, J.W.; Liu, L.S.; Ge, S.G.; Yan, M.; Liu, H.Y.; Yu, J.H. Origami-based “Book” shaped three-dimensional electrochemical paper microdevice for sample-to-answer detection of pathogens. RSC Adv. 2020, 10, 25808–25816. [Google Scholar] [CrossRef]
- Zhu, Y.; Tong, X.; Wei, Q.; Cai, G.; Cao, Y.; Tong, C.; Shi, S.Y.; Wang, F. 3D origami paper-based ratiometric fluorescent microfluidic device for visual point-of-care detection of alkaline phosphatase and butyrylcholinesterase. Biosens. Bioelectron. 2022, 196, 113691. [Google Scholar] [CrossRef]
- Yahyai, I.A.; Al-Lawati, H.A.J.; Hassanzadeh, J. Carbon dots-modified paper-based chemiluminescence device for rapid determination of mercury (II) in cosmetics. Luminescence 2022, 37, 1087–1097. [Google Scholar] [CrossRef]
- Wang, F.F.; Liu, Y.Q.; Fu, C.P.; Li, N.; Du, M.; Zhang, L.; Ge, S.G.; Yu, J.H. Paper-based bipolar electrode electrochemiluminescence platform for detection of multiple miRNAs. Anal. Chem. 2021, 93, 1702–1708. [Google Scholar] [CrossRef] [PubMed]
- Jiao, Y.C.; Du, C.; Zong, L.J.; Guo, X.Y.; Han, Y.F.; Zhang, X.P.; Li, L.; Zhang, C.W.; Ju, Q.; Liu, J.H.; et al. 3D vertical-flow paper-based device for simultaneous detection of multiple cancer biomarkers by fluorescent immunoassay. Sens. Actuators B Chem. 2020, 306, 127239. [Google Scholar] [CrossRef]
- Khachornsakkul, K.; Chang, J.J.; Lin, P.H.; Lin, Y.H.; Dungchai, W.; Chen, C.H. Highly sensitive distance-based liquid crystalline visualization for paper-based analytical devices. Anal. Chim. Acta 2021, 1154, 338328. [Google Scholar] [CrossRef]
- Lee, K.W.; Yu, Y.C.; Chun, H.J.; Jang, Y.H.; Han, Y.D.; Yoon, H.C. Instrumentation-free semiquantitative immunoanalysis using a specially patterned lateral flow assay device. Biosensors 2020, 10, 87. [Google Scholar] [CrossRef] [PubMed]
- Hofmann, E.R.; Davidson, C.; Chen, H.; Zacharko, M.; Dorton, J.E.; Kilper, G.K.; Graves, C.; Miklos, A.E.; Rhea, K.; Ma, J.; et al. Blind spot: A braille patterned novel multiplex lateral flow immunoassay sensor array for the detection of biothreat agents. ACS Omega 2021, 6, 22700–22708. [Google Scholar] [CrossRef] [PubMed]
- Wu, T.X.; Li, X.Y. An instrument-free visual quantitative detection method based on clock reaction: The detection of thrombin as an example. Anal. Methods 2023, 15, 48–55. [Google Scholar] [CrossRef]
- Alsaeed, B.; Mansour, F.R. Distance-based paper microfluidics; principle, technical aspects and applications. Microchem. J. 2020, 155, 104664. [Google Scholar] [CrossRef]
- Khan, M.; Zhao, B.L.; Wu, W.L.; Zhao, M.; Bi, Y.H.; Hu, Q.Z. Distance-based microfluidic assays for instrument-free visual point-of-care testing. TRAC-Trend Anal. Chem. 2023, 162, 117029. [Google Scholar] [CrossRef]
- Li, Z.D.; You, M.L.; Bai, Y.M.; Gong, Y.; Xu, F. Equipment-free quantitative readout in paper-based point-of-care testing. Small Methods 2019, 4, 1900459. [Google Scholar] [CrossRef]
- Cate, D.M.; Dungchai, W.; Cunningham, J.C.; Volckens, J.; Henry, C.S. Simple, distance-based measurement for paper analytical devices. Lab Chip 2013, 13, 2397–2404. [Google Scholar] [CrossRef] [PubMed]
- Ogawa, M.; Katoh, A.; Matsubara, R.; Kondo, H.; Otsuka, M.; Sawatsubashi, T.; Hiruta, Y.; Citterio, D. Semi-quantitative microfluidic paper-based analytical device for ionic silica detection. Anal. Sci. 2023, 39, 1361–1370. [Google Scholar] [CrossRef] [PubMed]
- Phoonsawat, K.; Dungchai, W. Highly sensitive, selective and naked-eye detection of bromide and bromate using distance-based paper analytical device. Talanta 2021, 221, 121590. [Google Scholar] [CrossRef] [PubMed]
- Zhang, H.; Yang, F.Q. Instrument-free quantitative determination of urea based on paper-based sensor via urease-mediated chitosan viscosity change. Enzym. Microb. Technol. 2021, 148, 109830. [Google Scholar] [CrossRef]
- Zhang, H.; Li, X.Z.; Qian, Z.M.; Wang, S.P.; Yang, F.Q. Glucose oxidase-mediated sodium alginate gelation: Instrument-Free detection of glucose in fruit samples. Enzym. Microb. Technol. 2021, 148, 109805. [Google Scholar] [CrossRef]
- Shou, W.; Yang, S.T.; Wang, Y.L.; Qiu, B.; Lin, Z.Y.; Guo, L.H. Agarose hydrogel doped with gold nanobipyramids (AuNBPs@AG) as colorful height readout device for sensing hydrogen peroxide in complex sample matrix. Sens. Actuators B Chem. 2021, 344, 130059. [Google Scholar] [CrossRef]
- Lewis, G.G.; DiTucci, M.J.; Phillips, S.T. Quantifying analytes in paper-based microfluidic devices without using external electronic readers. Angew. Chem. Int. Edit. 2012, 51, 12707–12710. [Google Scholar] [CrossRef] [PubMed]
- Khachornsakkul, K.; Phuengkasem, D.; Palkuntod, K.; Sangkharoek, W.; Jamjumrus, O.; Dungchai, W. A simple counting-based measurement for paper analytical devices and their application. ACS Sens. 2022, 7, 2093–2101. [Google Scholar] [CrossRef] [PubMed]
- Mahmud, M.A.; Blondeel, E.J.M.; MacDonald, B.D. Counting-based microfluidic paper-based devices capable of analyzing submicroliter sample volumes. Biomicrofluidics 2020, 14, 014107. [Google Scholar] [CrossRef]
- Yamada, K.; Suzuki, K.; Citterio, D. Text-displaying colorimetric paper-based analytical device. ACS Sens. 2017, 2, 1247–1254. [Google Scholar] [CrossRef]
- Chauhan, A.; Toley, B.J. Barrier-free microfluidic paper analytical devices for multiplex colorimetric detection of analytes. Anal. Chem. 2021, 93, 8954–8961. [Google Scholar] [CrossRef]
- Liu, Y.; Cui, K.; Kong, Q.K.; Zhang, L.; Ge, S.G.; Yu, J.H. A self-powered origami paper analytical device with a pop-up structure for dual-mode electrochemical sensing of ATP assisted by glucose oxidase-triggered reaction. Biosens. Bioelectron. 2020, 148, 111839. [Google Scholar] [CrossRef] [PubMed]
- Li, Y.S.; Men, X.J.; Gao, G.W.; Tian, Y.; Wen, Y.Q.; Zhang, X.J. A distance-based capillary biosensor using wettability alteration. Lab Chip 2021, 21, 719–724. [Google Scholar] [CrossRef]
- Han, C.L.; Yuan, X.K.; Shen, Z.H.; Xiao, Y.X.; Wang, X.W.; Khan, M.; Liu, S.H.; Li, W.; Hu, Q.Z.; Wu, W.L. A paper-based lateral flow sensor for the detection of thrombin and its inhibitors. Anal. Chim. Acta 2022, 1205, 339756. [Google Scholar] [CrossRef]
- Modha, S.; Castro, C.; Tsutsui, H. Recent developments in flow modeling and fluid control for paper-based microfluidic biosensors. Biosens. Bioelectron. 2021, 178, 113026. [Google Scholar] [CrossRef] [PubMed]
- Carneiro, M.C.C.G.; Rodrigues, L.R.; Moreira, F.T.C.; Sales, M.G.F. Colorimetric paper-based sensors against cancer biomarkers. Sensors 2022, 22, 3221. [Google Scholar] [CrossRef] [PubMed]
- Chen, C.; Zhao, L.; Zhang, H.; Shen, X.S.; Zhu, Y.G.; Chen, H.Y. Novel wax valves to improve distance-based analyte detection in paper microfluidics. Anal. Chem. 2019, 91, 5169–5175. [Google Scholar] [CrossRef]
- Noviana, E.; Ozer, T.; Carrell, C.S.; Link, J.S.; McMahon, C.; Jang, I.; Henry, C.S. Microfluidic paper-based analytical devices: From design to applications. Chem. Rev. 2021, 121, 11835–11885. [Google Scholar] [CrossRef]
- Musa, A.M.; Kiely, J.; Luxton, R.; Honeychurch, K.C. Recent progress in screen-printed electrochemical sensors and biosensors for the detection of estrogens. TrAC Trends Anal. Chem. 2021, 139, 116254. [Google Scholar] [CrossRef]
- Chen, Y.J.; Zhang, L.; Huang, J.K.; Deng, Z.H.; Yuan, Y.L.; Zou, J.M.; Nie, J.F.; Zhang, Y. Enhanced functional DNA biosensor for distance-based read-by-eye quantification of various analytes based on starch-hydrolysis-adjusted wettability change in paper devices. RSC Adv. 2020, 10, 28121–28127. [Google Scholar] [CrossRef]
- Qian, C.G.; Li, J.S.; Pang, Z.; Xie, H.; Wan, C.; Li, S.J.; Wang, X.; Xiao, Y.J.; Feng, X.J.; Li, Y.W.; et al. Hand-powered centrifugal micropipette-tip with distance-based quantification for on-site testing of SARS-CoV-2 virus. Talanta 2023, 258, 124466. [Google Scholar] [CrossRef]
- Allameh, S.; Rabbani, M. A distance-based microfluidic paper-based biosensor for glucose measurements in tear range. Appl. Biochem. Biotechnol. 2022, 194, 2077–2092. [Google Scholar] [CrossRef] [PubMed]
- Liu, J.; Li, M.; Man, Q.; Huang, L.; Wang, J.; Gao, M.; Zhang, X. Naked-eye readout distance quantitative lateral flow assay based on the permeability changes of enzyme-catalyzed hydrogelation. Anal. Chem. 2023, 95, 8011–8019. [Google Scholar] [CrossRef]
- Khachornsakkul, K.; Dungchai, W.; Pamme, N. Distance-based all-in-one immunodevice for point-of-care monitoring of cytokine interleukin-6. ACS Sens. 2022, 7, 2410–2419. [Google Scholar] [CrossRef] [PubMed]
- Hiraoka, R.; Kuwahara, K.; Wen, Y.C.; Yen, T.H.; Hiruta, Y.; Cheng, C.M.; Citterio, D. Paper-based device for naked eye urinary albumin/creatinine ratio evaluation. ACS Sens. 2020, 5, 1110–1118. [Google Scholar] [CrossRef] [PubMed]
- Rypar, T.; Adam, V.; Vaculovicova, M.; Macka, M. Paperfluidic devices with a selective molecularly imprinted polymer surface for instrumentation-free distance-based detection of protein biomarkers. Sens. Actuators B Chem. 2021, 341, 129999. [Google Scholar] [CrossRef]
- Feng, L.X.; Tang, C.; Han, X.X.; Zhang, H.C.; Guo, F.N.; Yang, T.; Wang, J.H. Simultaneous and sensitive detection of multiple small biological molecules by microfluidic paper-based analytical device integrated with zinc oxide nanorods. Talanta 2021, 232, 122499. [Google Scholar] [CrossRef]
- Abdulsattar, J.O.; Hadi, H.; Richardson, S.; Iles, A.; Pamme, N. Detection of doxycycline hyclate and oxymetazoline hydrochloride in pharmaceutical preparations via spectrophotometry and microfluidic paper-based analytical device (μPADs). Anal. Chim. Acta 2020, 1136, 196–204. [Google Scholar] [CrossRef]
- Phoonsawat, K.; Khachornsakkul, K.; Ratnarathorn, N.; Henry, C.S.; Dungchai, W. Distance-based paper device for a naked-eye albumin-to-alkaline phosphatase ratio assay. ACS Sens. 2021, 6, 3047–3055. [Google Scholar] [CrossRef]
- Xu, C.X.; Zhou, G.X.; Cai, H.H.; Chen, Y.C.; Huang, L.; Cai, L.H.; Gong, J.Y.; Yan, Z.K. Modification of microfluidic paper-based devices with an oxidant layer for distance readout of reducing substances. ACS Omega 2022, 7, 20383–20389. [Google Scholar] [CrossRef]
- Huang, Z.R.; Zhou, S.Q.; Wang, X.Y.; Liang, T.; Liu, X.; Wang, P.; Wan, H. Enzyme-based color bar-style lateral flow strip for equipment-free and semi-quantitative determination of urinary oxalate. Sens. Actuators B Chem. 2023, 385, 133699. [Google Scholar] [CrossRef]
- Zhang, D.G.; Wu, C.; Luan, C.X.; Gao, P.; Wang, H.; Chi, J.J.; Kong, T.T. Distance-based quantification of miRNA-21 by the coffee-ring effect using paper devices. Microchim. Acta 2020, 187, 513. [Google Scholar] [CrossRef] [PubMed]
- Tai, W.J.; Yin, F.C.; Bi, Y.H.; Lin, J.M.; Zhang, Q.; Wei, Y.; Hu, Q.Z.; Yu, L. Paper-based sensors for visual detection of alkaline phosphatase and alpha-fetoprotein via the distance readout. Sens. Actuators B Chem. 2023, 384, 133666. [Google Scholar] [CrossRef]
- Prapaporn, S.; Arisara, S.; Wunpen, C.; Wijitar, D. Nanocellulose films to improve the performance of distance-based glucose detection in paper-based microfluidic sevices. Anal. Sci. 2020, 36, 1447–1451. [Google Scholar] [CrossRef] [PubMed]
- Karamahito, P.; Sitanurak, J.; Nacapricha, D.; Wilairat, P.; Chaisiwamongkhol, K.; Phonchai, A. Paper device for distance-based visual quantification of sibutramine adulteration in slimming products. Microchem. J. 2021, 162, 105784. [Google Scholar] [CrossRef]
- Ping, J.T.; Wu, W.L.; Qi, L.B.; Liu, J.; Liu, J.P.; Zhao, B.L.; Wang, Q.B.; Yu, L.; Lin, J.M.; Hu, Q.Z. Hydrogel-assisted paper-based lateral flow sensor for the detection of trypsin in human serum. Biosens. Bioelectron. 2021, 192, 113548. [Google Scholar] [CrossRef]
- Cai, L.F.; Ouyang, Z.; Song, J.H.; Yang, L.Y. Indicator-free argentometric titration for distance-based detection of chloride using microfluidic paper-based analytical devices. ACS Omega 2020, 5, 18935–18940. [Google Scholar] [CrossRef]
- Ma, Z.; Liu, J.; Sallach, J.B.; Hu, X.J.; Gao, Y.Z. Whole-cell paper strip biosensors to semi-quantify tetracycline antibiotics in environmental matrices. Biosens. Bioelectron. 2020, 168, 112528. [Google Scholar] [CrossRef]
- Wang, G.; Li, J.; Wu, S.; Jiang, T.; Chen, T.H. A fully integrated, ready-to-use distance-based chemosensor for visual quantification of multiple heavy metal ions. Anal. Chem. 2022, 94, 15925–15929. [Google Scholar] [CrossRef]
- Wang, J.; Yang, T.; Li, Z.; Zhou, K.; Xiao, B.; Yu, P. Semi-quantitative analysis of nickel: Counting-based μPADs built via hand drawing and yellow oily double-sided adhesive tape. RSC Adv. 2022, 12, 30457–30465. [Google Scholar] [CrossRef]
- Nguyen, M.P.; Kelly, S.P.; Wydallis, J.B.; Henry, C.S. Read-by-eye quantification of aluminum (III) in distance-based microfluidic paper-based analytical devices. Anal. Chim. Acta 2020, 1100, 156–162. [Google Scholar] [CrossRef]
- Zhang, H.; Yang, F.Q. A paper-based lateral flow strip assay based on enzyme-mediated pectin viscosity change for the determination of polygalacturonase activity. Microchem. J. 2023, 186, 108322. [Google Scholar] [CrossRef]
- Al-Jaf, S.H.; Omer, K.M. Accuracy improvement via novel ratiometry design in distance-based microfluidic paper based analytical device: Instrument-free point of care testing. RSC Adv. 2023, 13, 15704–15713. [Google Scholar] [CrossRef] [PubMed]
- Kaewchuay, N.; Jantra, J.; Khettalat, C.; Ketnok, S.; Peungpra, N.; Teepoo, S. On-site microfluidic paper-based titration device for rapid semi-quantitative vitamin C content in beverages. Microchem. J. 2021, 164, 106054. [Google Scholar] [CrossRef]
- Sousa, A.C.R.; Makara, C.N.; Brazaca, L.C.; Carrilho, E. A colorimetric microfluidic paper-based analytical device for sulfonamides in cow milk using enzymatic inhibition. Food Chem. 2021, 356, 129692. [Google Scholar] [CrossRef] [PubMed]
- Promchat, A.; Praneenararat, T.; Jiamvijitkul, P.; Senpradit, Y.; Sukwattanasinitt, M. Paper-based fluorescent sensors from quinoline ligands for distance-based quantification of Zn2+. Sens. Actuators B Chem. 2023, 396, 134522. [Google Scholar] [CrossRef]
- Liu, J.P.; Bi, Y.H.; Tai, W.J.; Wei, Y.; Zhang, Q.; Liu, A.N.; Hu, Q.Z.; Yu, L. The development of a paper-based distance sensor for the detection of Pb2+ assisted with the target-responsive DNA hydrogel. Talanta 2023, 257, 124344. [Google Scholar] [CrossRef]
- Ninwong, B.; Sangkaew, P.; Hapa, P.; Ratnarathorn, N.; Menger, R.F.; Henry, C.S.; Dungchai, W. Sensitive distance-based paper-based quantification of mercury ions using carbon nanodots and heating-based preconcentration. RSC Adv. 2020, 10, 9884–9893. [Google Scholar] [CrossRef]
- Phoonsawat, K.; Agir, I.; Dungchai, W.; Ozer, T.; Henry, C.S. A smartphone-assisted hybrid sensor for simultaneous potentiometric and distance-based detection of electrolytes. Anal. Chim. Acta 2022, 1226, 340245. [Google Scholar] [CrossRef]
- Katelakha, K.; Nopponpunth, V.; Boonlue, W.; Laiwattanapaisal, W. A simple distance paper-based analytical device for the screening of lead in food matrices. Biosensors 2021, 11, 90. [Google Scholar] [CrossRef]
- Man, Y.; Ban, M.J.; Jin, X.X.; Li, A.; Tao, J.; Pan, L.G. An integrated distance-based microfluidic aptasensor for visual quantitative detection of Salmonella with sample-in-answer-out capability. Sens. Actuators B Chem. 2023, 381, 133480. [Google Scholar] [CrossRef]
- Giménez-Gómez, P.; Hättestrand, I.; Sjöberg, S.; Dupraz, C.; Richardson, S.; Pamme, N. Distance-based paper analytical device for the determination of dissolved inorganic carbon concentration in freshwater. Sens. Actuators B Chem. 2023, 385, 133694. [Google Scholar] [CrossRef]


Disclaimer/Publisher’s Note: The statements, opinions and data contained in all publications are solely those of the individual author(s) and contributor(s) and not of MDPI and/or the editor(s). MDPI and/or the editor(s) disclaim responsibility for any injury to people or property resulting from any ideas, methods, instructions or products referred to in the content. |
© 2024 by the authors. Licensee MDPI, Basel, Switzerland. This article is an open access article distributed under the terms and conditions of the Creative Commons Attribution (CC BY) license (https://creativecommons.org/licenses/by/4.0/).