A Novel Microfluidic Strategy for Efficient Exosome Separation via Thermally Oxidized Non-Uniform Deterministic Lateral Displacement (DLD) Arrays and Dielectrophoresis (DEP) Synergy

 , ,
, ,  , and
, and 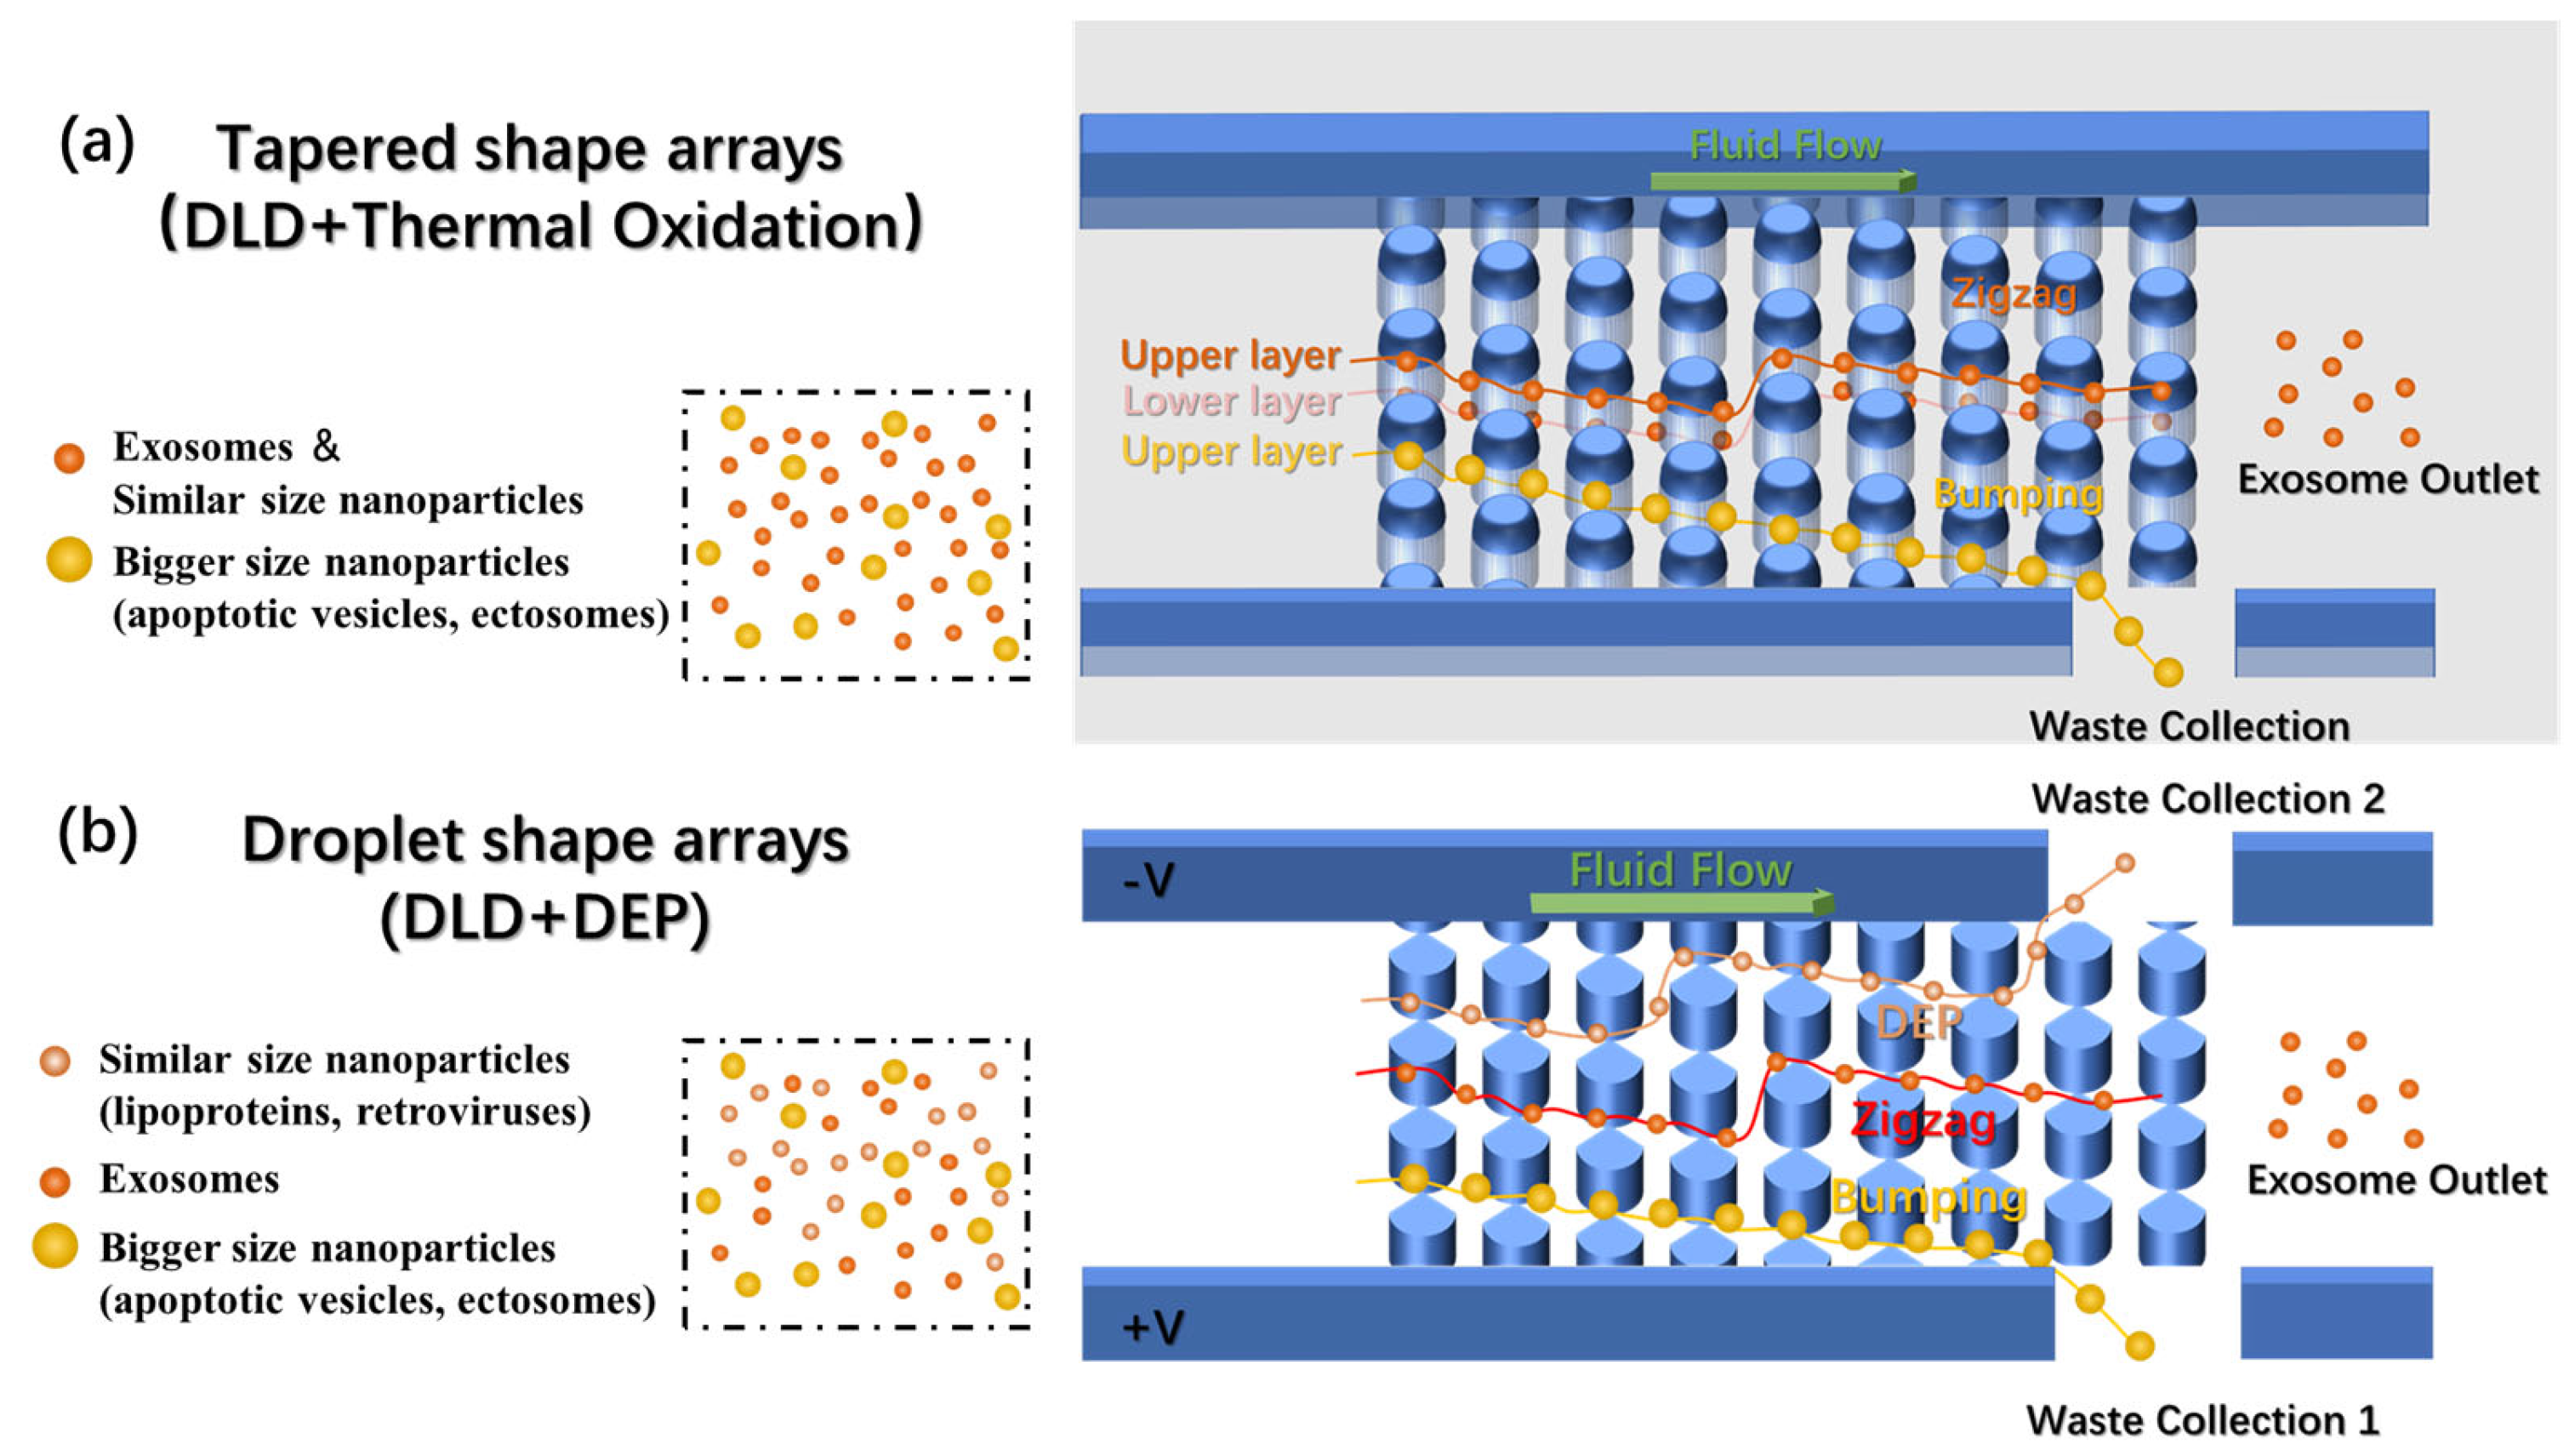
Abstract
:1. Introduction
2. Materials and Methods
2.1. Theory
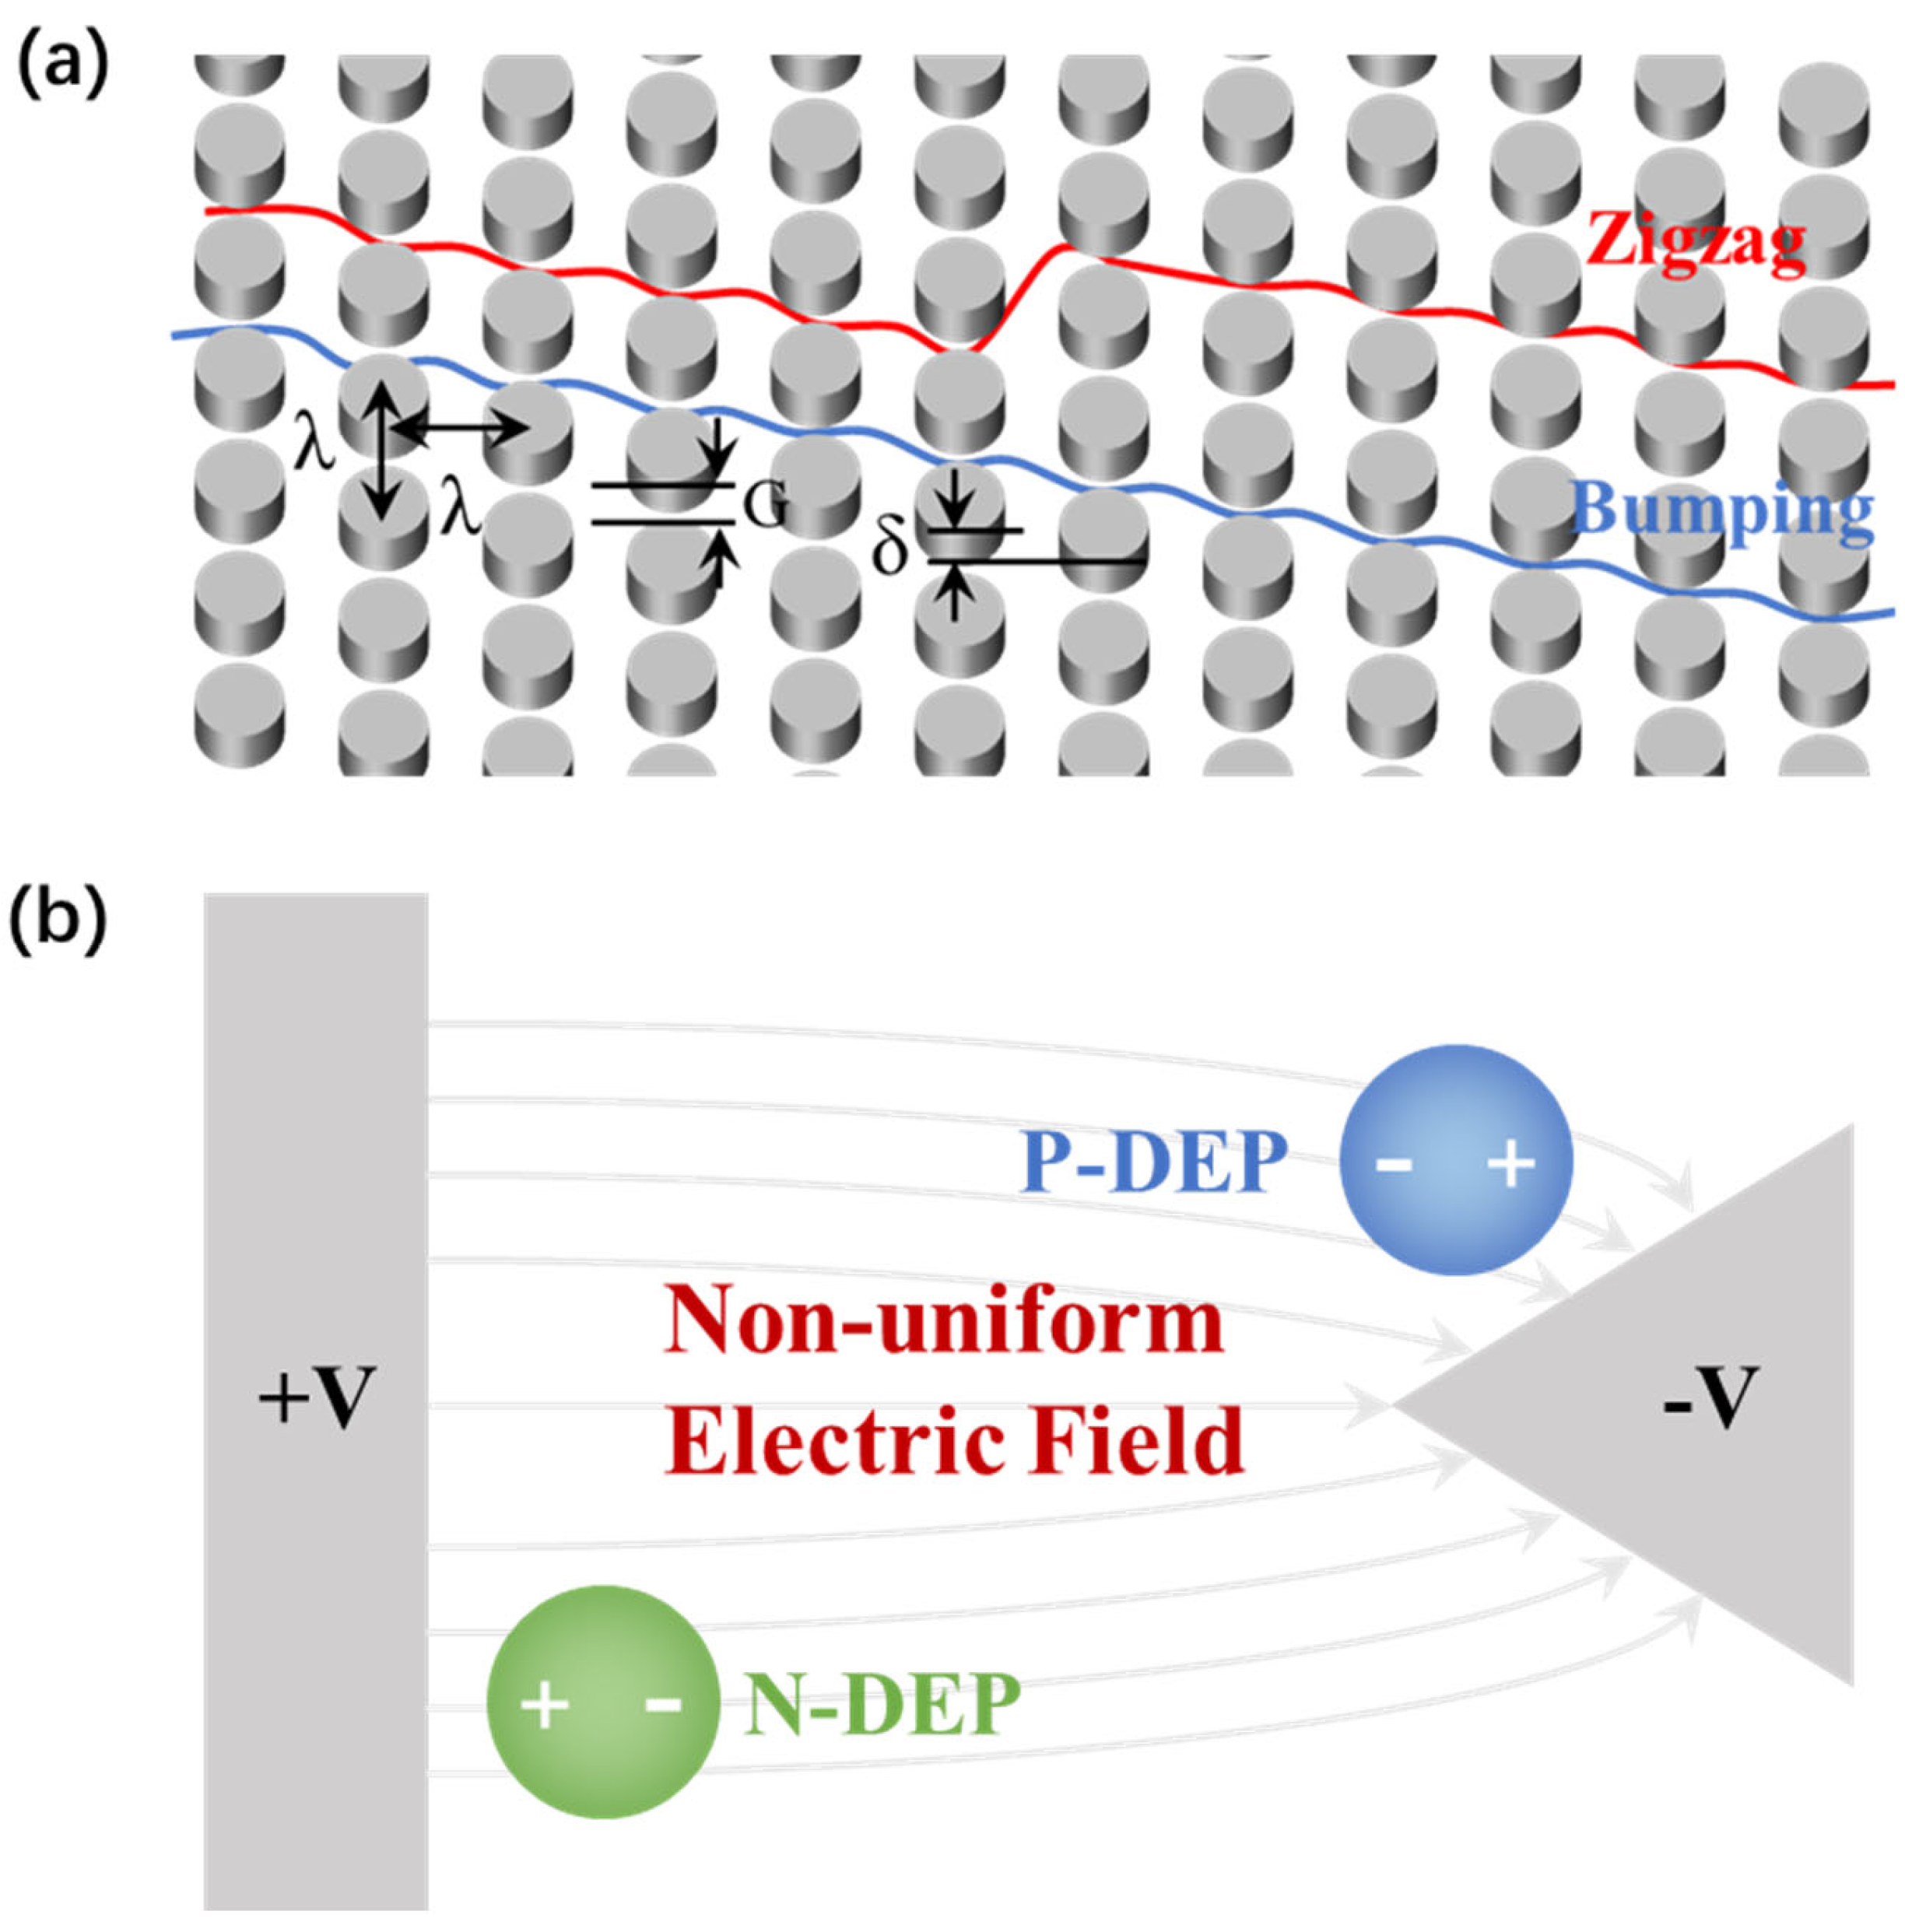
2.1.1. DLD
2.1.2. DEP
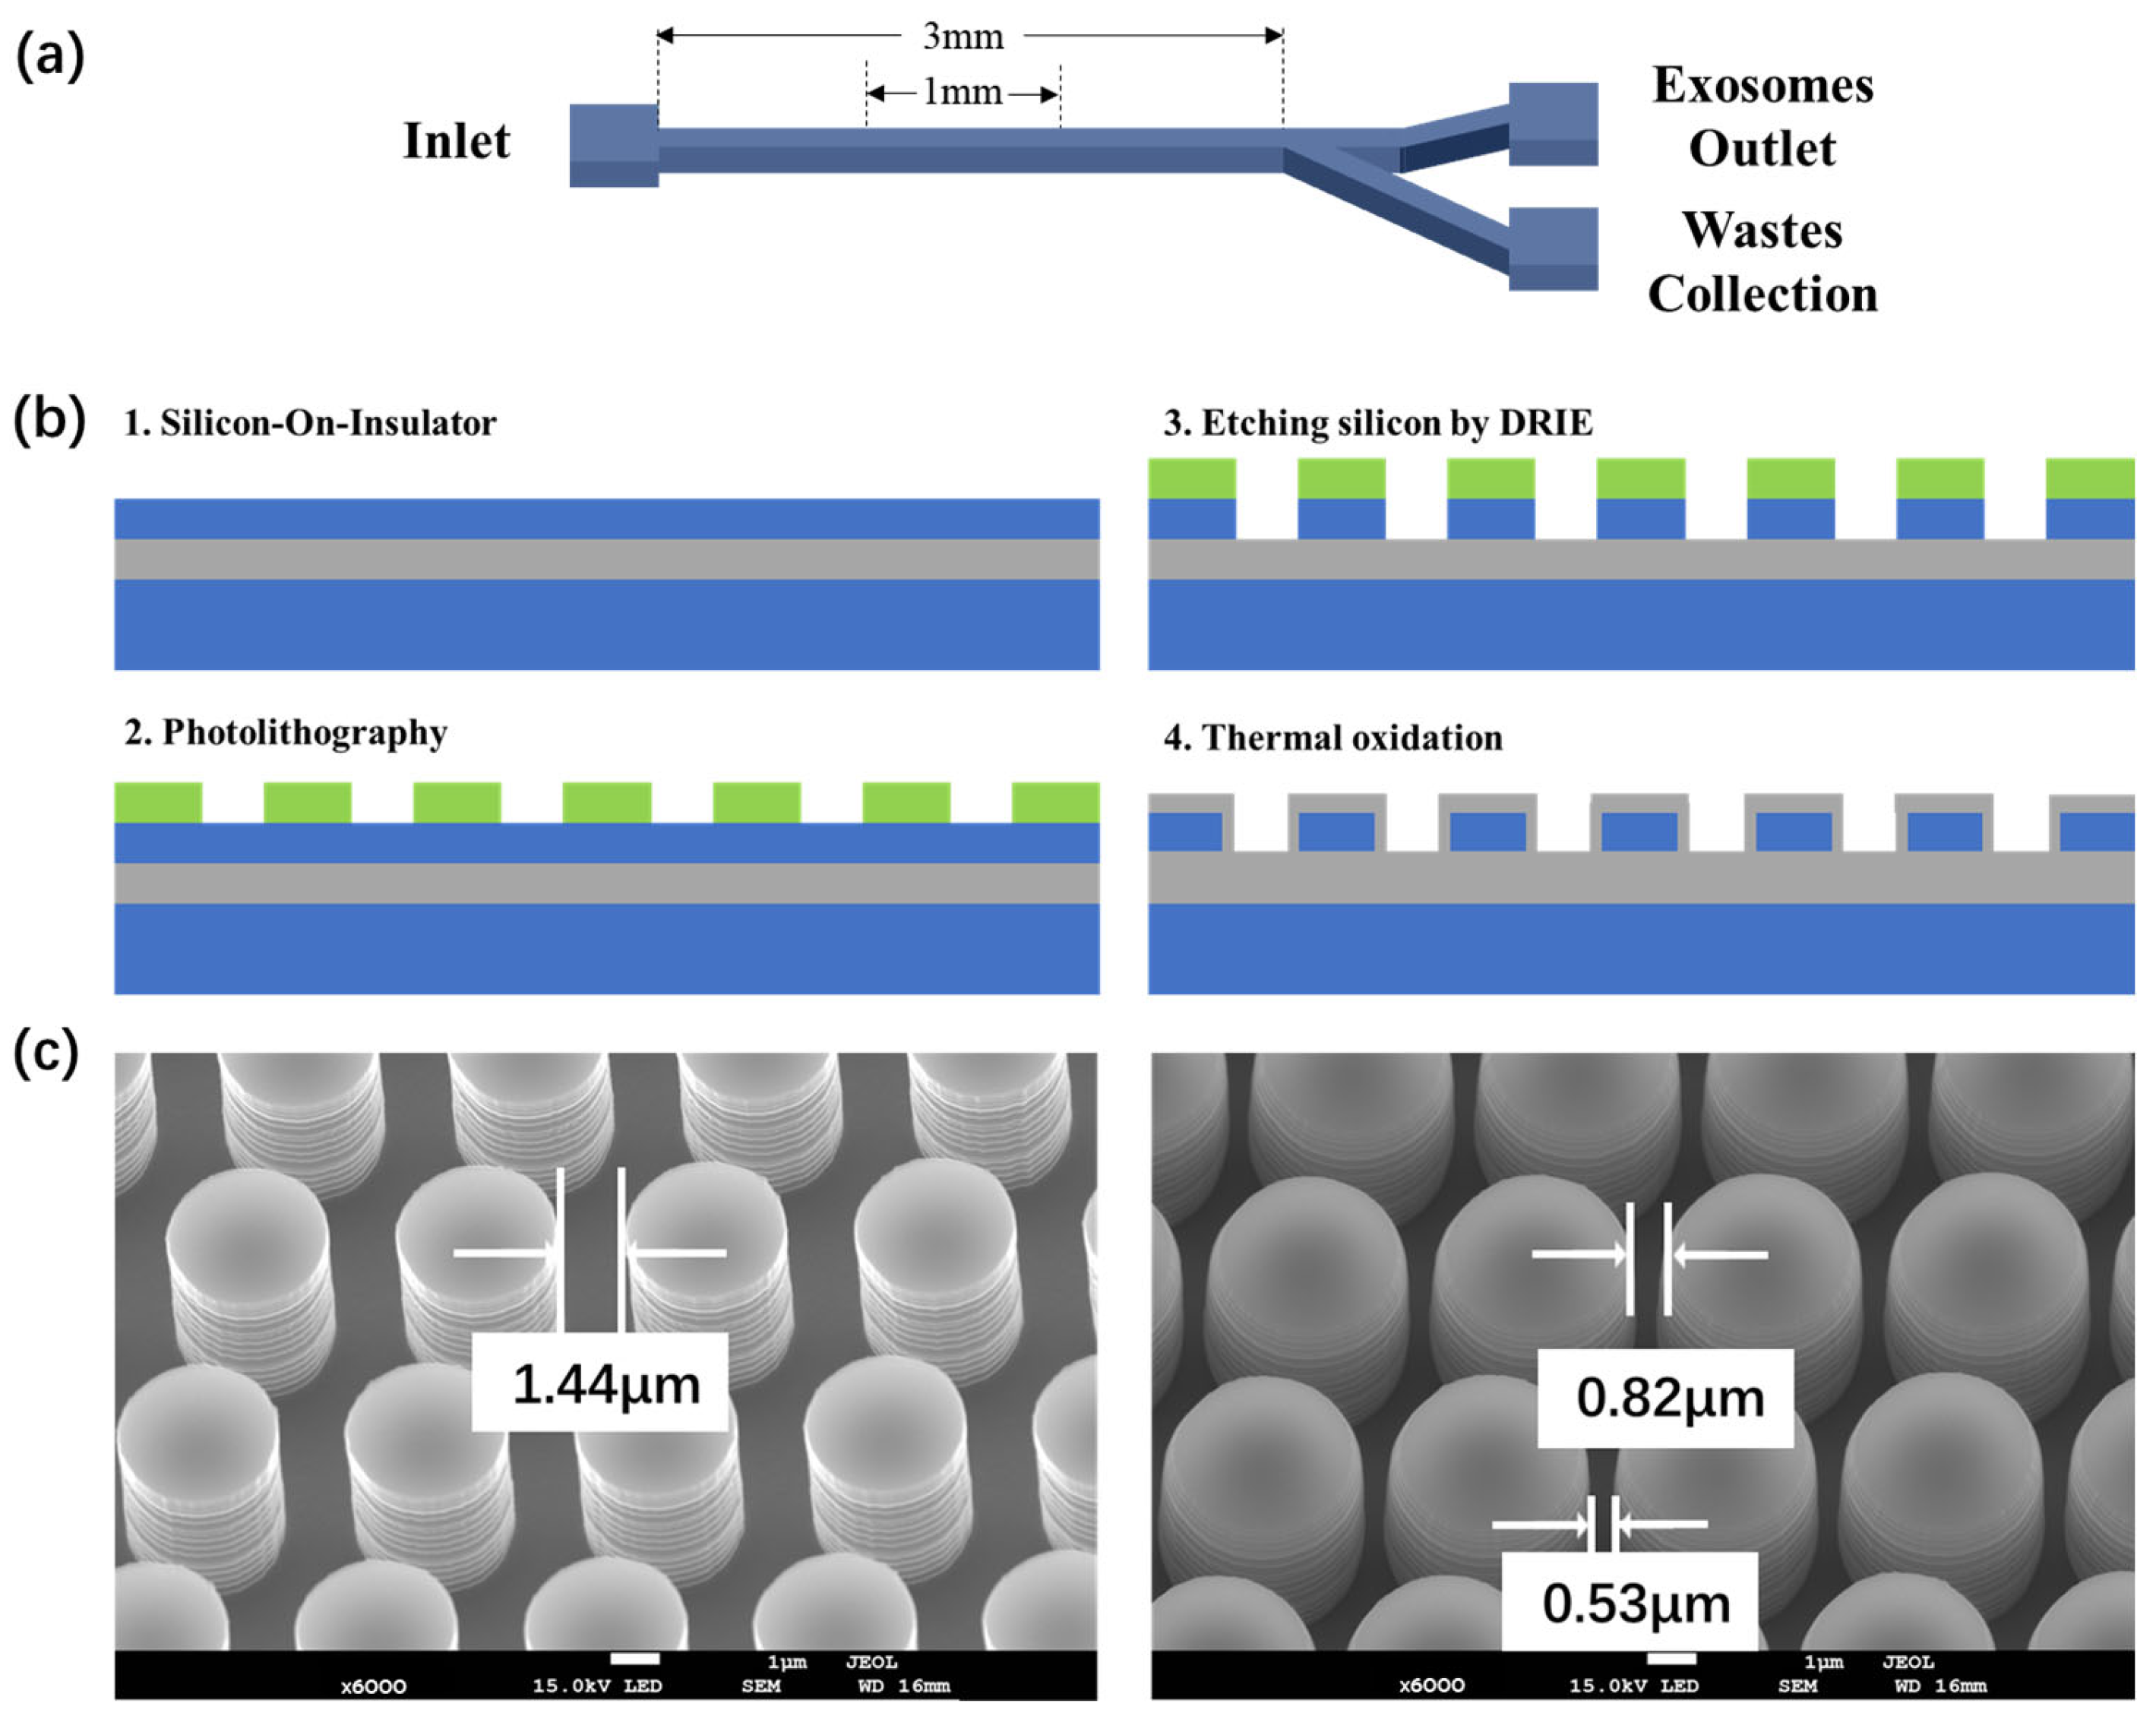
2.2. DLD Array Fabrication Process
2.3. Soft Lithography and PDMS Preparation
2.4. Particle Sample Preparation
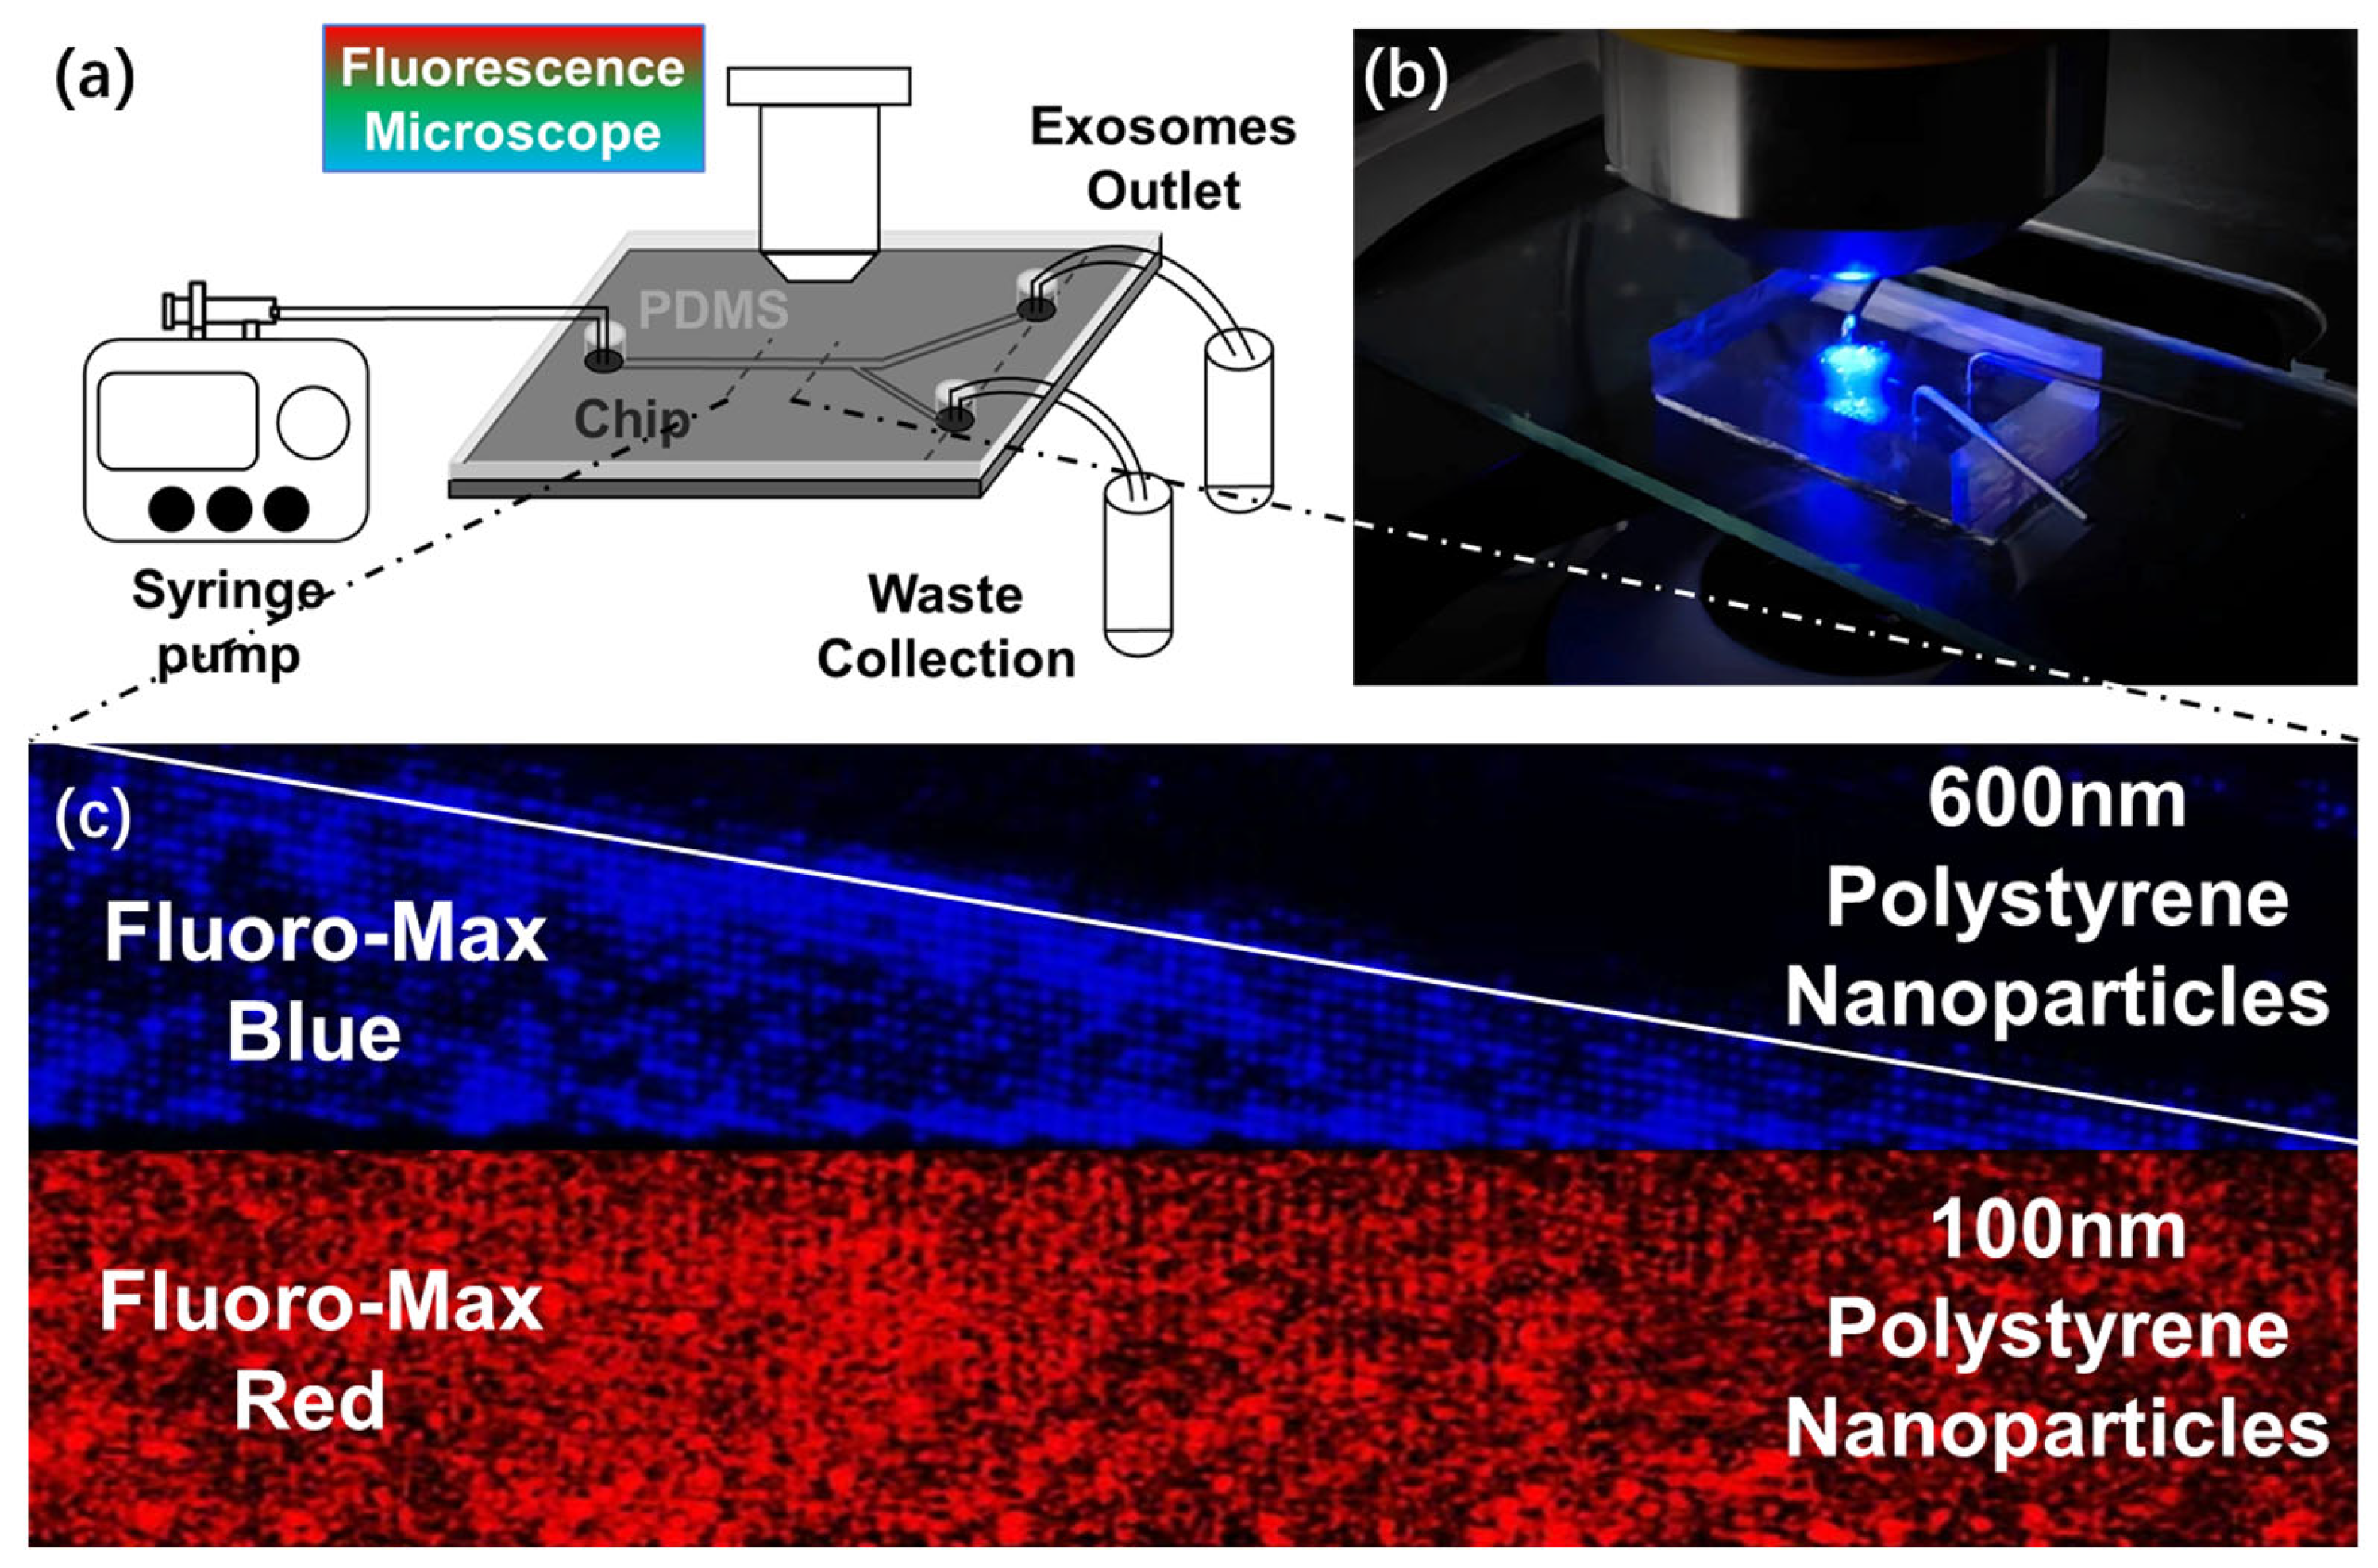
2.5. DLD Experimental Instruments
2.6. EV Sample Preparation
2.7. Nanoparticle Tracking Analysis (NTA)
2.8. Scanning Electron Microscope (SEM)
3. Results
3.1. DLD Chip Design and Fabrication
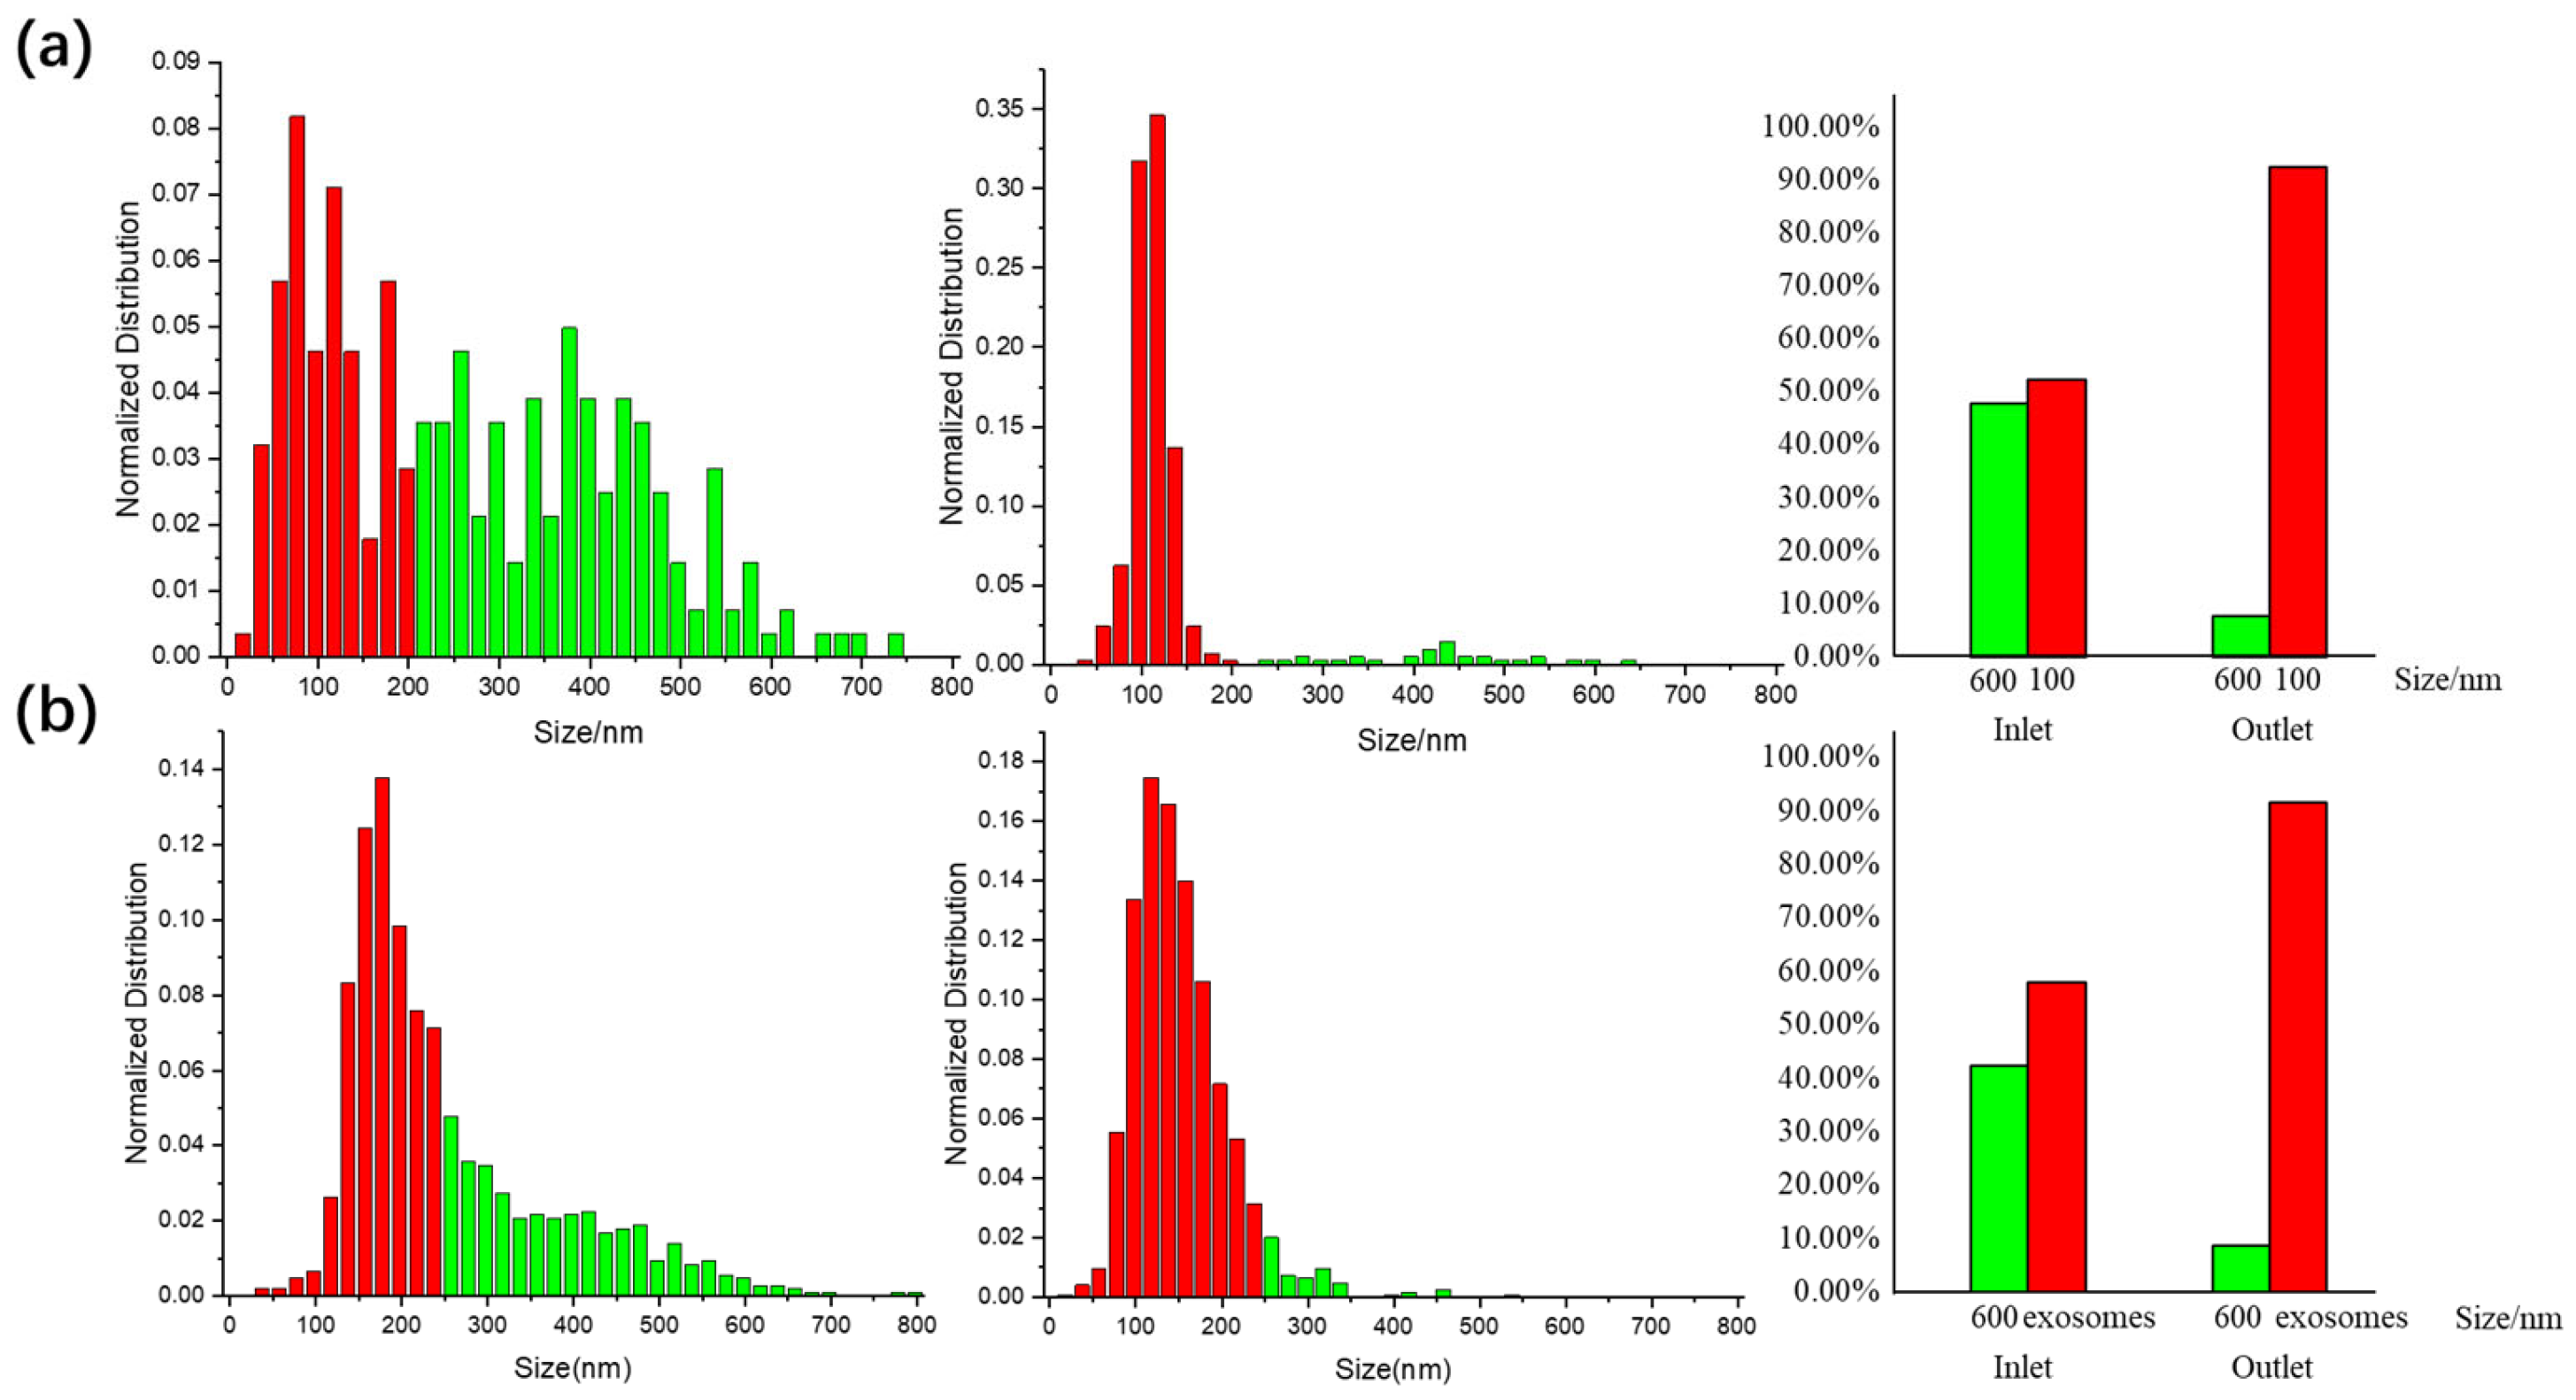
3.2. DLD Separation Performance
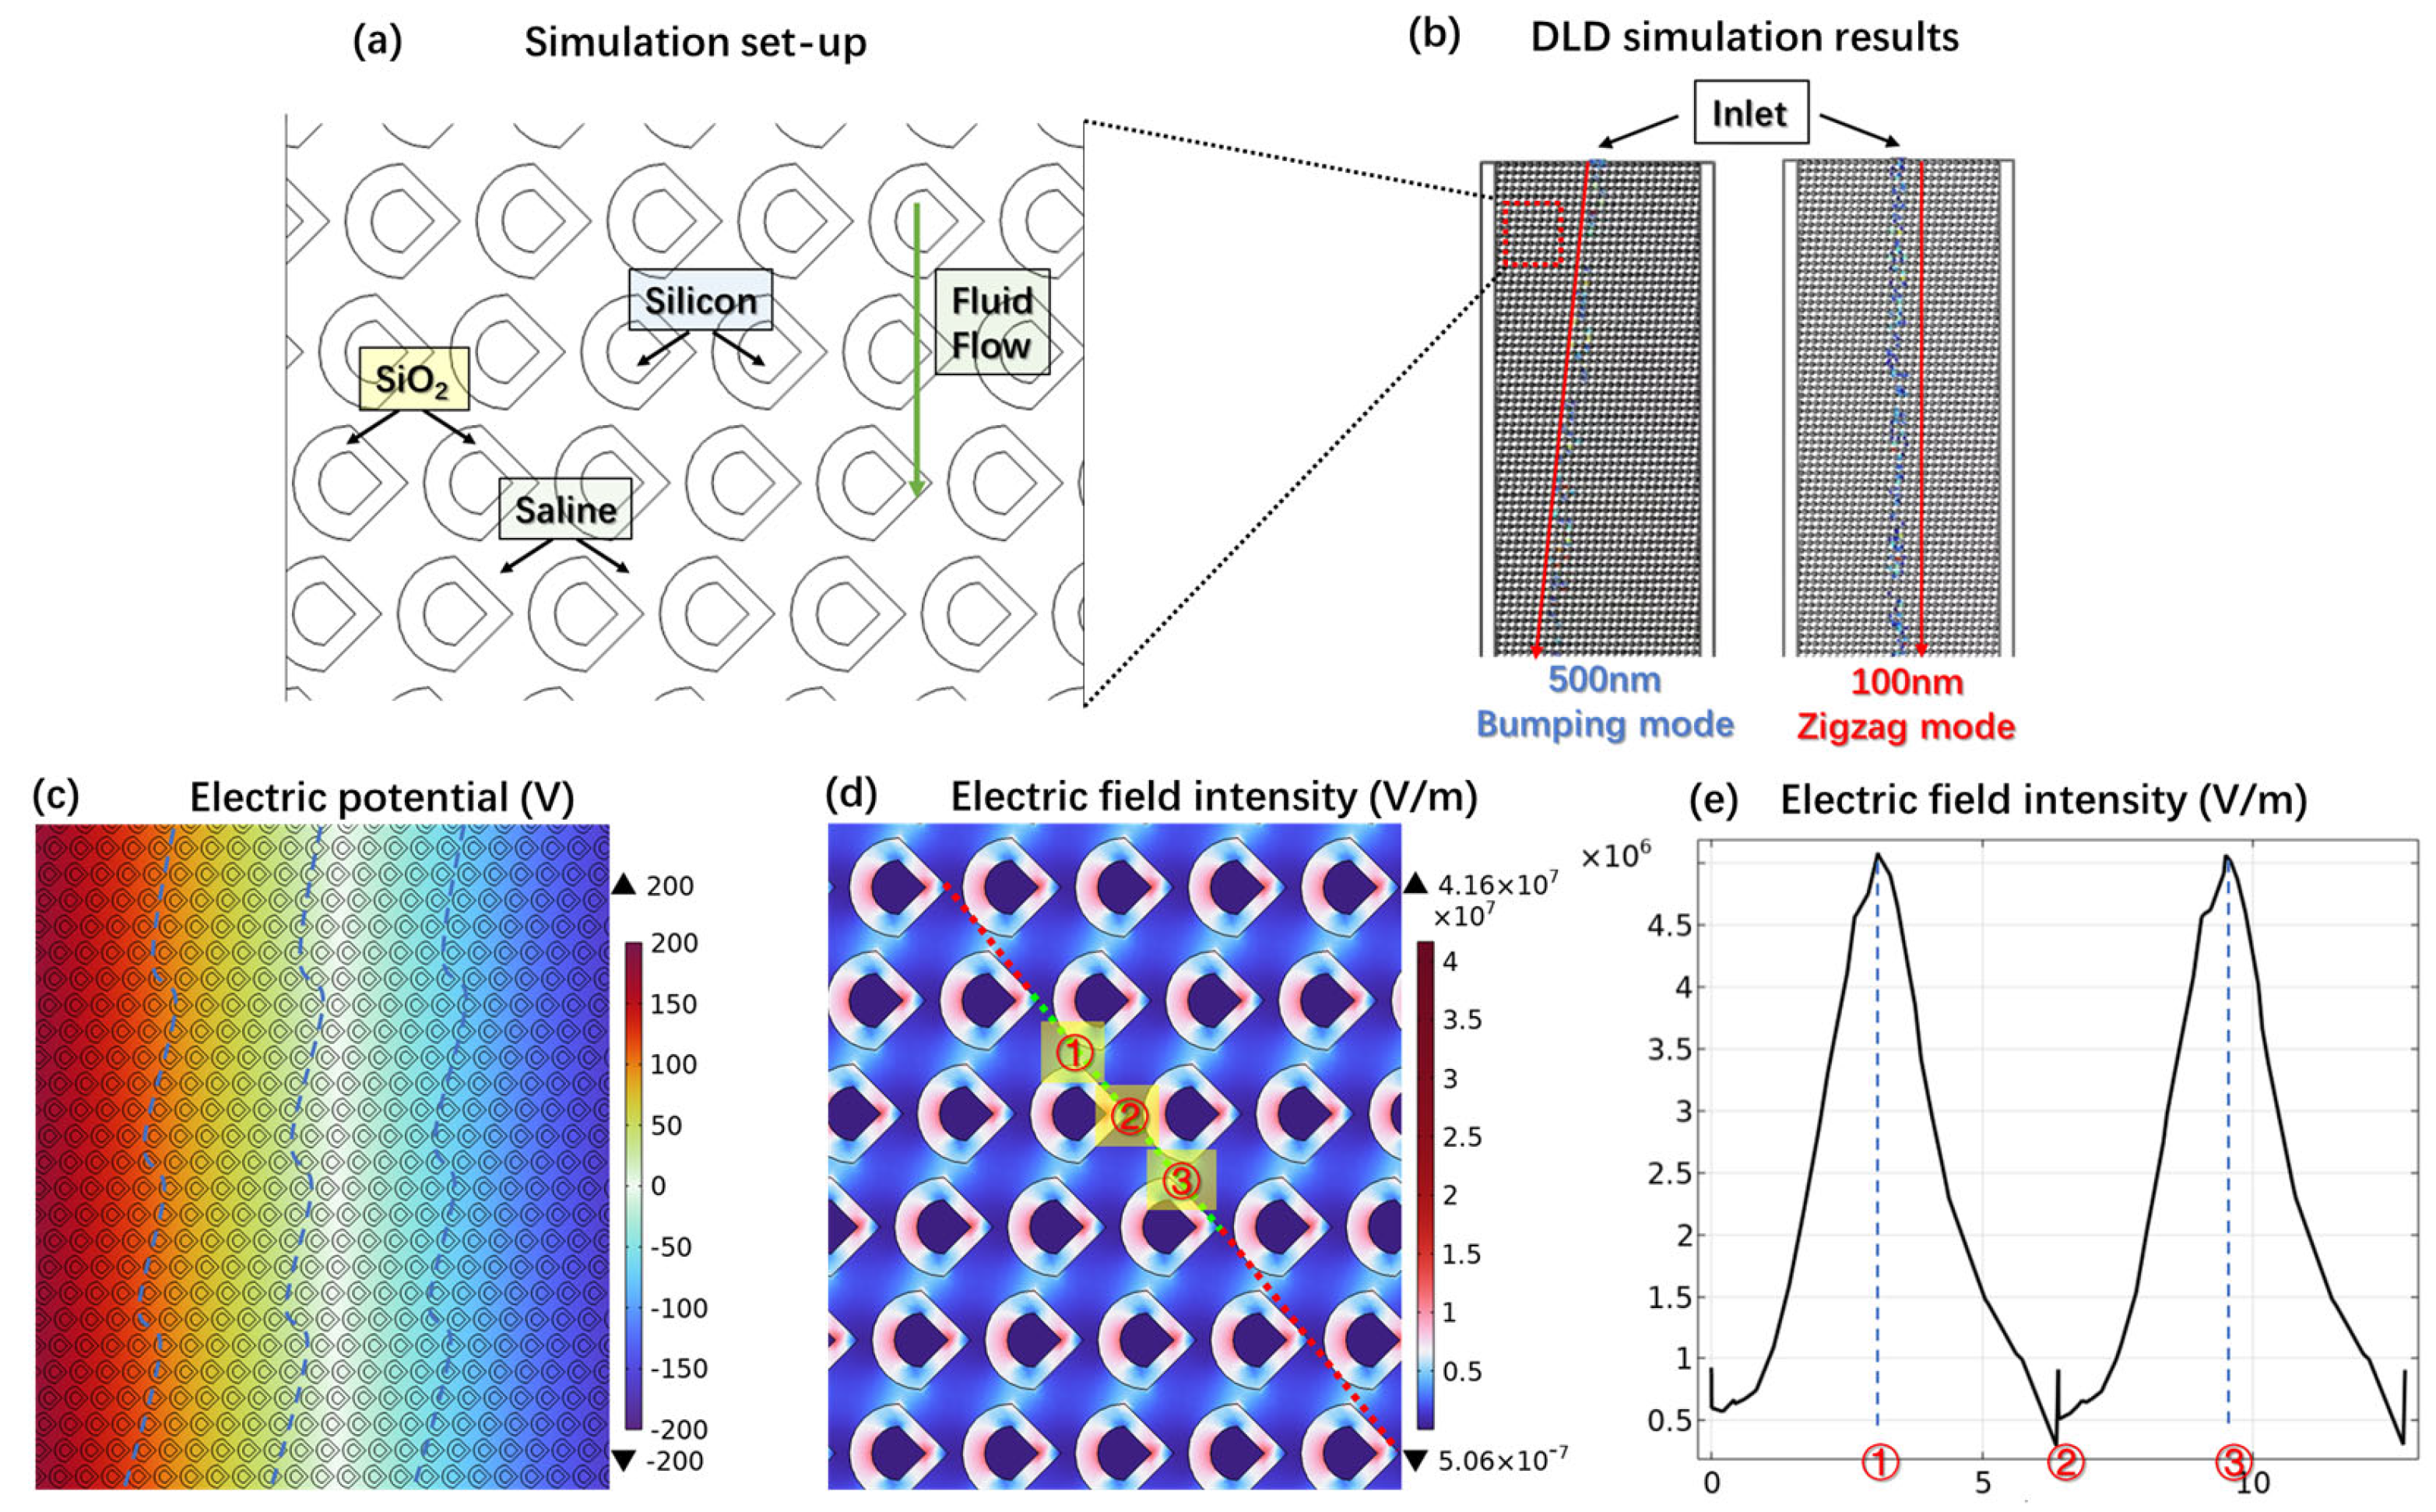
3.3. Simulation of the Synergistic Effect of DLD and DEP
4. Discussion
5. Conclusions
Supplementary Materials
Author Contributions
Funding
Institutional Review Board Statement
Informed Consent Statement
Data Availability Statement
Acknowledgments
Conflicts of Interest
References
- Kalluri, R.; LeBleu, V.S. The biology, function, and biomedical applications of exosomes. Science 2020, 367, eaau6977. [Google Scholar] [CrossRef]
- Pegtel, D.M.; Gould, S.J. Exosomes. Annu. Rev. Biochem. 2019, 88, 487–514. [Google Scholar] [CrossRef]
- Xu, R.; Rai, A.; Chen, M.; Suwakulsiri, W.; Greening, D.W.; Simpson, R.J. Extracellular vesicles in cancer—Implications for future improvements in cancer care. Nat. Rev. Clin. Oncol. 2018, 15, 617–638. [Google Scholar] [CrossRef]
- Tkach, M.; Théry, C. Communication by extracellular vesicles: Where we are and where we need to go. Cell 2016, 164, 1226–1232. [Google Scholar] [CrossRef]
- Valadi, H.; Ekström, K.; Bossios, A.; Sjöstrand, M.; Lee, J.J.; Lötvall, J.O. Exosome-mediated transfer of mRNAs and microRNAs is a novel mechanism of genetic exchange between cells. Nat. Cell Biol. 2007, 9, 654–659. [Google Scholar] [CrossRef]
- Théry, C.; Zitvogel, L.; Amigorena, S. Exosomes: Composition, biogenesis and function. Nat. Rev. Immunol. 2002, 2, 569–579. [Google Scholar] [CrossRef]
- Mathivanan, S.; Fahner, C.J.; Reid, G.E.; Simpson, R.J. ExoCarta 2012: Database of exosomal proteins, RNA and lipids. Nucleic Acids Res. 2012, 40, D1241–D1244. [Google Scholar] [CrossRef]
- Colombo, M.; Raposo, G.; Théry, C. Biogenesis, secretion, and intercellular interactions of exosomes and other extracellular vesicles. Annu. Rev. Cell Dev. Biol. 2014, 30, 255–289. [Google Scholar] [CrossRef]
- Théry, C.; Amigorena, S.; Raposo, G.; Clayton, A. Isolation and characterization of exosomes from cell culture supernatants and biological fluids. Curr. Protoc. Cell Biol. 2006, 30, 3.22.1–3.22.29. [Google Scholar] [CrossRef]
- Théry, C.; Witwer, K.W.; Aikawa, E.; Alcaraz, M.J.; Anderson, J.D.; Andriantsitohaina, R.; Antoniou, A.; Arab, T.; Archer, F.; Atkin-Smith, G.K.; et al. Minimal information for studies of extracellular vesicles 2018 (MISEV2018): A position statement of the International Society for Extracellular Vesicles and update of the MISEV2014 guidelines. J. Extracell. Vesicles 2018, 7, 1535750. [Google Scholar] [CrossRef]
- Zech, D.; Rana, S.; Büchler, M.W.; Zöller, M. Tumor-exosomes and leukocyte activation: An ambivalent crosstalk. Cell Commun. Signal. 2012, 10, 37. [Google Scholar] [CrossRef] [PubMed]
- Davies, R.T.; Kim, J.; Jang, S.C.; Choi, E.J.; Gho, Y.S.; Park, J. Microfluidic filtration system to isolate extracellular vesicles from blood. Lab Chip 2012, 12, 5202–5210. [Google Scholar] [CrossRef] [PubMed]
- Guo, S.C.; Tao, S.C.; Dawn, H. Microfluidics-based on-a-chip systems for isolating and analysing extracellular vesicles. J. Extracell. Vesicles 2018, 7, 1508271. [Google Scholar] [CrossRef] [PubMed]
- Su, W.; Li, H.; Chen, W.; Qin, J. Microfluidic strategies for label-free exosomes isolation and analysis. TrAC Trends Anal. Chem. 2019, 118, 686–698. [Google Scholar] [CrossRef]
- Yuan, D.; Zhao, Q.; Yan, S.; Tang, S.Y.; Alici, G.; Zhang, J.; Li, W. Recent progress of particle migration in viscoelastic fluids. Lab Chip 2018, 18, 551–567. [Google Scholar] [CrossRef] [PubMed]
- Leshansky, A.M.; Bransky, A.; Korin, N.; Dinnar, U. Tunable nonlinear viscoelastic “focusing” in a microfluidic device. Phys. Rev. Lett. 2007, 98, 234501. [Google Scholar] [CrossRef] [PubMed]
- Shao, H.; Im, H.; Castro, C.M.; Breakefield, X.; Weissleder, R.; Lee, H. New technologies for analysis of extracellular vesicles. Chem. Rev. 2018, 118, 1917–1950. [Google Scholar] [CrossRef] [PubMed]
- Ding, L.; Yang, X.; Gao, Z.; Effah, C.Y.; Zhang, X.; Wu, Y.; Qu, L. A holistic review of the state-of-the-art microfluidics for exosome separation: An overview of the current status, existing obstacles, and future outlook. Small 2021, 17, 2007174. [Google Scholar] [CrossRef]
- Huang, L.R.; Cox, E.C.; Austin, R.H.; Sturm, J.C. Continuous particle separation through deterministic lateral displacement. Science 2004, 304, 987–990. [Google Scholar] [CrossRef]
- Davis, J.A.; Inglis, D.W.; Morton, K.J.; Lawrence, D.A.; Huang, L.R.; Chou, S.Y.; Sturm, J.C.; Austin, R.H. Deterministic hydrodynamics: Taking blood apart. Proc. Natl. Acad. Sci. USA 2006, 103, 14779–14784. [Google Scholar] [CrossRef]
- McGrath, J.; Jimenez, M.; Bridle, H. Deterministic lateral displacement for particle separation: A review. Lab Chip 2014, 14, 4139–4158. [Google Scholar] [CrossRef] [PubMed]
- Voldman, J. Electrical forces for microscale cell manipulation. Annu. Rev. Biomed. Eng. 2006, 8, 425–454. [Google Scholar] [CrossRef] [PubMed]
- Shafiee, H.; Sano, M.B.; Henslee, E.A.; Caldwell, J.L.; Davalos, R.V. Selective isolation of live/dead cells using contactless dielectrophoresis (cDEP). Lab Chip 2010, 10, 438–445. [Google Scholar] [CrossRef]
- Hettiarachchi, S.; Cha, H.; Ouyang, L.; Mudugamuwa, A.; An, H.; Kijanka, G.; Kashaninejad, N.; Nguyen, N.T.; Zhang, J. Recent microfluidic advances in submicron to nanoparticle manipulation and separation. Lab Chip 2023, 23, 982–1010. [Google Scholar] [CrossRef]
- Wunsch, B.H.; Smith, J.T.; Gifford, S.M.; Wang, C.; Brink, M.; Bruce, R.L.; Austin, R.H.; Stolovitzky, G.; Astier, Y. Nanoscale lateral displacement arrays for the separation of exosomes and colloids down to 20 nm. Nat. Nanotechnol. 2016, 11, 936–940. [Google Scholar] [CrossRef] [PubMed]
- Davis, J.A. Microfluidic Separation of Blood Components through Deterministic Lateral Displacement. Ph.D. Thesis, Princeton University, Princeton, NJ, USA, 2008. [Google Scholar]
- Yang, J.; Huang, Y.; Wang, X.B.; Becker, F.F.; Gascoyne, P.R. Cell separation on microfabricated electrodes using dielectrophoretic/gravitational field-flow fractionation. Anal. Chem. 1999, 71, 911–918. [Google Scholar] [CrossRef]
- Hughes, M.P. Strategies for dielectrophoretic separation in laboratory-on-a-chip systems. Electrophoresis 2002, 23, 2569–2582. [Google Scholar] [CrossRef] [PubMed]
- Kim, D.; Sonker, M.; Ros, A. Dielectrophoresis: From molecular to micrometer-scale analytes. Anal. Chem. 2018, 91, 277–295. [Google Scholar] [CrossRef]
- Xing, X.; Yobas, L. Dielectrophoretic isolation of cells using 3D microelectrodes featuring castellated blocks. Analyst 2015, 140, 3397–3405. [Google Scholar] [CrossRef]
- di Toma, A.; Brunetti, G.; Chiriacò, M.S.; Ferrara, F.; Ciminelli, C. A Novel Hybrid Platform for Live/Dead Bacteria Accurate Sorting by On-Chip DEP Device. Int. J. Mol. Sci. 2023, 24, 7077. [Google Scholar] [CrossRef]
- Moore, J.H.; Varhue, W.B.; Su, Y.H.; Linton, S.S.; Farmehini, V.; Fox, T.E.; Matters, G.L.; Kester, M.; Swami, N.S. Conductance-based biophysical distinction and microfluidic enrichment of nanovesicles derived from pancreatic tumor cells of varying invasiveness. Anal. Chem. 2019, 91, 10424–10431. [Google Scholar] [CrossRef] [PubMed]
- Van der Pol, E.; Böing, A.N.; Harrison, P.; Sturk, A.; Nieuwland, R. Classification, functions, and clinical relevance of extracellular vesicles. Pharmacol. Rev. 2012, 64, 676–705. [Google Scholar] [CrossRef] [PubMed]


Disclaimer/Publisher’s Note: The statements, opinions and data contained in all publications are solely those of the individual author(s) and contributor(s) and not of MDPI and/or the editor(s). MDPI and/or the editor(s) disclaim responsibility for any injury to people or property resulting from any ideas, methods, instructions or products referred to in the content. |
© 2024 by the authors. Licensee MDPI, Basel, Switzerland. This article is an open access article distributed under the terms and conditions of the Creative Commons Attribution (CC BY) license (https://creativecommons.org/licenses/by/4.0/).
Share and Cite
Wang, D.; Yang, S.; Wang, N.; Guo, H.; Feng, S.; Luo, Y.; Zhao, J. A Novel Microfluidic Strategy for Efficient Exosome Separation via Thermally Oxidized Non-Uniform Deterministic Lateral Displacement (DLD) Arrays and Dielectrophoresis (DEP) Synergy. Biosensors 2024, 14, 174. https://doi.org/10.3390/bios14040174
Wang D, Yang S, Wang N, Guo H, Feng S, Luo Y, Zhao J. A Novel Microfluidic Strategy for Efficient Exosome Separation via Thermally Oxidized Non-Uniform Deterministic Lateral Displacement (DLD) Arrays and Dielectrophoresis (DEP) Synergy. Biosensors. 2024; 14(4):174. https://doi.org/10.3390/bios14040174
Chicago/Turabian StyleWang, Dayin, Shijia Yang, Ning Wang, Han Guo, Shilun Feng, Yuan Luo, and Jianlong Zhao. 2024. "A Novel Microfluidic Strategy for Efficient Exosome Separation via Thermally Oxidized Non-Uniform Deterministic Lateral Displacement (DLD) Arrays and Dielectrophoresis (DEP) Synergy" Biosensors 14, no. 4: 174. https://doi.org/10.3390/bios14040174