Article

Rapid Determination of Cr3+ and Mn2+ in Water Using Laser-Induced Breakdown Spectroscopy Combined with Filter Paper Modified with Gold Nanoclusters

1
School of Mechanical Engineering, Guangxi University, Nanning 530004, China
2
Research Center of Intelligent Equipment, Beijing Academy of Agriculture and Forestry Sciences, Beijing 100097, China
*
Author to whom correspondence should be addressed.
Biosensors 2024, 14(6), 267; https://doi.org/10.3390/bios14060267
Submission received: 17 April 2024 / Revised: 17 May 2024 / Accepted: 22 May 2024 / Published: 23 May 2024
(This article belongs to the Section Biosensor and Bioelectronic Devices)

Abstract

:
Excessive emissions of heavy metals not only cause environmental pollution but also pose a direct threat to human health. Therefore, rapid and accurate detection of heavy metals in the environment is of great significance. Herein, we propose a method based on laser-induced breakdown spectroscopy (LIBS) combined with filter paper modified with bovine serum albumin-protected gold nanoclusters (LIBS-FP-AuNCs) for the rapid and sensitive detection of Cr3+ and Mn2+. The filter paper modified with AuNCs was used to selectively enrich Cr3+ and Mn2+. Combined with the multi-element detection capability of LIBS, this method achieved the simultaneous rapid detection of Cr3+ and Mn2+. Both elements showed linear ranges for concentrations of 10–1000 μg L−1, with limits of detection of 7.5 and 9.0 μg L−1 for Cr3+ and Mn2+, respectively. This method was successfully applied to the determination of Cr3+ and Mn2+ in real water samples, with satisfactory recoveries ranging from 94.6% to 105.1%. This method has potential application in the analysis of heavy metal pollution.

1. Introduction

In recent years, heavy metal pollution has become increasingly severe owing to industrial production, mineral extraction, human activities, and the lack of efficient control and treatment methods [1,2,3]. Notably, heavy metals (Cr, Mn, Cd, Hg, Pb) are nondegradable, leading to their ongoing accumulation in the environment, which presents a long-term threat [4,5]. These heavy metals can enter the human body through a wide variety of pathways (e.g., dermal contact, ingestion, inhalation), posing risks to human health [6,7]. For example, manganese (Mn) is an essential trace element for the human body, but excessive intake can result in neurological disorders [8,9]. Chromium (Cr) may cause hemolysis, renal failure, liver failure, and lead to various types of malignant tumors, particularly lung cancer [10]. Hence, to reduce the environmental and human health risks related to heavy metal pollution, it is crucial to have a method for the rapid and sensitive detection of Cr3+ and Mn2+.
The common, extensively used methods for heavy metal detection are atomic absorption spectrometry (AAS) [11,12], atomic fluorescence spectrometry (AFS) [13,14], inductively coupled plasma mass spectrometry (ICP-MS) [15,16], and inductively coupled plasma optical emission spectroscopy (ICP-OES) [17,18]. Although these techniques are capable of sensitive detection, they are unsuitable for rapid on-site detection due to requiring sample pretreatment, time-consuming procedures, labor-intensive requirements, and high costs. Laser-induced breakdown spectroscopy (LIBS) is a novel atomic emission spectroscopy that uses a high-energy pulse laser to ablate and break down the sample surface to generate plasma, and then analyzes the plasma emission spectrum to determine the elemental composition and content [19,20]. LIBS offers several unique benefits, including multi-element analysis, fast response (microseconds), minimal sample treatment, and non-contact measurement [21]. Thus, it has become a powerful analytical technique for heavy metal detection. Yi et al. used LIBS assisted by a solid–liquid–solid transformation method to detect cadmium (Cd) and lead (Pb) in soil, with limits of detection (LOD) of 0.067 and 0.94 mg kg−1, respectively [22]. Zhu et al. used LIBS assisted by laser-induced fluorescence to detect Pb with an LOD of 0.054 mg kg−1 in natural rhododendron leaf samples [23]. Moreover, LIBS has multiform (solid, liquid, gas) detection capability. Nevertheless, liquid analysis by LIBS is associated with several inherent drawbacks, such as splashing, surface ripples, extinction of emitted intensity, and a shorter plasma lifetime, which would greatly reduce the laser ablation efficiency, signal repeatability, and quantitative accuracy [24]. To solve these problems, many methods have been proposed, including water jets, freezing samples, and employing a double pulse with different geometric positions [25]. However, these techniques require extra equipment, which increases the complexity and analytical cost. Matrix transformation is a frequently used strategy for conquering the limitations of LIBS for the analysis of liquid samples. Díaz Pace et al. converted liquid solutions into solid pellets of calcium hydroxide by mixing with calcium oxide to successfully detect Cr, Pb, Cd, and zinc (Zn) in liquid samples [26]. Therefore, converting liquid samples into a solid matrix is a feasible method to overcome the shortcomings of liquid analysis and improve the detection sensitivity and stability.
There have been many studies of heavy metal detection using nanoparticles. These studies primarily focused on exploiting the changes in the physical and chemical properties (e.g., color, fluorescence, surface plasmon resonance) of nanoparticles induced by heavy metals to achieve the purpose of detection [27,28,29]. However, these signal readout methods are susceptible to interference from other substances, and non-specific aggregation of nanoparticles may occur [30]. Therefore, it is worth noting that many nanoparticles have the ability to adsorb heavy metals. This capability can be utilized as a means of enriching heavy metals in water for detection, thereby avoiding these problems [31]. Protein-protected metal nanoclusters (PPMNCs) are a novel nanomaterial [32]. Related studies have utilized PPMNCs for the adsorption of heavy metals. Bi et al. synthesized MNP/ATT-AuNCs@ZIF-8, which was used for the simultaneous detection and removal of mercury (Hg), with a short capture time (20 min), high removal efficiency (>96.9%), and excellent reusability (10 cycles) [33]. Compared with common nanoparticles, PPMNCs have a smaller size (<10 nm) and larger specific surface area. These characteristics provide numerous active sites for the adsorption of heavy metals. Moreover, their protein-templated synthesis method not only ensures precise control of the size and shape but is also environmentally friendly. In addition, the protective shell of the protein makes this material highly biocompatible. Therefore, PPMNCs show great potential in the detection and removal of heavy metals from the environment.
In this study, we developed a rapid and sensitive method based on LIBS combined with filter paper modified with bovine serum albumin-protected Au nanoclusters (LIBS-FP-AuNCs) for the simultaneous detection of Cr3+ and Mn2+. The filter paper was modified with AuNCs by soaking in this solution for 1 h. Owing to the adsorption capabilities of AuNCs, the modified filter paper showed the rapid enrichment and separation of Cr3+ and Mn2+ from the sample by liquid–solid conversion in 10 min. Direct determination was completed using LIBS. Therefore, the simultaneous rapid detection of Cr3+ and Mn2+ could be performed using this method, and it is cost-effective and simple to operate. Furthermore, when combined with portable LIBS instruments, it holds great promise for the on-site detection of heavy metals.

2. Materials and Methods

2.1. Materials and Instrumentation

Chloroauric acid (HAuCl4·3H2O) was purchased from Beijing Chemical Works (Beijing, China). Sodium hydroxide (NaOH) was purchased from Bolinda Technology (Shenzhen, China). Bovine serum albumin (BSA) and trisodium citrate were purchased from Sigma-Aldrich (Shanghai, China). The filter papers were purchased from Aoke (Taizhou, China). The standard solutions (K+, Cr3+, Cr6+, Mn2+, Ni2+, Cu2+, Zn2+, Cd2+, Hg2+, and Pb2+) were obtained from the China Standard Material Network. The Hg2+ standard solution was 100 mg L−1, and the other ion standard solutions were 1000 mg L−1. All the chemicals were of analytical purity and were used without further purification.
We employed scanning electron microscopy (SEM; JSM-7800 F, JEOL, Tokyo, Japan) and transmission electron microscopy (TEM, SU-8220, Hitachi, Tokyo, Japan) for the characterization of AuNCs and AuNPs. We employed ICP-MS (Prodigy 7, Teledyne Leeman Labs, Hudson, NH, USA) to detect the concentrations of Cr3+ and Mn2+ in real samples.
The LIBS system that we used is shown in Figure 1A. A Q-Switch Nd: YAG laser (wavelength 532 nm, repetition rate 20 Hz, pulse width 7 ns) was used to generate a high-energy pulsed laser beam. The laser beam was reflected by a mirror and then focused on the filter paper surface through a focusing lens (f = 25 mm). The laser beam ablated the sample surface to generate a plasma signal. The plasma signal was collected through a collecting probe and coupled to a spectrometer (Shamrock 500i, grating 2400 L mm−1, slit width 200 μm; Andor Tech, Belfast, UK) equipped with an intensified charge-coupled device (ICCD, iStar 320T: DH320T-18F-E3-26 mm; Andor Tech) through an optical fiber. The LIBS system had a detection range of about 8 nm at around 400 nm. The collected data were analyzed using a computer. A three-dimensional sample platform was used to adjust the position of the laser ablation for the optimal signal.

2.2. Preparation of AuNCs and AuNPs Modified Filter Paper

According to a previous study [32], AuNCs were prepared using BSA as a template for the reduction and stabilization of gold atoms in subnanometer-sized clusters. Briefly, we added 2.5 mL of chloroauric acid solution (10 mM, 37 °C) to 2.5 mL of BSA solution (50 mg mL−1, 37 °C) under vigorous shaking. After 2 min, 500 μL of NaOH solution (1 M) was added and the mixture was shaken at 37 °C for 12 h. During this period, a color change from light yellow to deep yellow, and then to dark brown, was observed in the reaction mixture.
Filter papers modified with AuNCs were subsequently prepared. Twenty pieces of filter paper (10 mm × 10 mm) were placed in the AuNCs solution and soaked for 1 h. The filter papers were then removed, rinsed three times with deionized water, and air-dried at room temperature for 1 h. The solution and filter paper showed an intense red fluorescence under 365 nm ultraviolet light (UV), confirming the successful reaction and modification of AuNCs. The AuNCs-modified filter papers were stored at 4 °C in an airtight container for further use. A schematic diagram of the preparation of the AuNCs-modified filter papers is shown in Figure 2. The preparation of the AuNPs-modified filter papers used trisodium citrate as the reductant, as previously described [30].

2.3. LIBS-FP-AuNCs Sensor for Cr3+ and Mn2+ Detection

For Cr3+ and Mn2+ detection, we established a procedure using the LIBS-FP-AuNCs sensor. As shown in Figure 1B, to adsorb the target ions using the FP-AuNCs, we first prepared a 4 mL Cr3+ and Mn2+ solution, placed a piece of FP-AuNCs in the solution, and then agitated it for 10 min on a shaker. The filter paper was removed from the solution, rinsed three times with deionized water, and dried using a heating platform at 50 °C for 2 min. The filter paper was then attached to a glass slide using double-sided tape and positioned on the sample platform for LIBS measurement.
To improve the sensitivity of Cr3+ and Mn2+ detection, we optimized the experimental parameters. The energy of the Nd: YAG laser was 50 mJ, the spot size of the focused laser was ~150 μm, and the delay time and gate width of the spectrometer were both 4 μs. The selected analytical lines were Cr I 425.43 nm and Mn I 403.08 nm. The spectra of Cr and Mn are shown in Figure 1C.

3. Results and Discussion

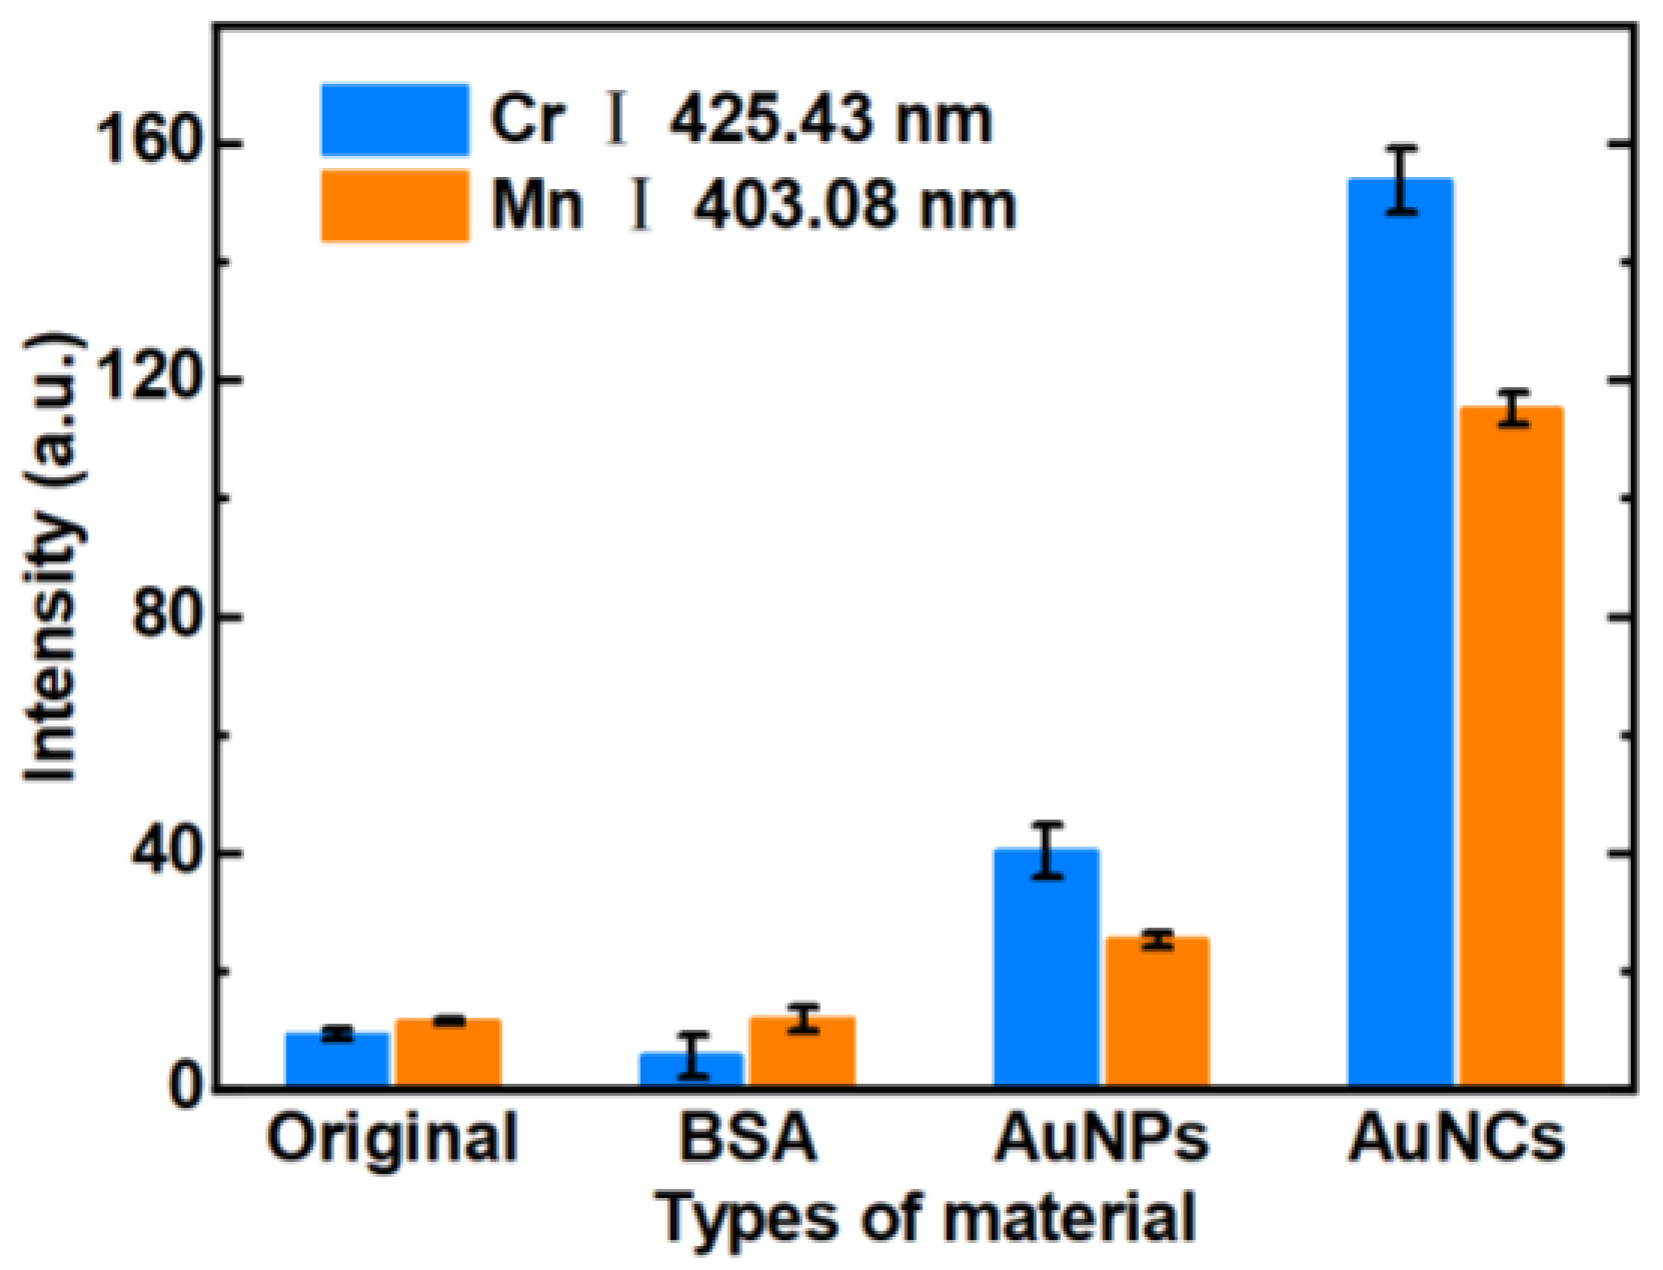
3.1. Comparison of Adsorption Capabilities of Filter Papers Modified with Different Materials

To investigate the optimal adsorption capability and mechanism of AuNCs for Cr3+ and Mn2+, we conducted a comparative experiment to evaluate the spectral response characteristics of filter papers modified with different materials for the detection of the target ions. An original filter paper, BSA-modified filter paper, and AuNPs-modified filter paper were prepared and tested, and they were then compared with the AuNCs-modified filter paper. The experimental results are depicted in Figure 3. It can be clearly seen that the spectral intensities of Cr3+ and Mn2+ were weak when using the original filter paper and that modified with BSA. This indicated that these had no obvious adsorption capacities for Cr3+ and Mn2+. Conversely, enhanced spectral signals of Cr3+ and Mn2+ were observed when the AuNPs-modified filter paper was used, demonstrating that AuNPs have a certain degree of adsorption capacity for these ions but were unable to achieve the purpose of efficient adsorption. The use of the AuNCs-modified filter paper showed the perfect spectral intensities for Cr3+ and Mn2+. Compared with the AuNPs-modified filter paper, there were significant increases in the spectral intensities of Cr3+ and Mn2+ by 3.8-fold and 4.5-fold, respectively. The possible reasons for these significant enhancements were hypothesized as (1) the smaller size of AuNCs, resulting in a larger specific surface area, which provides more active sites for the adsorption of heavy metals; and (2) the carboxyl groups (–COOH) of BSA on the surface of AuNCs, which provide a very strong affinity between Cr3+ and –COOH. [34,35]. In addition, Mn follows Cr in the Periodic Table, so it may induce a similar interaction between Mn2+ and AuNCs.
We compare the spectra of the AuNCs-modified filter paper soaked and unsoaked in Cr3+ and Mn2+ solution in Figure 4. The elements detected on the unsoaked filter paper were Fe (Fe I 404.58 nm, Fe I 425.08 nm, Fe I 406.36 nm, Fe I 427.18 nm, Fe I 428.24 nm) and Ca (Ca I 430.25 nm, Ca I 430.77 nm). It can be seen that the spectral peaks of the Cr and Mn elements were not detected on the unsoaked filter paper. After being soaked, the elements detected were also Cr (Cr I 425.43 nm, Cr I 427.48 nm, Cr I 428.97 nm) and Mn (Mn I 403.08 nm, Mn I 403.31 nm, Mn I 403.45 nm). The comparison showed that Cr3+ and Mn2+ were absorbed.

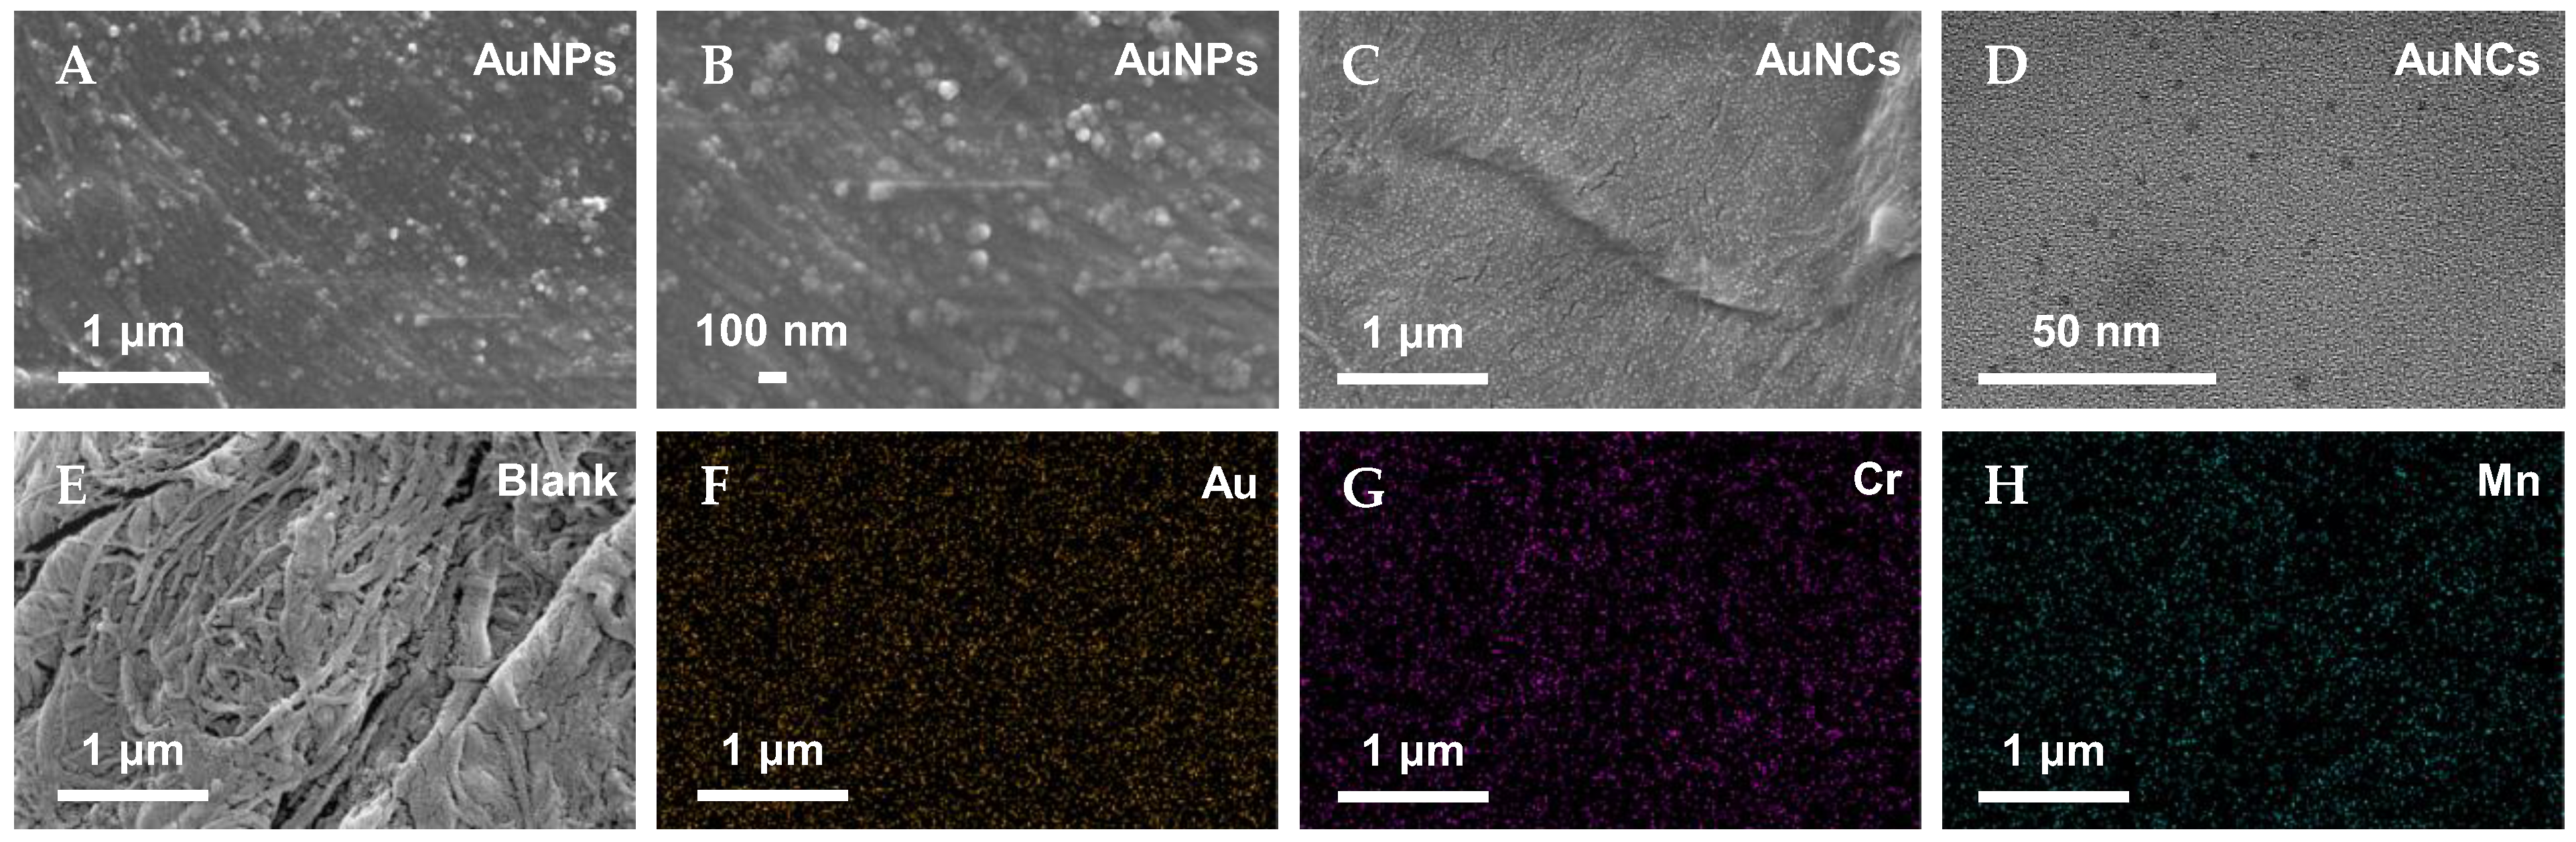
3.2. Characterization of AuNCs-Modified Filter Paper

To verify the better adsorption capacity of FP-AuNCs for Cr3+ and Mn2+, we used SEM to characterize the original filter paper and those modified with the different nanomaterials, and we used TEM to characterize the AuNCs. As shown in Figure 5A–E, we could observe more nanoparticles fixed on the filter paper surface modified with AuNCs than on that with AuNPs. The particle sizes of the AuNCs on the filter paper were less than 10 nm, which is smaller than those of the AuNPs (approximately 30–50 nm). Therefore, the filter paper modified with AuNCs had better heavy metal adsorption capability due to the larger specific surface area of AuNCs and greater number of AuNCs fixed on the filter paper, resulting in more active sites available for target ion adsorption.
An energy dispersive spectrometer (EDS) was employed to characterize the element mapping of the AuNCs-modified filter paper after adsorption of Cr3+ and Mn2+. The results are shown in Figure 5F–H. Au was uniformly distributed on the surface of the filter paper, which confirmed the successful modification of the filter paper by the AuNCs. Moreover, the detection of Cr and Mn on the surface of the filter paper suggests that AuNCs exhibit excellent capability for adsorbing these two elements.

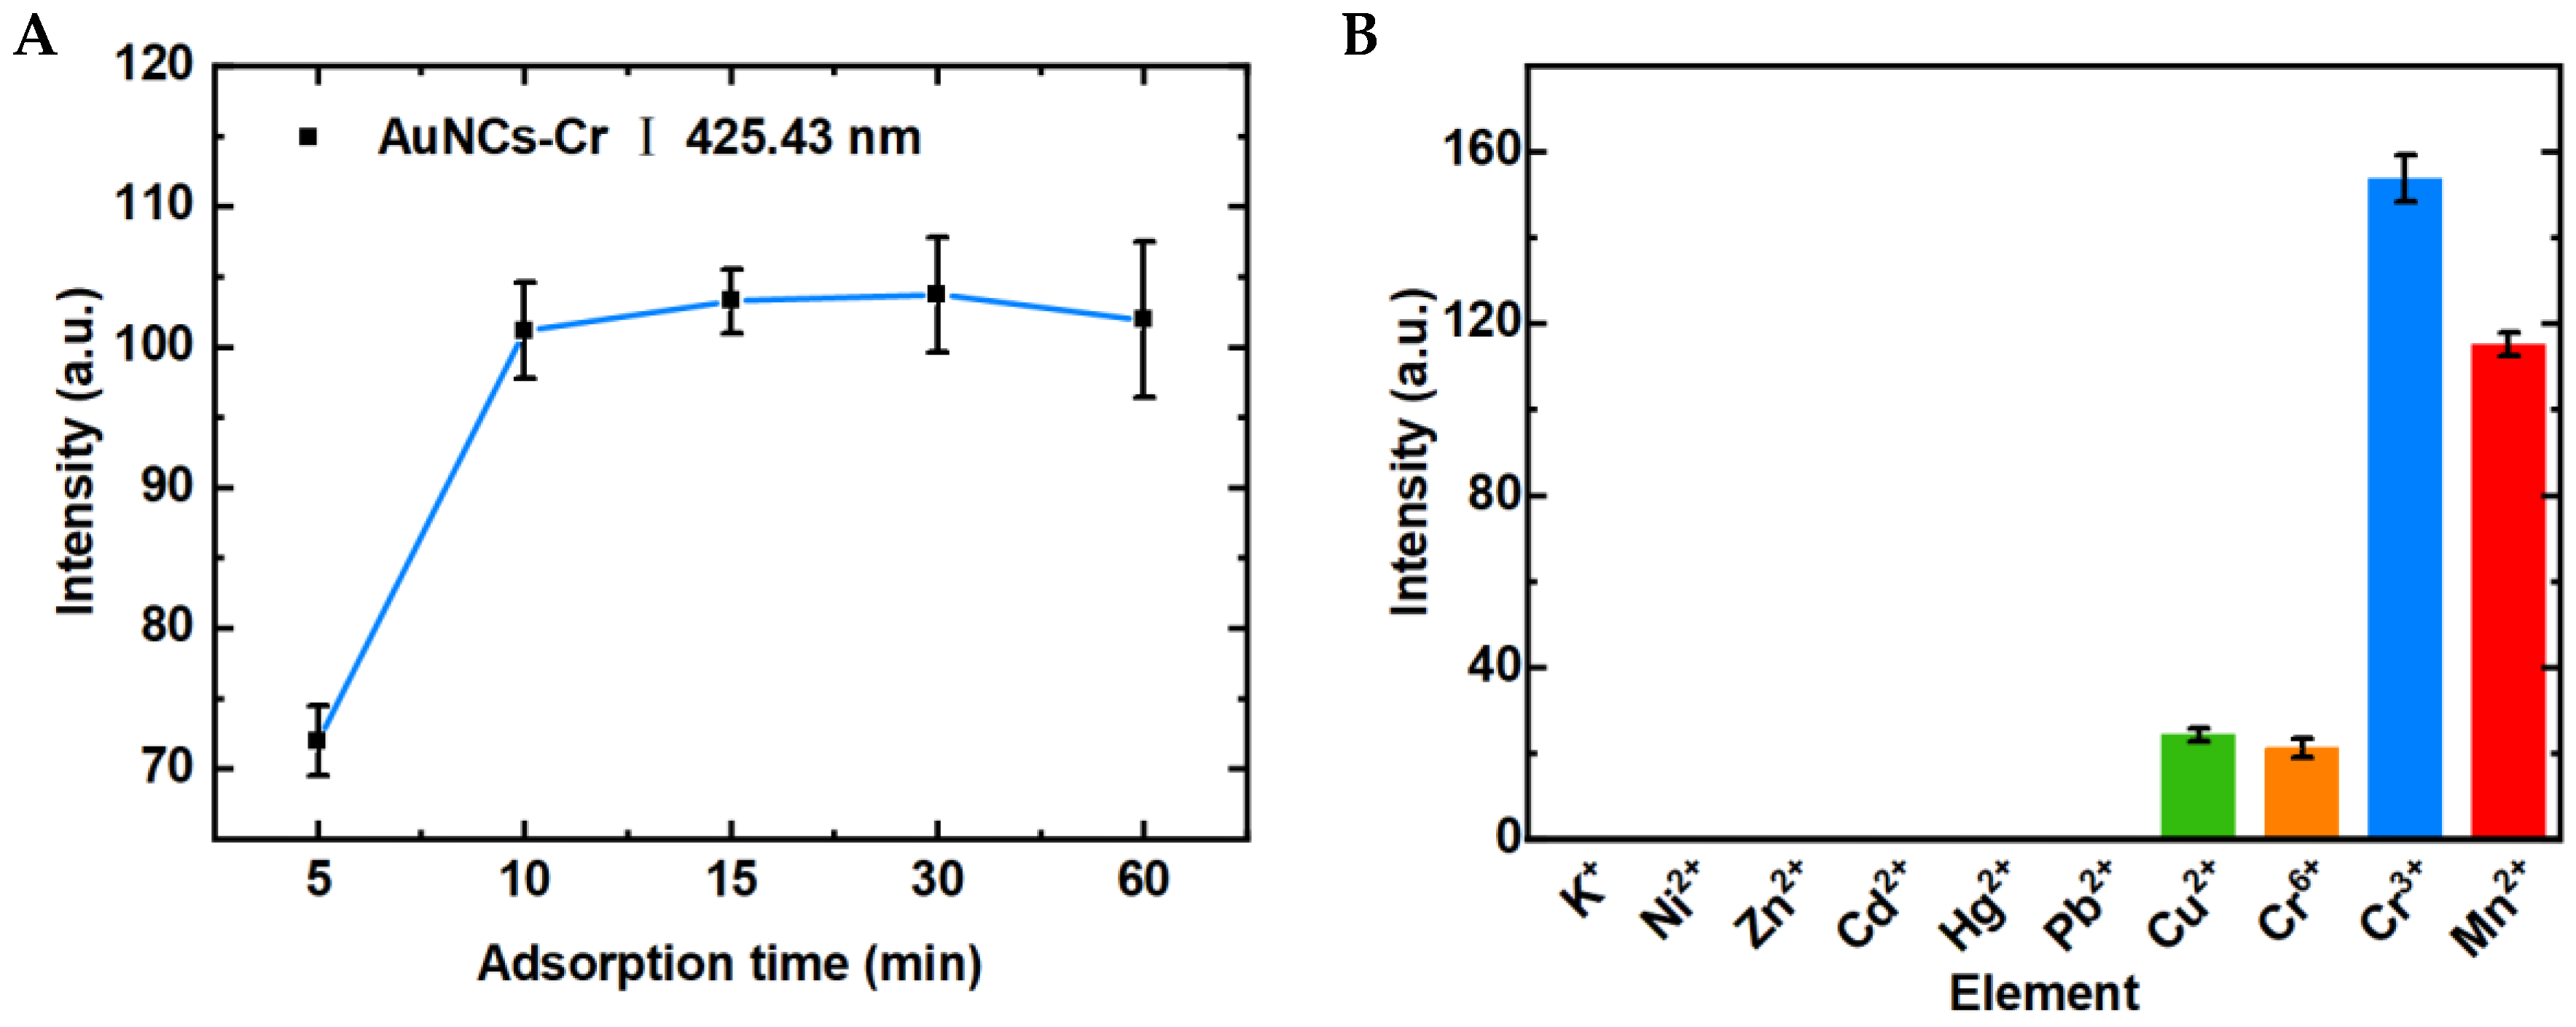
3.3. Optimization of Experimental Conditions

We optimized the adsorption time of the FP-AuNCs to ensure the rapid detection of Cr3+ and Mn2+ in the solution. Taking Cr3+ as an example, the adsorption times in Cr3+ solution (4 mL, 200 μg L−1) were set to 5, 10, 15, 30, and 60 min. The FP-AuNCs were measured by LIBS after adsorption and the spectral intensities were obtained. The results are shown in Figure 6A. The spectral intensity of Cr3+ increased from 5 to 10 min, and it reached a peak at 10 min. The spectral intensities remained stable after 10 min, indicating that the best adsorption process for Cr3+ was completed within 10 min. Therefore, we set 10 min as the final adsorption time in subsequent experiments.

3.4. LIBS-FP-AuNCs for Multi-Element Detection

The selectivity of LIBS-FP-AuNCs was subsequently evaluated. We selected and detected 10 common metal ions (K+, Cr3+, Cr6+, Mn2+, Ni2+, Cu2+, Zn2+, Cd2+, Hg2+, and Pb2+, each at 200 μg L−1) in environmental water under the same experimental conditions. The optimal spectral lines of the 10 ions were selected (K I 766.49 nm, Cr I 425.43 nm, Mn I 403.08 nm, Ni I 403.08 nm, Cu I 425.43 nm, Zn I 403.08 nm, Cd I 403.08 nm, Hg I 435.83 nm, Pb I 405.78 nm), and their spectral intensities are shown in Figure 6B. The LIBS-FP-AuNCs demonstrated obvious spectral signals for Cr3+ and Mn2+, whereas the spectral signals for Cr6+ and Cu2+ were too weak to meet the requirements for trace detection. Other ions, including K+, Ni2+, and Zn2+, were not detected using the FP-AuNCs. These results indicate that the AuNCs-modified filter paper has highly selective adsorption for Cr3+ and Mn2+.

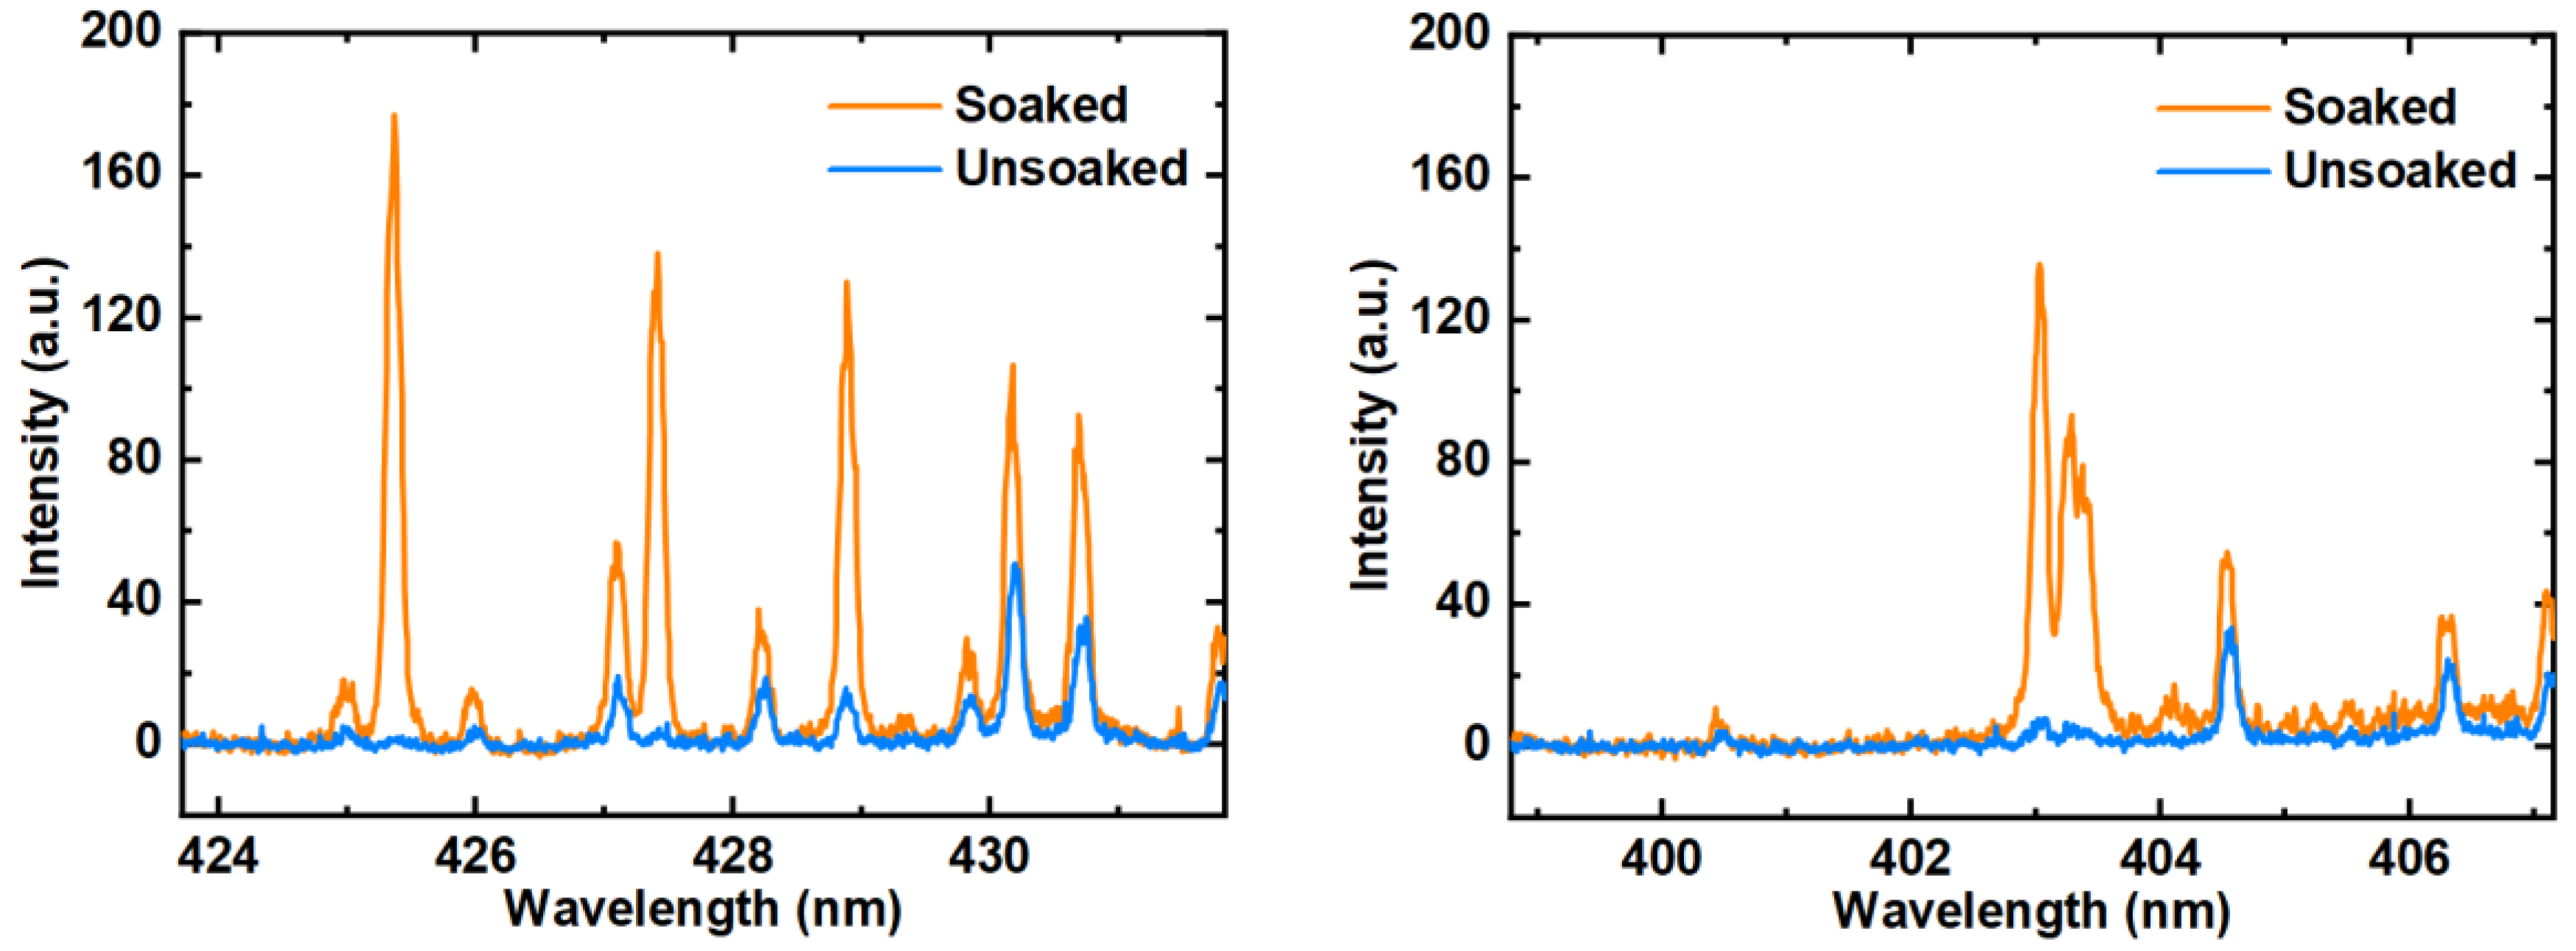
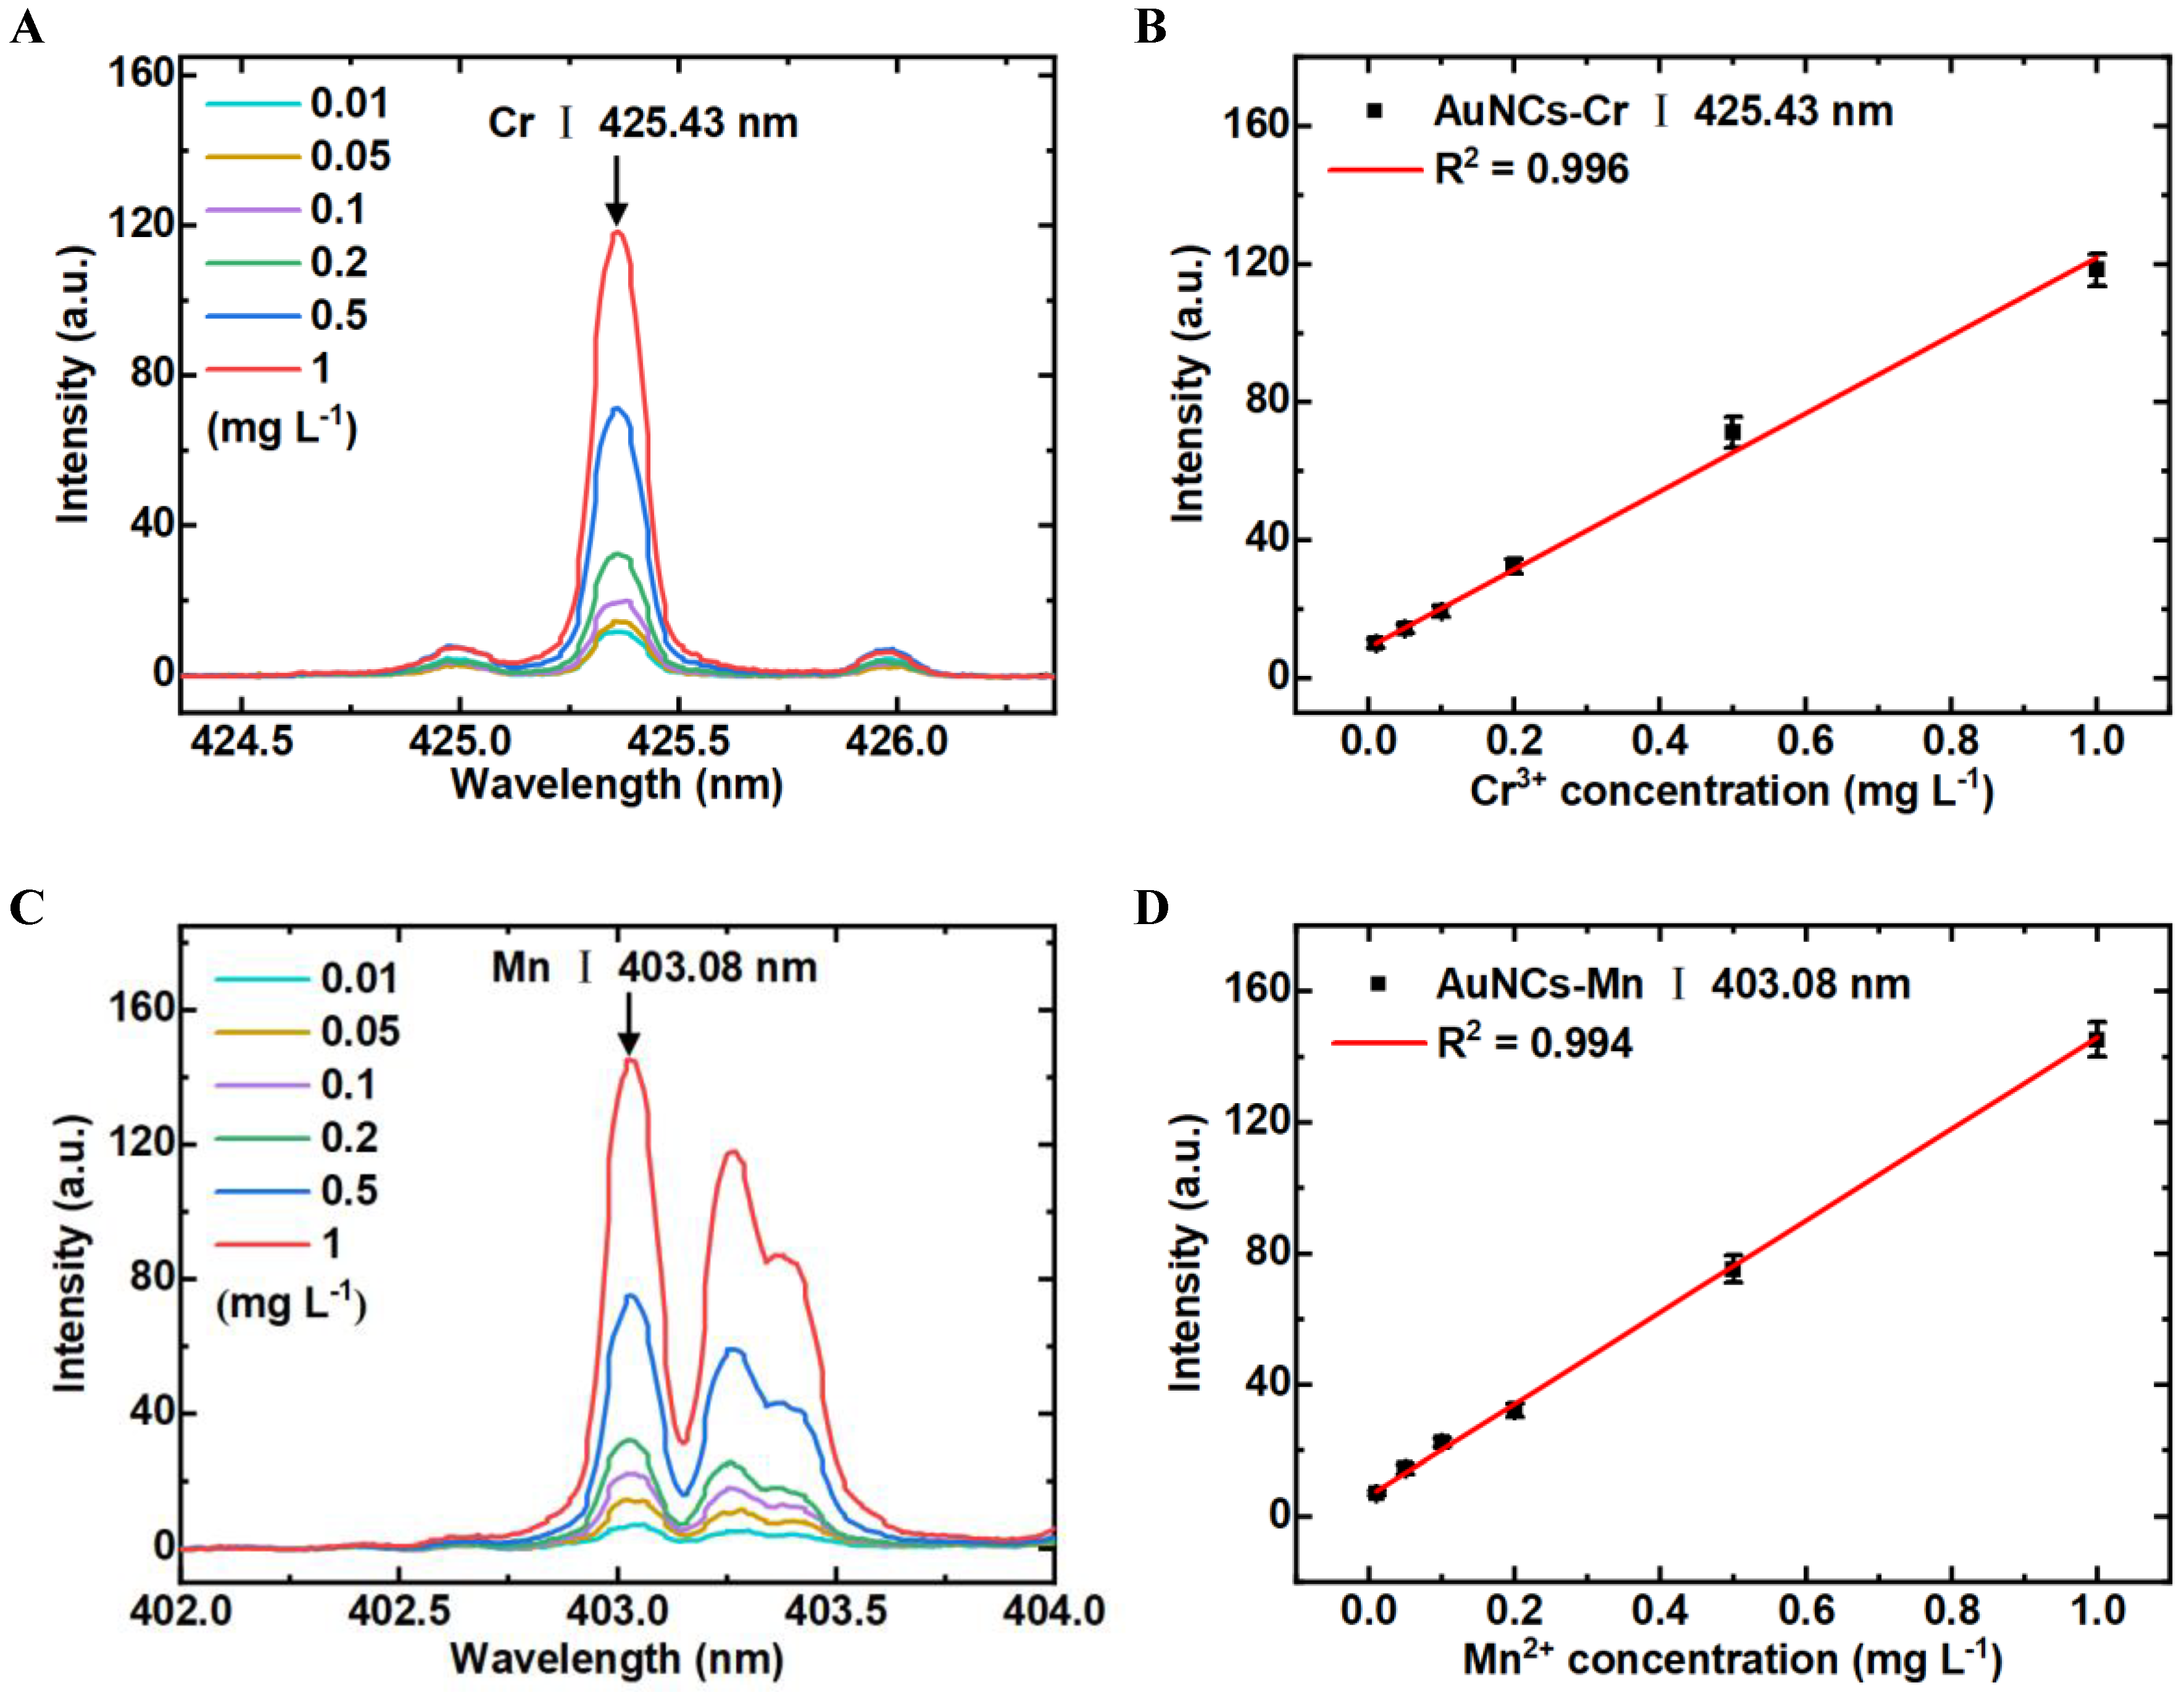
3.5. Detection Sensitivity of LIBS-FP-AuNCs for Cr3+ and Mn2+ Analysis

To assess the sensitivities of LIBS-FP-AuNCs in detecting Cr3+ and Mn2+, we examined the spectra of Cr3+ and Mn2+ at different concentrations. Each sample was measured ten times by surface scanning by one pulse per point and 2 mm distance between the successive points, and then the average intensity calculated. Quantification was performed using the coefficient of determination (R2) and LOD. Figure 7A,C show the spectra of Cr3+ and Mn2+ at different concentrations obtained by LIBS-FP-AuNCs. The spectral intensity at the characteristic peak of 425.43 nm increased with the concentration of Cr3+ from 0.01 to 1 mg L−1; the same trend was observed for Mn2+. We established a positive correlation between the intensity of the characteristic spectral line and the ion concentration. To eliminate the impact of random error, we constructed the calibration curve between the ΔLIBS intensity (the intensity of sample minus the background noise) and the heavy metal ion concentrations. Figure 7B,D show the calibration curves for Cr3+ and Mn2+ in a series of gradient aqueous solutions obtained by LIBS-FP-AuNCs. The linear ranges were 0.01–1 mg L−1 for both Cr3+ and Mn2+. The R2 were 0.996 and 0.994 for Cr3+ and Mn2+, respectively. The LOD was calculated to measure the sensitivity using the formula LOD = 3 S/k, where S is the standard deviation of the spectral background noise and k is the slope of the calibration curve. Through calculation, the LODs were 7.4 μg L−1 for Cr3+ and 9.0 μg L−1 for Mn2+, which are lower than the respective limits in Chinese standards for drinking water quality (50 μg L−1 Cr, 100 μg L−1 Mn).
To illustrate the signal stability and reproducibility of the LIBS-FP-AuNCs method, we detected five pieces of AuNCs-modified filter paper that had adsorbed Cr3+ at the same concentration (200 μg L−1). Five different positions on the filter paper were randomly selected to record the LIBS signals, and the average spectrum was obtained. The average spectral intensities of the five filter papers are shown in Figure 8. The relative standard deviation (RSD; 3.2%) was calculated based on the average spectral intensity of the five filter papers. This demonstrates that the LIBS-FP-AuNCs method possesses favorable reproducibility for Cr3+ and Mn2+ analysis.

3.6. Determination of Cr3+ and Mn2+ Ions in Real Samples

The sensing ability of the developed LIBS-FP-AuNCs method was verified for real samples. We prepared tea broth and river water for Cr3+ and Mn2+ detection, respectively. The tea broth samples were prepared by adding 200 mL of boiling deionized water to 4 g tea leaves, soaking for 5 min, and filtering the residue. The river water samples were obtained from a canal in Beijing, China. The original concentrations of Cr and Mn in the tea broth and river water samples were obtained using ICP-MS. The Cr concentration in the tea broth sample was 5.20 μg L−1, and the Mn concentration in the river water sample was 0.147 μg L−1, both of which were below the minimum detectable concentrations. Thus, the samples were spiked with 0.02, 0.06, and 0.3 mg L−1 of heavy metal ions by adding a standard solution to the original samples. The analysis results are shown in Table 1. The recoveries of Cr3+ from the spiked tea broth ranged from 94.8% to 104.5%; the recoveries of Mn2+ from the spiked river water ranged from 98.8% to 105.1%. These results demonstrate that LIBS-FP-AuNCs were able to detect Cr3+ and Mn2+ in real samples and can be applied to the analysis of water samples with minimal interference from other ions. Moreover, this method can be applied to the analysis of tea broth samples without being affected by the sample color.
We also compared our method with the results of previous studies (Table 2). Our method is low-cost, rapid, simple, and highly sensitive, and it exhibited low detection limits and wide linear ranges for Cr3+ and Mn2+. The existing detection methods are mainly based on signal changes in the physical and chemical properties of nanoparticles caused by the heavy metals. However, these detection methods may be easily affected by factors such as the pH and the presence of other ions, leading to errors in the detection results. In addition, most of the nanoparticles used in traditional methods are in a liquid phase, and it is difficult to effectively separate them from the sample matrix after heavy metal adsorption. In contrast, our method successfully separated heavy metals by liquid–solid conversion by the FP-AuNCs, and then directly detected these using LIBS. Therefore, our method can reduce the impact of external interference factors on the detection results and achieve the direct removal of heavy metals, providing a more reliable and accurate method for detection.

4. Conclusions

In this work, we developed an effective LIBS-FP-AuNCs method for the rapid, simple, and sensitive detection of Cr3+ and Mn2+. The LODs for Cr3+ and Mn2+ were 7.5 and 9.0 μg L−1, respectively, which are lower than the Chinese standards for drinking water quality. Our method was also applied to real samples, for which the recoveries ranged from 94.6% to 105.1%. Moreover, this method offers unique advantages over current methods using nanomaterials. Firstly, AuNCs-modified filter paper has the ability to adsorb and enrich Cr3+ and Mn2+ from water samples, avoiding interference from other ions. Secondly, LIBS allows for the simultaneous detection of multiple heavy metals, thereby improving the detection efficiency. Notably, the color of the solution does not influence the accuracy of the method, making it applicable for various samples, such as tea, coffee, and soil extracts. Furthermore, with the rapid development of miniaturized LIBS equipment, the method is expected to achieve and guide rapid on-site detection of other heavy metals. In summary, this method has broad application prospects in industry, agriculture, and other fields.

Author Contributions

Writing—original draft preparation, X.D.; investigation, X.D.; validation, X.D.; formal analysis, X.D.; data curation, X.D.; software, X.D. and C.S.; visualization, X.D. and C.S.; conceptualization, F.C. and S.M.; methodology, F.C. and D.D.; writing—review and editing, F.C. and S.M.; supervision, F.C.; project administration, D.D.; resources, D.D.; funding acquisition, D.D. All authors have read and agreed to the published version of the manuscript.

Funding

This research was funded by the National Natural Science Foundation of China (32225035), National Key R&D Program Young Scientist Project (2023YFD1702500), Youth Scientific Research Foundation of Beijing Academy of Agricultural and Forestry Sciences (QNJJ202223), National Natural Science Foundation of China (32301685).

Institutional Review Board Statement

Not applicable.

Informed Consent Statement

Not applicable.

Data Availability Statement

The raw data supporting the conclusions of this article will be made available by the authors on request.

Conflicts of Interest

The authors declare no conflicts of interest.

References

  1. Vareda, J.P.; Valente, A.J.M.; Durães, L. Assessment of Heavy Metal Pollution from Anthropogenic Activities and Remediation Strategies: A Review. J. Environ. Manage. 2019, 246, 101–118. [Google Scholar] [CrossRef] [PubMed]
  2. Shao, X.; Huang, B.; Zhao, Y.; Sun, W.; Gu, Z.; Qian, W. Impacts of Human Activities and Sampling Strategies on Soil Heavy Metal Distribution in a Rapidly Developing Region of China. Ecotoxicol. Environ. Saf. 2014, 104, 1–8. [Google Scholar] [CrossRef] [PubMed]
  3. Kumar, V.; Parihar, R.D.; Sharma, A.; Bakshi, P.; Singh Sidhu, G.P.; Bali, A.S.; Karaouzas, I.; Bhardwaj, R.; Thukral, A.K.; Gyasi-Agyei, Y.; et al. Global Evaluation of Heavy Metal Content in Surface Water Bodies: A Meta-Analysis Using Heavy Metal Pollution Indices and Multivariate Statistical Analyses. Chemosphere 2019, 236, 124364. [Google Scholar] [CrossRef] [PubMed]
  4. Chen, M.; Qin, X.; Zeng, G.; Li, J. Impacts of Human Activity Modes and Climate on Heavy Metal “Spread” in Groundwater Are Biased. Chemosphere 2016, 152, 439–445. [Google Scholar] [CrossRef] [PubMed]
  5. Peng, J.; Zhang, S.; Han, Y.; Bate, B.; Ke, H.; Chen, Y. Soil Heavy Metal Pollution of Industrial Legacies in China and Health Risk Assessment. Sci. Total Environ. 2022, 816, 151632. [Google Scholar] [CrossRef] [PubMed]
  6. Qing, X.; Yutong, Z.; Shenggao, L. Assessment of Heavy Metal Pollution and Human Health Risk in Urban Soils of Steel Industrial City (Anshan), Liaoning, Northeast China. Ecotoxicol. Environ. Saf. 2015, 120, 377–385. [Google Scholar] [CrossRef] [PubMed]
  7. Zheng, S.; Wang, Q.; Yuan, Y.; Sun, W. Human Health Risk Assessment of Heavy Metals in Soil and Food Crops in the Pearl River Delta Urban Agglomeration of China. Food Chem. 2020, 316, 126213. [Google Scholar] [CrossRef] [PubMed]
  8. Bjørklund, G.; Chartrand, M.S.; Aaseth, J. Manganese Exposure and Neurotoxic Effects in Children. Environ. Res. 2017, 155, 380–384. [Google Scholar] [CrossRef] [PubMed]
  9. Martins, A.C.; Krum, B.N.; Queirós, L.; Tinkov, A.A.; Skalny, A.V.; Bowman, A.B.; Aschner, M. Manganese in the Diet: Bioaccessibility, Adequate Intake, and Neurotoxicological Effects. J. Agric. Food Chem. 2020, 68, 12893–12903. [Google Scholar] [CrossRef]
  10. Mortada, W.I.; El-Naggar, A.; Mosa, A.; Palansooriya, K.N.; Yousaf, B.; Tang, R.; Wang, S.; Cai, Y.; Chang, S.X. Biogeochemical Behaviour and Toxicology of Chromium in the Soil-Water-Human Nexus: A Review. Chemosphere 2023, 331, 138804. [Google Scholar] [CrossRef]
  11. Tüzen, M. Determination of Heavy Metals in Soil, Mushroom and Plant Samples by Atomic Absorption Spectrometry. Microchem. J. 2003, 74, 289–297. [Google Scholar] [CrossRef]
  12. Tuzen, M.; Soylak, M. Multi-Element Coprecipitation for Separation and Enrichment of Heavy Metal Ions for Their Flame Atomic Absorption Spectrometric Determinations. J. Hazard. Mater. 2009, 162, 724–729. [Google Scholar] [CrossRef] [PubMed]
  13. Fernández-Martínez, R.; Rucandio, I.; Gómez-Pinilla, I.; Borlaf, F.; García, F.; Larrea, M.T. Evaluation of Different Digestion Systems for Determination of Trace Mercury in Seaweeds by Cold Vapour Atomic Fluorescence Spectrometry. J. Food Compos. Anal. 2015, 38, 7–12. [Google Scholar] [CrossRef]
  14. Wu, H.; Wang, X.; Liu, B.; Liu, Y.; Li, S.; Lu, J.; Tian, J.; Zhao, W.; Yang, Z. Simultaneous Speciation of Inorganic Arsenic and Antimony in Water Samples by Hydride Generation-Double Channel Atomic Fluorescence Spectrometry with on-Line Solid-Phase Extraction Using Single-Walled Carbon Nanotubes Micro-Column. Spectrochim. Acta Part B At. Spectrosc. 2011, 66, 74–80. [Google Scholar] [CrossRef]
  15. Pereira, J.S.F.; Moraes, D.P.; Antes, F.G.; Diehl, L.O.; Santos, M.F.P.; Guimarães, R.C.L.; Fonseca, T.C.O.; Dressler, V.L.; Flores, É.M.M. Determination of Metals and Metalloids in Light and Heavy Crude Oil by ICP-MS after Digestion by Microwave-Induced Combustion. Microchem. J. 2010, 96, 4–11. [Google Scholar] [CrossRef]
  16. Tokalıoğlu, Ş. Determination of Trace Elements in Commonly Consumed Medicinal Herbs by ICP-MS and Multivariate analysisICP-MS. Food Chem. 2012, 134, 2504–2508. [Google Scholar] [CrossRef] [PubMed]
  17. Khan, S.R.; Sharma, B.; Chawla, P.A.; Bhatia, R. Inductively Coupled Plasma Optical Emission Spectrometry (ICP-OES): A Powerful Analytical Technique for Elemental Analysis. Food Anal. Methods 2022, 15, 666–688. [Google Scholar] [CrossRef]
  18. Bozorgzadeh, E.; Pasdaran, A.; Ebrahimi-Najafabadi, H. Determination of Toxic Heavy Metals in Fish Samples Using Dispersive Micro Solid Phase Extraction Combined with Inductively Coupled Plasma Optical Emission Spectroscopy. Food Chem. 2021, 346, 128916. [Google Scholar] [CrossRef] [PubMed]
  19. Fortes, F.J.; Moros, J.; Lucena, P.; Cabalín, L.M.; Laserna, J.J. Laser-Induced Breakdown Spectroscopy. Anal. Chem. 2013, 85, 640–669. [Google Scholar] [CrossRef]
  20. Cao, F.; Jiao, F.; Ma, S.; Dong, D. Laser-Induced Breakdown Spectroscopy Mediated Amplification Sensor for Copper (II) Ions Detection Using Click Chemistry. Sens. Actuators B Chem. 2022, 371, 132594. [Google Scholar] [CrossRef]
  21. Cremers, D.A.; Chinni, R.C. Laser-Induced Breakdown Spectroscopy—Capabilities and Limitations. Appl. Spectrosc. Rev. 2009, 44, 457–506. [Google Scholar] [CrossRef]
  22. Yi, R.; Yang, X.; Zhou, R.; Li, J.; Yu, H.; Hao, Z.; Guo, L.; Li, X.; Lu, Y.; Zeng, X. Determination of Trace Available Heavy Metals in Soil Using Laser-Induced Breakdown Spectroscopy Assisted with Phase Transformation Method. Anal. Chem. 2018, 90, 7080–7085. [Google Scholar] [CrossRef] [PubMed]
  23. Zhu, C.; Tang, Z.; Li, Q.; Zhou, R.; Lv, J.; Zhang, W.; Zhan, K.; Li, X.; Zeng, X. Lead of Detection in Rhododendron Leaves Using Laser-Induced Breakdown Spectroscopy Assisted by Laser-Induced Fluorescence. Sci. Total Environ. 2020, 738, 139402. [Google Scholar] [CrossRef] [PubMed]
  24. Bilge, G.; Sezer, B.; Boyaci, I.H.; Eseller, K.E.; Berberoglu, H. Performance Evaluation of Laser Induced Breakdown Spectroscopy in the Measurement of Liquid and Solid Samples. Spectrochim. Acta Part B At. Spectrosc. 2018, 145, 115–121. [Google Scholar] [CrossRef]
  25. Babushok, V.I.; DeLucia, F.C.; Gottfried, J.L.; Munson, C.A.; Miziolek, A.W. Double Pulse Laser Ablation and Plasma: Laser Induced Breakdown Spectroscopy Signal Enhancement. Spectrochim. Acta Part B At. Spectrosc. 2006, 61, 999–1014. [Google Scholar] [CrossRef]
  26. Díaz Pace, D.M.; D’Angelo, C.A.; Bertuccelli, D.; Bertuccelli, G. Analysis of Heavy Metals in Liquids Using Laser Induced Breakdown Spectroscopy by Liquid-to-Solid Matrix Conversion. Spectrochim. Acta Part B At. Spectrosc. 2006, 61, 929–933. [Google Scholar] [CrossRef]
  27. Zhang, J.R.; Zeng, A.L.; Luo, H.Q.; Li, N.B. Fluorescent Silver Nanoclusters for Ultrasensitive Determination of Chromium(VI) in Aqueous Solution. J. Hazard. Mater. 2016, 304, 66–72. [Google Scholar] [CrossRef] [PubMed]
  28. Wang, F.; Zhang, Y.; Lu, M.; Du, Y.; Chen, M.; Meng, S.; Ji, W.; Sun, C.; Peng, W. Near-Infrared Band Gold Nanoparticles-Au Film “Hot Spot” Model Based Label-Free Ultratrace Lead (II) Ions Detection via Fiber SPR DNAzyme Biosensor. Sens. Actuators B Chem. 2021, 337, 129816. [Google Scholar] [CrossRef]
  29. Rajamanikandan, R.; Ilanchelian, M.; Ju, H. Smartphone-Enabled Colorimetric Visual Quantification of Highly Hazardous Trivalent Chromium Ions in Environmental Waters and Catalytic Reduction of p-Nitroaniline by Thiol-Functionalized Gold Nanoparticles. Chemosphere 2023, 340, 139838. [Google Scholar] [CrossRef]
  30. Ma, S.; Cao, F.; Wen, X.; Xu, F.; Tian, H.; Fu, X.; Dong, D. Detection of Heavy Metal Ions Using Laser-Induced Breakdown Spectroscopy Combined with Filter Paper Modified with PtAg Bimetallic Nanoparticles. J. Hazard. Mater. 2023, 443, 130188. [Google Scholar] [CrossRef]
  31. Skotadis, E.; Tsekenis, G.; Chatzipetrou, M.; Patsiouras, L.; Madianos, L.; Bousoulas, P.; Zergioti, I.; Tsoukalas, D. Heavy Metal Ion Detection Using DNAzyme-Modified Platinum Nanoparticle Networks. Sens. Actuators B Chem. 2017, 239, 962–969. [Google Scholar] [CrossRef]
  32. Xie, J.; Zheng, Y.; Ying, J.Y. Protein-Directed Synthesis of Highly Fluorescent Gold Nanoclusters. J. Am. Chem. Soc. 2009, 131, 888–889. [Google Scholar] [CrossRef] [PubMed]
  33. Bi, X.; Li, L.; Niu, Q.; Liu, X.; Luo, L.; Jiang, H.; You, T. Highly Fluorescent Magnetic ATT-AuNCs@ZIF-8 for All-in-One Detection and Removal of Hg2+: An Ultrasensitive Probe to Evaluate Its Removal Efficiency. Inorg. Chem. 2023, 62, 3123–3133. [Google Scholar] [CrossRef] [PubMed]
  34. Shi, Z.; Hu, B.; Ge, S.; Chi, B.; Yan, X.; Zheng, X. Facile Preparation of Bimetallic Au-Cu Nanoclusters as Fluorescent Nanoprobes for Sensitive Detection of Cr3+ and S2O82− Ions. Spectrochim. Acta. A. Mol. Biomol. Spectrosc. 2023, 301, 122855. [Google Scholar] [CrossRef] [PubMed]
  35. Chen, W.; Cao, F.; Zheng, W.; Tian, Y.; Xianyu, Y.; Xu, P.; Zhang, W.; Wang, Z.; Deng, K.; Jiang, X. Detection of the Nanomolar Level of Total Cr[(III) and (VI)] by Functionalized Gold Nanoparticles and a Smartphone with the Assistance of Theoretical Calculation Models. Nanoscale 2015, 7, 2042–2049. [Google Scholar] [CrossRef] [PubMed]
  36. Dong, C.; Wu, G.; Wang, Z.; Ren, W.; Zhang, Y.; Shen, Z.; Li, T.; Wu, A. Selective Colorimetric Detection of Cr(III) and Cr(VI) Using Gallic Acid Capped Gold Nanoparticles. Dalton Trans. 2016, 45, 8347–8354. [Google Scholar] [CrossRef] [PubMed]
  37. Meena, R.; Mehta, V.N.; Bhamore, J.R.; Rao, P.T.; Park, T.-J.; Kailasa, S.K. Diaminodiphenyl Sulfone as a Novel Ligand for Synthesis of Gold Nanoparticles for Simultaneous Colorimetric Assay of Three Trivalent Metal Cations (Al3+, Fe3+ and Cr3+). J. Mol. Liq. 2020, 312, 113409. [Google Scholar] [CrossRef]
  38. Manjubaashini, N.; Daniel Thangadurai, T.; Bharathi, G.; Nataraj, D. Rhodamine Capped Gold Nanoparticles for the Detection of Cr3+ Ion in Living Cells and Water Samples. J. Lumin. 2018, 202, 282–288. [Google Scholar] [CrossRef]
  39. Ejeta, S.Y.; Imae, T. Selective Colorimetric and Electrochemical Detections of Cr(III) Pollutant in Water on 3-Mercaptopropionic Acid-Functionalized Gold Plasmon Nanoparticles. Anal. Chim. Acta 2021, 1152, 338272. [Google Scholar] [CrossRef] [PubMed]
  40. Wu, G.; Dong, C.; Li, Y.; Wang, Z.; Gao, Y.; Shen, Z.; Wu, A. A Novel AgNPs-Based Colorimetric Sensor for Rapid Detection of Cu2+ or Mn2+ via pH Control. RSC Adv. 2015, 5, 20595–20602. [Google Scholar] [CrossRef]
  41. Annadhasan, M.; Muthukumarasamyvel, T.; Sankar Babu, V.R.; Rajendiran, N. Green Synthesized Silver and Gold Nanoparticles for Colorimetric Detection of Hg2+, Pb2+, and Mn2+ in Aqueous Medium. ACS Sustain. Chem. Eng. 2014, 2, 887–896. [Google Scholar] [CrossRef]
  42. Desai, M.L.; Basu, H.; Singhal, R.K.; Saha, S.; Kailasa, S.K. Ultra-Small Two Dimensional MXene Nanosheets for Selective and Sensitive Fluorescence Detection of Ag+ and Mn2+ Ions. Colloids Surf. Physicochem. Eng. Asp. 2019, 565, 70–77. [Google Scholar] [CrossRef]
  43. George, J.M.; Priyanka, R.N.; Mathew, B. Bimetallic Ag–Au Nanoparticles as pH Dependent Dual Sensing Probe for Mn(II) Ion and Ciprofloxacin. Microchem. J. 2020, 155, 104686. [Google Scholar] [CrossRef]
Figure 1. Schematic illustration of the LIBS-FP-AuNCs sensor for heavy metal detection: (A) schematic diagram of the LIBS system; (B) schematic diagram of the heavy metal adsorption by AuNCs-modified filter paper; and (C) spectra of Cr and Mn.
Biosensors 14 00267 g001
Figure 2. Schematic diagram of the preparation of the AuNCs-modified filter papers, including the synthesis of AuNCs and the modification of filter papers. The AuNCs solution and the AuNCs-modified filter paper emitted red fluorescence under 365 nm ultraviolet light.
Biosensors 14 00267 g002
Figure 3. Spectral intensities of Cr and Mn using filter papers modified with different materials.
Biosensors 14 00267 g003
Figure 4. LIBS spectra of AuNCs-modified filter paper soaked and unsoaked in Cr3+ and Mn2+ solution.
Biosensors 14 00267 g004
Figure 5. (A,B) SEM images of filter paper modified with AuNPs, (C,D) SEM and TEM images of AuNCs, and (E) SEM image of unmodified filter paper. (FH) Elemental mapping images of FP-AuNCs after adsorption of Cr3+ and Mn2+.
Biosensors 14 00267 g005
Figure 6. (A) Optimization of the adsorption time of Cr3+ on the FP-AuNCs. (B) Spectral intensities of different elements using LIBS-FP-AuNCs.
Biosensors 14 00267 g006
Figure 7. LIBS spectra under different concentrations of Cr3+ (A) and Mn2+ (B). Relationship of Cr3+ (C) and Mn2+ (D) between the spectral intensities and the concentrations detected using LIBS-FP-AuNCs.
Biosensors 14 00267 g007
Figure 8. Cr spectral intensities of five filter papers modified with AuNCs.
Biosensors 14 00267 g008
Table 1. Analysis of Cr and Mn in single-element spiked samples.
Real SampleSample No.Target Ions
(Original Concentration)
Added
(mg L−1)
Founded
(mg L−1)
Recovery
Tea broth1Cr
(5.20 μg L−1)
0--
2 0.020.026
±0.005
102.1%
3 0.060.065
±0.017
99.7%
4 0.30.288
±0.018
94.6%
River water5Mn
(0.147 μg L−1)
0--
6 0.020.020
±0.005
98.8%
7 0.060.063
±0.007
104.6%
8 0.30.316
±0.025
105.1%
Table 2. Comparison of our results with previous work.
MaterialExisting FormTarget IonsDetection MethodLODRef.
GA-AuNPsLiquidCr3+Colorimetric1.5 μM[36]
DDS-AuNPsLiquidCr3+UV–vis spectra0.78 μM[37]
Rh6G-AuNPsLiquidCr3+Fluorescence9.28 µM[38]
AuNPs@3-mpaLiquidCr3+Electrochemistry5.36 µM[39]
AgNPsLiquidMn2+Colorimetric0.5 µM[40]
SiNPsLiquidMn2+UV–vis spectra0.54 μM[41]
Ti3C2 MXene nanosheetsLiquidMn2+Fluorescence0.11 μM[42]
(Ag-Au)mixNPsLiquidMn2+Electrochemistry8.42 μM[43]
AuNCsSolidCr3+LIBS0.15 μMThis work
Mn2+ 0.17 μM
Disclaimer/Publisher’s Note: The statements, opinions and data contained in all publications are solely those of the individual author(s) and contributor(s) and not of MDPI and/or the editor(s). MDPI and/or the editor(s) disclaim responsibility for any injury to people or property resulting from any ideas, methods, instructions or products referred to in the content.

