A Neuroelectronic Interface with Microstructured Substrates for Spiral Ganglion Neurons Cultured In Vitro: Proof of Concept


Abstract
1. Introduction
2. Materials and Methods
3. Results
3.1. Impedance and Stimulation Artifact Measurement
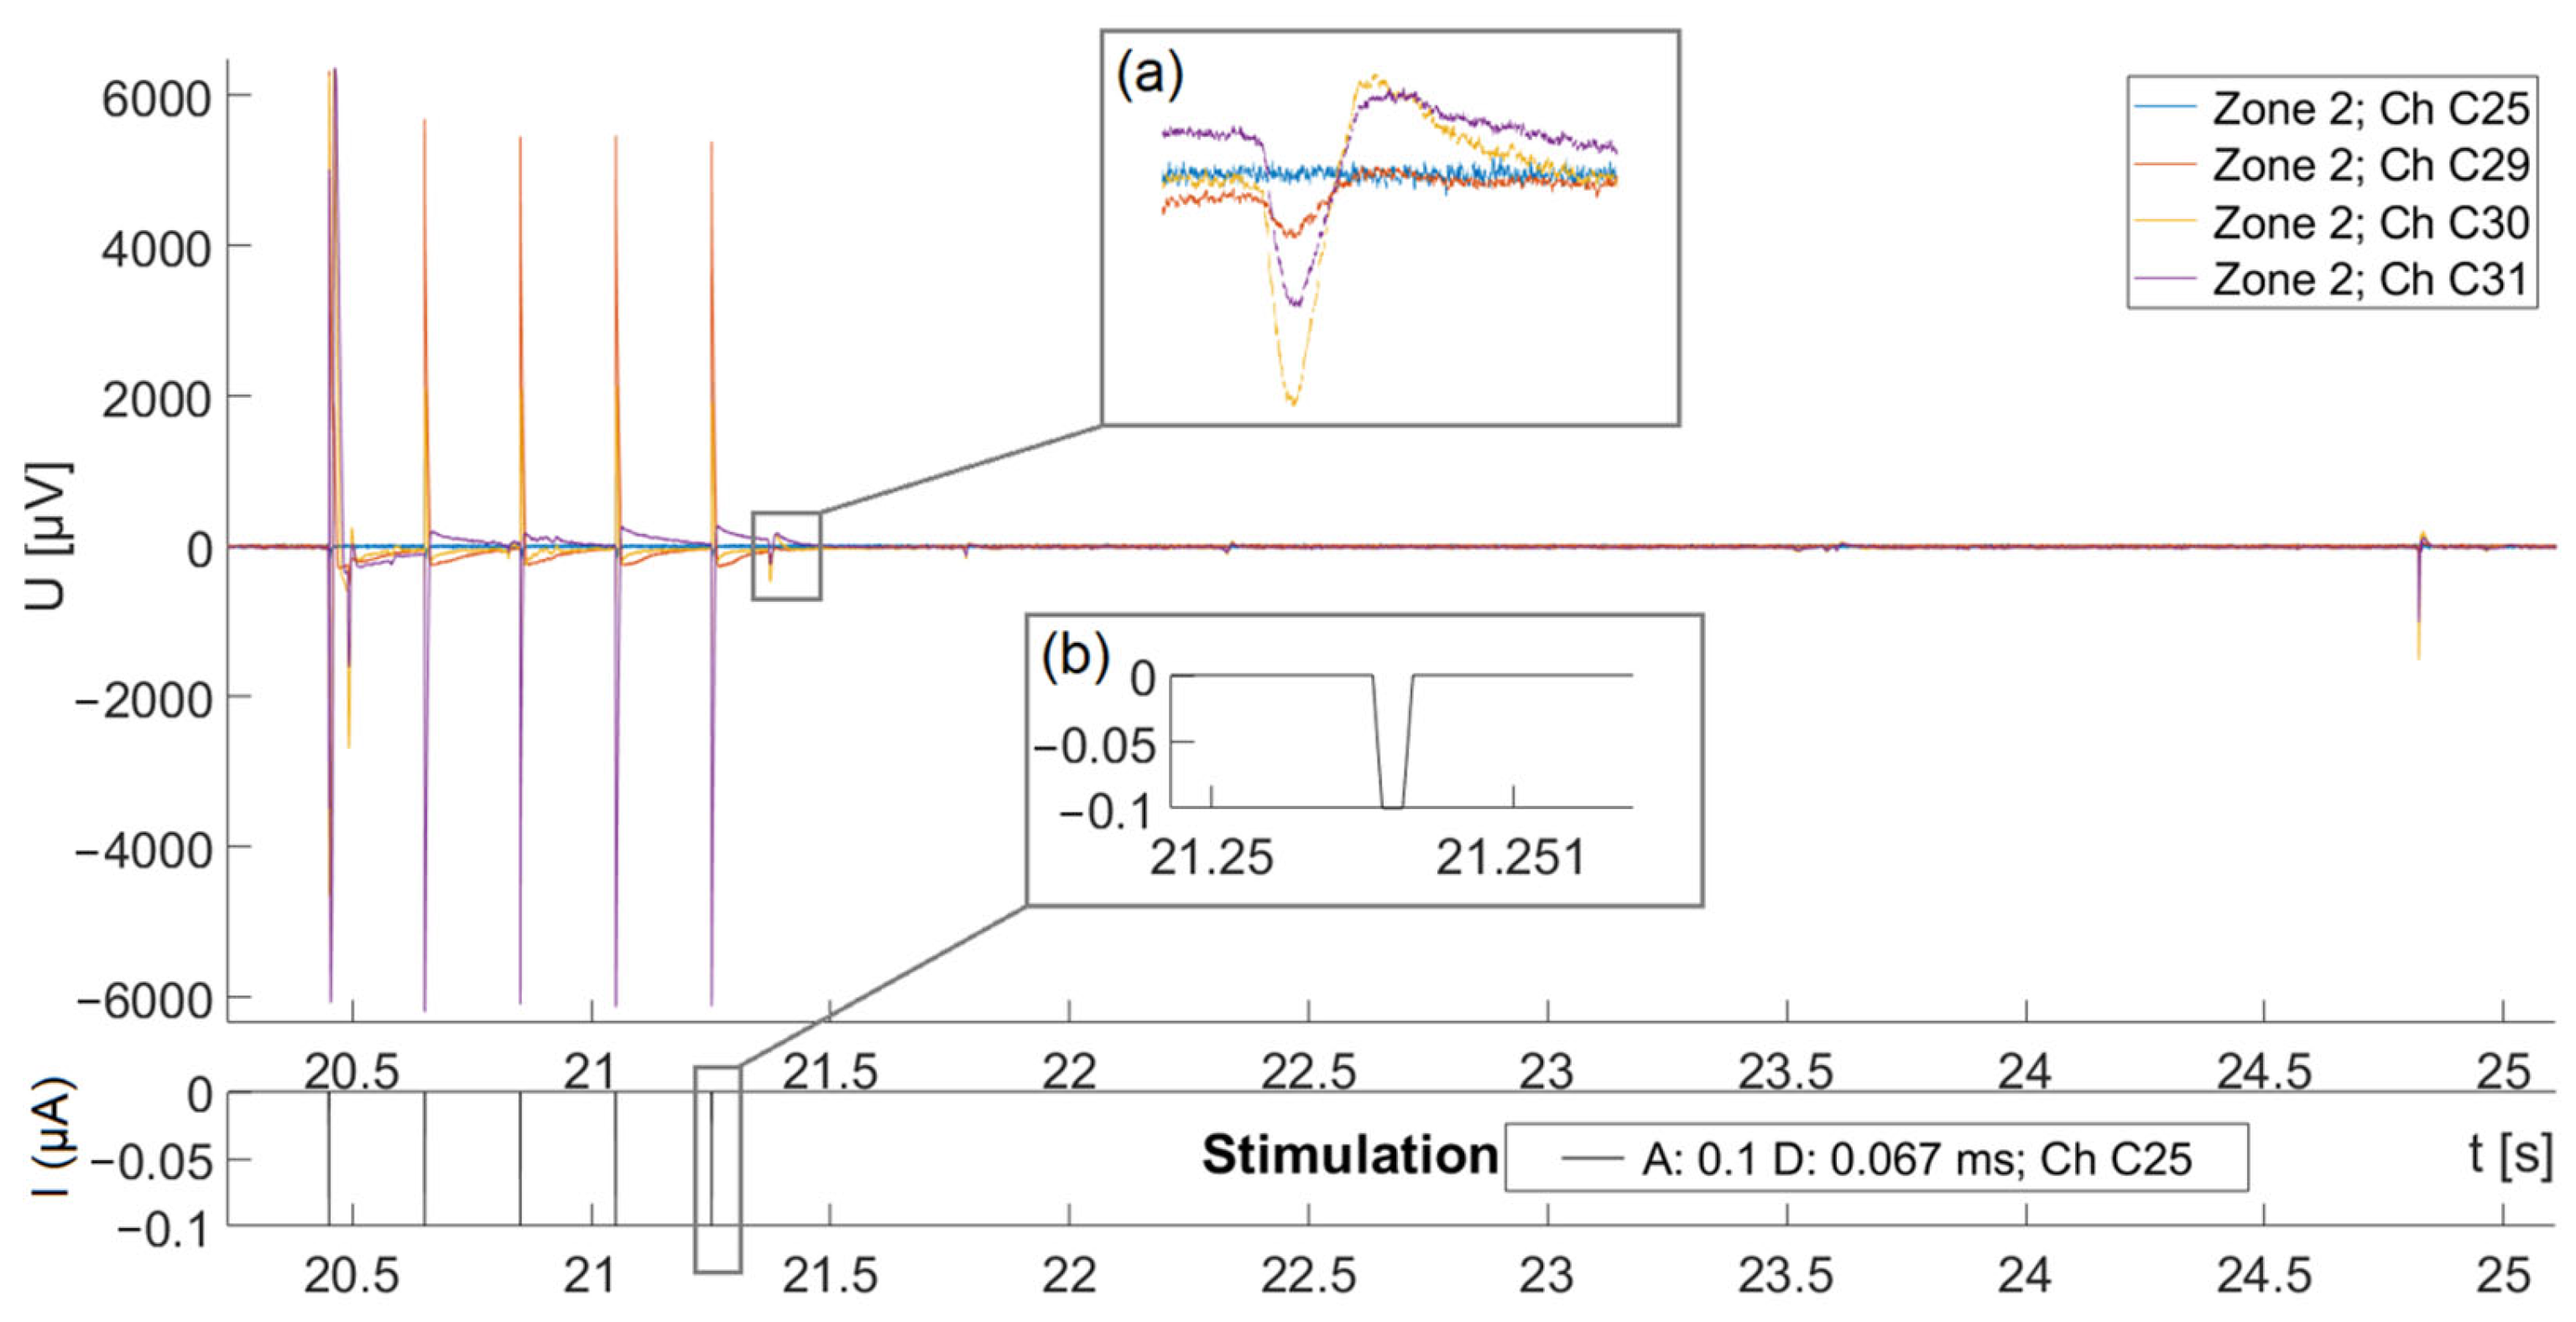
3.2. Electrical Stimulation and Successful Recording of Local Field Potentials
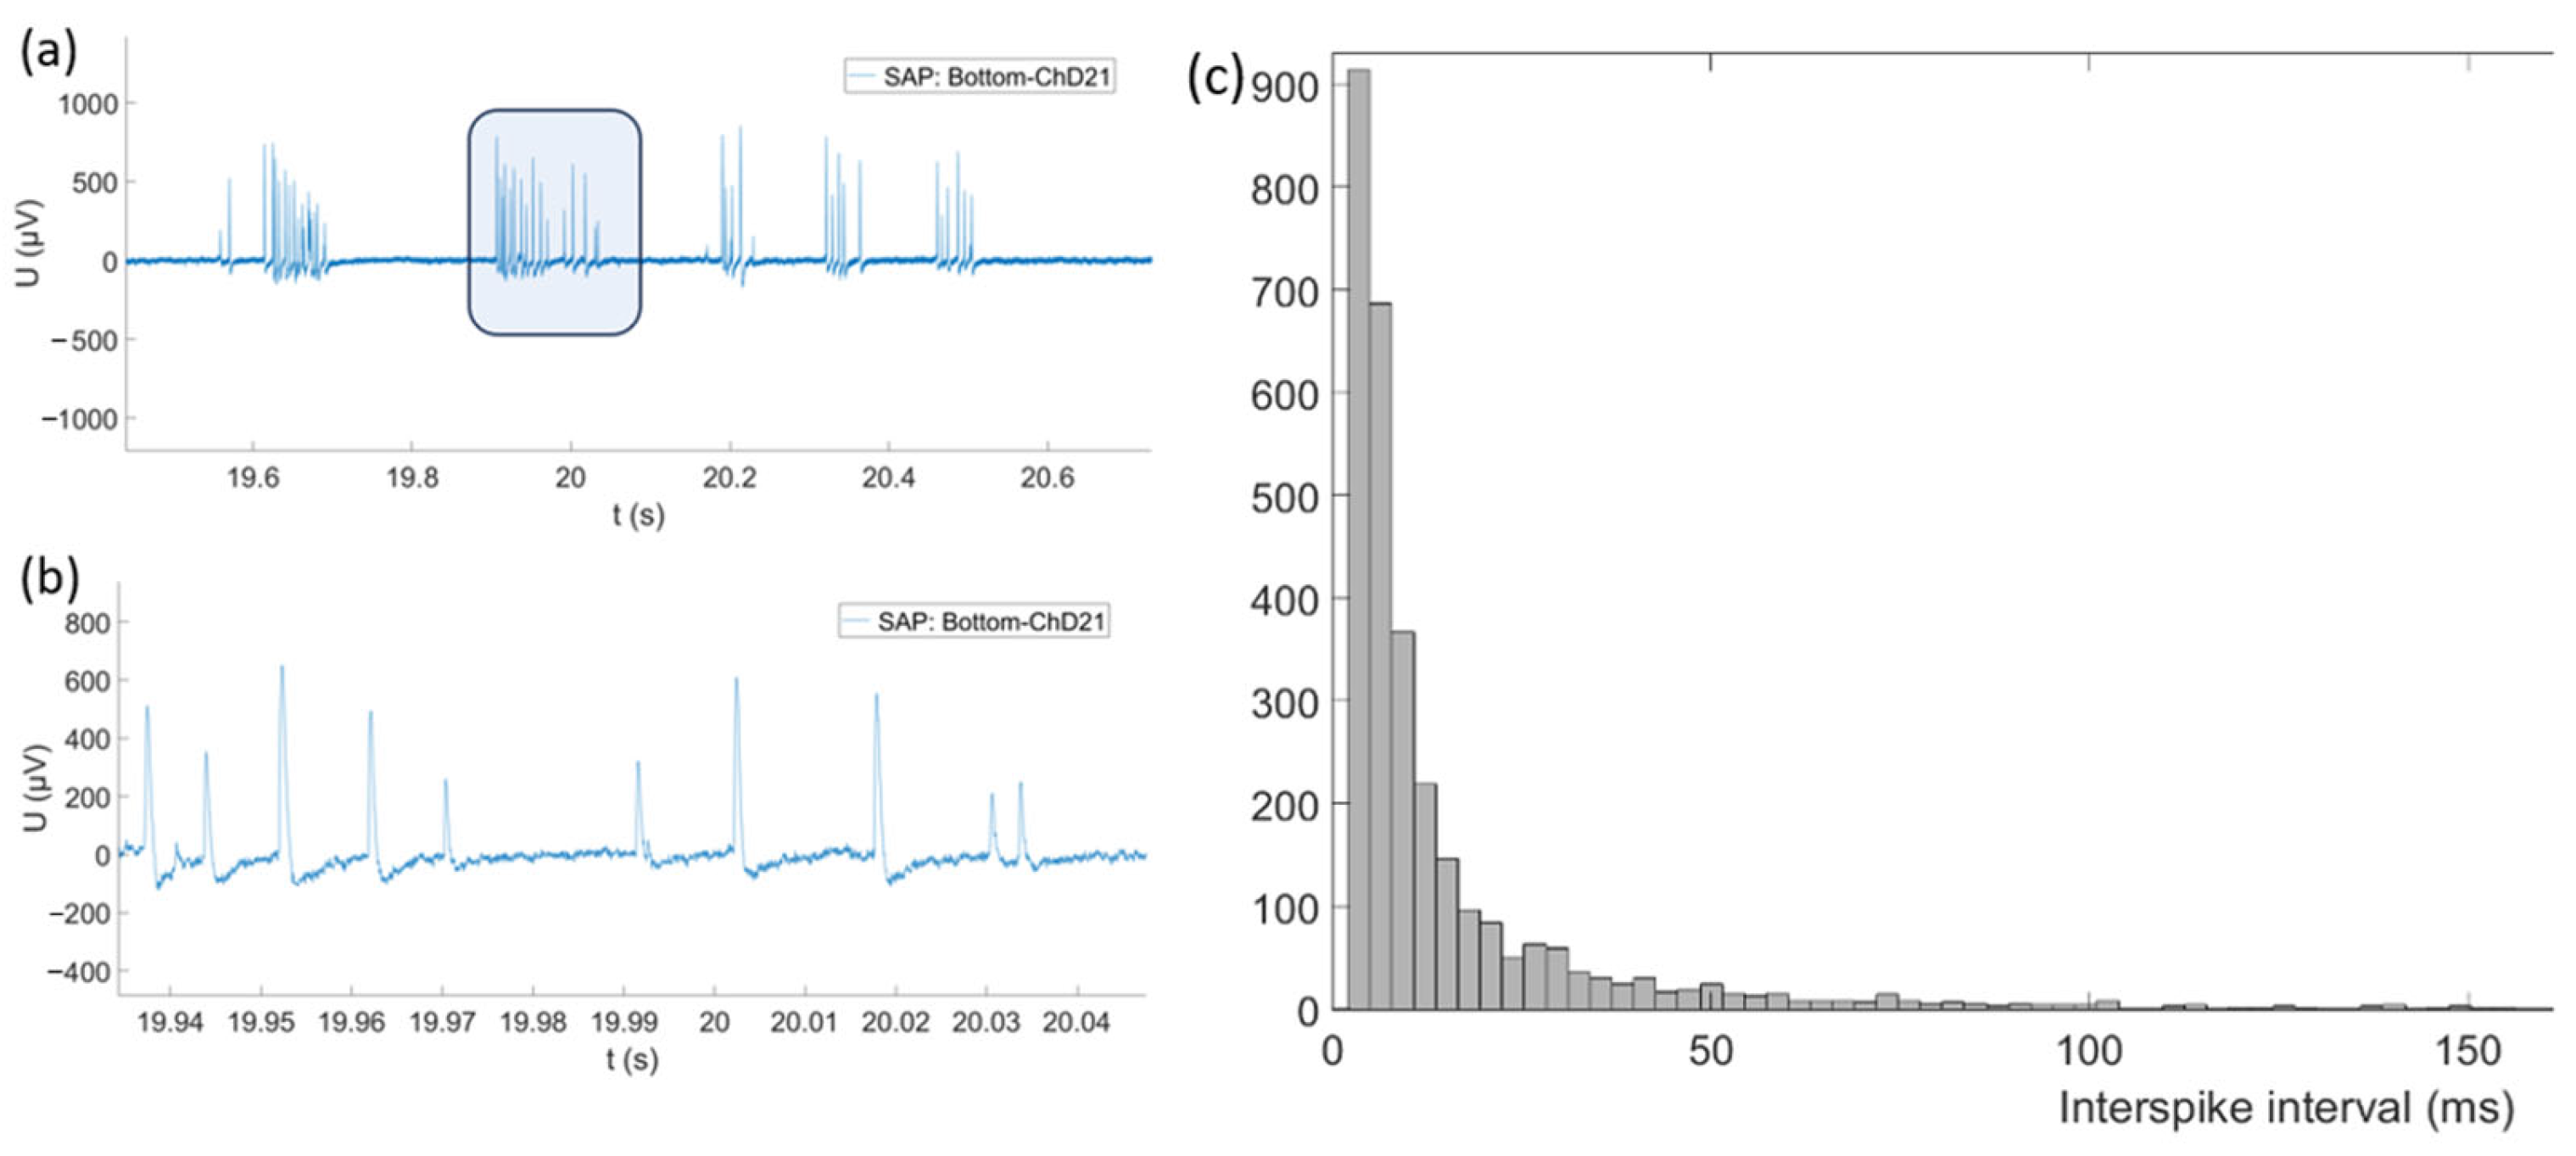
3.3. Recording of Spontaneous Electrophysiological Activity
4. Discussion
5. Conclusions
Author Contributions
Funding
Institutional Review Board Statement
Informed Consent Statement
Data Availability Statement
Acknowledgments
Conflicts of Interest
Abbreviations
| MEA | Microelectrode array |
| SGN | Spiral ganglion neuron |
| CG | Contact guidance |
| CI | Cochlear implant |
| ECM | Extracellular matrix |
| NCD | Nanocrystalline diamond |
| IHC | Inner hair cell |
| AP | Action potential |
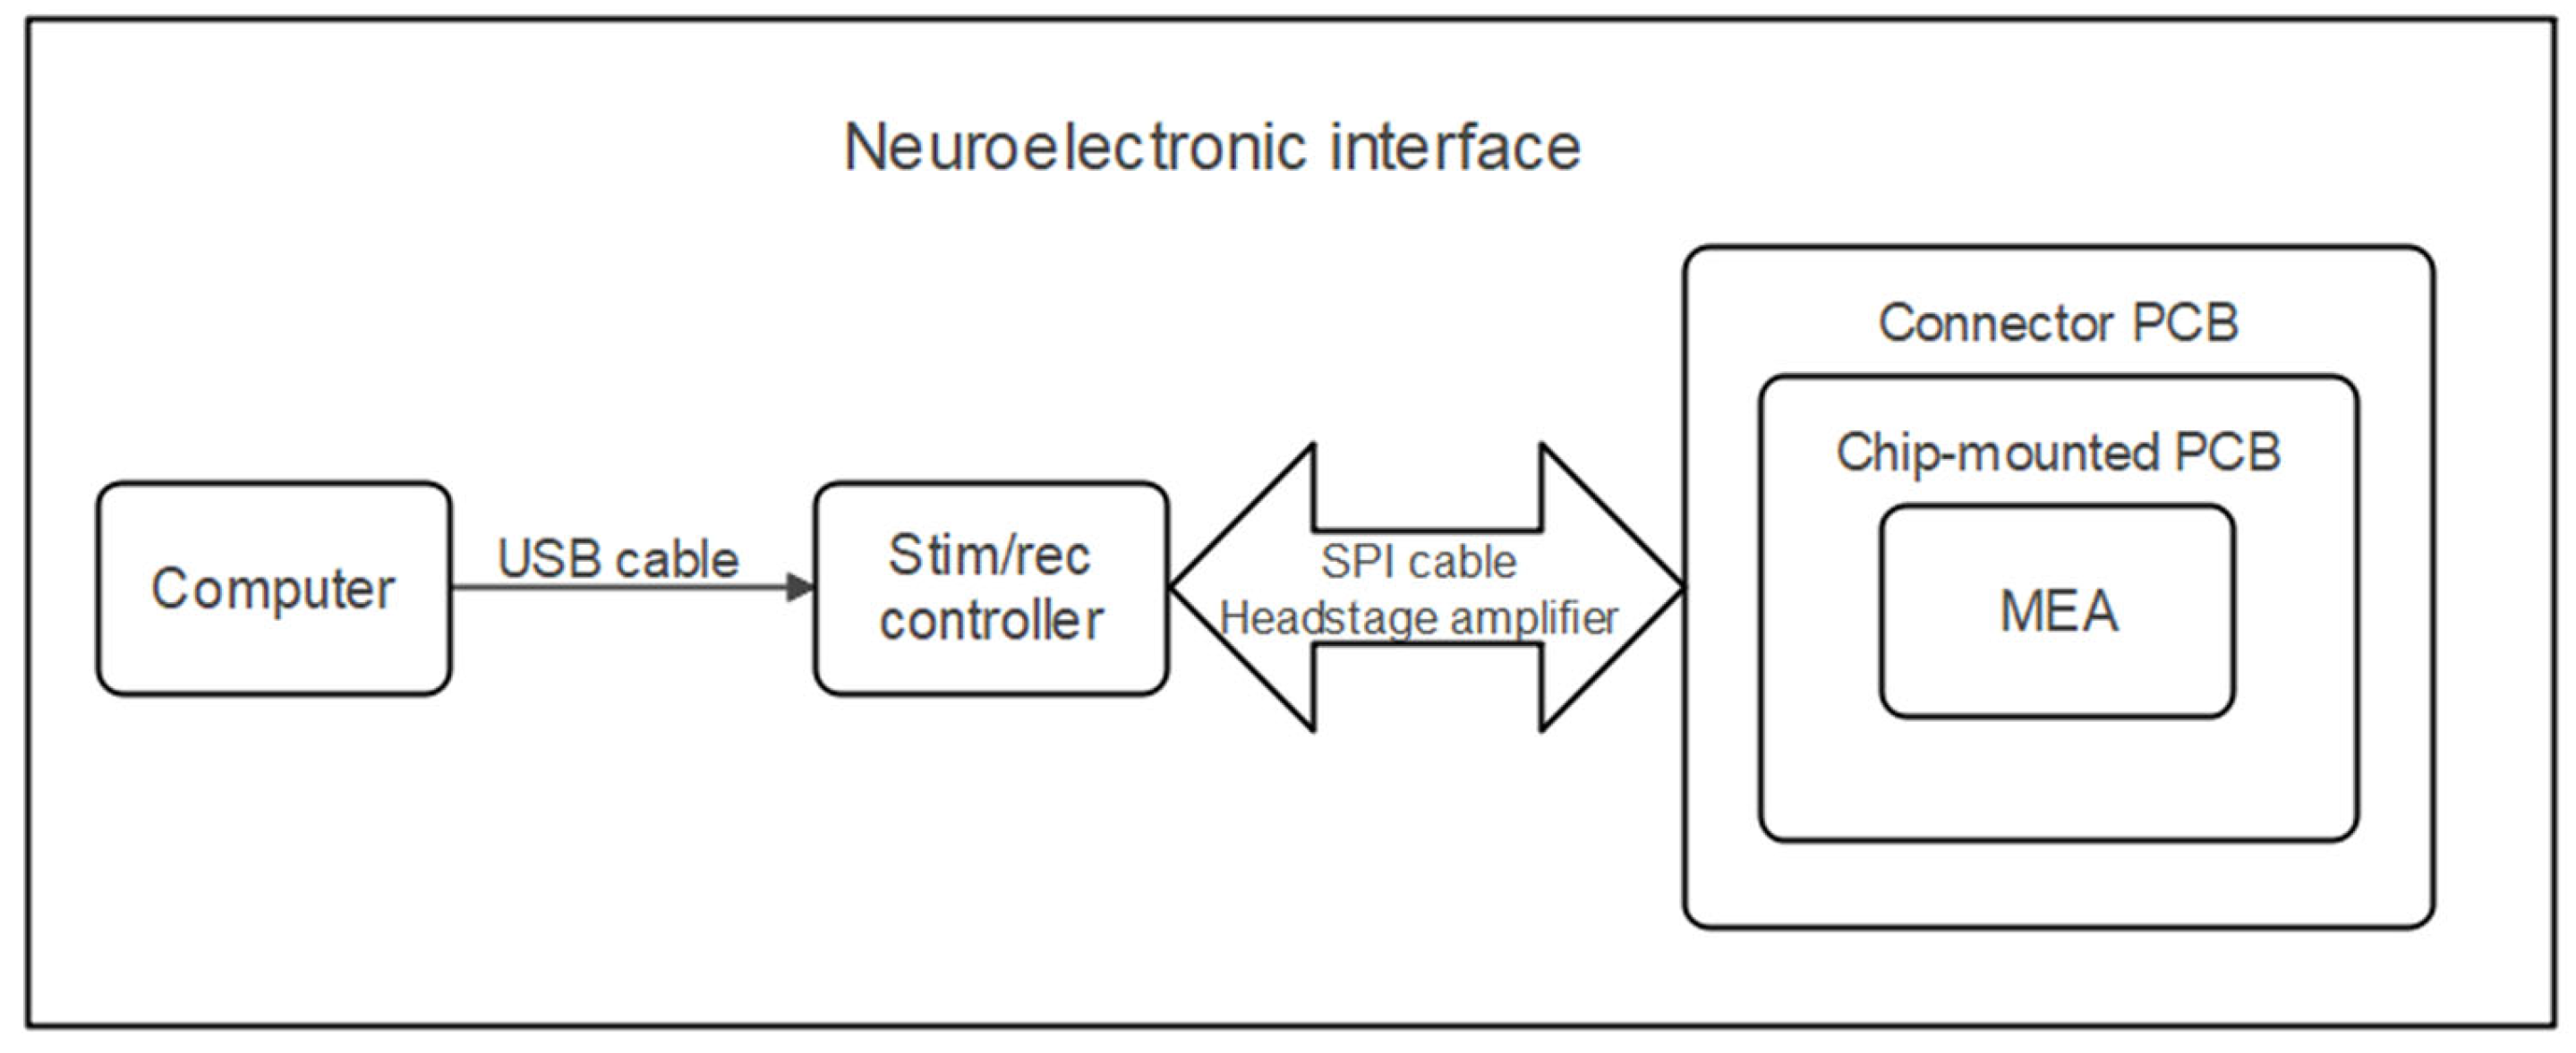
| NEI | Neuroelectronic interface |
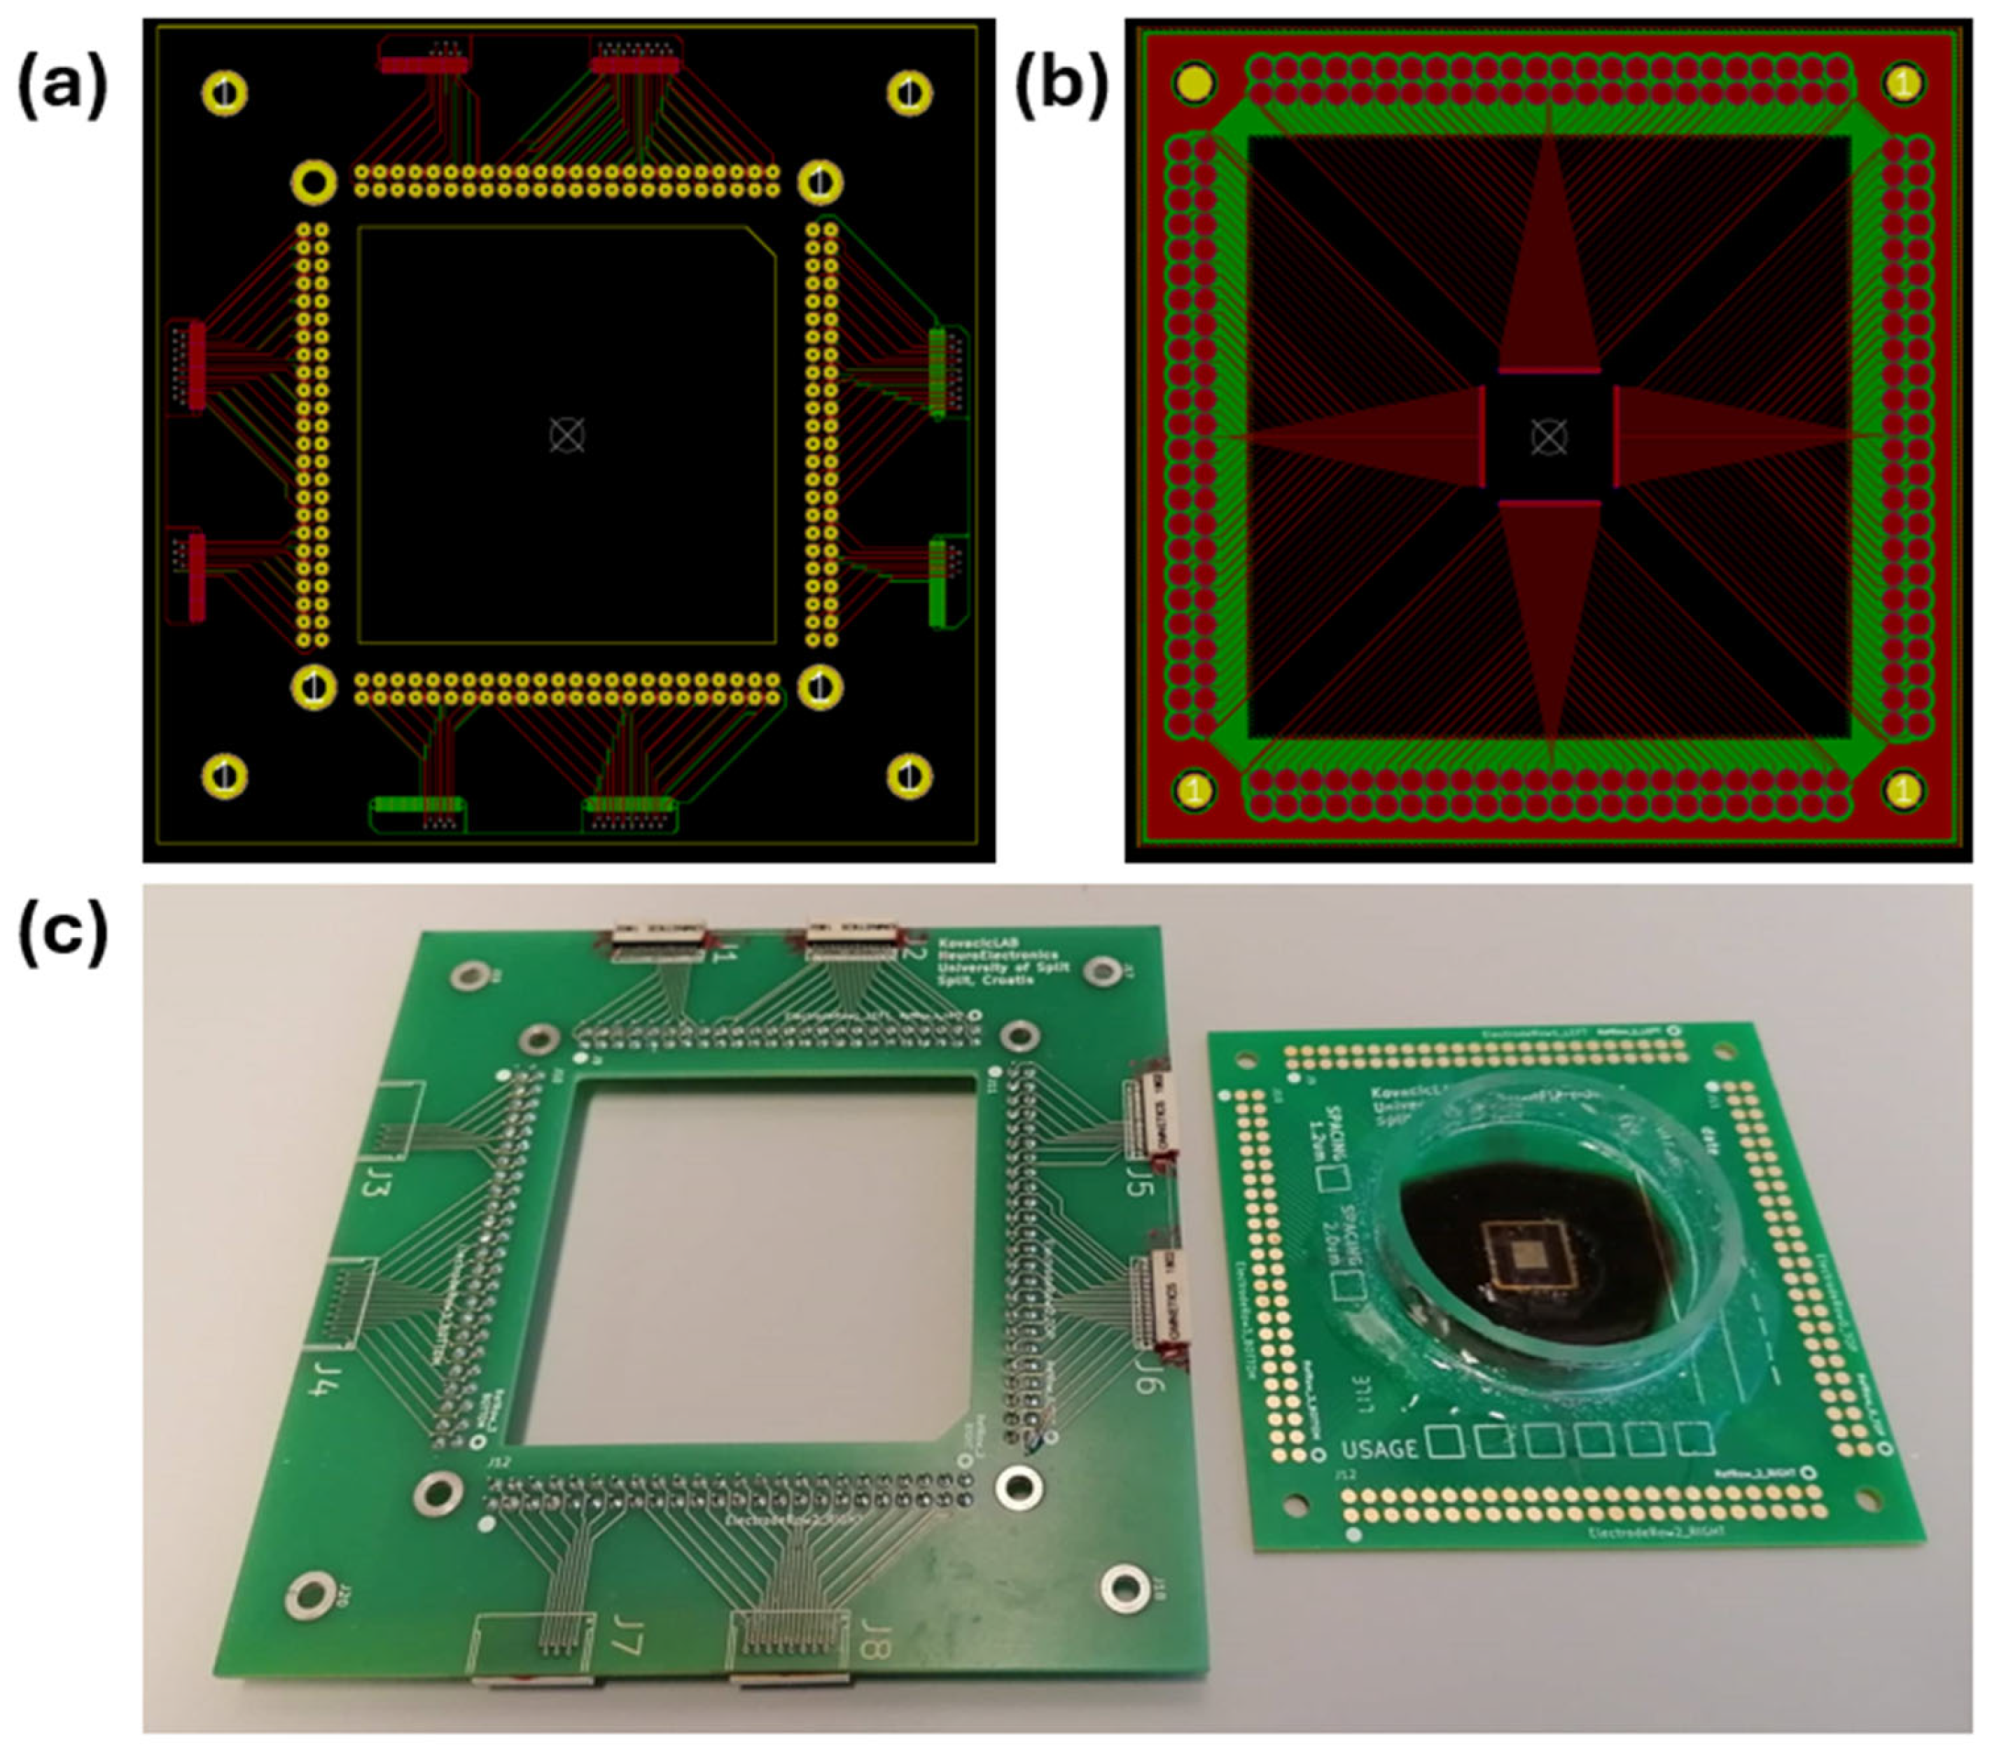
| PCB | Printed circuit board |
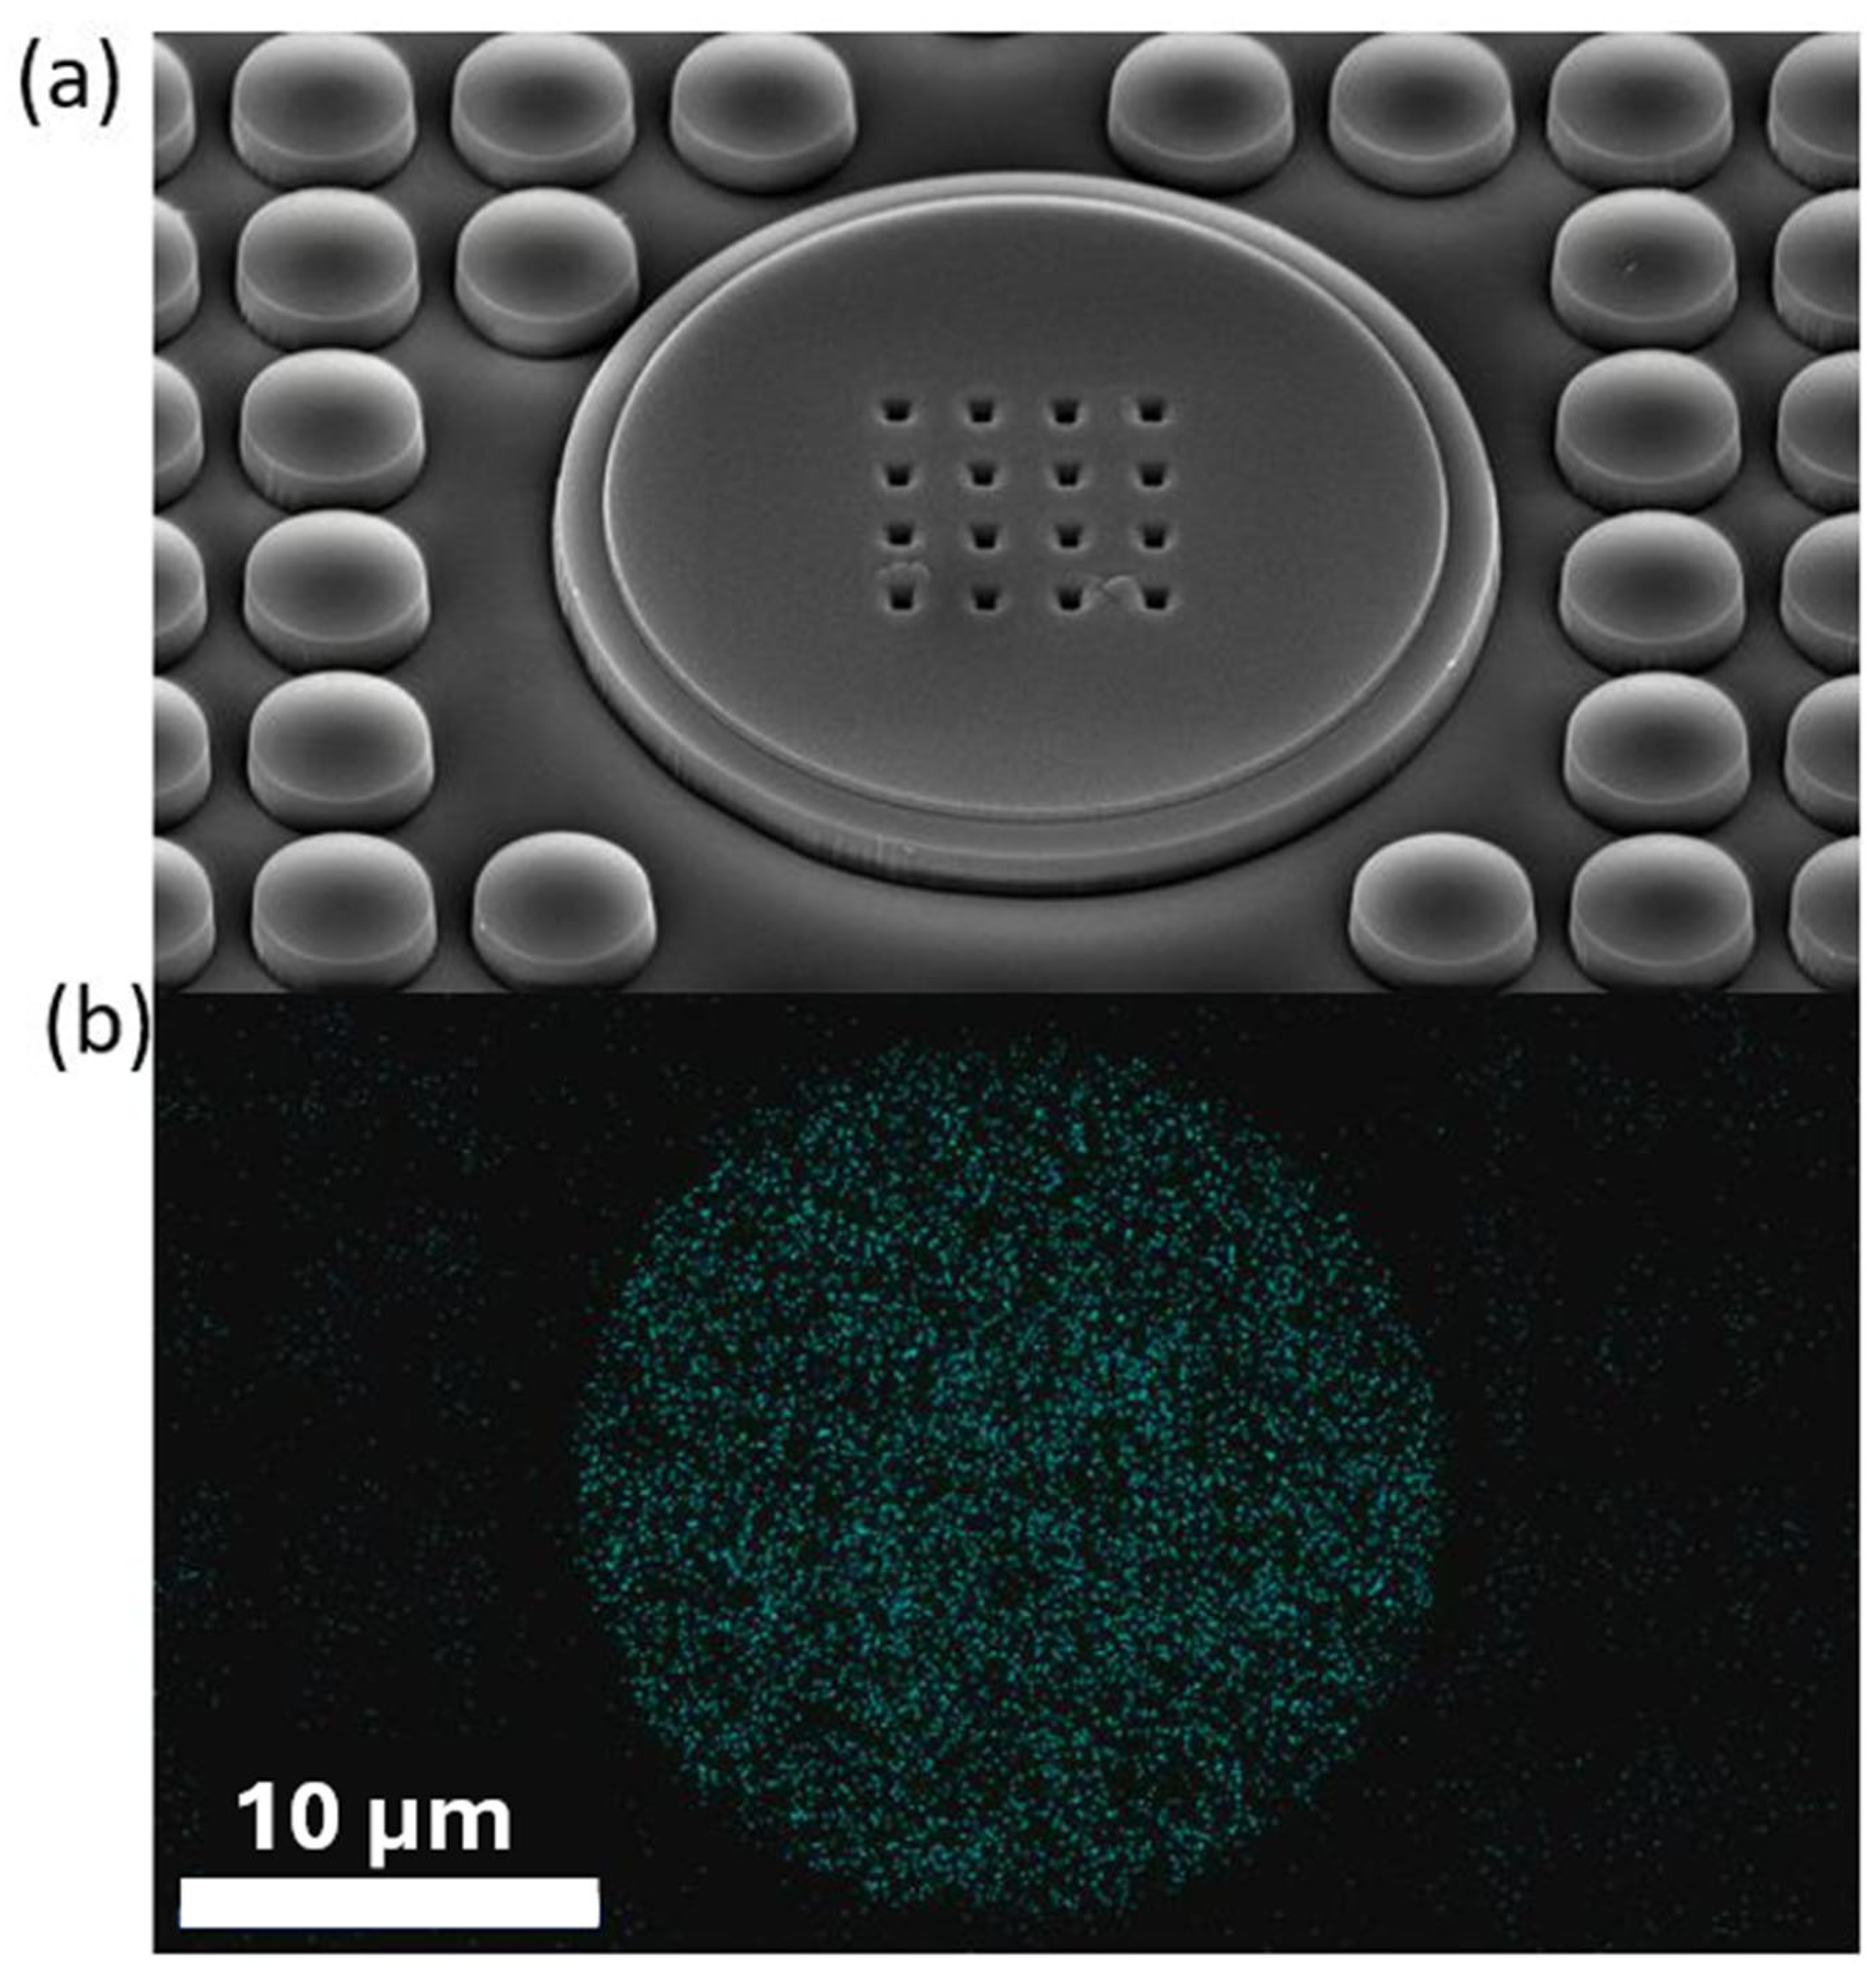
| SEM | Scanning electron microscopy |
| EDS | Energy dispersive spectroscopy |
| SPI | Serial peripheral interface |
| LFP | Local field potential |
| PBS | Phosphate-buffered saline |
| BSA | Bovine serum albumin |
| DIV | Days in vitro |
| SAP | Spontaneous action potential |
| ISI | Interspike interval |
| NAG | Neuroanatomical gap |
| EC | Electrical coupling |
References
- Thomas, C.A.; Springer, P.A.; Loeb, G.E.; Berwald-Netter, Y.; Okun, L.M. A miniature microelectrode array to monitor the bioelectric activity of cultured cells. Exp. Cell Res. 1972, 74, 61–66. [Google Scholar] [CrossRef] [PubMed]
- Gross, G. The use of neuronal networks on multielectrode arrays as biosensors. Biosens. Bioelectron. 1995, 10, 553–567. [Google Scholar] [CrossRef] [PubMed]
- Spira, M.E.; Hai, A. Multi-electrode array technologies for neuroscience and cardiology. Nat. Nanotechnol. 2013, 8, 83–94. [Google Scholar] [CrossRef]
- Liu, Y.; Xu, S.; Yang, Y.; Zhang, K.; He, E.; Liang, W.; Luo, J.; Wu, Y.; Cai, X. Nanomaterial-based microelectrode arrays for in vitro bidirectional brain–computer interfaces: A review. Microsyst. Nanoeng. 2023, 9, 13. [Google Scholar] [CrossRef]
- Cerina, M.; Piastra, M.C.; Frega, M. The potential of in vitro neuronal networks cultured on micro electrode arrays for biomedical research. Prog. Biomed. Eng. 2023, 5, 032002. [Google Scholar] [CrossRef]
- Frey, U.; Sedivy, J.; Heer, F.; Pedron, R.; Ballini, M.; Mueller, J. Switch-Matrix-Based High-Density Microelectrode Array in CMOS Technology. IEEE J. Solid-State Circuits 2010, 45, 467–482. [Google Scholar] [CrossRef]
- Radivojevic, M.; Jäckel, D.; Altermatt, M.; Mueller, J.; Viswam, V.; Hierlemann, A.; Bakkum, D.J. Electrical Identification and Selective Microstimulation of Neuronal Compartments Based on Features of Extracellular Action Potentials. Sci. Rep. 2016, 6, 31332. [Google Scholar] [CrossRef]
- Hahnewald, S.; Tscherter, A.; Marconi, E.; Streit, J.; Widmer, H.R.; Garnham, C.; Benav, H.; Mueller, M.; Löwenheim, H.; Roccio, M. Response profiles of murine spiral ganglion neurons on multi-electrode arrays. J. Neural Eng. 2015, 13, 016011. [Google Scholar] [CrossRef]
- Hahnewald, S.; Roccio, M.; Tscherter, A.; Streit, J.; Ambet, R.; Senn, P. Spiral Ganglion Neuron Explant Culture and Electrophysiology on Multi Electrode. J. Vis. Exp. 2016, 116, 54538. [Google Scholar] [CrossRef]
- Harrison, R.G. The cultivation of tissues in extraneous media as a method of morpho-genetic study. Anat. Rec. 1912, 6, 181–193. [Google Scholar] [CrossRef]
- Weiss, P. The Problem of Specificity in Growth and Development. Yale J. Biol. Med. 1947, 19, 235–278. Available online: https://pmc.ncbi.nlm.nih.gov/articles/PMC2602102/ (accessed on 21 December 2024). [PubMed]
- Curtis, A.S.G.; Varde, M. Control of Cell Behavior: Topological Factors. JNCI 1964, 33, 15–26. [Google Scholar] [CrossRef] [PubMed]
- Lutolf, M.P.; Hubbell, J.A. Synthetic biomaterials as instructive extracellular microenvironments for morphogenesis in tissue engineering. Nat. Biotechnol. 2005, 23, 47–55. [Google Scholar] [CrossRef]
- Bettinger, C.J.; Riehle, M.O.; Gadegaard, N.; Affrossman, S.; Curtis, A.S.G. Engineering Substrate Topography at the Micro- and Nanoscale to Control Cell Function. Angew. Chem. Int. Ed. 2009, 48, 5406–5415. [Google Scholar] [CrossRef]
- Dalby, M.J.; Giannaras, D.; Riehle, M.O.; Gadegaard, N.; Affrossman, S.; Curtis, A.S.G. Rapid fibroblast adhesion to 27 nm high polymer demixed nano-topography. Biomaterials 2004, 25, 77–83. [Google Scholar] [CrossRef]
- Jeon, H.; Koo, S.; Reese, M.; Loskill, P.; Grigoropoulos, C.P.; Healy, H.E. Directing cell migration and organization via nanocrater-patterned cell-repellent interfaces. Nat. Mater. 2015, 14, 918–923. [Google Scholar] [CrossRef]
- Hoffman-Kim, D.; Mitchel, J.A.; Bellamkonda, R.V. Topography, Cell Response, and Nerve Regeneration. Annu. Rev. Biomed. Eng. 2010, 12, 203–231. [Google Scholar] [CrossRef]
- Nguyen, A.V.; Sathe, S.R.; Yim, E.K.F. From nano to micro: Topographical scale and its impact on cell adhesion, morphology and contact guidance. J. Condens. Matter Phys. 2016, 28, 183001. [Google Scholar] [CrossRef]
- Rajnicek, A.M.; McCaig, C.D. Guidance of CNS growth cones by substratum grooves and ridges: Effects of inhibitors of the cytoskeleton, calcium channels and signal transduction pathways. J. Cell Sci. 1997, 110, 2915–2924. [Google Scholar] [CrossRef]
- Johansson, F.; Carlberg, P.; Danielsen, N.; Montelius, L.; Kanje, M. Axonal outgrowth on nano-imprinted patterns. Biomaterials 2006, 27, 1251–1258. [Google Scholar] [CrossRef]
- Chua, J.S.; Chng, C.P.; Moe, A.A.K.; Tann, J.Y.; Goh, E.L.K.; Chiam, K.; Yim, E.K.F. Extending neurites sense the depth of the underlying topography during neuronal differentiation and contact guidance. Biomaterials 2014, 34, 7750–7761. [Google Scholar] [CrossRef] [PubMed]
- Fozdar, D.Y.; Lee, J.Y.; Schmidt, C.E.; Chen, S. Hippocampal neurons respond uniquely to topographies of various sizes and shapes. Biofabrication 2010, 2, 035005. [Google Scholar] [CrossRef] [PubMed]
- Dowell-Mesfin, N.M.; Abdul-Karim, M.A.; Turner, A.M.P.; Schanz, S.; Craighead, H.G.; Roysam, B.; Turner, J.N.; Shain, W. Topographically modified surfaces affect orientation and growth of hippocampal neurons. J. Neural Eng. 2004, 1, 78–90. [Google Scholar] [CrossRef] [PubMed]
- Micholt, L.; Gärtner, A.; Prodanov, D.; Braeken, D.; Dotti, C.G.; Bartic, C. Substrate Topography Determines Neuronal Polarization and Growth In Vitro. PLoS ONE 2013, 8, e66170. [Google Scholar] [CrossRef]
- Bugnicourt, G.; Brocard, J.; Nicolas, A.; Villard, C. Nanoscale Surface Topography Reshapes Neuronal Growth in Culture. Langmuir 2014, 30, 4441–4449. [Google Scholar] [CrossRef]
- Park, M.; Oh, E.; Seo, J.; Kim, M.H.; Cho, H.; Choi, J.Y.; Lee, H.; Choi, I.S. Neurites: Control over Neurite Directionality and Neurite Elongation on Anisotropic Micropillar Arrays. Small 2016, 12, 1147. [Google Scholar] [CrossRef]
- Clarke, J.C.; Tuft, B.W.; Clinger, J.D.; Levine, R.; Figueroa, L.S.; Guyman, C.A.; Hansen, M.R. Micropatterned methacrylate polymers direct spiral ganglion neurite and Schwann cell growth. Hear. Res. 2011, 278, 96–105. [Google Scholar] [CrossRef]
- Tuft, B.W.; Li, S.; Xu, L.; Clarke, J.C.; White, S.P.; Guyman, B.A.; Perez, K.X.; Hansen, M.R.; Guyman, C.A. Photopolymerized microfeatures for directed spiral ganglion neurite and Schwann cell growth. Biomaterials 2013, 34, 42–54. [Google Scholar] [CrossRef]
- Leigh, B.W.; Truong, K.; Bartholomew, R.; Ramirez, M.; Hansen, M.R.; Guyman, C.A. Tuning Surface and Topographical Features to Investigate Competitive Guidance of Spiral Ganglion Neurons. ACS Appl. Mater. Interfaces 2017, 9, 31488–31496. [Google Scholar] [CrossRef]
- Xu, L.; Seline, A.E.; Leigh, B.; Ramirez, M.; Guyman, C.A.; Hansen, M.R. Photopolymerized Microfeatures Guide Adult Spiral Ganglion and Dorsal Root Ganglion Neurite Growth. Otol. Neurotol. 2018, 39, 119–126. [Google Scholar] [CrossRef]
- Truong, K.; Leigh, B.; Vecchi, J.T.; Bartholomew, R.; Xu, L.; Guyman, C.A.; Hansen, M.R. Interaction of micropatterned topographical and biochemical cues to direct neurite growth from spiral ganglion neurons. Hear. Res. 2021, 409, 108315. [Google Scholar] [CrossRef] [PubMed]
- Cai, Y.; Edin, F.; Jin, Z.; Alexsson, A.; Gudjonsson, O.; Liu, W.; Rask-Andersen, H.; Karlsson, M.; Li, H. Guided auditory neuron growth on topographically modified nanocrystalline diamond. Acta Biomater. 2016, 31, 211–220. [Google Scholar] [CrossRef] [PubMed]
- Mattotti, M.; Micholt, L.; Braeken, D.; Kovačić, D. Characterization of spiral ganglion neurons cultured on silicon micro-pillar substrates for new auditory neuro-electronic interfaces. J. Neural Eng. 2015, 12, 026001. [Google Scholar] [CrossRef]
- Radotić, V.; Braeken, D.; Drviš, P.; Mattotti, M.; Kovačić, D. Advantageous environment of micro-patterned, high-density complementary metal–oxide–semiconductor electrode array for spiral ganglion neurons cultured in vitro. Sci. Rep. 2018, 8, 7446. [Google Scholar] [CrossRef]
- Radotić, V.; Bedalov, A.; Drviš, P.; Braeken, D.; Kovačić, D. Guided growth with aligned neurites in adult spiral ganglion neurons cultured in vitro on silicon micro-pillar substrates. J. Neural Eng. 2019, 16, 066037. [Google Scholar] [CrossRef]
- Beutner, D.; Moser, T. The Presynaptic Function of Mouse Cochlear Inner Hair Cells during Development of Hearing. J. Neurosci. 2001, 21, 4593–4599. [Google Scholar] [CrossRef]
- Blankenship, A.G.; Feller, M.B. Mechanisms underlying spontaneous patterned activity in developing neural circuits. Nat. Rev. Neurosci. 2009, 11, 18–29. [Google Scholar] [CrossRef]
- Tritsch, N.X.; Yi, E.; Gale, J.E.; Glowatzki, E.; Bergles, D.E. The origin of spontaneous activity in the developing auditory system. Nature 2007, 450, 50–55. [Google Scholar] [CrossRef]
- Tritsch, N.X.; Bergles, D.E. Developmental regulation of spontaneous activity in the Mammalian cochlea. J. Neurosci. 2010, 30, 1539–1550. [Google Scholar] [CrossRef]
- Sun, S.; Babola, T.; Pregernig, G.; So, K.S.; Nguyen, M.; Su, S.S.M.; Palermo, A.T.; Bergles, D.E.; Burns, J.C.; Müller, U. Hair Cell Mechanotransduction Regulates Spontaneous Activity and Spiral Ganglion Subtype Specification in the Auditory System. Cell 2018, 174, 1247–1263. [Google Scholar] [CrossRef]
- Zhang-Hooks, Y.; Agarwal, A.; Mishina, M.; Bergles, D.E. NMDA Receptors Enhance Spontaneous Activity and Promote Neuronal Survival in the Developing Cochlea. Neuron 2016, 89, 337–350. [Google Scholar] [CrossRef] [PubMed]
- Esch, T.; Lemmon, V.; Banker, G. Local Presentation of Substrate Molecules Directs Axon Specification by Cultured Hippocampal Neurons. J. Neurosci. 1999, 19, 6417–6426. [Google Scholar] [CrossRef] [PubMed]
- Zolessi, F.R.; Poggi, L.; Sviderskaya, E.V.; Chien, C.-B.; Harris, W.H. Polarization and orientation of retinal ganglion cells in vivo. Neural Dev. 2006, 1, 2. [Google Scholar] [CrossRef] [PubMed]
- Arimura, N.; Kaibuchi, K. Neuronal polarity: From extracellular signals to intracellular mechanisms. Nat. Rev. Neurosci. 2007, 8, 194–205. [Google Scholar] [CrossRef]
- Rusznák, Z.; Szűcs, G. Spiral ganglion neurones: An overview of morphology, firing behaviour, ionic channels and function. Pflug. Arch. Eur. J. Physiol. 2008, 457, 1303–1325. [Google Scholar] [CrossRef]
- Druckenbrod, N.R.; Hale, E.B.; Olukoya, O.O.; Shatzer, W.E.; Goodrich, L.V. Neuronal processes and glial precursors form a scaffold for wiring the developing mouse cochlea. Nat. Commun. 2020, 11, 5586. [Google Scholar] [CrossRef]
- Sun, G.; Liu, W.; Fan, Z.; Zhang, D.; Han, Y.; Xu, L.; Qi, J.; Zhang, S.; Gao, B.T.; Bai, X.; et al. The Three-Dimensional Culture System with Matrigel and Neurotrophic Factors Preserves the Structure and Function of Spiral Ganglion Neuron In Vitro. Neural Plast. 2016, 2016, 4280407. [Google Scholar] [CrossRef]
- Szabó, Z.; Harasztosi, C.; Szûcs, G.; Sziklai, I.; Rusznák, Z. A detailed procedure and dissection guide for the isolation of spiral ganglion cells of the guinea pig for electrophysiological experiments. Brain Res. Brain Res. Protoc. 2003, 10, 139–147. [Google Scholar] [CrossRef]
- Vieria, M.; Christensen, B.L.; Wheeler, B.C.; Feng, A.S.; Kollmar, R. Survival and stimulation of neurite outgrowth in a serum-free culture of spiral ganglion neurons from adult mice. Hear. Res. 2007, 230, 17–23. [Google Scholar] [CrossRef]
- Mattotti, M.; Alvarez, Z.; Ortega, J.A.; Planell, J.A.; Engel, E.; Alcántara, S. Inducing functional radial glia-like progenitors from cortical astrocyte cultures using micropatterned PMMA. Biomaterials 2012, 33, 1759–1770. [Google Scholar] [CrossRef]
- Eutener, S.; Yang, K.H.; Chavez, E.; Leichtle, A.; Loers, G.; Olshansky, A.; Pak, K.; Schachner, M.; Ryan, A.F. Glial cell line-derived neurotrophic factor (GDNF) induces neuritogenesis in the cochlear spiral ganglion via neural cell adhesion molecule (NCAM). Mol. Cell. Neurosci. 2013, 54, 30–43. [Google Scholar] [CrossRef] [PubMed]
- Manley, G.A.; Robertson, D. Analysis of spontaneous activity of auditory neurones in the spiral ganglion of the guinea-pig cochlea. J. Physiol. 1976, 258, 323–336. [Google Scholar] [CrossRef] [PubMed]
- Buzsáki, G. Large-scale recording of neuronal ensembles. Nat. Neurosci. 2004, 7, 446–451. [Google Scholar] [CrossRef]
- World Health Organization. Deafness and Hearing Loss. Available online: https://www.who.int/news-room/fact-sheets/detail/deafness-and-hearing-loss (accessed on 15 June 2024).
- Zeng, F.-G. Celebrating the one millionth cochlear implant. JASA Express Lett. 2022, 2, 077201. [Google Scholar] [CrossRef]
- Zeng, F.-G.; Rebscher, S.; Harrison, W.; Sun, X.; Feng, H. Cochlear Implants: System Design, Integration, and Evaluation. IEEE Rev. Biomed. Eng. 2008, 1, 115–142. [Google Scholar] [CrossRef]
- Nadol, J.B.; Burgess, B.J.; Gantz, B.J.; Cocker, N.J.; Ketten, D.R.; Kos, I.; Thomas Roland, J.; Shiao, J.Y.; Eddington, D.K.; Montanton, P.; et al. Histopathology of cochlear implants in humans. Ann. Otol. Rhinol. Laryngol. 2001, 110, 883–891. [Google Scholar] [CrossRef]
- Leach, J.; Achuyta, A.K.H.; Murthy, S.K. Bridging the divide between neuroprosthetic design, tissue engineering and neurobiology. Front. Neuroeng. 2010, 2, 18. [Google Scholar] [CrossRef]
- Nayagam, A.B.; Muniak, M.A.; Ryugo, D.A. The spiral ganglion: Connecting the peripheral and central auditory systems. Hear Res. 2011, 278, 2–20. [Google Scholar] [CrossRef]
- Rubinstein, J.T. How cochlear implants encode speech. Curr. Opin. Otolaryngol. Head Neck Surg. 2004, 12, 444–448. [Google Scholar] [CrossRef]
- Shannon, R.; Fu, Q.-J.; Galvin, J., III. The number of spectral channels required for speech recognition depends on the difficulty of the listening situation. Acta Otolaryngol. 2004, 124, 50–54. [Google Scholar] [CrossRef]
- Shepherd, R.K.; Hatsuhika, S.; Clark, G.M. Electrical stimulation of the auditory nerve: The effect of electrode position on neural excitation. Hear. Res. 1993, 66, 108–120. [Google Scholar] [CrossRef] [PubMed]
- Wilson, B.S.; Dorman, M.F. Cochlear implants: A remarkable past and a brilliant future. Hear. Res. 2008, 242, 3–21. [Google Scholar] [CrossRef] [PubMed]
- Cogan, S.F. Neural Stimulation and Recording Electrodes. Annu. Rev. Biomed. Eng. 2008, 10, 275–309. [Google Scholar] [CrossRef] [PubMed]


Disclaimer/Publisher’s Note: The statements, opinions and data contained in all publications are solely those of the individual author(s) and contributor(s) and not of MDPI and/or the editor(s). MDPI and/or the editor(s) disclaim responsibility for any injury to people or property resulting from any ideas, methods, instructions or products referred to in the content. |
© 2025 by the authors. Licensee MDPI, Basel, Switzerland. This article is an open access article distributed under the terms and conditions of the Creative Commons Attribution (CC BY) license (https://creativecommons.org/licenses/by/4.0/).
Share and Cite
Delipetar, B.; Žarković Krolo, J.; Bedalov, A.; Kovačić, D. A Neuroelectronic Interface with Microstructured Substrates for Spiral Ganglion Neurons Cultured In Vitro: Proof of Concept. Biosensors 2025, 15, 224. https://doi.org/10.3390/bios15040224
Delipetar B, Žarković Krolo J, Bedalov A, Kovačić D. A Neuroelectronic Interface with Microstructured Substrates for Spiral Ganglion Neurons Cultured In Vitro: Proof of Concept. Biosensors. 2025; 15(4):224. https://doi.org/10.3390/bios15040224
Chicago/Turabian StyleDelipetar, Boris, Jelena Žarković Krolo, Ana Bedalov, and Damir Kovačić. 2025. "A Neuroelectronic Interface with Microstructured Substrates for Spiral Ganglion Neurons Cultured In Vitro: Proof of Concept" Biosensors 15, no. 4: 224. https://doi.org/10.3390/bios15040224
APA StyleDelipetar, B., Žarković Krolo, J., Bedalov, A., & Kovačić, D. (2025). A Neuroelectronic Interface with Microstructured Substrates for Spiral Ganglion Neurons Cultured In Vitro: Proof of Concept. Biosensors, 15(4), 224. https://doi.org/10.3390/bios15040224