3.1. Long-Term Structural Stability of SnO2-SiO2 Nanocomposites
Crystal growth during operation at the elevated working-temperatures (250–500 °C) of metal-oxide gas sensors is considered to contribute to the drift of their baseline (film resistance without the analyte) and poor long-term stability of their response [
2,
3]. The BET and XRD size were within 1 nm suggesting formation of mainly monocrystalline particles.
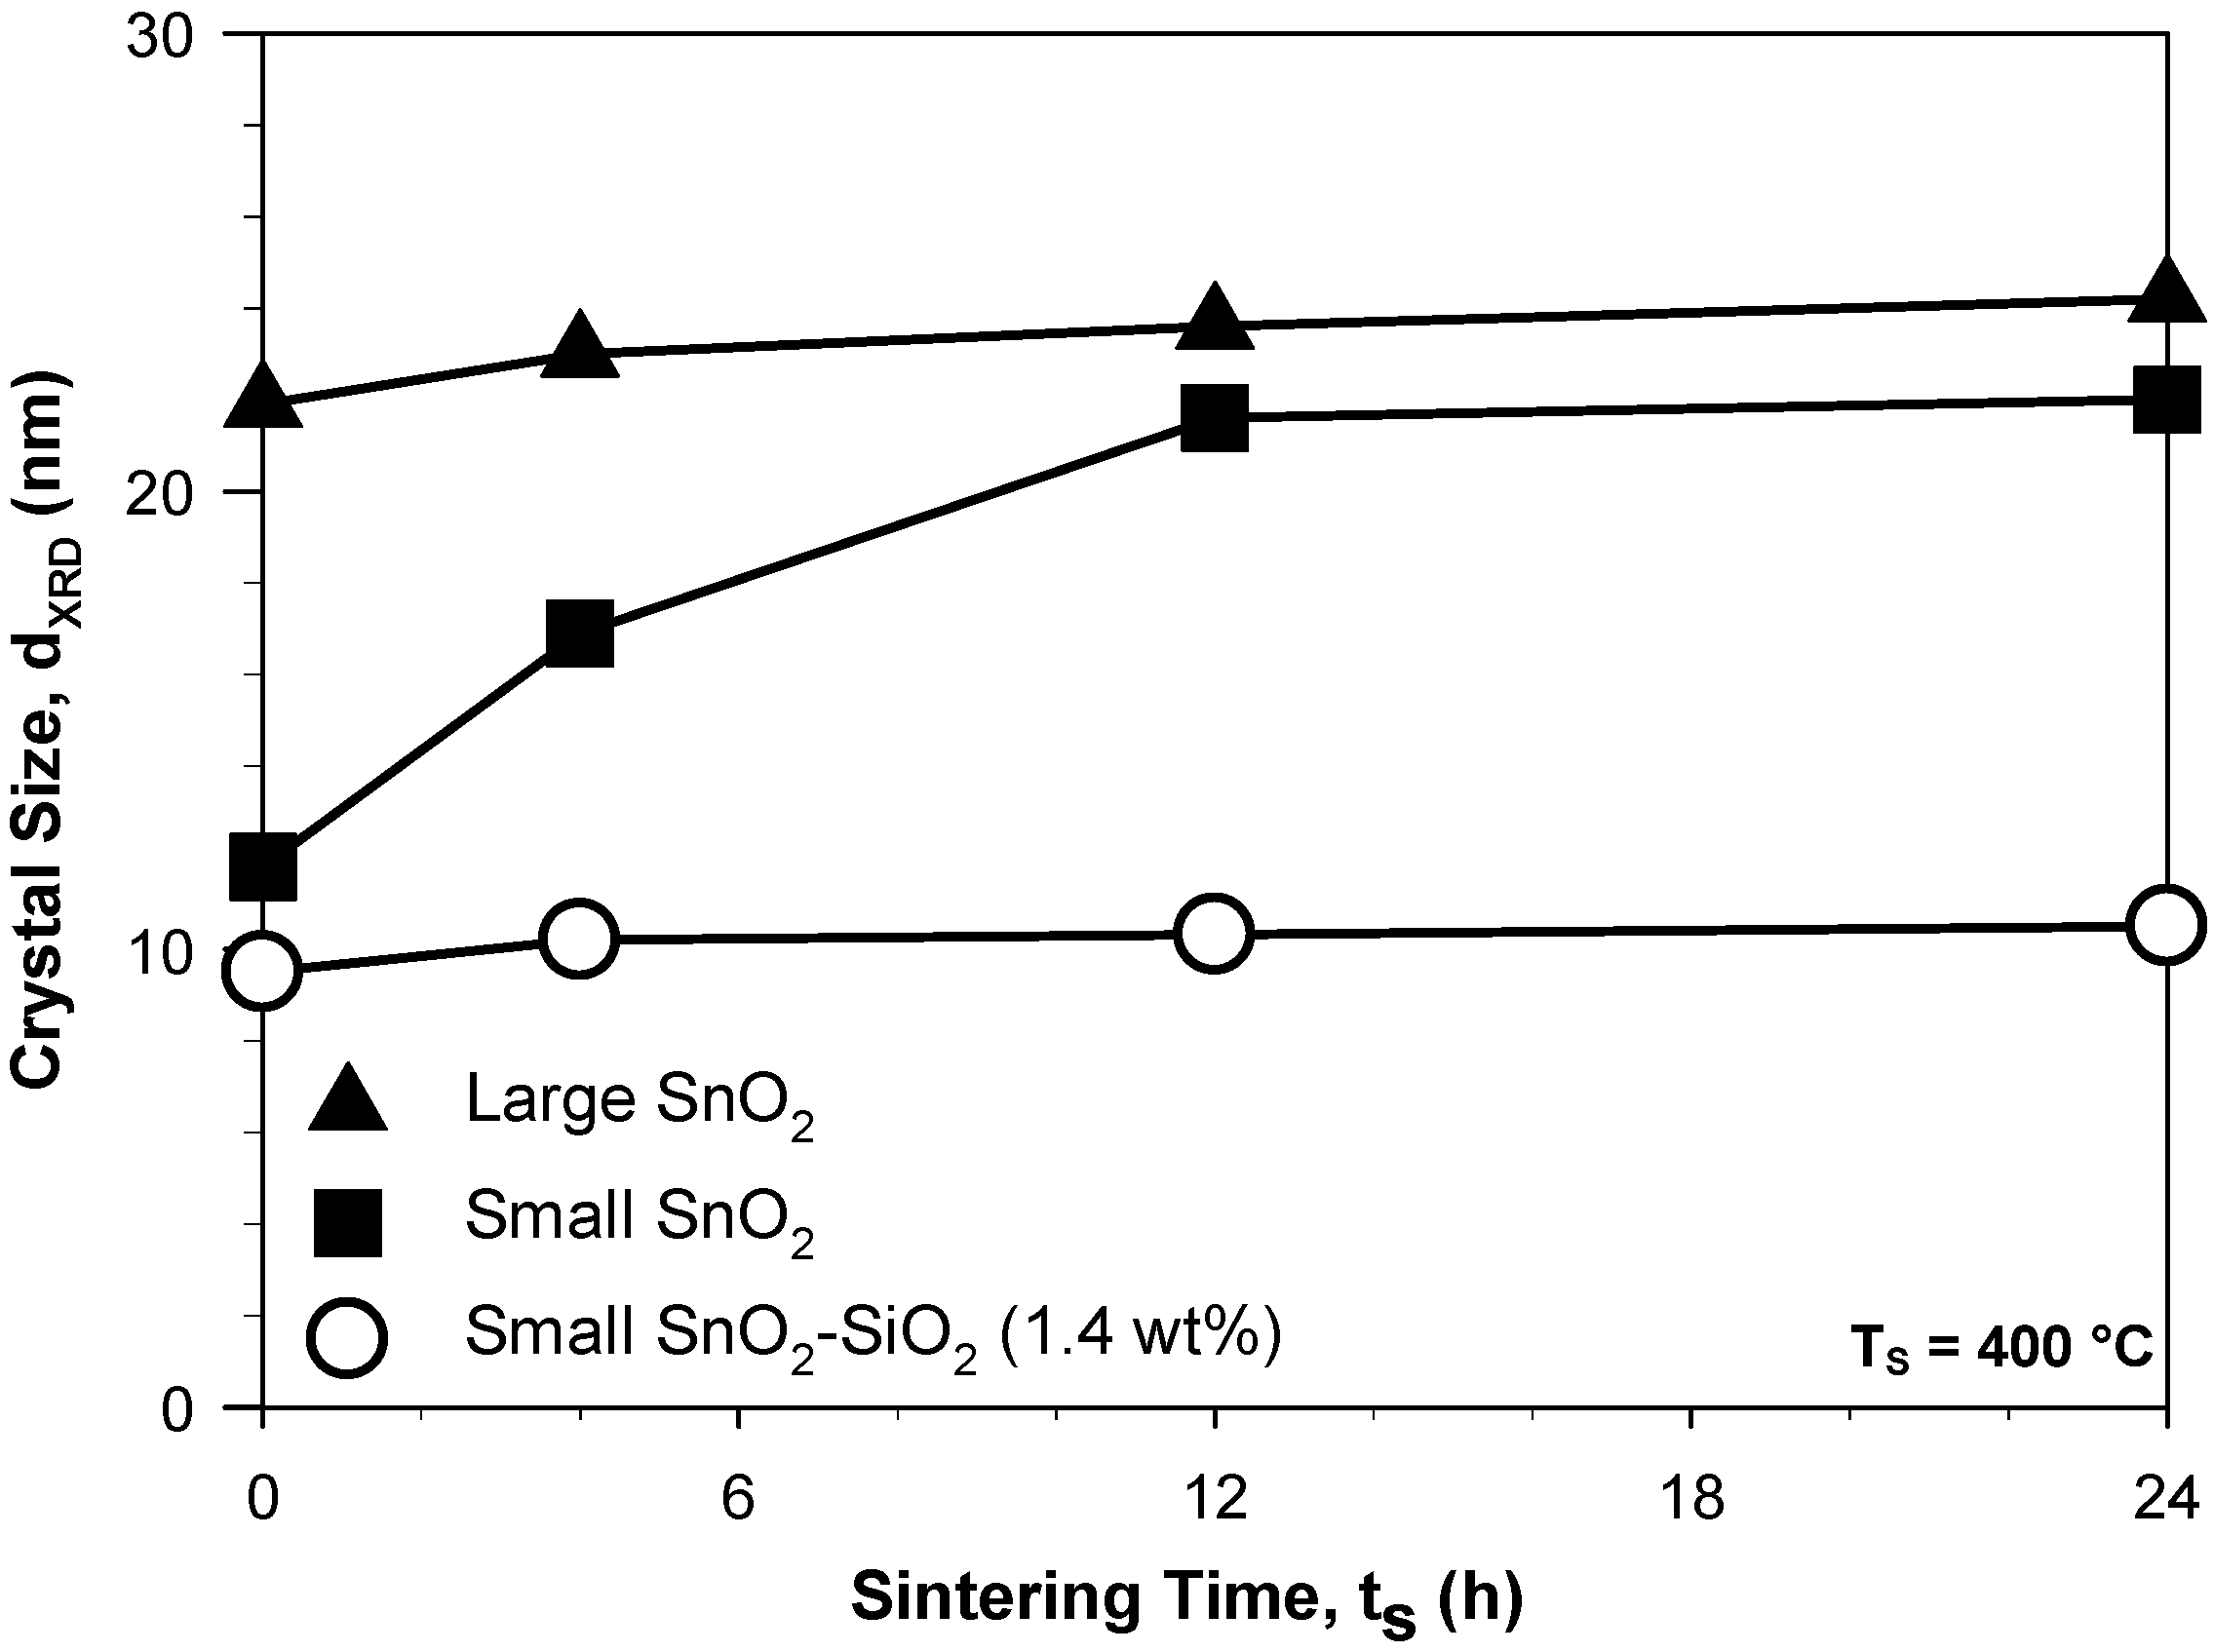
Figure 1 shows the average crystal size of large (triangles) and small (squares) SnO
2 nanoparticles as a function of the sintering time at 400 °C. The crystal size of the better performing, small SnO
2 nanoparticles (
Figure 1, squares) increased from 12 to 22 nm with increasing sintering time from 0 to 24 h. A crystal size of 21.6 nm was obtained already after 12 h sintering (
Figure 1, squares). In contrast, the crystal size of the large SnO
2 nanoparticles (
Figure 1, triangles) increased only from 21.9 to 24.2 with increasing sintering time from 0 to 24 h. This indicates that, for sensor operation at 400 °C, flame-made nanoparticles constituted by pure SnO
2 crystals have a thermodynamically stable size of nearly 24 nm in agreement with the poor thermal stability of small SnO
2 nanoparticles and with the grain size stability conditions reported for several other synthesis methods [
3]. This is in line with the rapid crystal and grain growth of flame-made SnO
2 nanoparticles observed already at low sintering temperatures [
7] suggesting that obtaining stable sensor responses requires testing of the sensors for several consecutive days. In particular, the asymptotic-like growth of the small SnO
2 nanoparticles (
Figure 1, squares) toward 22 nm suggests that small drift of sensor response and baseline may continue for a very long time span (>>24 h). In fact, the thermodynamically stable crystal size (at 400 °C) of 24 nm was still not obtained upon 24 h sintering.
Figure 1.
Average crystal size (dXRD) of large (triangles) and small (squares) SnO2 nanoparticles as a function of the sintering time at 400 °C. Cosynthesis of 1.4 wt% SiO2 (circles) drastically increased the long-term thermal-stability of SnO2 crystals.
Figure 1.
Average crystal size (dXRD) of large (triangles) and small (squares) SnO2 nanoparticles as a function of the sintering time at 400 °C. Cosynthesis of 1.4 wt% SiO2 (circles) drastically increased the long-term thermal-stability of SnO2 crystals.
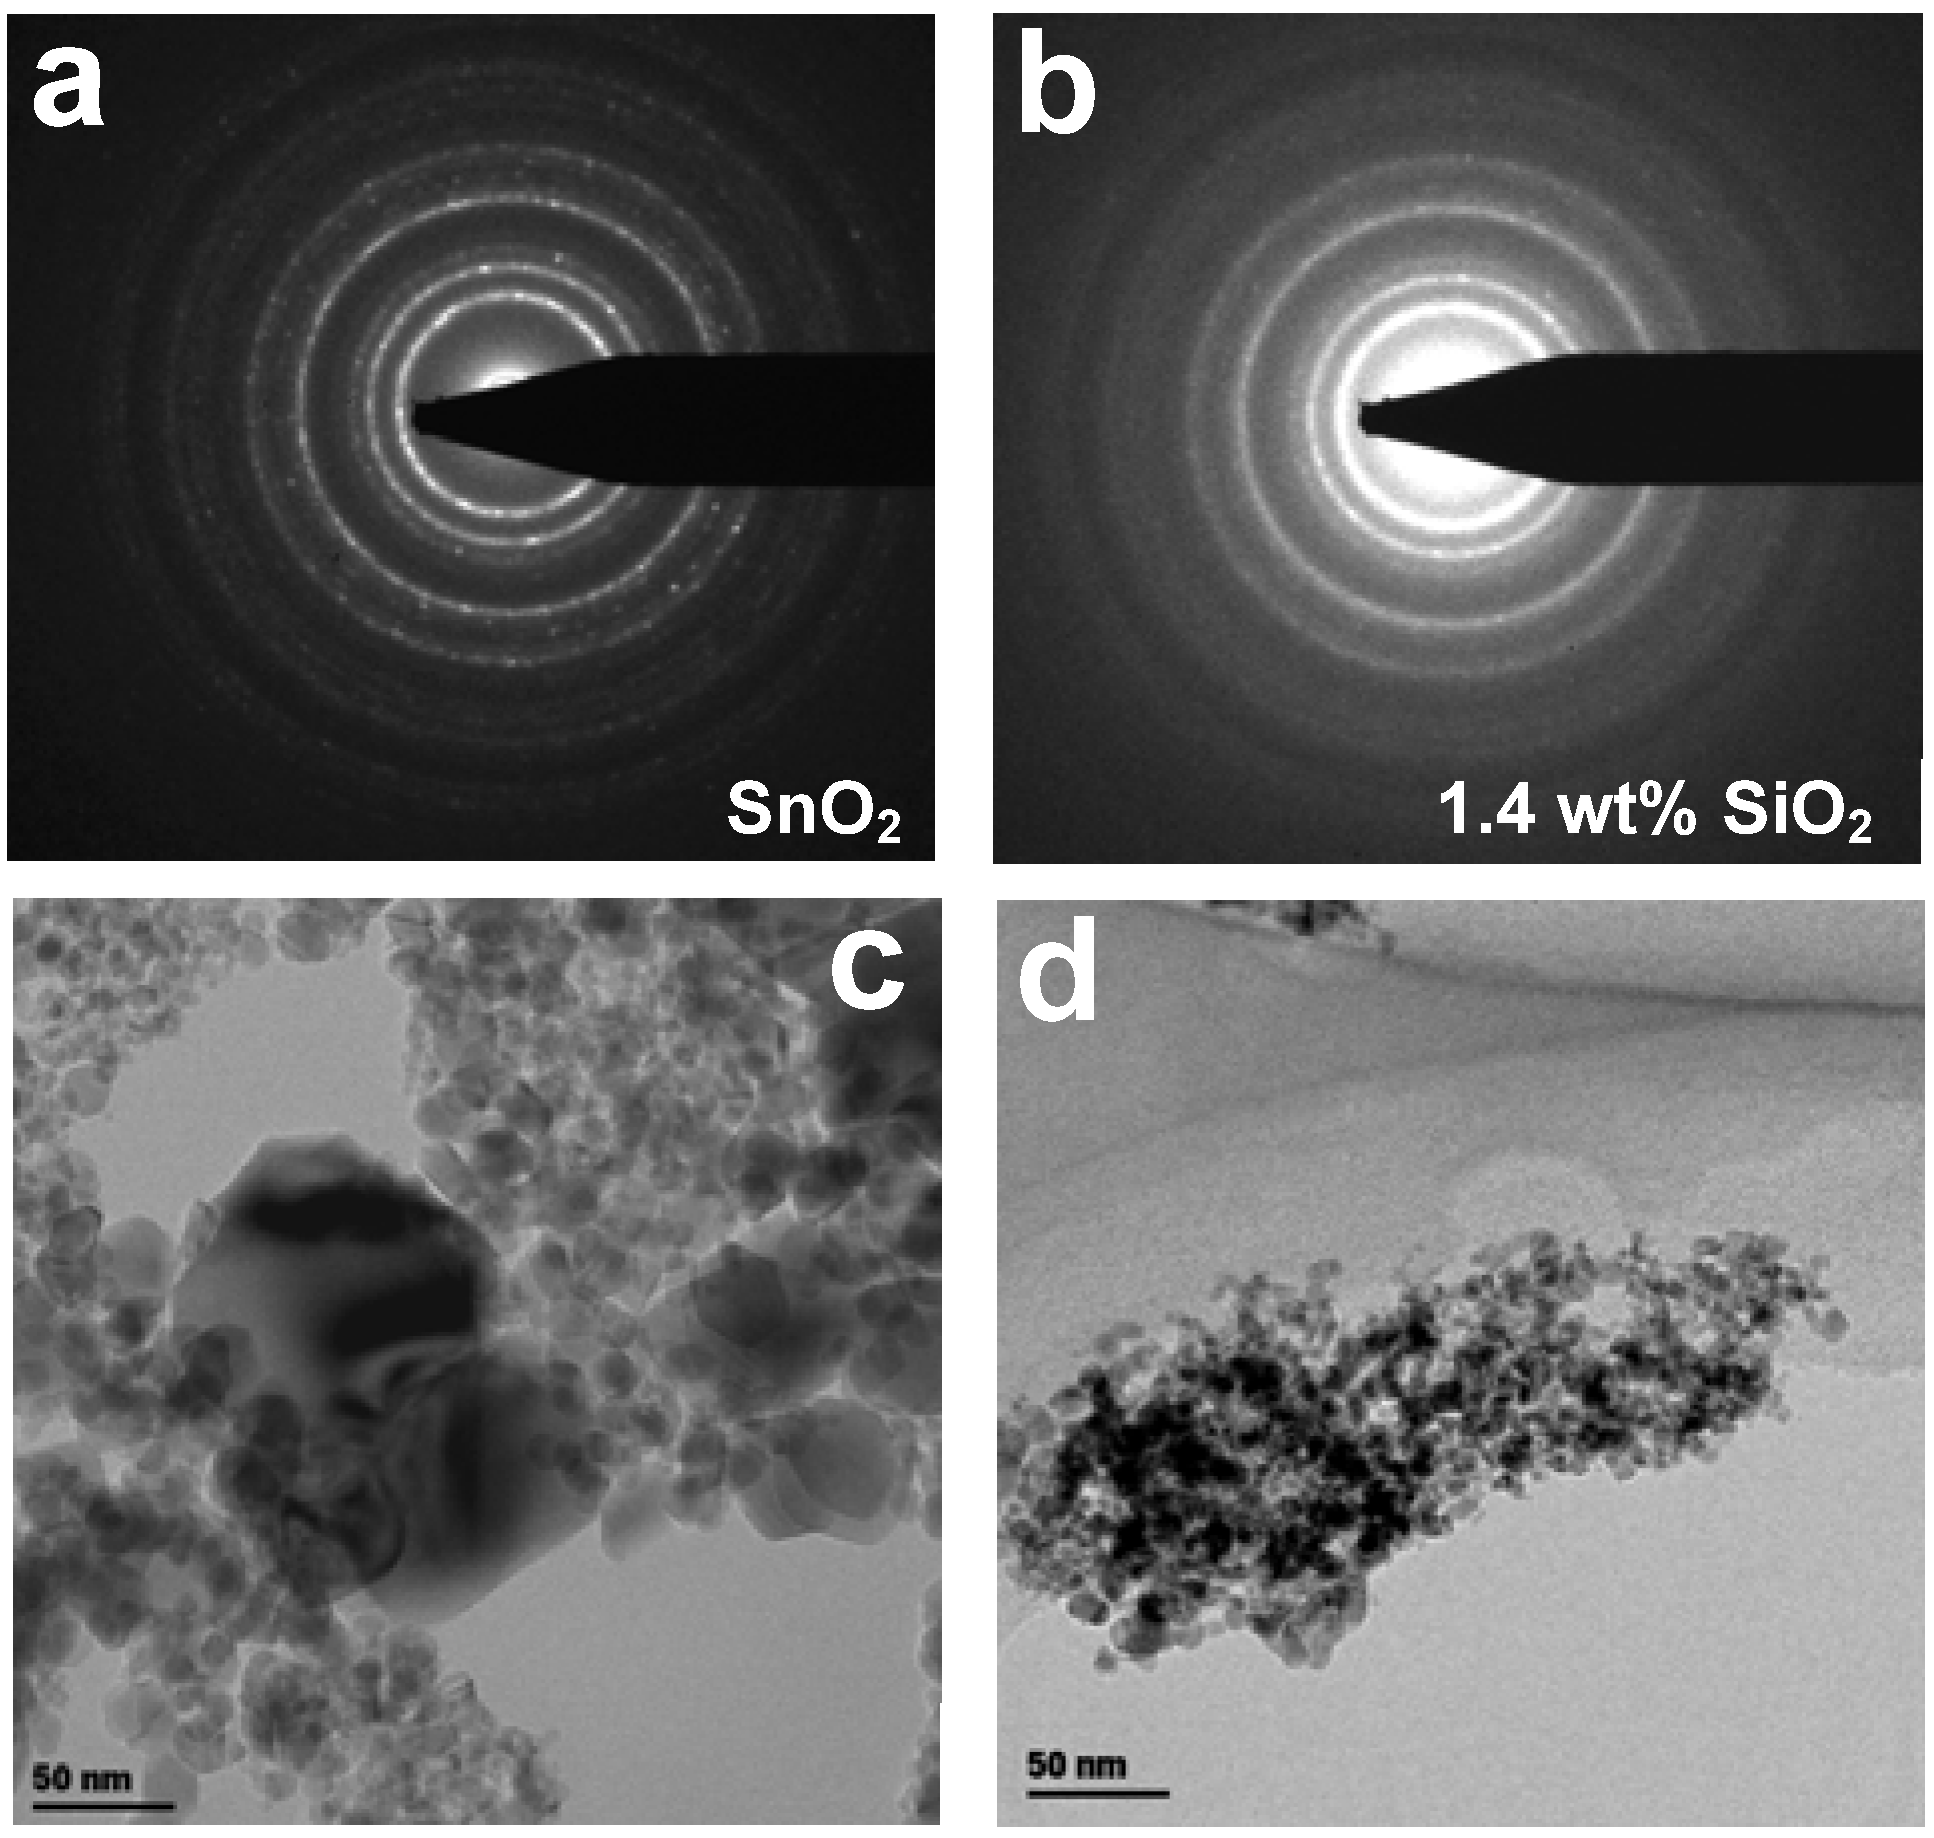
Figure 2.
ED patterns of pure (a) SnO2 nanoparticles and (b) 1.4 wt% SnO2-SiO2 nanocomposites after 4 h sintering at 400 °C and corresponding transmission electron microscopy (TEM) images (c,d).
Figure 2.
ED patterns of pure (a) SnO2 nanoparticles and (b) 1.4 wt% SnO2-SiO2 nanocomposites after 4 h sintering at 400 °C and corresponding transmission electron microscopy (TEM) images (c,d).
Cosynthesis of SiO
2 led already at very low content (1.4 wt%) to remarkable long-term thermal-stabilization of the small SnO
2 nanoparticles. The average crystal size of these SnO
2-SiO
2 nanocomposites (
Figure 1, circles) increased only from 9.5 to 10.5 nm with increasing sintering time from 0 to 24 h. The particles were mainly polyhedrical (
Figure 2(c,d)) consisting of a crystalline SnO
2 core and some dispersed SiO
2 phase. At high SiO
2 content, the SnO
2 and SiO
2 phase were segregated in crystalline and amorphous domains, respectively. This is in line with the reported thermal stabilization and performance maximization of SnO
2- [
7] and WO
3-based [
19] gas sensors by Si-doping. Here, it is shown that this noble metal-free approach to improve the performance of metal-oxide chemoresistive gas sensors offers also superior long-term structural stability.
The thermal stabilization mechanism of the small SnO
2 crystals by SiO
2 cosynthesis was further investigated by electron diffraction analysis, XRD and TEM analysis of the nanoparticles upon sintering for 4 h at 400 °C. In line with previous results [
7], increasing the SiO
2 content increased the homogeneity of the visible SnO
2 TEM size both for the as-prepared and sintered samples. The electron diffraction (ED) patterns of the small SnO
2 nanoparticles (
Figure 2(a)) showed the presence of crystalline structures in line with the XRD analysis [
7] that corresponded to 100 wt% cassiterite phase [
16] while the numerous bright spots indicate the formation of large crystals already upon short (4 h) sintering at 400 °C. This is in line with the rapid increase in average crystal size of the small SnO
2 nanoparticles (
Figure 1, squares) with increasing sintering time and suggests a polydisperse crystal size distribution. In contrast, the ED patterns of the 1.4 wt% SnO
2-SiO
2 nanocomposites (
Figure 2(b)) did not shown nearly any bright spot. This indicates that the formation of large crystals is homogeneously inhibited by cosynthesis of SiO
2. In this respect, a possible thermal stabilization mechanism is the pinning of the SnO
2 crystal boundaries by SiO
2 [
13,
14]. Condensation of the SiO
2 molecules on the surface of the nucleated SnO
2 clusters during flame-synthesis may explain the lower sintering rates of these SnO
2-SiO
2 nanoparticles already at very low SiO
2 content. In fact, it is expected that SiO
2 segregates from the SnO
2 already at low content (
ca. 2 wt%) [
7].
This homogeneous inhibition of SnO
2 crystal growth is necessary to achieve long-term stability of the sensing properties. In fact, irregular growth of some un-stabilized SnO
2 nanoparticles would also lead to change in the structural and electronic properties of the sensing film. However, the crystal size of the SnO
2-SiO
2 nanocomposites (
Figure 1, circles) was not completely stable and approached slowly 10.5 nm. Although, this crystal growth is very small with respect to that of pure SnO
2 (
Figure 1, squares), it still indicates a restructuring of the nanoparticle interface. In particular, growth of sintering necks may drastically change the performance of the sensing film while showing very small variations in the measured crystal size [
7].
Reduction of the long-term drift of the SnO
2 and SnO
2-SiO
2 sensors may be obtained by pre-sintering of the films at temperatures above the operational ones (e.g., at 600 °C) [
7] leading to the achievement of a thermodynamically stable grain size prior to sensor testing (e.g., at 400 °C).
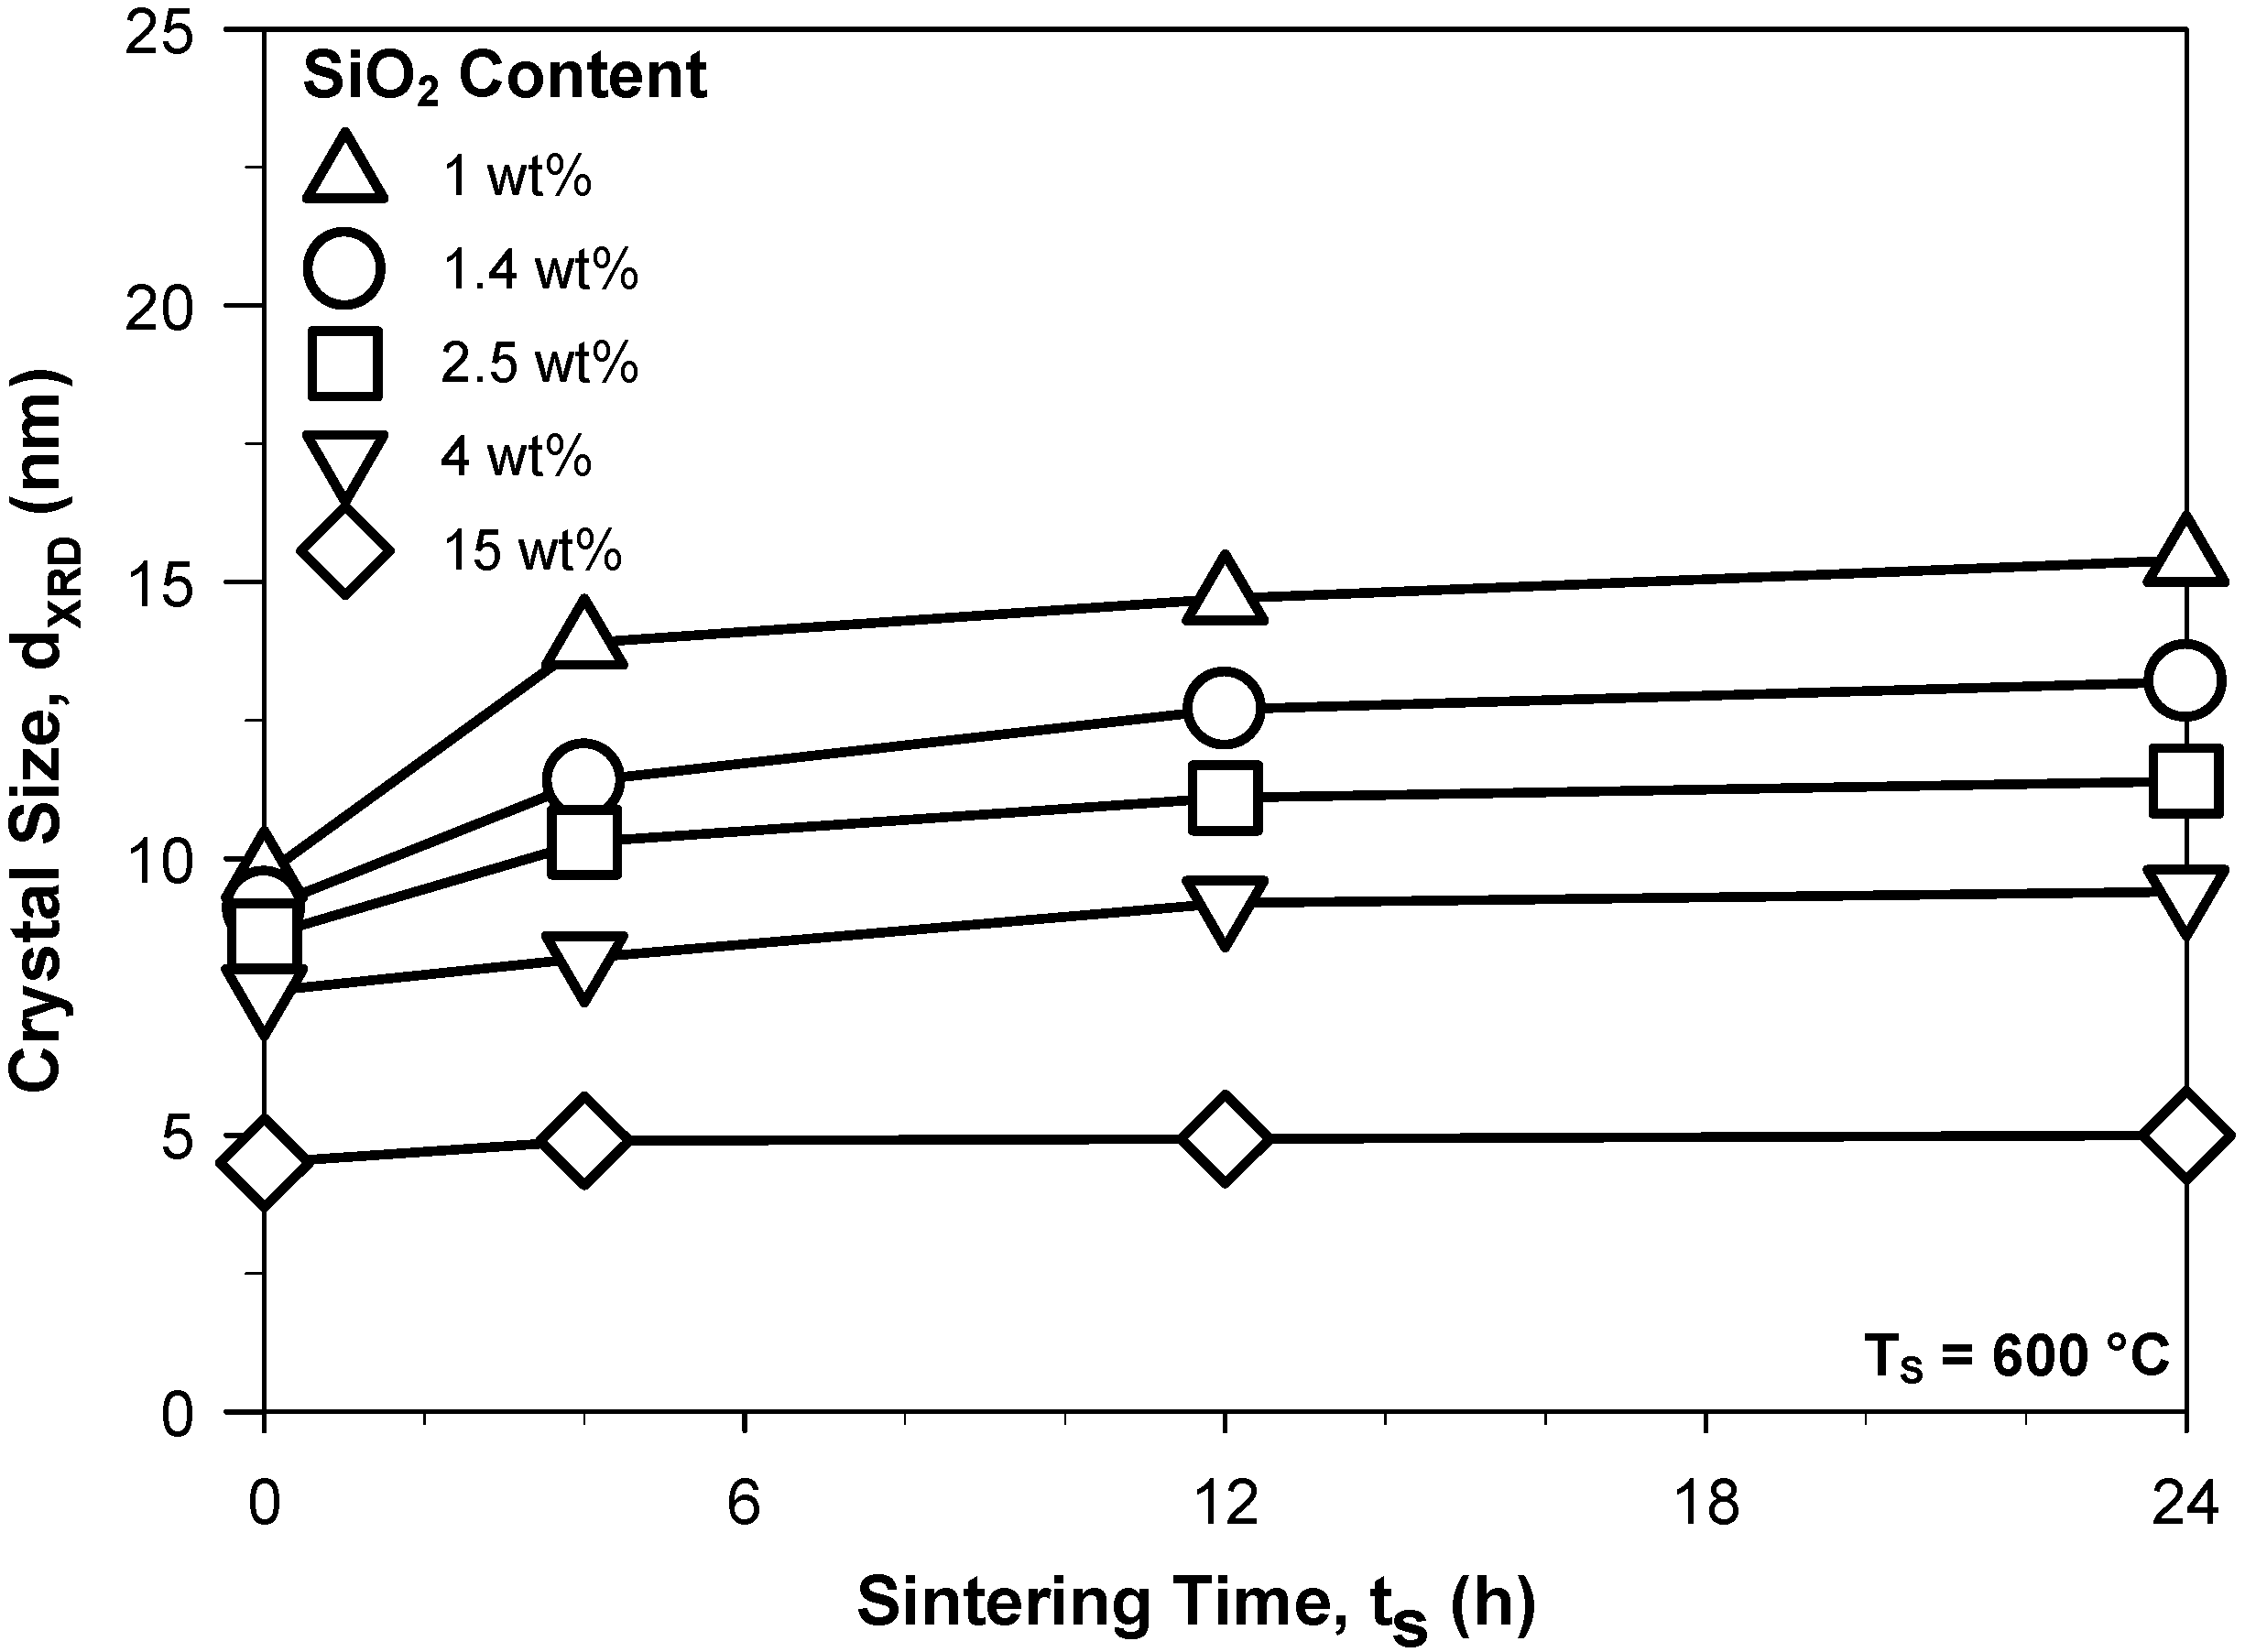
Figure 3 shows the average SnO
2 crystal size of several SnO
2-SiO
2 nanocomposites as a function of such a pre-sintering step at 600 °C. The 1 wt% SnO
2-SiO
2 crystal size (
Figure 3, triangles up) increased from 9.7 to 15.4 with increasing sintering time at 600 °C from 0 to 24 h. This shows that even the smallest addition of SiO
2 leads to stabilization of the SnO
2 crystal size far below that of pure SnO
2 at 400 °C (
Figure 1, solid triangles). In particular, the 1.4 wt% SnO
2-SiO
2 reached a size of 11.4 nm already after 4 h sintering (
Figure 3, circles). This is more than the thermodynamically stable size (≈10.5 nm) at 400 °C and thus pre-sintering of the sensing films prior to sensor utilization may be utilized to considerably shorten the time required for achievement of a stable sensor response. Furthermore, up to 4 wt% SiO
2, the as-prepared SnO
2 crystal size (
Figure 3) of these nanocomposites was very close (
ca. 10 ± 1.5 nm) suggesting further that SiO
2 may condense directly on the formed SnO
2 nanoparticles inhibiting further crystal and grain growth during flame-synthesis. In comparison, the initial crystal size of the pure SnO
2 nanoparticles was 12 nm (
Figure 1, solid squares) which is attributed to particle coagulation during the residence time in the flame. In line, the as-prepared powder SSA increased from 100 to 211 m
2/g with increasing SiO
2 content from 0 to 15 wt%. The 15 wt% SiO
2-SnO
2 demonstrated the highest long-term stability growing only from 4.5 to 5 nm (
Figure 3, diamonds) with increasing sintering time from 0 to 24 h. This is in agreement with the grain growth inhibition demonstrated by SiO
2 cosynthesis [
7]. However, utilization of such high SiO
2 contents results in the formation of insulating domains and a drastic drop of the sensing performance [
7] and thus, here, the dynamics of the sensor response stabilization has been investigated at low SiO
2 content (1–4 wt%).
Figure 3.
Average SnO2 crystal size (dXRD) of the SnO2-SiO2 nanocomposites as a function of the sintering time at 600 °C for several SiO2 contents.
Figure 3.
Average SnO2 crystal size (dXRD) of the SnO2-SiO2 nanocomposites as a function of the sintering time at 600 °C for several SiO2 contents.
3.2. Sensing Performance Stability
The sensing properties of these SnO
2-SiO
2 nanoparticles were tested with EtOH, a standard volatile organic compound that is particularly important for detection of drunken drivers and is increasingly investigated also for non-invasive breath analysis.
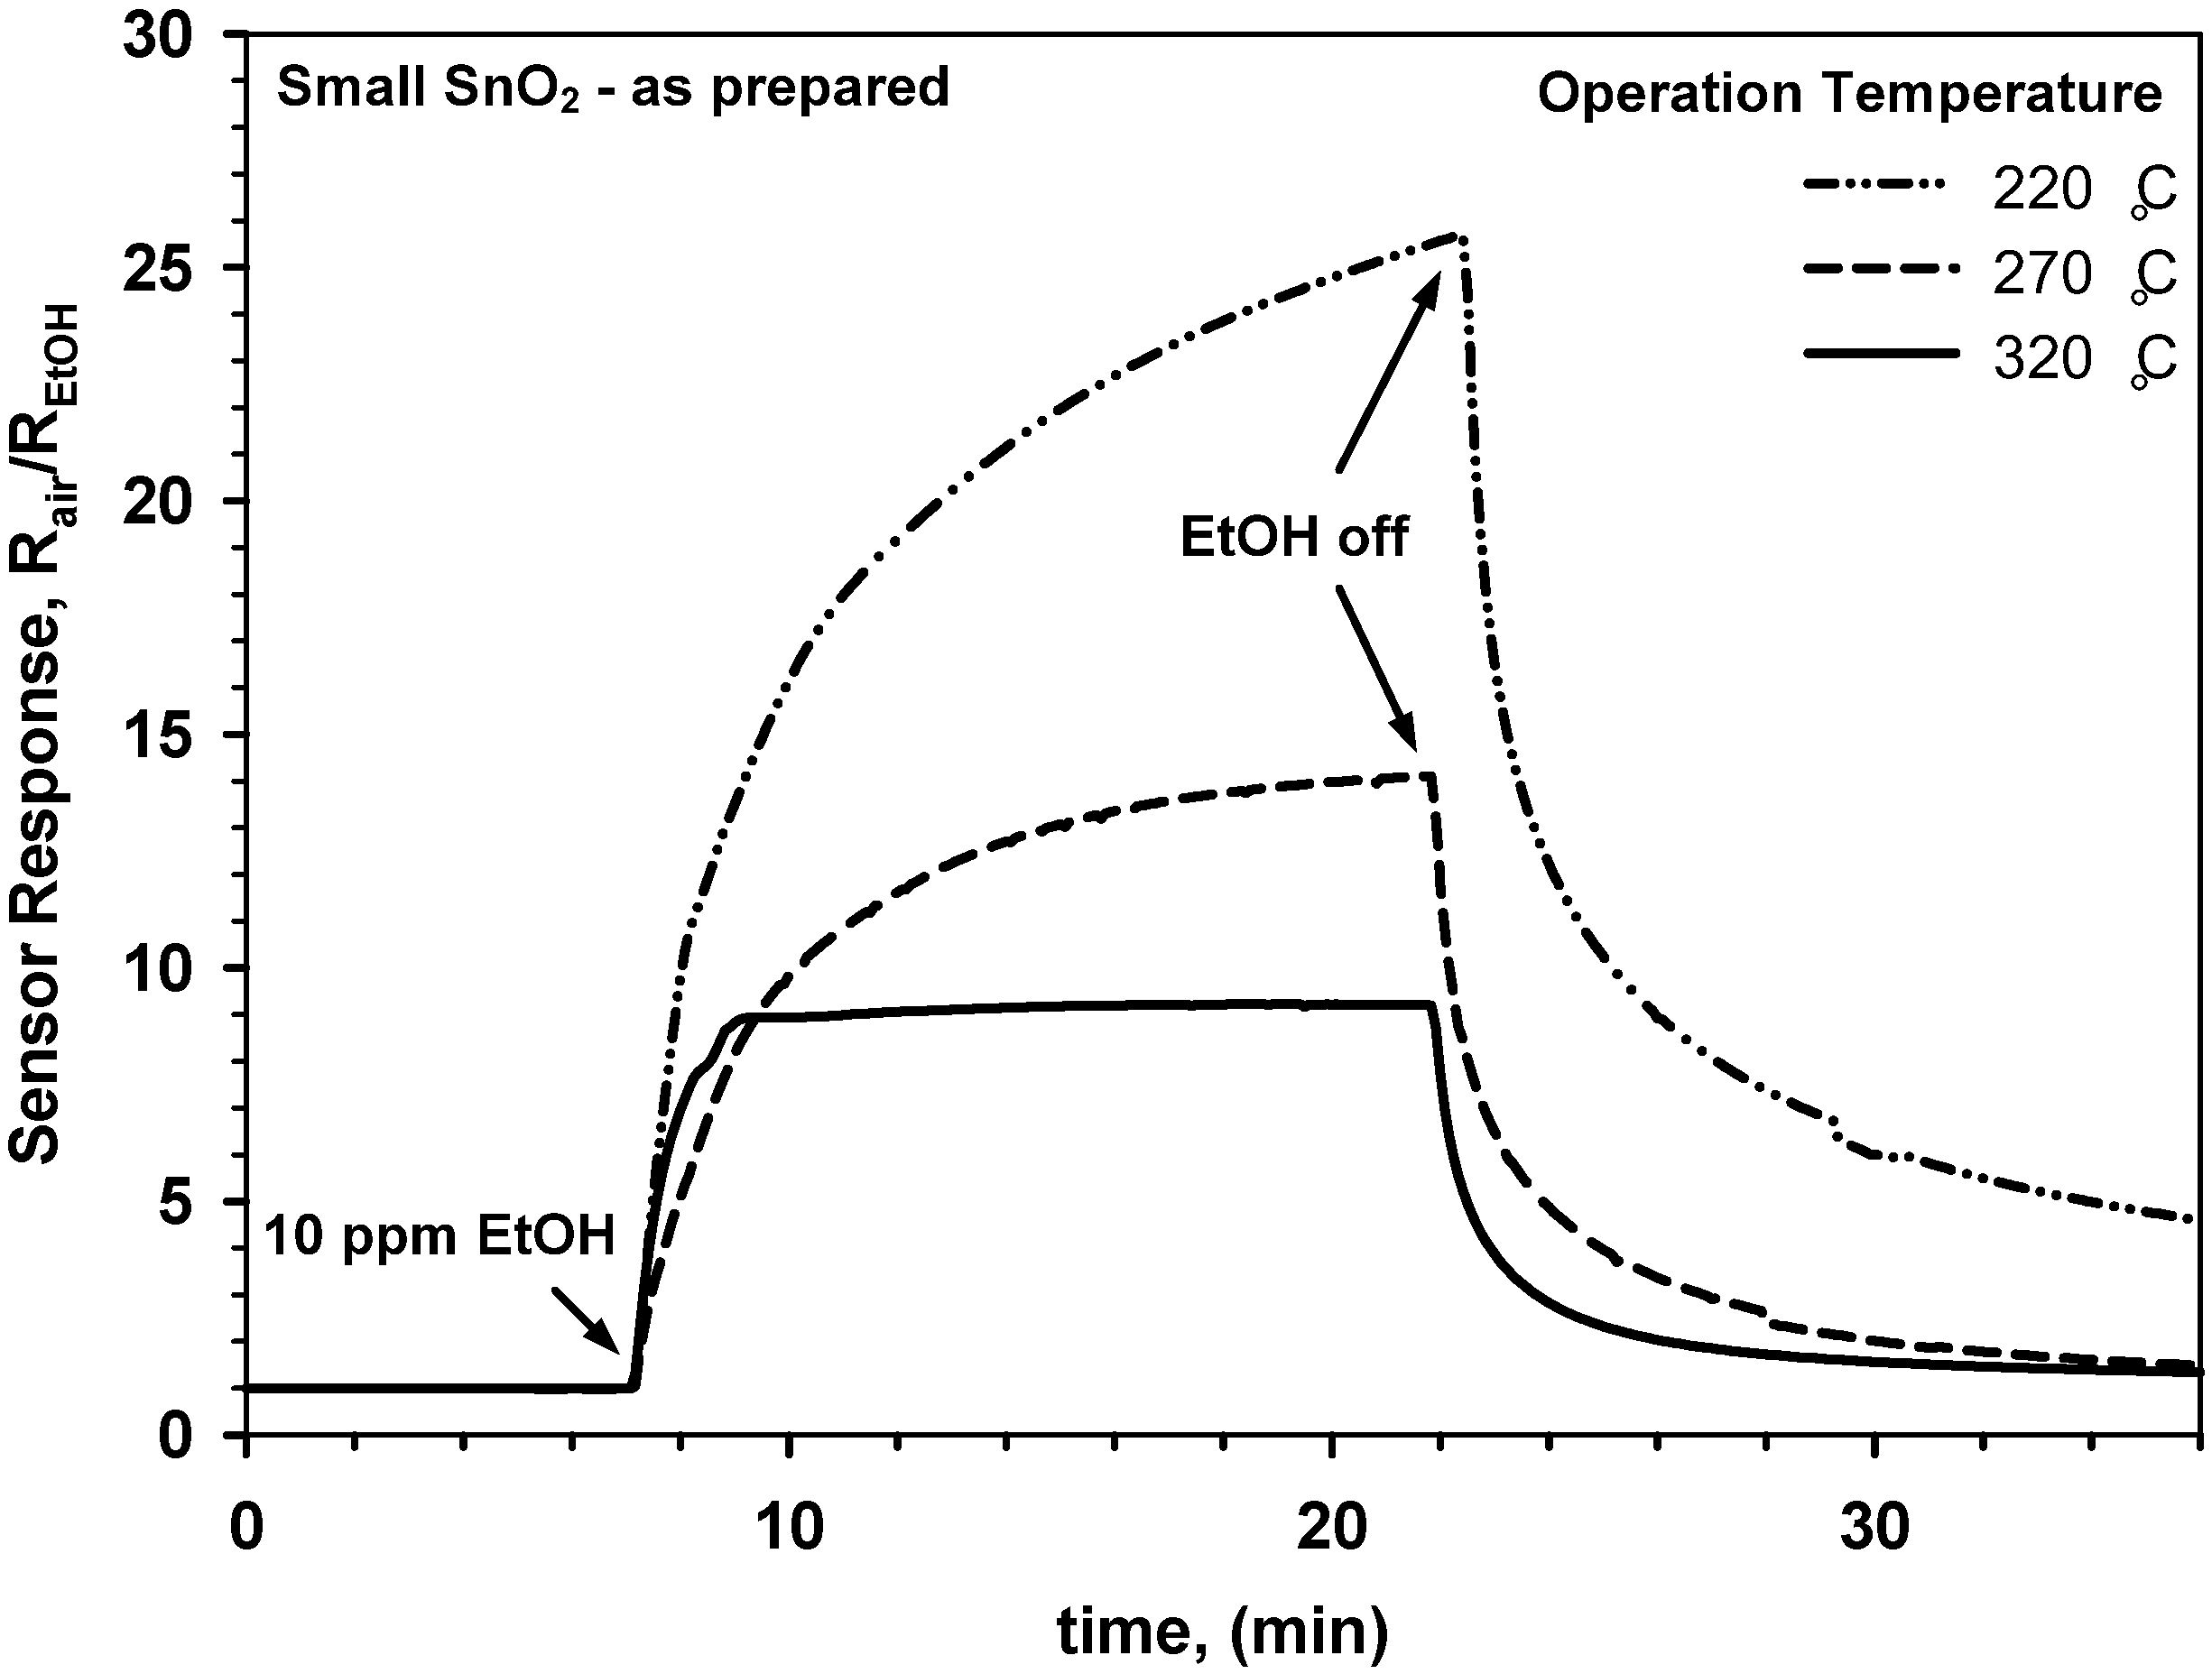
Figure 4 shows the response to 10 ppm ethanol of a pure SnO
2 (d
XRD = 12 nm) gas sensor, that was not stabilized by a pre-sintering step, for several operation temperatures. The response of this sensor (
Figure 4) decreased considerably with increasing operation temperature from 220 to 320 °C. This is surprising as pure SnO
2 has maximal response to EtOH at around 300–350 °C [
20]. The drop in the sensor response was attributed to the sintering of the SnO
2 nanoparticles already during operation at such moderate temperatures. This is in line with the measured crystal growth of the small SnO
2 nanoparticles (
Figure 1, solid squares) that is expected to drastically reduce their sensitivity [
3,
5,
7]. Additionally, operation of the SnO
2 sensor at 220 °C was characterized (
Figure 4, dotted line) by an unstable response and it was not possible to fully recover the initial baseline. This indicates that without prior stabilization the sensing behavior of pure SnO
2 nanoparticles is characterized by very poor long-term stability. After two days at 320 °C (
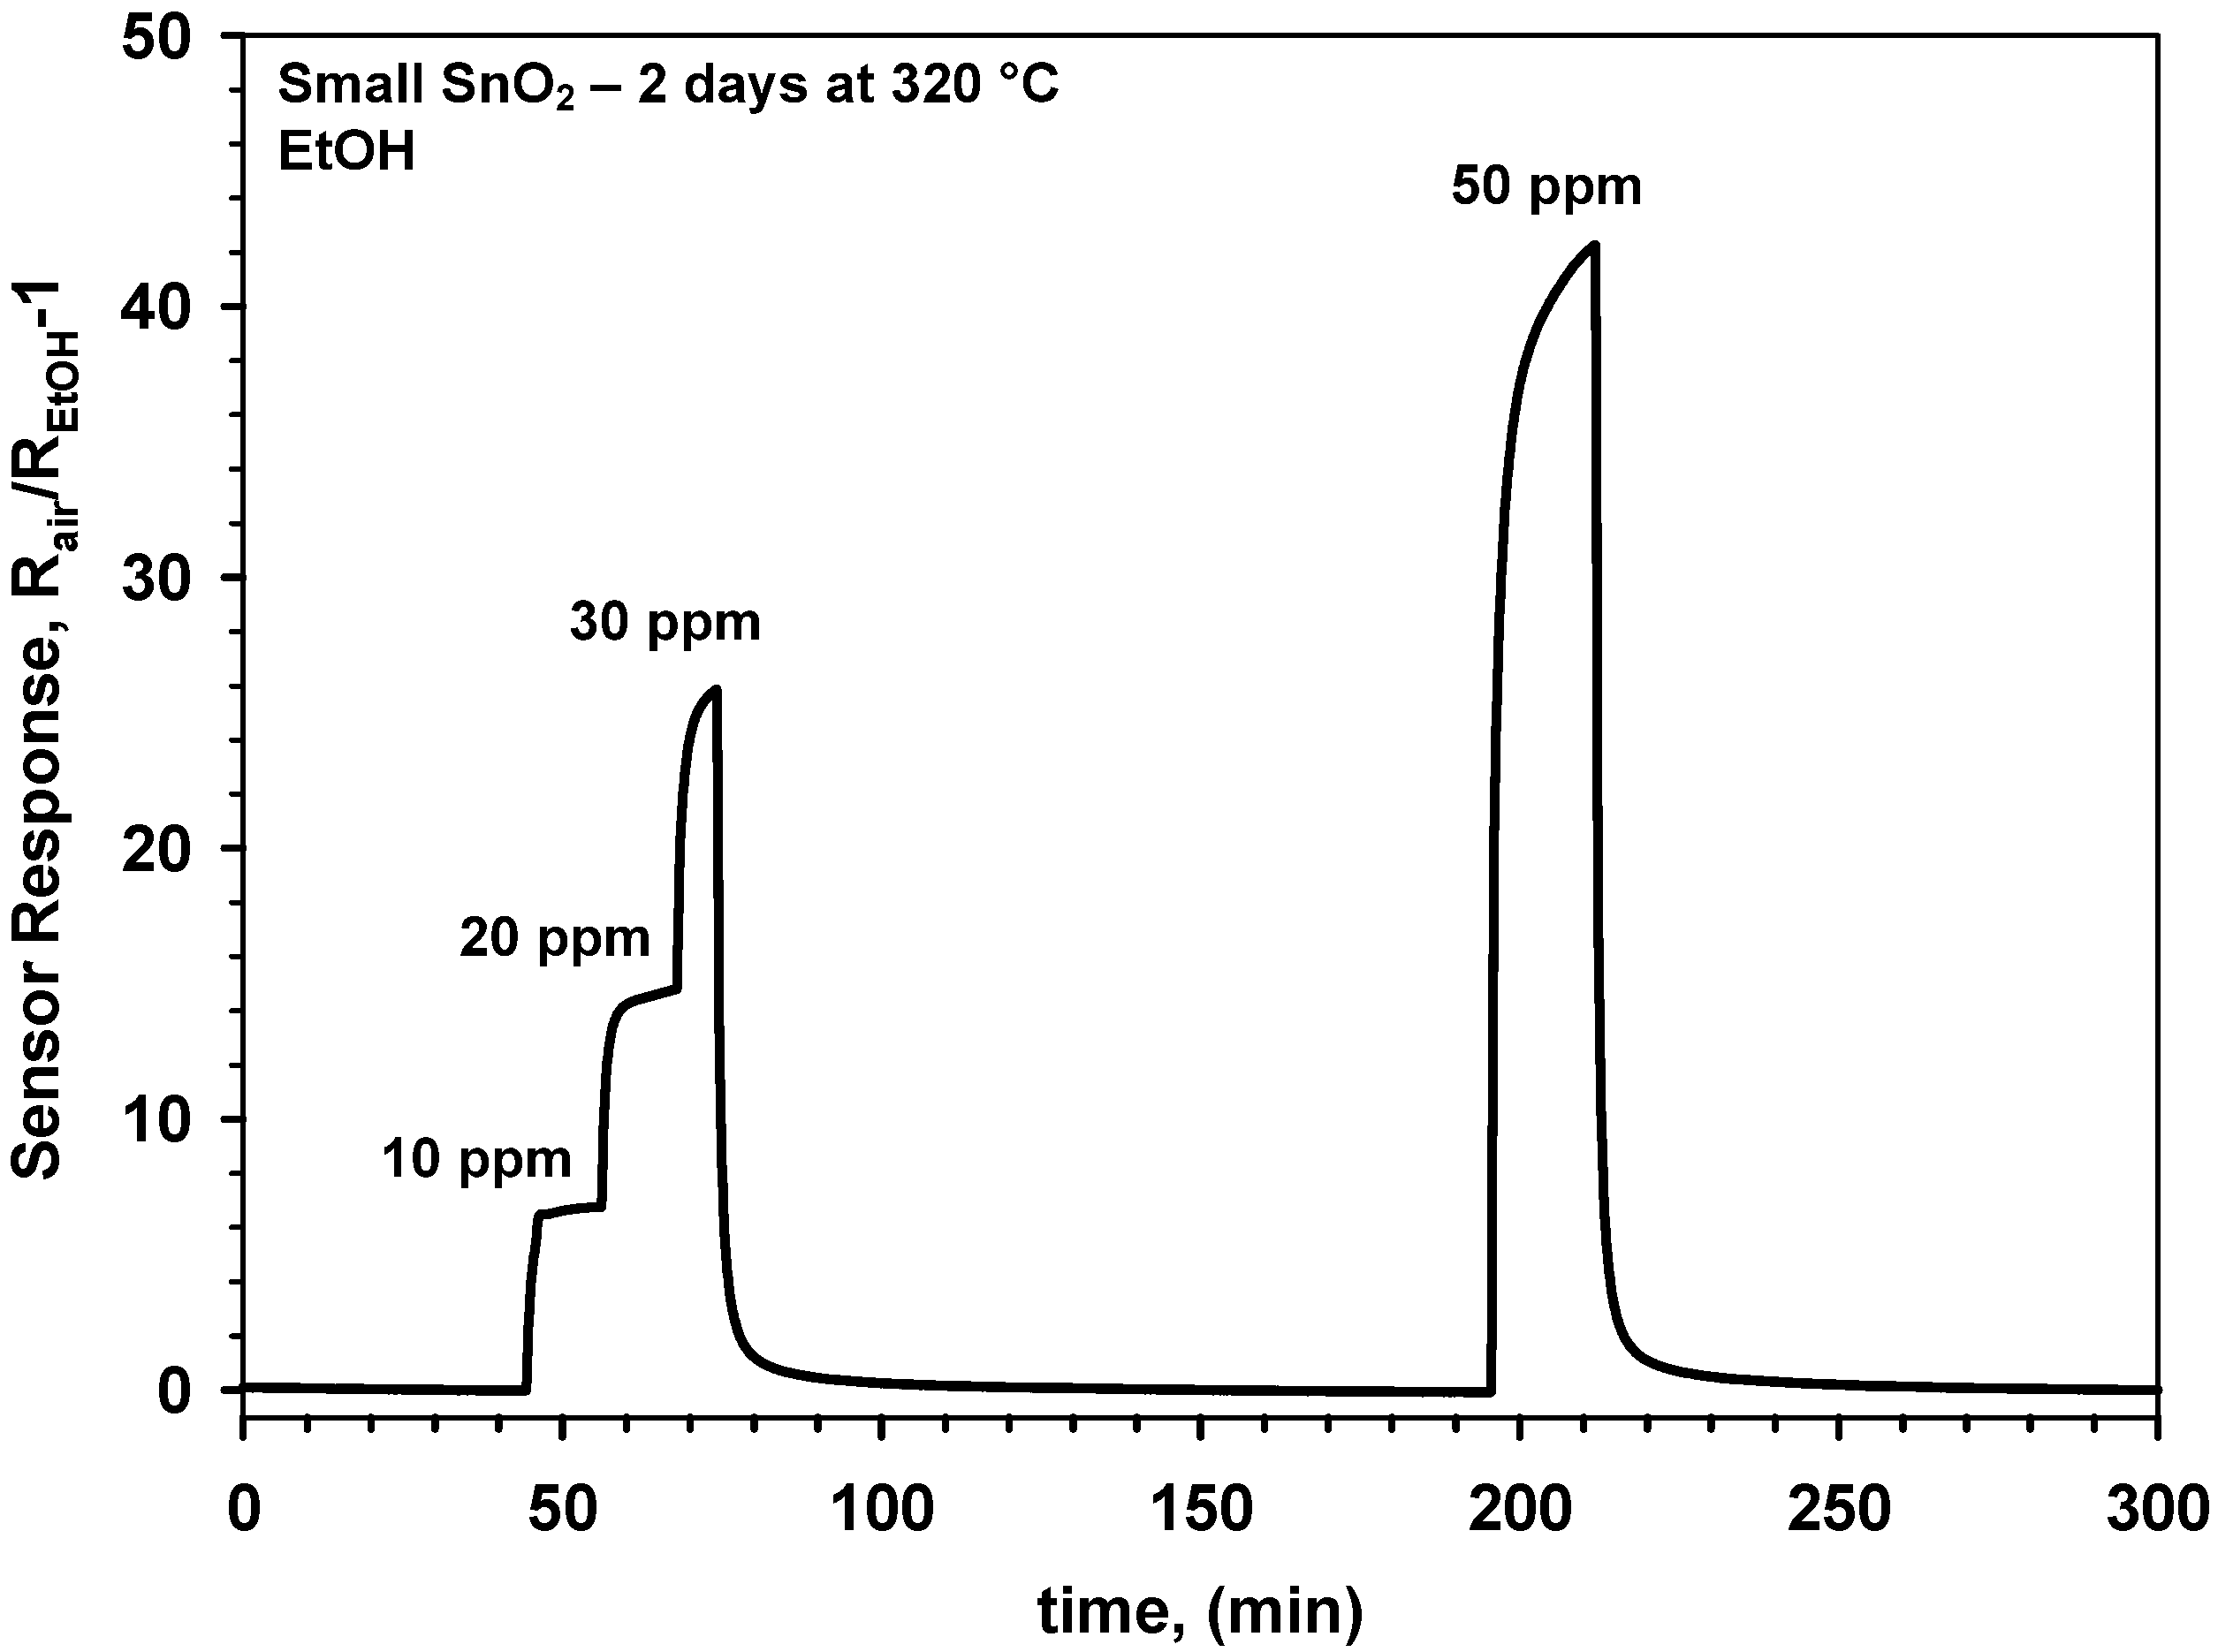
Figure 4, solid line), the sensor properties were considerably more stable demonstrating a well-defined response to 10 ppm EtOH and full recovery of the initial baseline. Nevertheless, increasing the EtOH concentration to 30 and 50 ppm (
Figure 5) resulted in very long response times.
Figure 4.
Response of a gas sensor made of as prepared SnO2 nanoparticles (dXRD = 12 nm) to 10 ppm ethanol as a function of time for increasing operation temperature from 220 to 320 °C.
Figure 4.
Response of a gas sensor made of as prepared SnO2 nanoparticles (dXRD = 12 nm) to 10 ppm ethanol as a function of time for increasing operation temperature from 220 to 320 °C.
Figure 5.
Response of a gas sensor made of small SnO2 nanocrystals to ethanol without prior stabilization upon two days at 320 °C in dry air.
Figure 5.
Response of a gas sensor made of small SnO2 nanocrystals to ethanol without prior stabilization upon two days at 320 °C in dry air.
The step-wise increase of the EtOH concentration (
Figure 5) from 10 to 30 ppm at 320 °C demonstrated sufficient sensor sensitivity for discerning among small (<10 ppm) EtOH variations. Furthermore, a very good recovery of the initial baseline was observed (
Figure 5) in line with the single EtOH step at 320 °C (
Figure 4, solid line). However, the sensitivity of this SnO
2 sensor to EtOH was pretty low with respect to noble-metals [
6] or metal-oxide [
7] doped nanoparticles. This was also attributed to the growth of the SnO
2 crystals during operation and that was found to undermine the reproducibility of the sensor performance. To have more stable sensing properties, novel sensors made of pure SnO
2 nanoparticles (d
XRD = 12 nm) were also tested for EtOH sensing after a sintering step at 600 °C (12 h). Their performance was compared to the sensors (
Figure 4 and
Figure 5) with the as prepared nanoparticle films.
Figure 6.
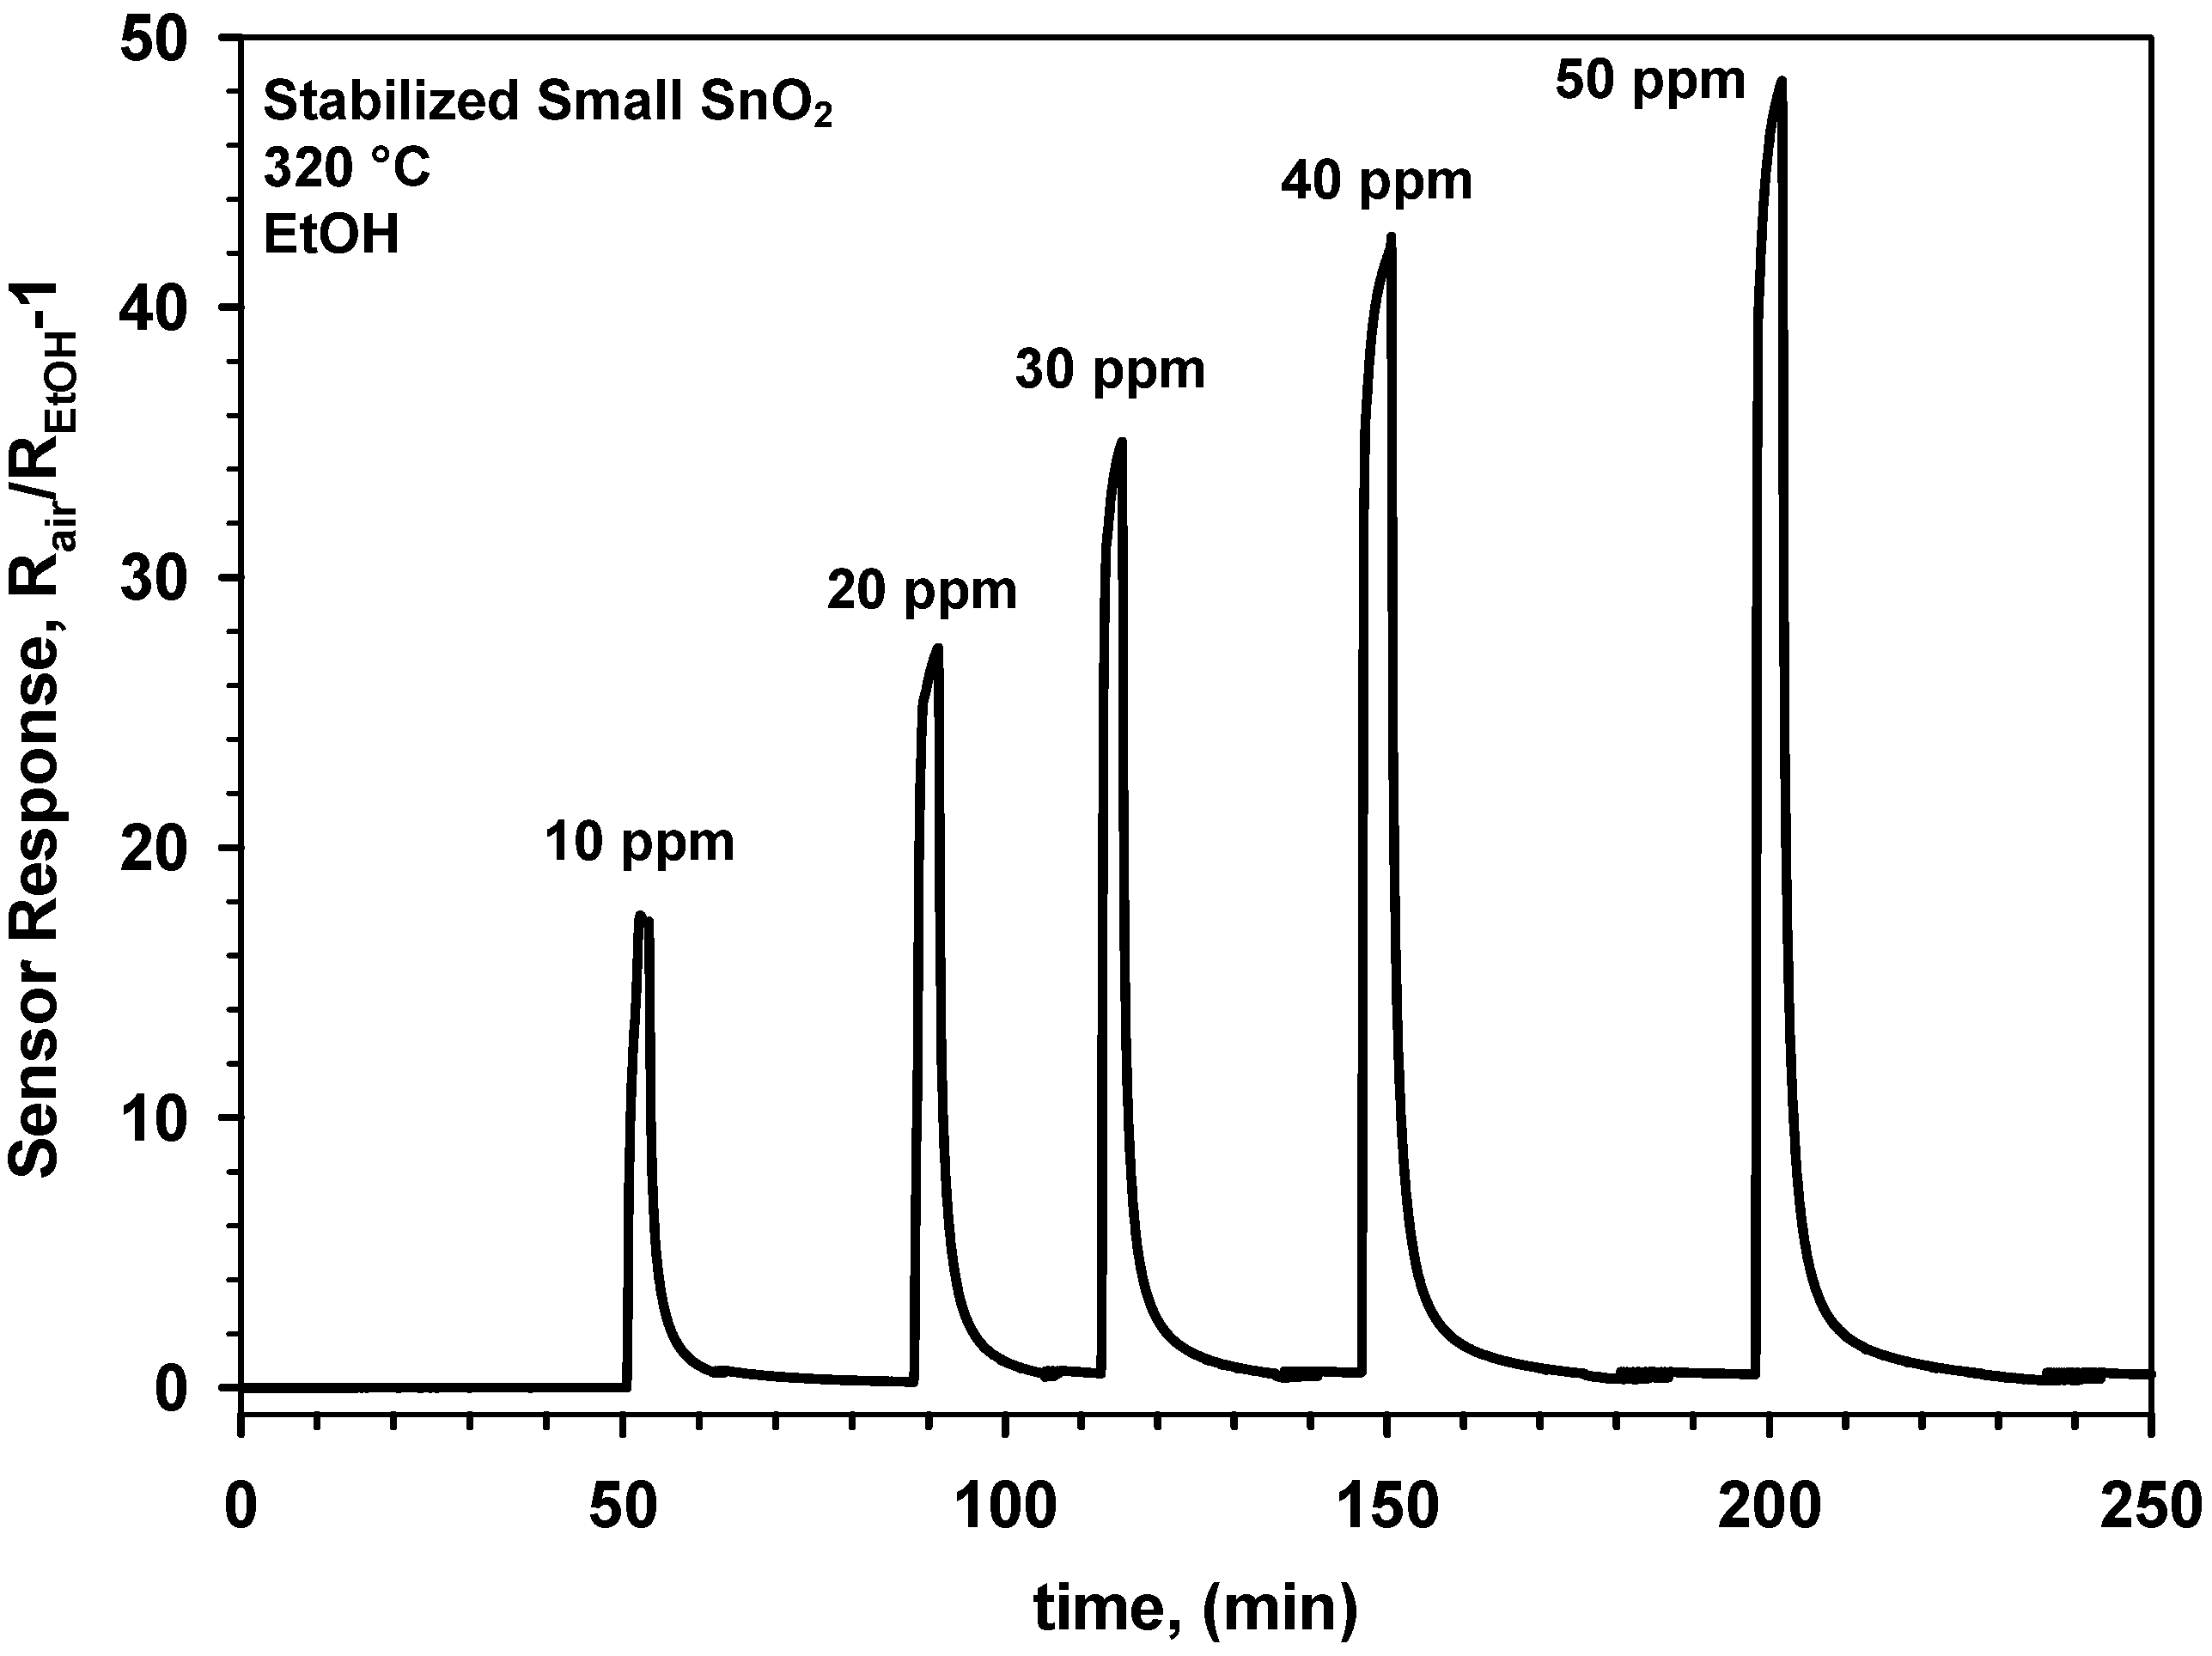
Response of a gas sensor made of small SnO2 nanocrystals to ethanol after a 12 h sintering step at 600 °C.
Figure 6.
Response of a gas sensor made of small SnO2 nanocrystals to ethanol after a 12 h sintering step at 600 °C.
Figure 6 shows the response to increasing EtOH concentrations of a SnO
2 sensor made of small nanoparticles that was sintered at 600 °C for 12 h prior to gas sensing. The sensor shows (
Figure 6) similar response and recovery time to that having an as prepared SnO
2 nanoparticle film (
Figure 5). This is in agreement with the identical surface composition and film thickness of the as prepared and sintered SnO
2 films. However, the magnitude of the sensor response was drastically increased with respect to the latter. In particular, the sintered sensor (
Figure 6) had a response of nearly 17 to 10 ppm of EtOH while the as prepared barely reached 8. This is surprising as high temperature sintering is expected to increase crystal size leading to lower sensitivity [
3,
5]. Here, it is suggested that the enhancement of the sensor response arise from the formation of sintering necks with size below that of the main grains between the SnO
2 particles. Formation of partially or fully depleted sintering necks can increase the sensitivity of metal-oxide gas sensors and can hardly be measured by XRD or nitrogen adsorption [
7]. As a result, two instability mechanisms are suggested for the pure SnO
2 nanoparticles. A first, where the average crystal (and grain) size is increased (
Figure 4) resulting in a drop of the sensor response, and a second, where partially depleted sintering necks are formed increasing the sensitivity. Similar effects were observed for size selected SnO
2 agglomerates [
21]. There, very small changes in the sintering properties of the agglomerates that could hardly be tracked by XRD analysis led to drastic variations in their sensing response to EtOH. Both dynamics can be accelerated by a pre-sintering step leading to (
Figure 6) higher response and more stable sensing properties.
The sensing dynamics of the SnO
2-SiO
2 composites was different from that of the pure SnO
2 nanoparticles (
Figure 4,
Figure 5 and
Figure 6). To better investigate the effect of SiO
2 cosynthesis on the sensing properties, all synthesis parameters were kept constant and only the Si-content was varied.
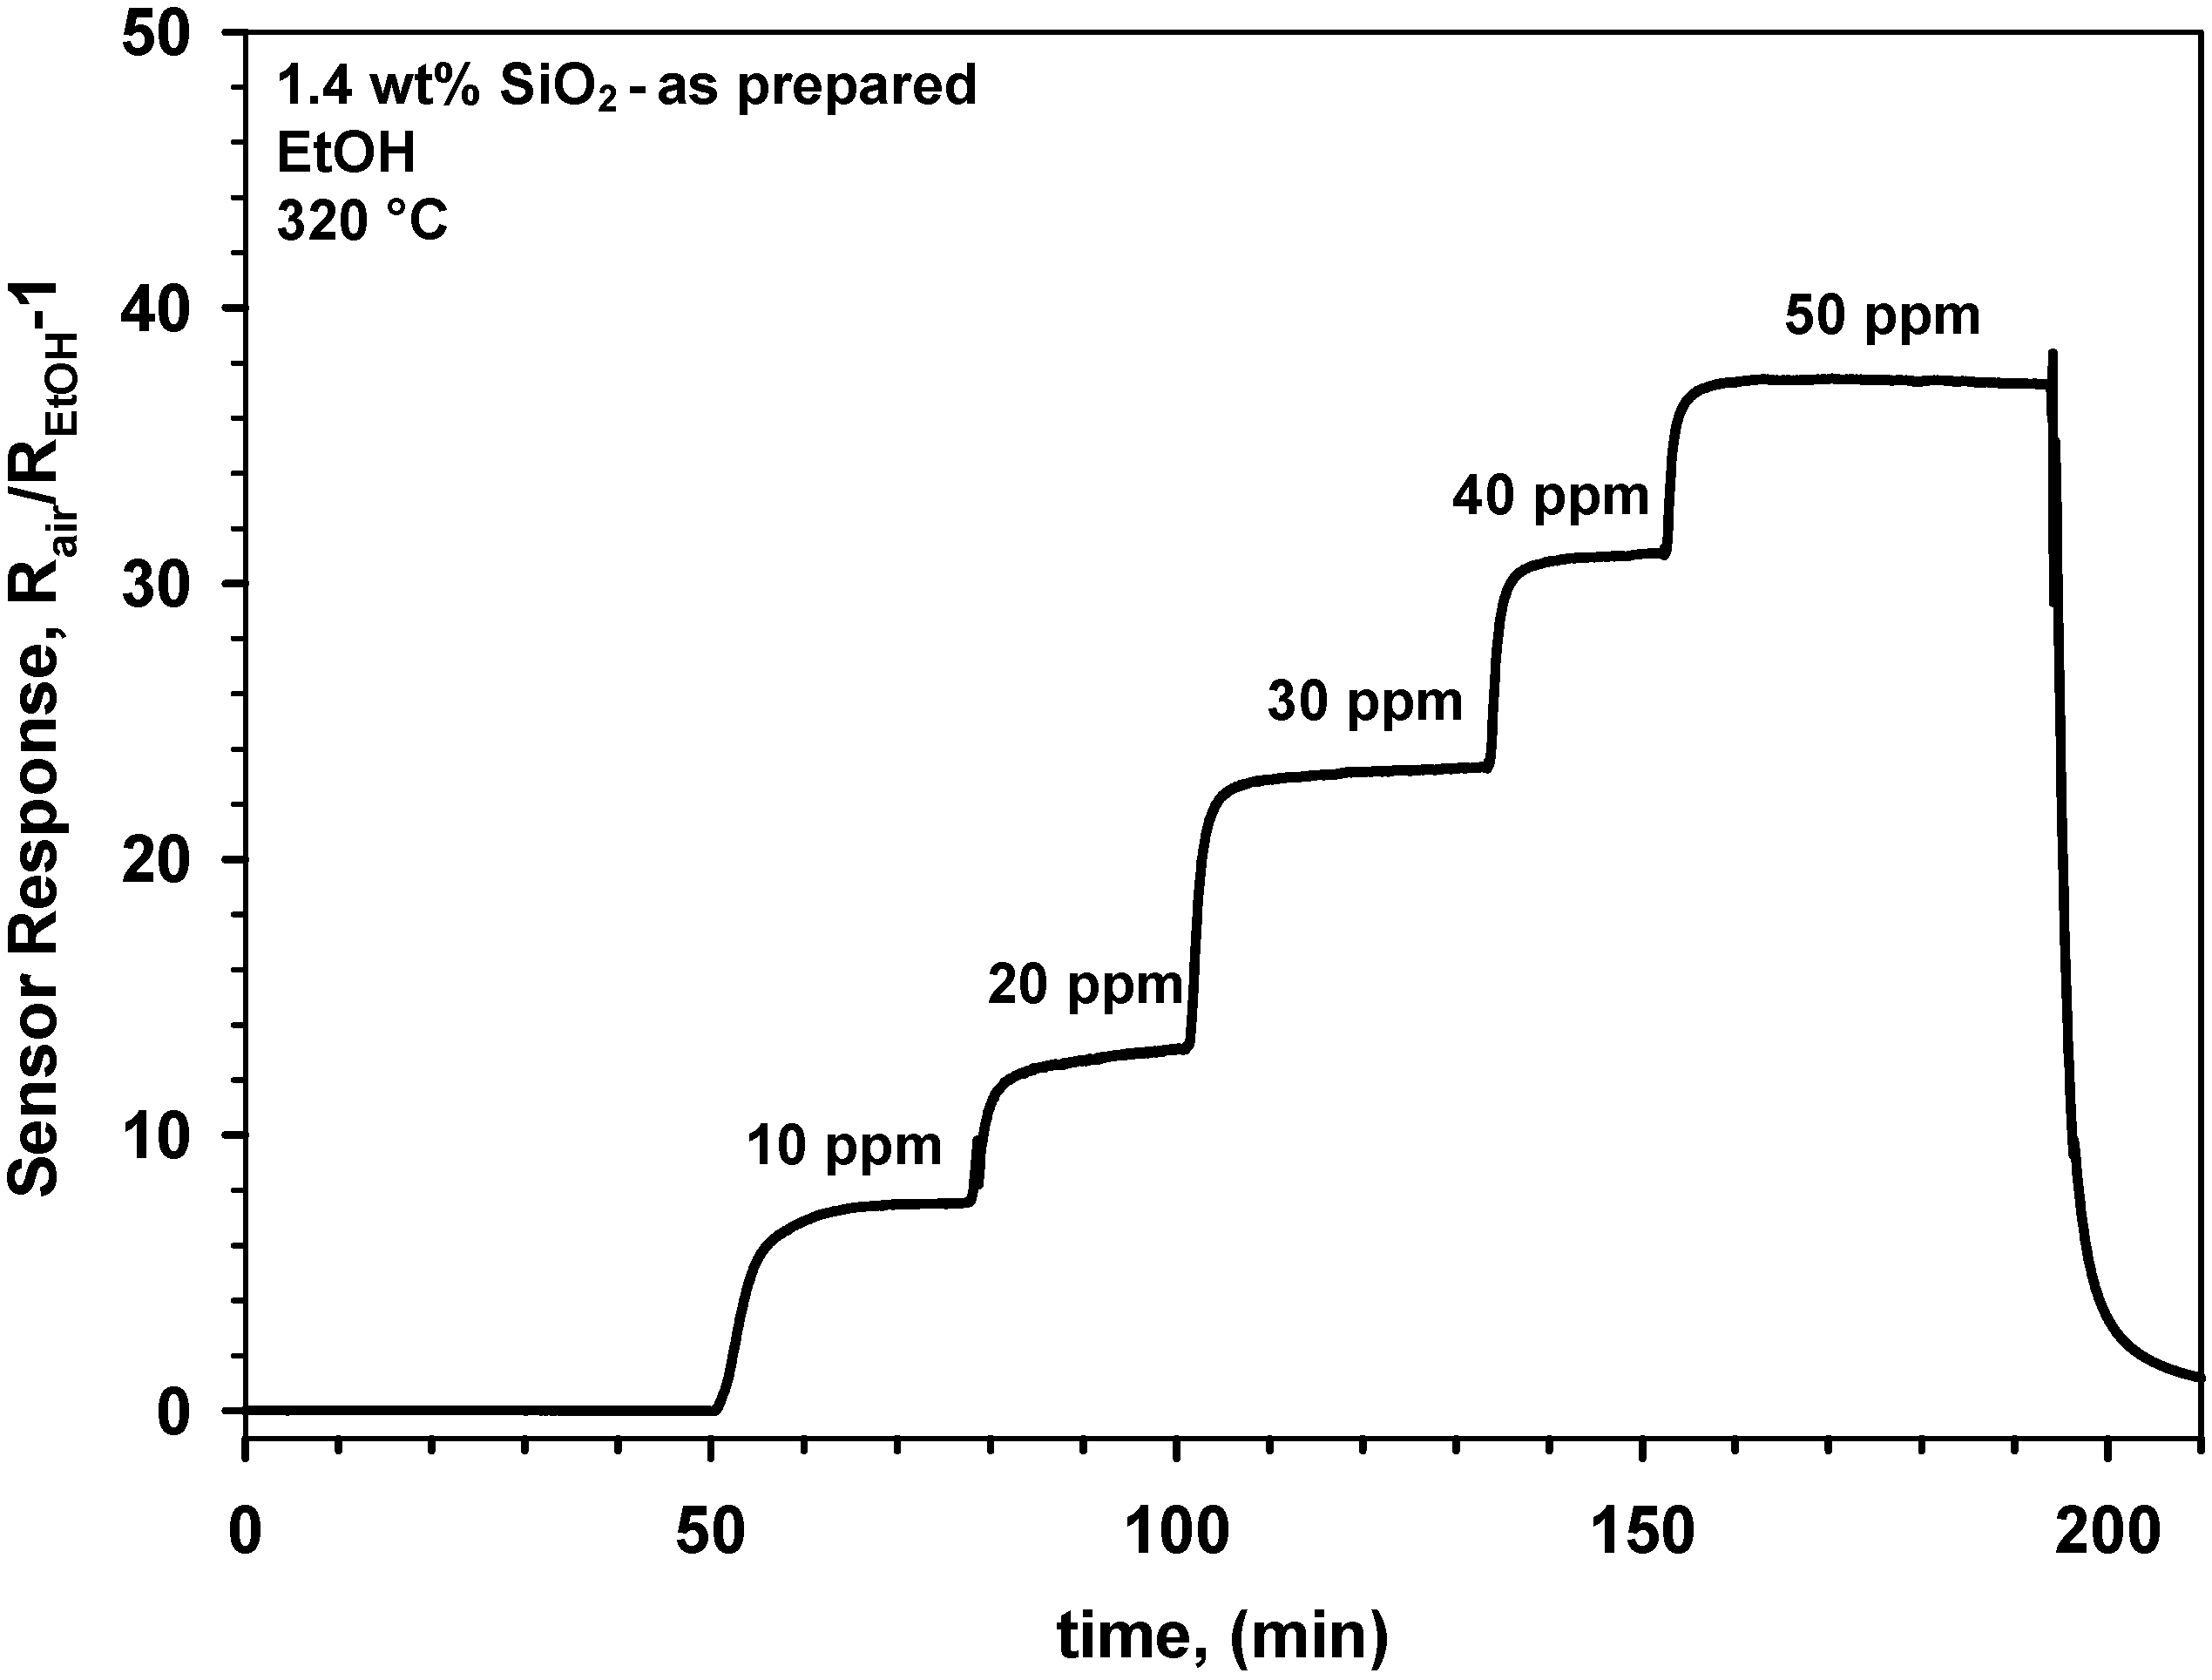
Figure 7 shows the response to step-wise increases in EtOH concentration of a sensor made of as prepared 1.4 wt% SnO
2-SiO
2. The response and recovery times of these nanocomposites (
Figure 7) were comparable to that of the pure SnO
2 (
Figure 5). Nevertheless, the magnitude of the sensor response was initially lower than that of the SnO
2 nanoparticles (
Figure 5) reaching about 37 at 50 ppm EtOH (
Figure 7). This is in contrast to the smaller crystal size of these nanocomposites (
Figure 3, triangles up) that should lead to higher sensitivity [
5]. This is attributed to the sintering inhibition effect of the SiO
2 that may have limited the growth of sintering neck between the main SnO
2 grains.
Figure 7.
Response of a gas sensor made of as prepared 1.4 wt% SnO2-SiO2 nanocomposites to increasing EtOH concentrations in dry air.
Figure 7.
Response of a gas sensor made of as prepared 1.4 wt% SnO2-SiO2 nanocomposites to increasing EtOH concentrations in dry air.
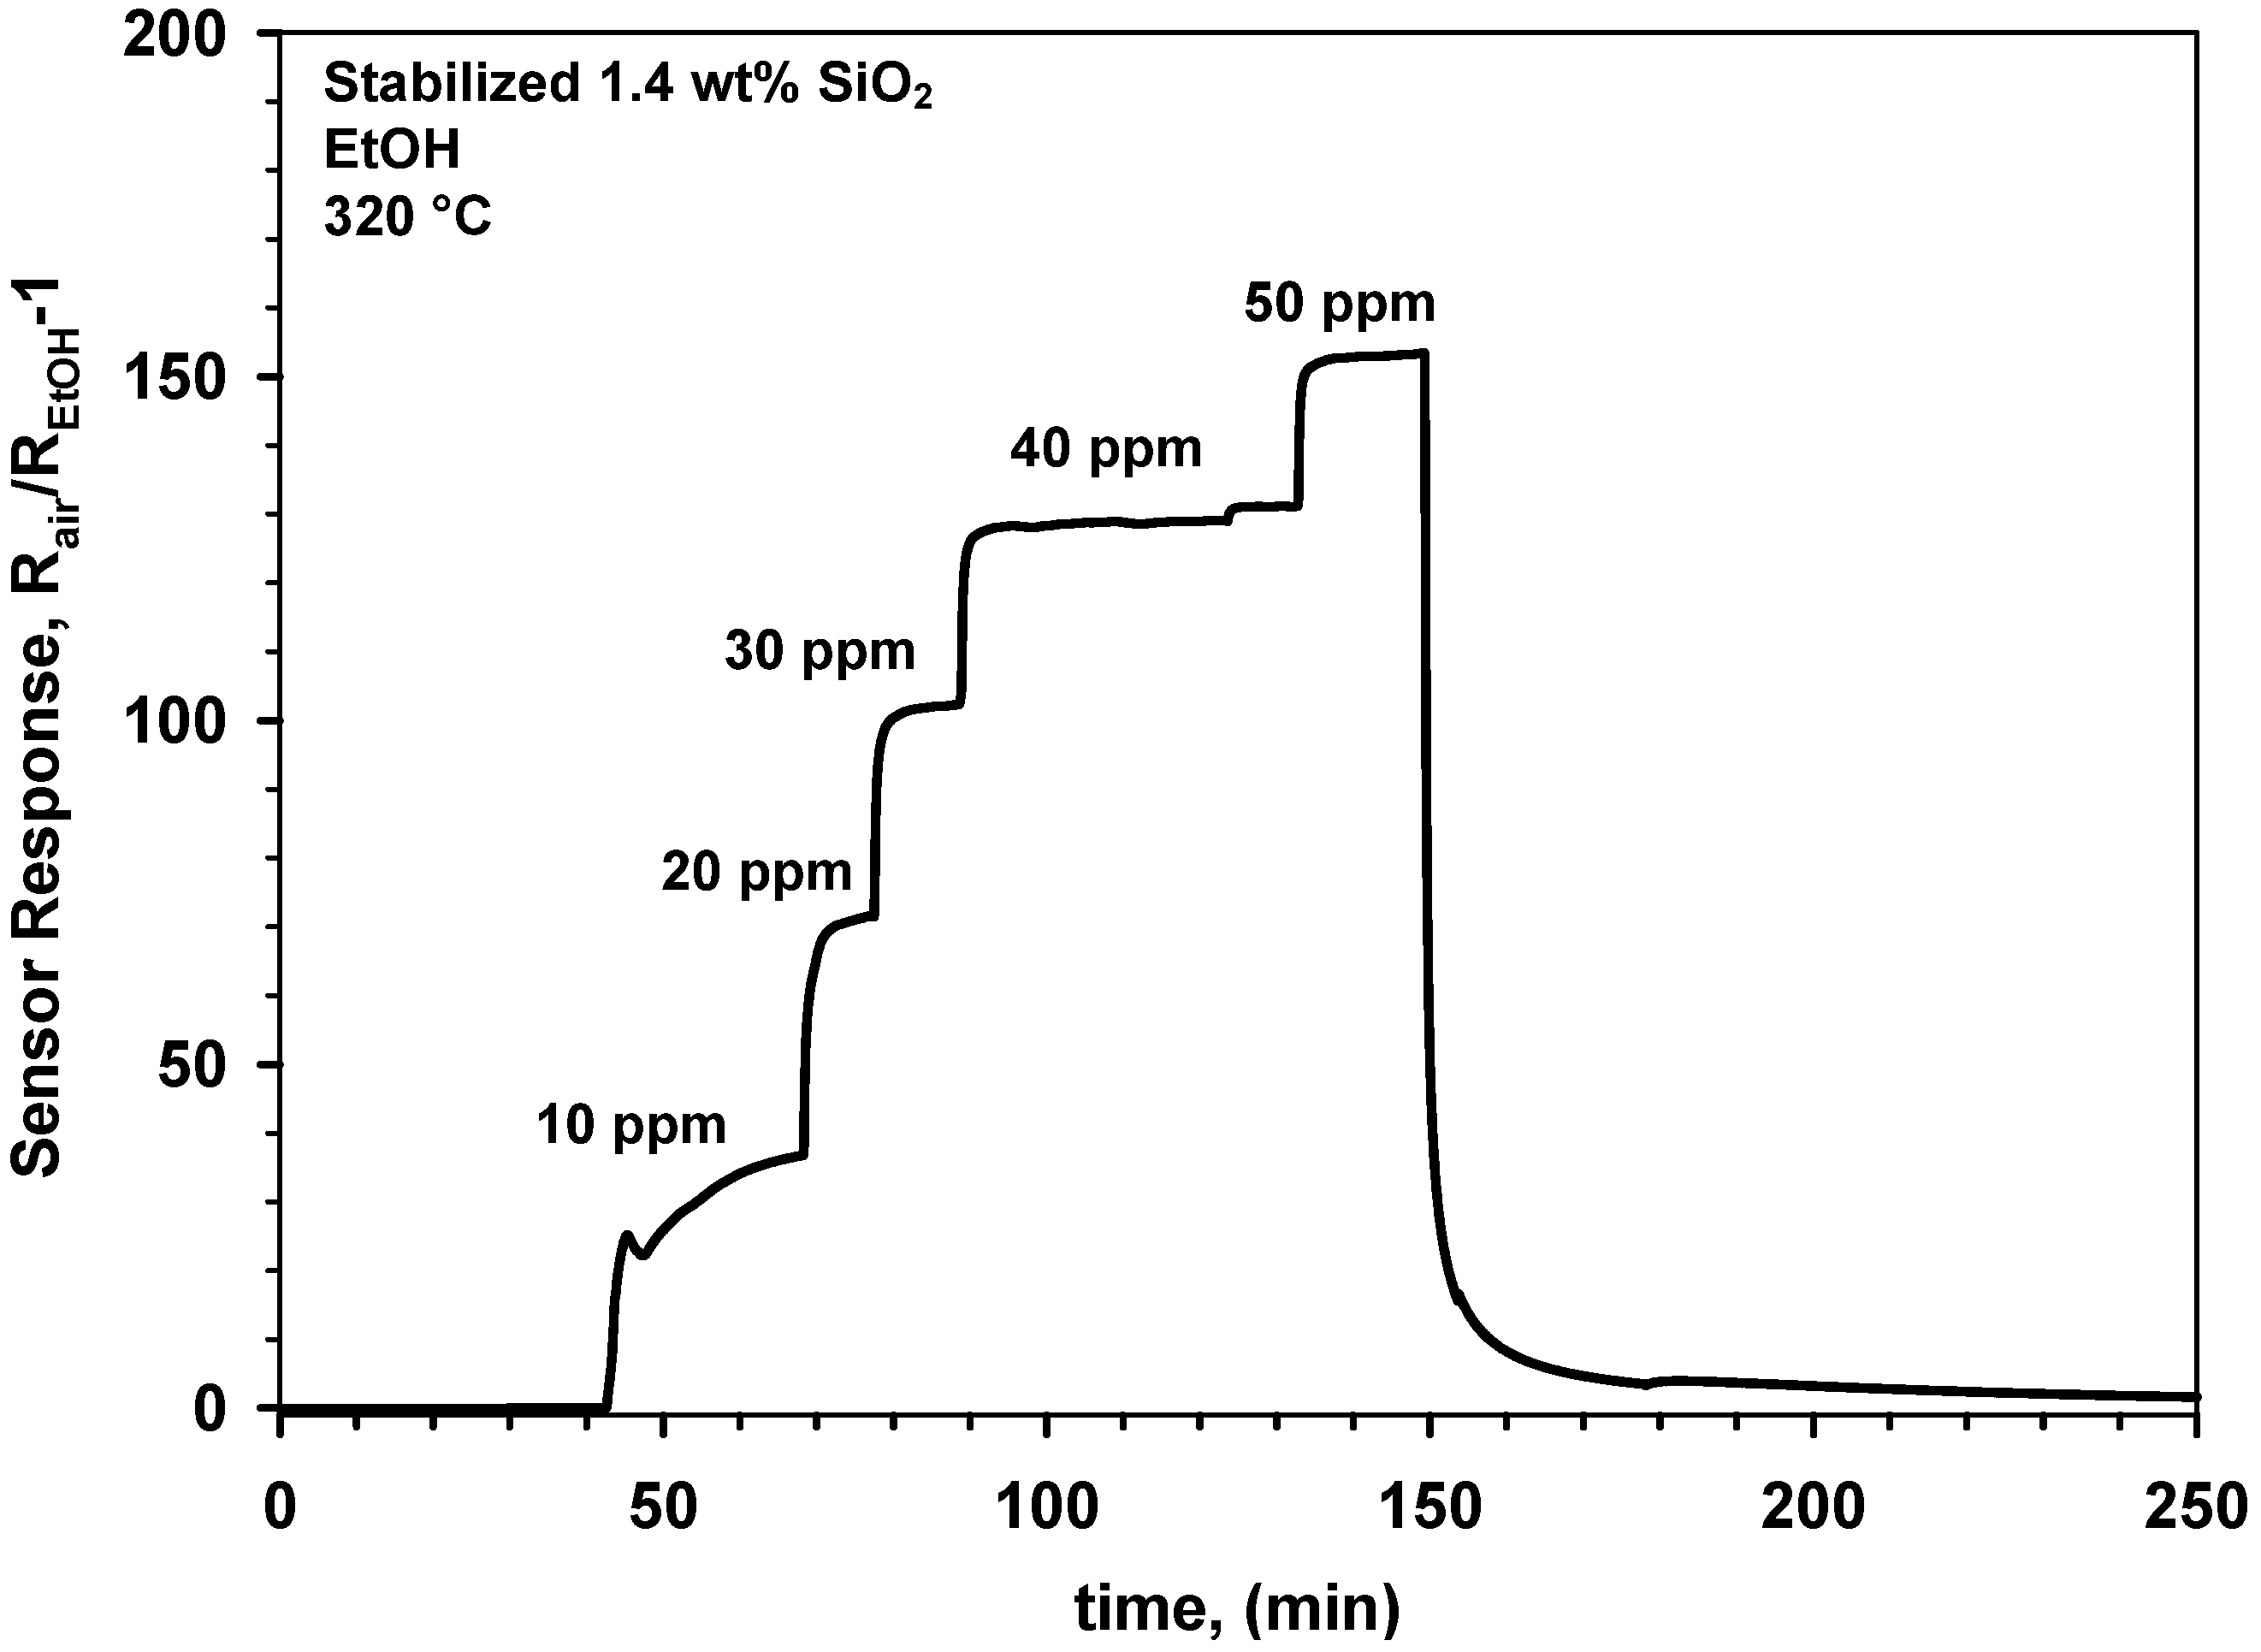
After sintering these films at 600 °C for 12 h, their response was greatly increased (
Figure 8). More in details, upon this stabilization step, the response of the 1.4 wt% SnO
2-SiO
2 to 50 ppm EtOH increased from 37 (
Figure 7) to 153 (
Figure 8). This 4 fold increase in sensitivity is in line with the reported optimal Si-doping of SnO
2 nanoparticles [
7]. Furthermore, it confirms the long-term instability mechanisms observed for pure SnO
2. As the presence of SiO
2 drastically inhibit the crystal growth, the sintering necks formed at 600 °C are smaller and thus more depleted than for pure SnO
2(
Figure 5 and
Figure 6) resulting in a more drastic enhancement of their sensing performance (
Figure 7 and
Figure 8). A more detailed analysis of the neck morphologies and growth dynamics is required to quantitatively describe the sensing response enhancement of these nanocomposites [
4]. Higher SiO
2 contents (
Figure 3), up to 4 wt%, resulted in a similar enhancement of the sensing properties. Overall, cosynthesis of SiO
2 increases the variation of sensor resistance during injection of EtOH concentration as it was previously investigated in details [
7].
Figure 8.
Response to increasing EtOH concentrations in dry air of a gas sensor made of 1.4 wt% SnO2-SiO2 nanocomposites upon stabilization by sintering for 12 h at 600 °C.
Figure 8.
Response to increasing EtOH concentrations in dry air of a gas sensor made of 1.4 wt% SnO2-SiO2 nanocomposites upon stabilization by sintering for 12 h at 600 °C.
3.3. Cross-Sensitivity to Humidity
The stability of the sensor response toward variations in relative humidity is of major importance for several applications [
2,
22]. Doping of SnO
2 nanoparticles with Ti has been reported to drastically decrease their cross-sensitivity to humidity [
9]. Recently, this has been attributed to thermodynamically dictated enrichment of the SnO
2 surface with Ti atoms [
23] that lower the adsorption energy of dissociatively adsorbed H
2O [
24]. The effect of SiO
2 cosynthesis on the cross-sensitivity (CS) to humidity of SnO
2 nanoparticles, however, has not been investigated yet. This is particularly important as flame-made SiO
2 has high surface concentration of hydroxyl groups that facilitate the binding of H
2O molecules [
10] and thus may result in a strong enhancement of the CS to humidity.
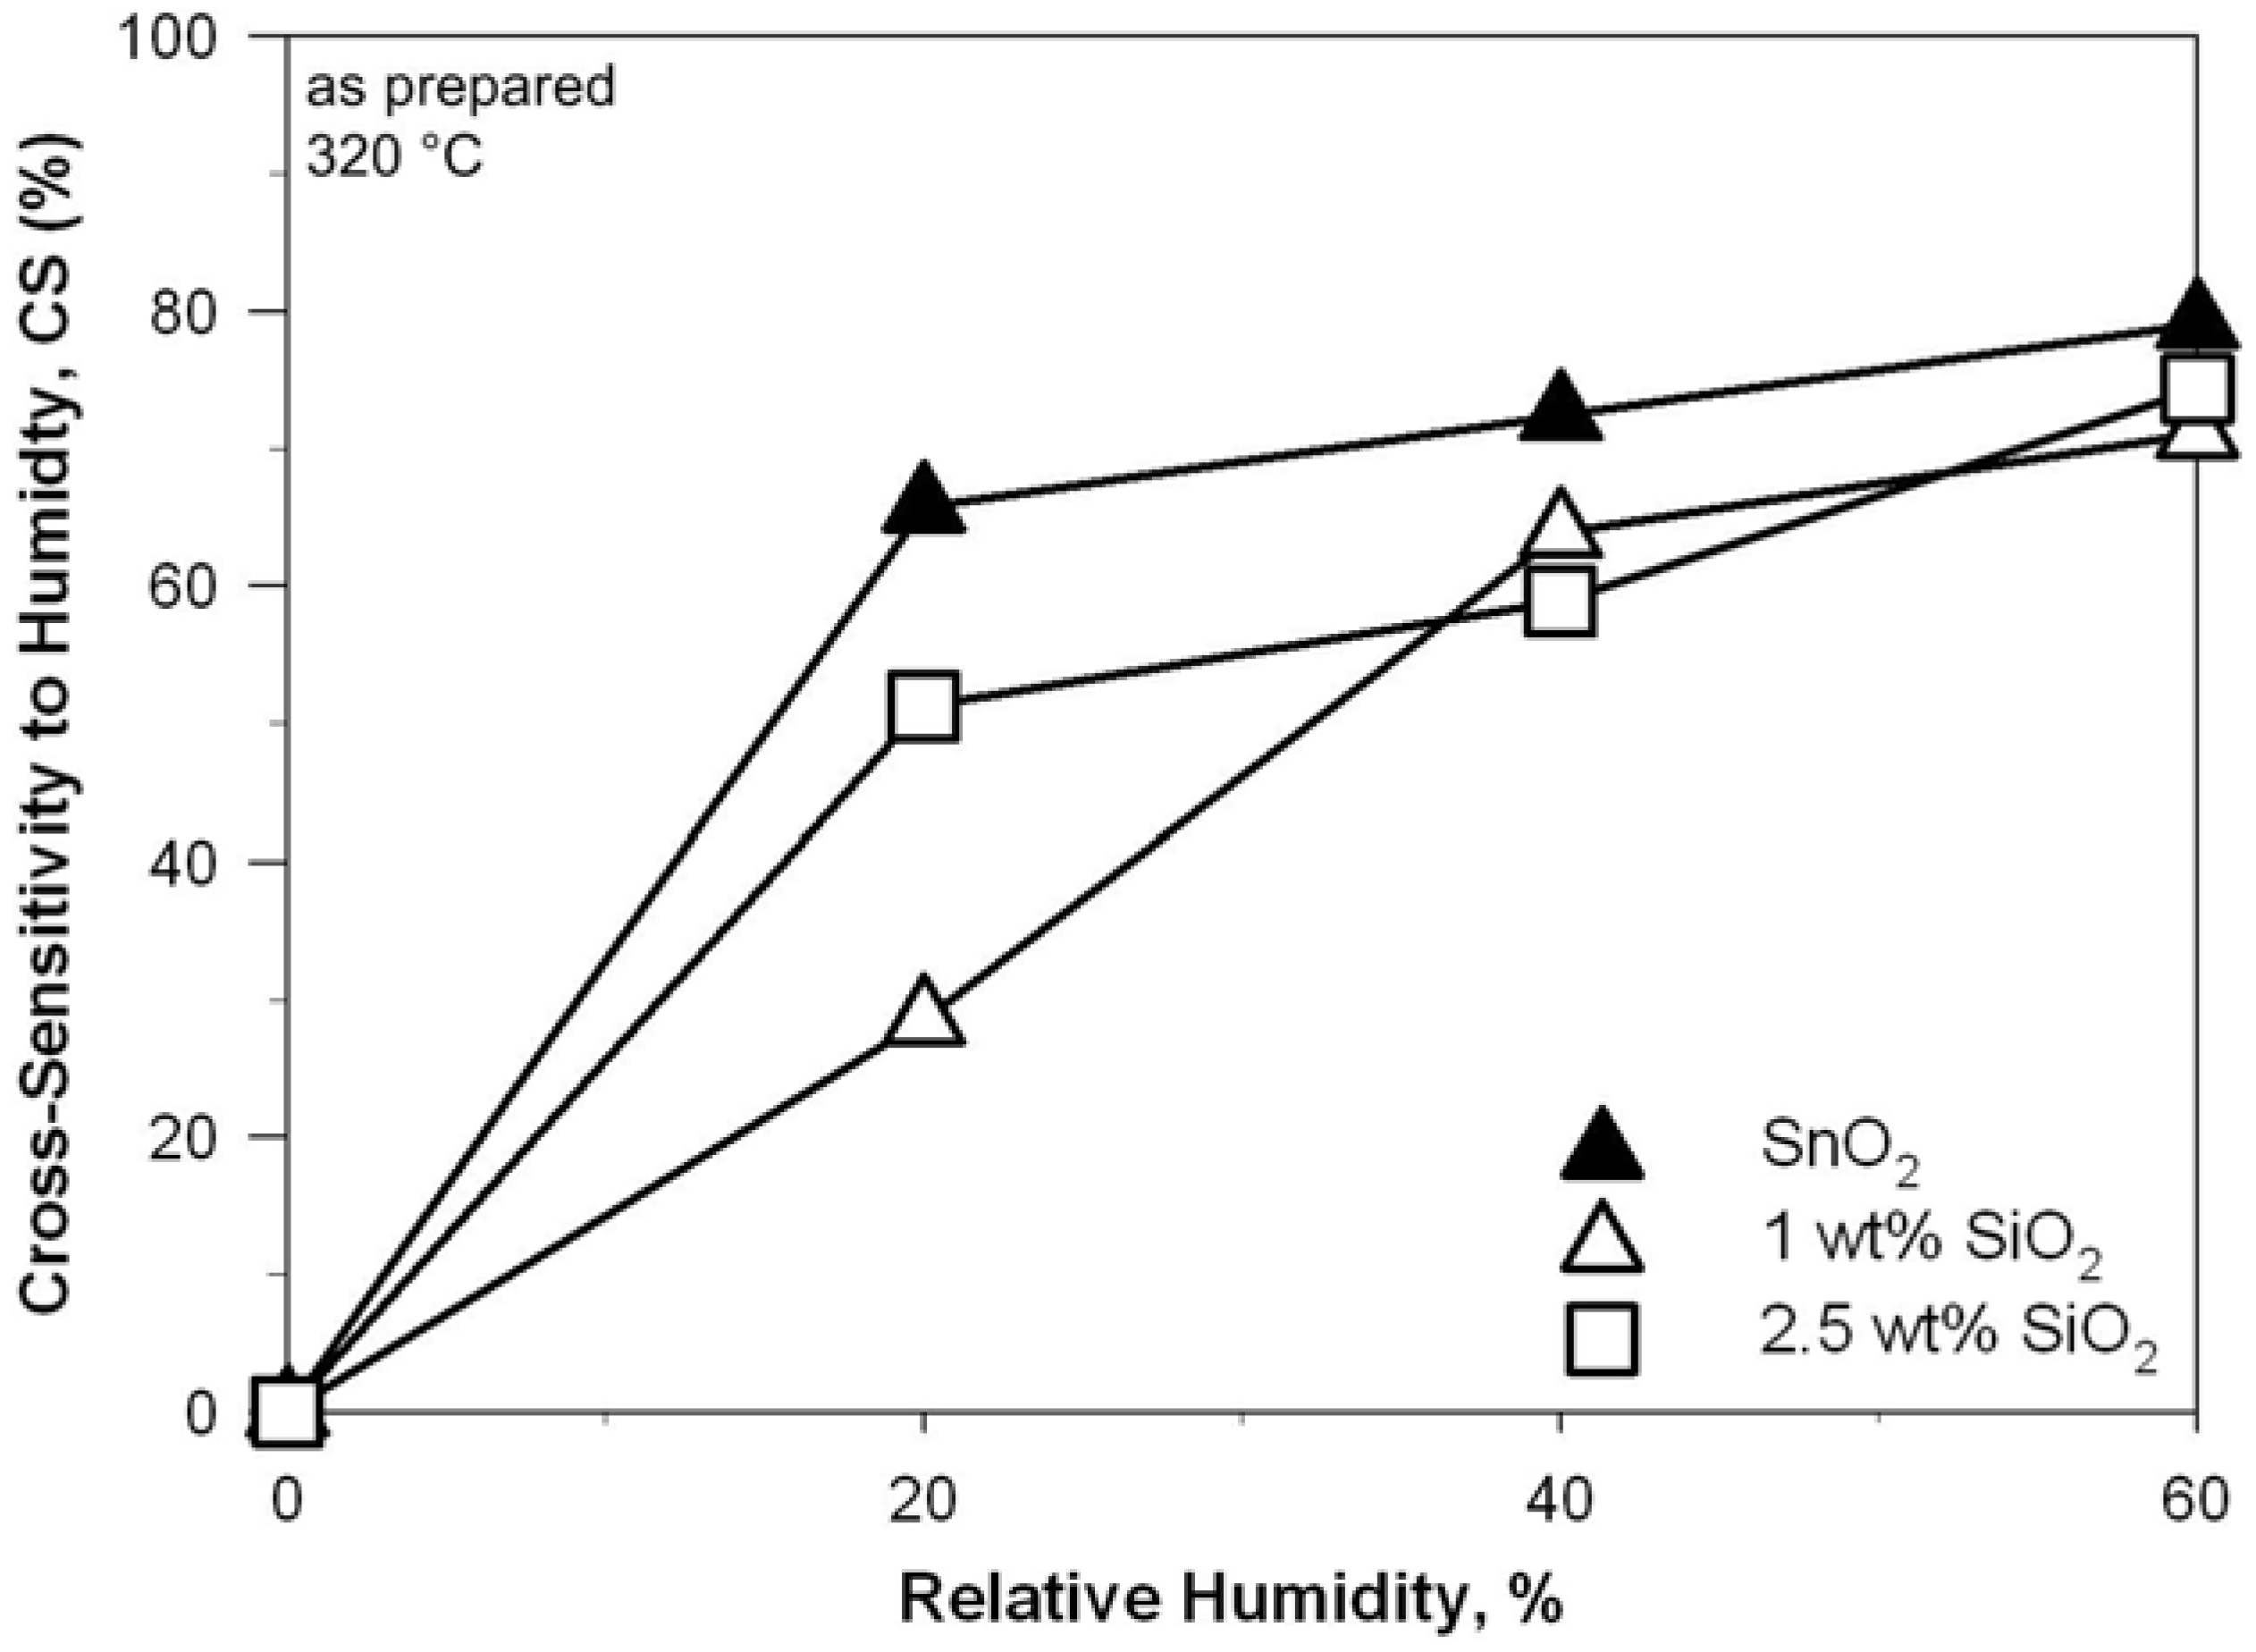
Figure 9 shows the CS to humidity during EtOH detection, defined as change of the sensor response in dry air (Equation (2)), of the pure SnO
2 (triangles solid), 1 wt% (empty triangles) and 2.5 wt% (empty squares) SnO
2-SiO
2 nanocomposites as a function of the relative humidity. The CS to humidity of the pure SnO
2 sensors (
Figure 9, solid triangles) increased from 51 to 74% with increasing r.h. from 20 to 60%. This is in agreement with the drastic change in sensor response reported for SnO
2 nanoparticles with increasing r.h. content [
9]. The continuous increase in CS above 20% r.h. (
Figure 9, solid triangles) indicates that the SnO
2 surface has not yet been saturated with adsorbed H
2O species. More important, the CS of both SnO
2-SiO
2 sensors (
Figure 9, empty squares and triangles) was comparable to that of the pure SnO
2 (
Figure 9, solid triangles). This is different than the effect of Ti-doping [
7] and in contrast to the super-hydrophilic properties of flame-made SiO
2 [
10]. However, as SiO
2 is an isolator, localized SiO
2 molecules/clusters on the SnO
2 surface may act as active sites for H
2O binding but still have minimal impact on the sensing properties of the SnO
2 nanocrystals due to its inefficient electron conduction properties. As a result, SiO
2 cosynthesis leads to the same CS than pure SnO
2 nanoparticles. This is in contrast to the modification of SnO
2 crystals with hydrophilic zeolites [
25,
26] where notable variations from the sensing response of the pure SnO
2 were observed. Minimization of the CS while improving the long-term stability and sensitivity of SnO
2-based gas sensors may be achieved by synthesis of Sn
1−xTi
xO
2-SiO
2 nanocomposites [
9].
Figure 9.
Cross-sensitivity to relative humidity (20 °C) of as prepared SnO2 nanoparticles (solid triangles), and of 1 wt% (empty triangles) and 2.5 wt% (squares) SnO2-SiO2 nanocomposites at 320 °C.
Figure 9.
Cross-sensitivity to relative humidity (20 °C) of as prepared SnO2 nanoparticles (solid triangles), and of 1 wt% (empty triangles) and 2.5 wt% (squares) SnO2-SiO2 nanocomposites at 320 °C.
It should be pointed out that the sensing chamber geometry has considerable influence on the resulting sensor response dynamics as previously discussed in details [
27]. The setup utilized here was previously tested for several other materials [
7,
9,
15,
17] and, for the utilized total gas flow (1 L/min), results in reaction limited sensor responses [
27].


