Miniaturized Quantum Semiconductor Surface Plasmon Resonance Platform for Detection of Biological Molecules

Abstract
:
1. Introduction
2. Experimental Section
2.1. Methodology

 ,
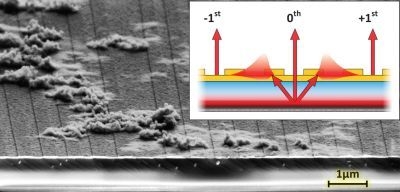
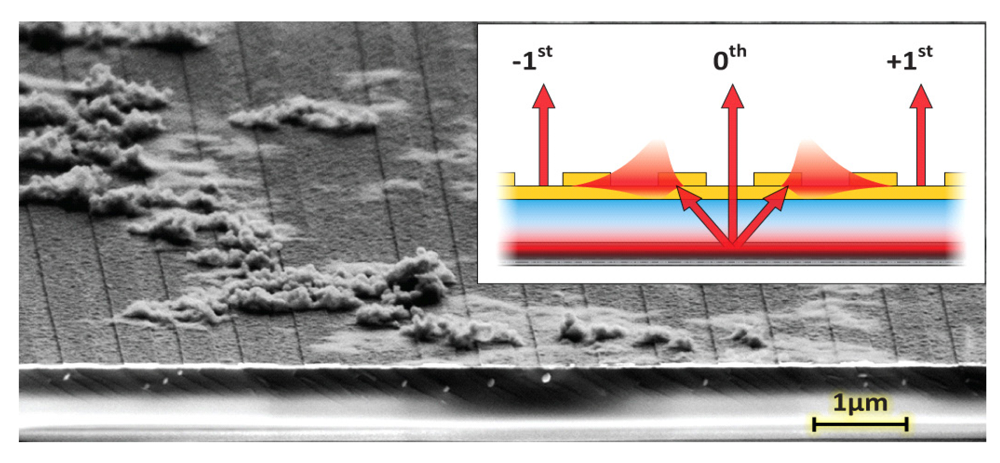
,  ) on the surface, the SPR dispersion in the E(kx, ky) space generates a cone-like shape surface. Note that under normal circumstances kSPR > klight. This SPR dispersion is thus scattered within the light cone by the surface corrugation, through the ±1st diffraction order of a grating for example, to be measured by a microscope in the far field [9,13].
, ) on the surface, the SPR dispersion in the E(kx, ky) space generates a cone-like shape surface. Note that under normal circumstances kSPR > klight. This SPR dispersion is thus scattered within the light cone by the surface corrugation, through the ±1st diffraction order of a grating for example, to be measured by a microscope in the far field [9,13].
) on the surface, the SPR dispersion in the E(kx, ky) space generates a cone-like shape surface. Note that under normal circumstances kSPR > klight. This SPR dispersion is thus scattered within the light cone by the surface corrugation, through the ±1st diffraction order of a grating for example, to be measured by a microscope in the far field [9,13].
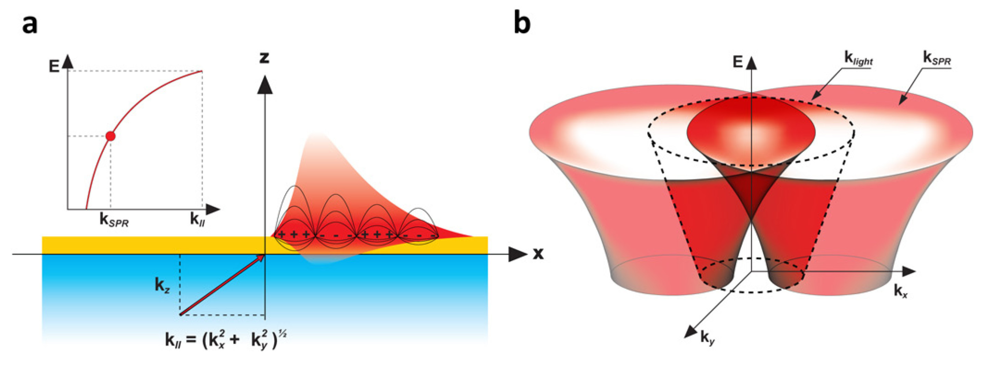
, ) on the surface, the SPR dispersion in the E(kx, ky) space generates a cone-like shape surface. Note that under normal circumstances kSPR > klight. This SPR dispersion is thus scattered within the light cone by the surface corrugation, through the ±1st diffraction order of a grating for example, to be measured by a microscope in the far field [9,13]. and . Therefore, at a given energy, SPR can be induced for all the kll meeting the condition
  . This is shown in Figure 2(b), where the device from Figure 1 supports a continuum of SP modes, whose dispersion relation in E(kx,ky) is given by a cone-like surface. Because of the diffraction by the surface corrugation, the dispersion relation is duplicated within the measurable light cone of a microscope. To understand such a system in detail, and to be able to design various architectures for specific applications, we have developed a tensorial version of the rigorous coupled wave analysis (TRCWA) proposed by Glytsis and Gaylord [10] and later optimized by many authors [11,12]. This tool enabled the complete customization of the integrated structures required for specific applications; in this case the far field extraction of uncollimated and broadband SPR. A commercial hyperspectral microscope (Photon Etc. Inc., Montreal, QC, Canada) has been set up to study the behavior of our QW-SPR system and to image kx-ky directly in the Fourier plane [9,13].
 2.2. Experimental Procedures

3. Results and Discussion


| Variable | Value |
|---|---|
| Surface coverage of physisorbed BSA (0.3 µM) after PBS rinse [17,18] | 0.9949 ng/mm2 |
| Refractive index shift from 0.3 µM BSA in PBS [19,20,21] | 0.0037 RIU @ 650 nm and 870 nm |
| Refractive index of PBS [19,20,21] | 1.3332 @ 650 nm | 1.3293 @ 870 nm |
| Refractive index of BSA monolayer (0.9949ng/mm2) | 1.4531 @ 650 nm | 1.4493 @ 870 nm |
| Average height of BSA [22,23] and Sigma-Aldrich | 1.45 nm |
| Effective refractive index shift after rinsing (Δneff) | 16.75 × 10⁻⁴ @ 650 nm | 10.39℘10−4 @ 870 nm |
| Signal to Noise ratio NanoSPR6 (650 nm) | 501 ± 13 |
| Signal to Noise ratio QW-SPR Conical (870 nm) | 1,831 ± 12 |
| Surface sensitivities and resolutions for NanoSPR6 (650 nm) [13] | ΔS = 149.9 µm−1/RIURes = 9.68℘10−6 RIU |
| Surface sensitivities and resolutions for QW-SPR Conical (870 nm) [13] | ΔS = 7,099 µm−1/RIURes = 1.45℘10−6 RIU |
4. Conclusions
Acknowledgments
Conflict of Interest
References
- Lee, S.J.; Lee, S.Y. Micro total analysis system (micro-TAS) in biotechnology. Appl. Microbiol. Biotechnol. 2004, 64, 289–299. [Google Scholar] [CrossRef]
- Raether, H. Surface Plasmons on Smooth and Rough Surfaces and on Gratings; Springer-Verlag: Berlin, Germany, 1988. [Google Scholar]
- Schasfoort, R.B.M.; Tudos, A.J. Handbook of Surface Plasmon Resonance; RSC Publication: Cambridge, UK, 2008. [Google Scholar]
- Spangler, B.D.; Wilkinson, E.A.; Murphy, J.T.; Tyler, B.J. Comparison of the Spreeta (R) surface plasmon resonance sensor and a quartz crystal microbalance for detection of Escherichia coli heat-labile enterotoxin. Anal. Chim Acta 2001, 444, 149–161. [Google Scholar] [CrossRef]
- Marchesini, G.R.; Koopal, K.; Meulenberg, E.; Haasnoot, W.; Irth, H. Spreeta-based biosensor assays for endocrine disruptors. Biosens. Bioelectron. 2007, 22, 1908–1915. [Google Scholar] [CrossRef]
- Lepage, D.; Dubowski, J.J. Surface plasmon assisted photoluminescence in GaAs-AlGaAs quantum well microstructures. Appl. Phys. Lett. 2007, 91, 163106. [Google Scholar] [CrossRef]
- Lepage, D.; Dubowski, J.J. Surface plasmon effects induced by uncollimated emission of semiconductor microstructures. Opt. Express 2009, 17, 10411–10418. [Google Scholar] [CrossRef]
- Lepage, D.; Jimenez, A.; Carrier, D.; Beauvais, J.; Dubowski, J.J. Hyperspectral imaging of diffracted surface plasmons. Opt. Express 2010, 18, 27327–27335. [Google Scholar]
- Lepage, D.; Jimenez, A.; Beauvais, J.; Dubowski, J.J. Real-time detection of influenza A virus using semiconductor nanoplasmonics. Light Sci. Appl. 2013, 2, e62. [Google Scholar] [CrossRef]
- Glytsis, E.N.; Gaylord, T.K. Rigorous 3-D coupled wave diffraction analysis of multiple superposed gratings in anisotropic media. Appl. Opt. 1989, 28, 2401–2421. [Google Scholar] [CrossRef]
- Li, L.F. Fourier modal method for crossed anisotropic gratings with arbitrary permittivity and permeability tensors. J. Opt. Pure Appl. Opt. 2003, 5, 345–355. [Google Scholar] [CrossRef]
- Schuster, T.; Ruoff, J.; Kerwien, N.; Rafler, S.; Osten, W. Normal vector method for convergence improvement using the RCWA for crossed gratings. J. Opt. Soc. Am. A 2007, 24, 2880–2890. [Google Scholar] [CrossRef]
- Lepage, D.; Jimenez, A.; Beauvais, J.; Dubowski, J.J. Conic hyperspectral dispersion mapping applied to semiconductor plasmonics. Light Sci. Appl. 2012, 1, e28. [Google Scholar] [CrossRef]
- NanoSPR website. Available online: http://www.nanoSPR.com (accessed on 27 May 2013).
- Lepage, D.; Carrier, D.; Jimenez, A.; Beauvais, J.; Dubowski, J.J. Plasmonic propagations distances for interferometric surface plasmon resonance biosensing. Nanoscale Res. Lett. 2011, 6, 388. [Google Scholar] [CrossRef]
- Jimenez, A.; Lepage, D.; Beauvais, J.; Dubowski, J.J. Study of surface morphology and refractive index of dielectric and metallic films used for the fabrication of monolithically integrated surface plasmon resonance biosensing devices. Microelectron. Eng. 2012, 93, 91–94. [Google Scholar] [CrossRef]
- Tencer, M.; Charbonneau, R.; Lahoud, N.; Berini, P. AFM study of BSA adlayers on Au stripes. Appl. Surf. Sci. 2007, 253, 9209–9214. [Google Scholar] [CrossRef]
- Azzam, R.M.A.; Rigby, P.G.; Krueger, J.A. Kinetics of protein adsorption and immunological reactions at a liquid/solid interface by ellipsometry. Phys. Med. Biol. 1977, 22, 422–430. [Google Scholar]
- Ioseliani, O.R. Focus on Eye Research; Nova Science Publishers: New York, NY, USA, 2005. [Google Scholar]
- Barer, R.; Tkaczyk, S. Refractive index of concentrated protein solutions. Nature 1954, 173, 821–822. [Google Scholar] [CrossRef]
- Akimoto, T.; Sasaki, S.; Ikebukuro, K.; Karube, I. Refractive-index and thickness sensitivity in surface plasmon resonance spectroscopy. Appl. Opt. 1999, 38, 4058–4064. [Google Scholar] [CrossRef]
- Arwin, H. Optical propoerties of thin layers of bovin serum albumine, γ-globulin, and hemoglobulin. Appl. Spectrosc. 1986, 40, 313–318. [Google Scholar] [CrossRef]
- Lousinian, S. Optical properties of proteins and protein adsorption study. Microelectron. Eng. 2007, 84, 479–485. [Google Scholar] [CrossRef]
- Hoa, X.D.; Kirk, A.G.; Tabrizian, M. Towards integrated and sensitive surface plasmon resonance biosensors: A review of recent progress. Biosens. Bioelectron. 2007, 23, 151–160. [Google Scholar] [CrossRef]
- Huang, Y.H.; Ho, H.P.; Kong, S.K.; Kabashin, A.V. Phase-sensitive surface plasmon resonance biosensors: Methodology, instrumentation and applications. Ann. Phys.-Berlin. 2012, 524, 637–662. [Google Scholar] [CrossRef]
© 2013 by the authors; licensee MDPI, Basel, Switzerland. This article is an open access article distributed under the terms and conditions of the Creative Commons Attribution license (http://creativecommons.org/licenses/by/3.0/).
Share and Cite
Lepage, D.; Dubowski, J.J. Miniaturized Quantum Semiconductor Surface Plasmon Resonance Platform for Detection of Biological Molecules. Biosensors 2013, 3, 201-210. https://doi.org/10.3390/bios3020201
Lepage D, Dubowski JJ. Miniaturized Quantum Semiconductor Surface Plasmon Resonance Platform for Detection of Biological Molecules. Biosensors. 2013; 3(2):201-210. https://doi.org/10.3390/bios3020201
Chicago/Turabian StyleLepage, Dominic, and Jan J. Dubowski. 2013. "Miniaturized Quantum Semiconductor Surface Plasmon Resonance Platform for Detection of Biological Molecules" Biosensors 3, no. 2: 201-210. https://doi.org/10.3390/bios3020201