Article

Towards Simazine Monitoring in Agro-Zootechnical Productions: A Yeast Cell Bioprobe for Real Samples Screening

1
Istituto per lo Studio dei Materiali Nanostrutturati, Consiglio Nazionale delle Ricerche, P.le Aldo Moro 7, 00185 Roma, Italy
2
Dipartimento di Scienze e Tecnologie per l’Agricoltura, le Foreste, la Natura e l’Energia, Università degli Studi della Tuscia, 01100 Viterbo, Italy
3
Dipartimento Malattie Cardiovascolari, Dismetaboliche e dell’Invecchiamento, Istituto Superiore di Sanità, Via Giano della Bella 34, 00162 Roma, Italy
*
Author to whom correspondence should be addressed.
Biosensors 2018, 8(4), 112; https://doi.org/10.3390/bios8040112
Submission received: 1 October 2018 / Revised: 31 October 2018 / Accepted: 7 November 2018 / Published: 15 November 2018

Abstract

:
Simazine is an herbicide that is able to contaminate surface waters, ground waters, and milk/dairy products, thus posing concerns in both environmental health and food safety. A yeast-based bioprobe was utilized to detect simazine in spiked real samples of livestock drinking water and raw cow’s milk. Yeast aerobic respiration was taken as short-term toxicological endpoint. We carried out comparative measures of yeast oxygen consumption between simazine-spiked samples and blank samples. Percentage interference (%ρ) on yeast aerobic respiration was calculated through the comparison of aerobic respiration of simazine-exposed and non-exposed yeast cells. The method was optimized for raw cow’s milk samples by using boric acid as fungistatic agent in order to avoid cellular proliferation. Overall, the results have shown that simazine can be detected up to concentrations five times below the EU legal concentration limits for drinking water (0.02 ppb) and cow’s milk (2 ppb) (%ρ values of 18.53% and 20.43% respectively; %RSD ≤ 15%). Dose-effect relationships of simazine were assessed. The findings of the bioassays match reasonably well with known mechanisms of toxicity and intracellular detoxification in yeast. A correlation between fat content in milk samples and analytical performance of the bioprobe was established. Results suggest the involvement of a matrix effect, presumably due to lipid sequestration of simazine. The yeast-based bioprobe has proved to be sensitive and suitable for the detection of simazine in real samples in concentrations of interest.

Graphical Abstract

1. Introduction

The chloro-s-triazines is an important family of pre-emergence herbicides extensively used for weed control in crop areas of e.g., corn, sorghum, sugarcane, orchards, and perennial crops, well as in non-crop areas. In particular, simazine (6-chloro-N,N′-diethyl-1,3,5-triazine-2,4-diylamine) is one of the most relevant members of chloro-s-triazines, as it is an herbicide additionally used as a desiccant, defoliant and as algaecide for the aquatic weed control [1]. Simazine is a chemical of great agronomical importance worldwide. In fact, even though simazine use as herbicide was banned in the European Union [2], it is still utilized in many countries, including the United States (in particular in California) [3], Canada, Brazil, and China (the world’s largest producer and consumer of simazine) [4]. Simazine is moderately persistent in the environment [5], and due to its water solubility (6.2 mg/L) and its relatively low soil adsorption coefficient, (Koc = 130), it is likely to contaminate both surface and groundwater. Indeed, simazine is the second most commonly detected pesticide in surface and ground waters in the United States, Europe, and Australia [1]. Since 2005, simazine is no more in production in Italy, but it is still present in Italian natural waters [6].
Simazine can carry over in foods of animal origin, e.g., in milk from cows consuming contaminated forage crops and/or drinking contaminated water [7,8,9]. Environmental and food contamination by simazine raises concern over public health. Indeed, together with toxicity associated with the inhibition of photosynthesis and grana thylakoid damage [10], other toxic effects on non-target organisms are reported in literature, including endocrine-disrupting effects [11,12,13], in vitro neurotoxicity [14], oxidative stress in common carp [15], and toxicosis in sheep and cattle [16,17].
Against this background, the availability of reliable screening methods for the on-site detection of simazine residues in environmental and food matrices is of utmost importance. In recent literature, different screening methods for simazine detection in water samples based on chromatographic methods coupled to time-of-flight mass spectrometry have been described [18,19,20,21,22]. Although these methods are highly sensitive, they often require sample pretreatment steps, are costly, and require bulky equipment; furthermore, only highly skilled personnel can perform the analyses. A flow injection chemoluminescence-based method has also been developed for triazines detection in natural waters [23]. However, a solid phase extraction step was required to remove the interference of natural organic matter and concentrate the samples.
During the last few years, several sensor-based detecting methods and devices have been developed for the detecting of pesticide residues or biocidal active substances (including insecticides, fungicides, and herbicides) [24,25,26]. Biosensoristic devices (i.e., sensoristic devices that use biological responsive elements) are promising tools with interesting analytical features, which can be potentially exploited for on-site field applications for both environmental and food matrices (e.g., agricultural waters and cow milk) [27]. Whole cell-based biosensoristic devices are characterized by a different analytical approach compared to other biosensoristic devices and chemical analyses [28]. Through the selection of a given cellular function and an appropriate short-term in vitro biochemical endpoint, the use of intact biological entities allows a rapid assessment of levels of different chemical contaminants (in structure and in type) based on bioactivity on the selected cellular function. This approach is more useful for environmental/food safety risk assessments than a ‘substance-by-substance’ approach that may result in underestimations of risks and real levels of chemical contamination. A microalgae whole cell-based, optic biosensoristic device has been previously tested for simazine detection, but not in real environmental or food samples [29].
The budding yeast Saccharomyces cerevisiae is a well-consolidated eukaryotic model organism for genetic and toxicology studies [30]. Cellular aerobic respiration has been shown to be a susceptible target of bioactivity of several organic and inorganic chemical contaminants (e.g., herbicides, surfactants and heavy metals). In our previous works, interference on cellular aerobic respiration in S. cerevisiae were utilized as the integral toxicity index for the detection of platinum-group elements [31], wood preservatives [32], and herbicide diuron [33].
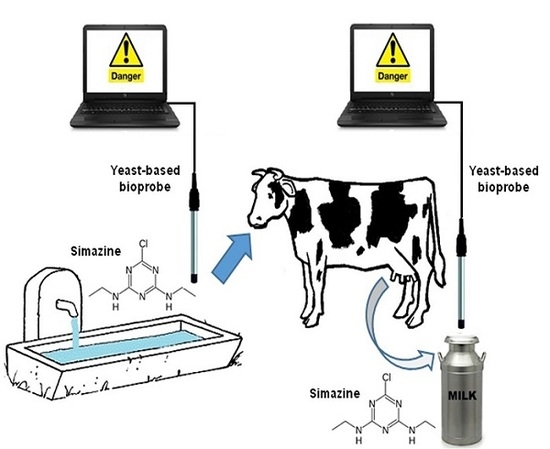
In this work, a yeast-based biosensoristic device (hereinafter referred to as ‘bioprobe’) was used in respirometric bioassays to detect simazine in real samples of livestock drinking water and raw cow’s milk.

2. Materials and Methods

2.1. Simazine Solution

Simazine solutions were verified through spectrophotometric measurements (UV2 UV/Visible, Unicam Instruments, Cambridge, UK) at the fixed wavelength of λ = 224 nm, i.e., the wavelength of maximum absorbance for simazine [34]. Baseline measurement were performed at λ = 224 nm on methanolic aqueous solution. The latter was also used as reference for simazine solution measurements. All measurements were carried out in quartz cuvettes with 1 cm optical path lengths. All solutions were kept in the dark and stored at 4 °C. The simazine concentrations tested are indicated in Table 1.

2.2. Other Chemical Solutions

For bioassays in water samples, a 3 mol/L stock solution of glucose was prepared in high-purity deionized water (Milli-Q system, Merck Millipore, Billerica, MA, USA) from glucose D (+) 99.5% GC (Sigma Aldrich, St. Louis, MO, USA). Aliquots of glucose stock solution were added to each tested water sample as the carbon source for S. cerevisiae cells (final concentration 0.5 mol/L glucose).
For bioassays in raw cow’s milk, no glucose solution addition was required. A 3.2% w/v boric acid stock solution (BioReagent, for molecular biology, suitable for cell culture, suitable for plant cell culture, ≥99.5%, Sigma Aldrich) was prepared in high-purity deionized water. Aliquots of stock solution (0.480 mL) were added to each tested raw cow’s milk samples (final concentration of 0.16%) to prevent S. cerevisiae proliferation during the measurements.

2.3. Samples

Real samples were collected from ‘Elio Pascolini’ dairy farm (Lazio region, 41°54′47.94″ N, 12°15′48′25″ E). Livestock drinking water was manually sampled from water troughs by placing under the tap sterile Pyrex glass bottles according to the ISO standard (ISO/TC 147/SC 6/WG1 Sampling management and ISO/TC 147/SC 6/WG 3 Preservation and handling of samples). Raw cow’s milk was manually sampled from the refrigerated milk-farm bulk tank. To ensure sample homogeneity, milk was agitated for at least 10 min before sampling, and it was collected in sterile Pyrex glass bottles [35]. Before each bioassay, samples were kept cooled (4 °C), and they were tested within 24 h. Chemical analysis were performed to test for the presence of heavy metals, pesticides, and mycotoxins. All the substances were below the legal thresholds (Tables S1 and S3). For comparative tests, commercial UHT milk (whole, semi-skimmed and skimmed) was purchased in a local supermarket (chemical composition is reported in Table S2).

2.4. S. cerevisiae Suspensions

Yeast suspensions (500 mg/mL) were prepared daily starting from 50 mg ± 1.0 mg dried yeast (Saccharomyces cerevisiae yeast, Type II, Sigma Aldrich) rehydrated with 10 mL of Milli-Q water in sterilized test tubes 12 h before the bioassay. The most appropriate cellular concentration of yeast stock suspension used in the present work (1.5 × 10⁸ colony forming unit/mL or cfu/mL) and the 1:100 dilution ratio for the bioassays were defined by preliminary tests at different S. cerevisiae cells/simazine dose ratios. Indeed, sensitivity and limit of detection (LoD) of a cytotoxicity assay mainly depend from the number of cells/chemical contaminant dose ratio [36]. Turbidimetric measurements of optical density at the wavelength of 525 nm (OD525nm) were performed on eight serial dilutions of a yeast cell stock suspension (yeast stock suspension 1.5 × 10⁸ cfu/mL) in quartz cuvettes with 1 cm optical path lengths against water as reference (UV2 UV/Visible, Unicam Instruments, Cambridge, UK). Before turbidmetric measurement, for each dilution cell, counting was carried out using a counting chamber and a Reichert-Jung MicroStar 110 microscope, Leica Microsystems Wetzlar, Germany (range of colony-forming unit/mL between 5 × 10⁵–5 × 10⁶ cfu/mL). The calibration curve was constructed by plotting OD525nm vs. cfu/mL values (y = 10−7 × −0.0001), and good agreement (R2 = 0.9986) was found between OD525nm and yeast cellular concentration (Figure S1).

2.5. Yeast Cell Proliferation Control

Non-proliferation condition represents a key aspect of the respirometric bioassay: indeed, the variation of dissolved O2 between the two steady states is linked to cellular O2 consumption rate of yeast suspension, and it is proportional to cell concentration. Thus, if the cell population remains constant during the bioassay running time, any variation of this parameter for the exposed cellular suspensions compared with the control (in the same non-proliferating condition) can be associated with an interference with cellular aerobic respiration. For livestock drinking water samples, no significant cellular proliferation during bioassays has occurred (ΔOD525nm ≤ 0.05 a.u.). Conversely, cow’s milk can support S. cerevisiae yeast growth [37], as we also confirmed by a set of preliminary bioassays. In order to guarantee the non-proliferation condition for the 2 h. running time of the test, the effectiveness of boric acid (H3BO3) as fungistatic agent [38] was tested for milk samples. Three final concentrations of boric acid (0.10, 0.16% and 0.20% w/v) were tested on raw milk samples adding aliquots of a 3.2% w/v boric acid stock solution and 0.150 mL of 500 mg/mL S. cerevisiae cell suspension (1.5 × 10⁸ cfu/mL). O2 consumption was monitored for 12 h and it was compared with O2 consumption in control raw milk samples (without boric acid).

2.6. Bioassays

A yeast-based probe involves two main components: (i) S. cerevisiae cell suspension as biological recognition element (0.150 mL of 500 mg/mL yeast cell suspension added to each samples), (ii) Clark-type oximeter (model 360, Amel Instruments S.r.l., Milano, Italy) as amperometric transducer, to measure instantly changes in dissolved oxygen (O2) concentration in tested samples. Two-point calibration of Clark-type oximeters was done before every test, as described in Dragone et al. 2015 [33].
The array of yeast-based bioprobe (Figure S2) was assembled in an open system (i.e., oxygen into the samples was in equilibrium with the oxygen in the air). Samples were placed into open measurement glass chambers (25 mL), and thermostat controlled (28.0 ± 0.1 °C) under constant magnet stirring (200 rpm).
The experimental set-up of each bioassay included two groups of samples.
Livestock drinking water samples
  • Blank samples: 12.500 mL sample + 2.500 mL of 3 mol/L glucose solution + 0.150 mL of methanolic solution (concentration < 0.1%) without simazine
  • Simazine-spiked samples: 12.500 mL sample + 2.500 mL of 3 mol/L glucose solution + 0.150 mL methanolic solution (concentration < 0.1%) of simazine
Raw cow’s milk samples
  • Blank samples: 13.875 mL of sample + 0.750 mL of 3.2% w/v boric acid solution + 0.375 mL of methanolic solution (concentration < 0.1%) without simazine
  • Simazine-spiked samples: 13.875 mL of sample + 0.750 mL of 3.2% w/v boric acid solution + 0.375 mL methanolic solution (concentration < 0.1%) of simazine
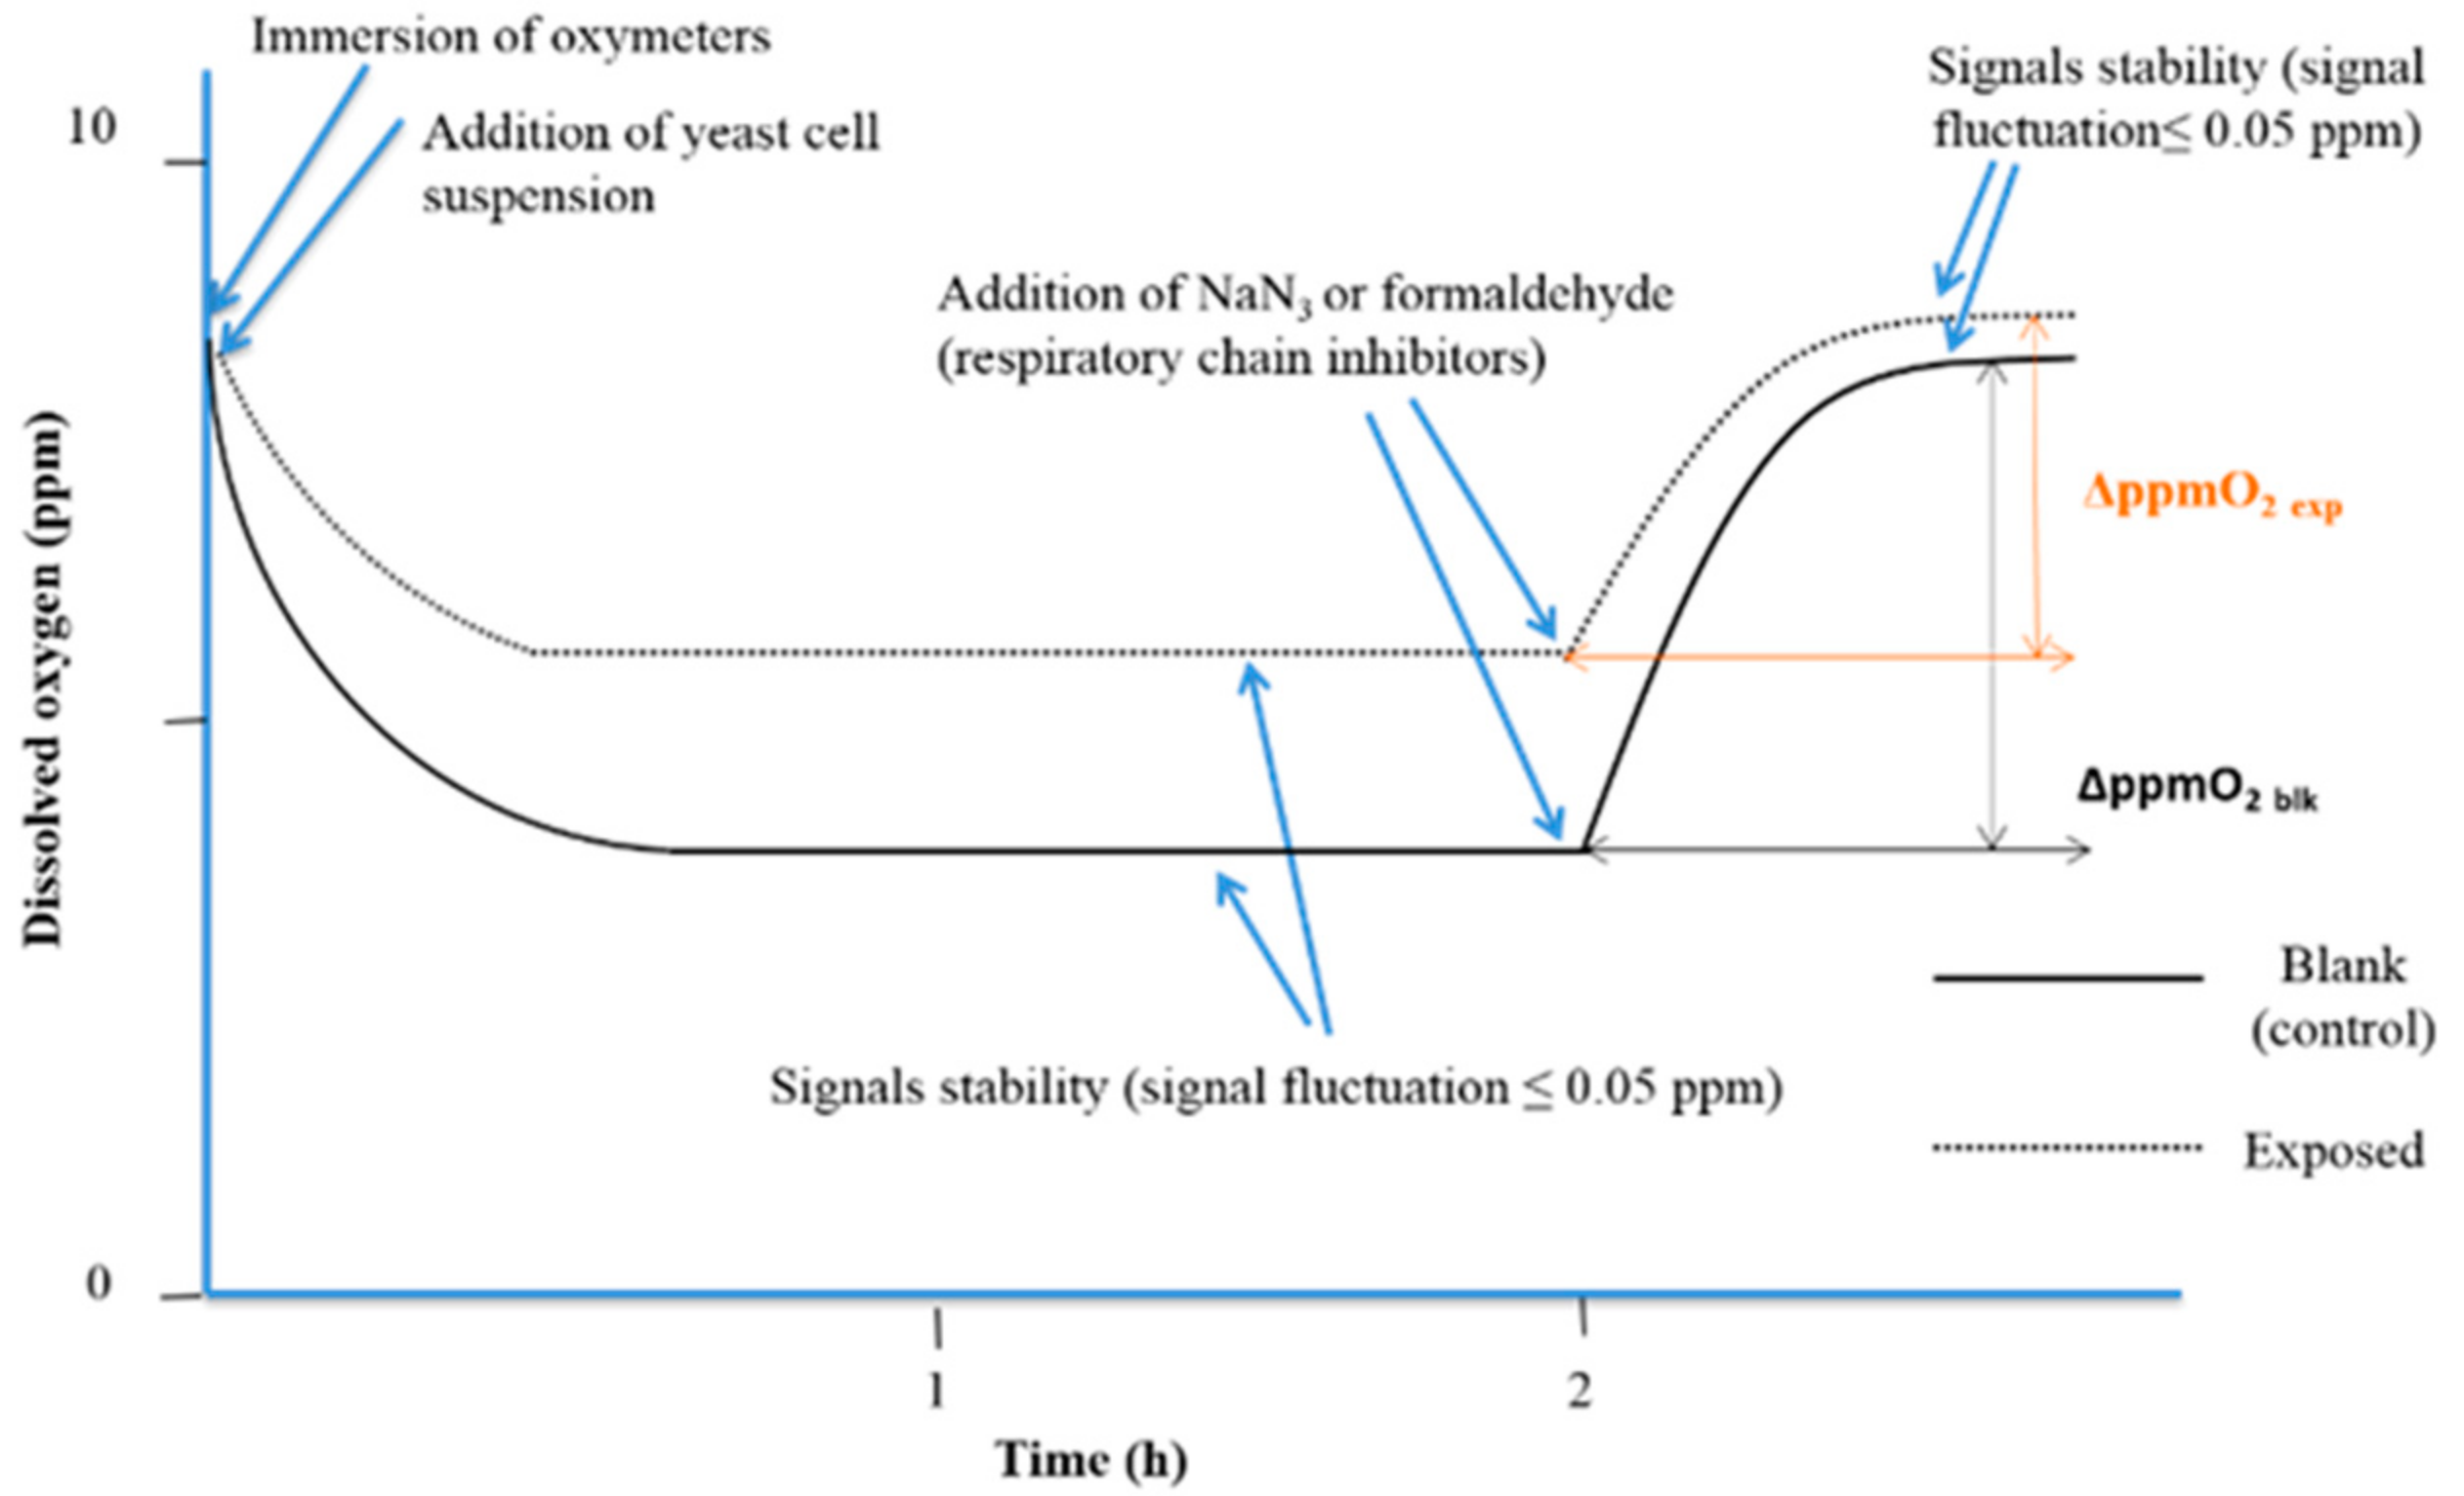
During the bioassay, an experimental respirometric curve (dissolved O2 vs. time) for blank and simazine spiked samples (see example in Figure 1) was acquired through a continuous data logger.
When the cellular oxidation rate equalizes the O2 diffusion rate from the air, a stationary state is reached (signal stability with fluctuation less than 0.05 ppm). After 2 h. of exposure to simazine, 150 µL of 0.2 mol/L sodium azide (NaN3 ≥ 99.0%, AMS Biotechnology Ltd., Bioggio, Switzerland) was added to fully inhibit the yeast cell respiration. In water samples, same aliquot of formaldehyde (ACS reagent, 37 wt. % in H2O, Sigma Aldrich) was added. The interruption of cellular O2 consumption triggers a progressive increase in dissolved O2, up to a second steady state that corresponds to the amount of dissolved O2 in absence of yeast cellular O2 consumption. The analytical parameter used was the variation of the dissolved O2 (ΔppmO2) between the two steady states of the experimental curves before and after the addition of respiratory chain inhibitor (NaN3 or formaldehyde) (Figure 2).
Means of readings of the dissolved O2 concentration at 10 min before respiratory chain inhibitor addition (first plateau), and once the second plateau was reached, were calculated, and ΔppmO2 was calculated for each experiment. The percentage interference of cellular respiration (%ρ) was calculated with the following algorithm:
%ρ = [1 − (ΔppmO2 exp/ΔppmO2 blk)] × 100
where ΔppmO2 exp = mean of variations of the dissolved O2 (in ppm) in fortified samples, and ΔppmO2 blk = mean of variations of the dissolved O2 (in ppm) in blank samples. All experiments were repeated at least four times (each control and exposed samples had four replicates for each experiment). To assess the repeatability of the measurements, four runs of the array measurements were performed on the same day, whereas reproducibility was verified on three different days starting from freshly prepared solutions and yeast suspensions. Relative standards deviation percentages were calculated (%RSD calculated ≤ 15%). Data were statistically analyzed with ANOVA Randomized Block Design.

Sample Matrix Effect: Influence of Milk Fat Content

To evaluate the masking effect of the fat content of milk on simazine, comparative 2 h respirometric bioassays on commercial UHT milk (full fat, semi-skimmed and skimmed UHT pasteurized and microfiltered milk) were performed. In particular, UHT milk samples were fortified with simazine working solution to final concentration of 10 ppb (EU legal limit for simazine residue in cow’s milk) and tested with the yeast- based bioprobe.
UHT milk samples
  • Blank samples: 13.875 mL of sample + 0.750 mL of 3.2% w/v boric acid solution + 0.375 mL of methanolic solution (concentration < 0.1%) without simazine
  • Simazine-spiked samples: 13.875 mL of sample + 0.750 mL of 3.2% w/v boric acid solution + 0.375 mL methanolic solution (concentration < 0.1%) of simazine (final concentration 10 ppb)

3. Results

The results of comparative respirometric bioassays in raw cow’s milk samples in the presence of different selected concentration of boric acid (0.10, 0.16% and 0.32% w/v) allowed us to identify 0.16% w/v concentration as the minimum boric acid concentration that exerts a fungistatic action for 12 h. During the 12 h O2 consumption monitoring, signal fluctuations registered from milk samples containing 0.16% w/v boric acid were less than 0.10 ppm. Repeatability of the measurements was assessed performing four runs of the array measurements on the same day. Reproducibility was verified on three different days starting from freshly prepared solutions and yeast suspensions. Relative standards deviation percentages were calculated (%RSD calculated ≤ 15%). Data were statistically analyzed with ANOVA Randomized Block Design for statistical differences between means values of Δppm O2 exp (milk samples with boric acid) and Δppm O2 blk (milk samples without boric acid) (p < 0.05). Considering these findings, we have used the final concentration of 0.16% w/v boric acid for all the bioassays on raw cow’s milk.
The results of bioassays on livestock drinking water samples and raw cow’s milk samples are summarized in Table 2. The relationship between simazine concentration and %ρ is shown by histograms in Figure 3 and Figure 4 respectively. Statistical tests were done using ANOVA testing for Randomized Block Design, and a significant relationship between fortified and blank samples was found for all concentrations tested (p < 0.05).
Non-linear trends of %ρ values were observed for both matrices tested (Figure 2 and Figure 3). Positive %ρ values indicate a decrease-related inhibition of cellular respiration, while negative %ρ values indicate an increase in cellular O2 consumption due to hyperstimulation. These aspects are detailed in the Discussion section.
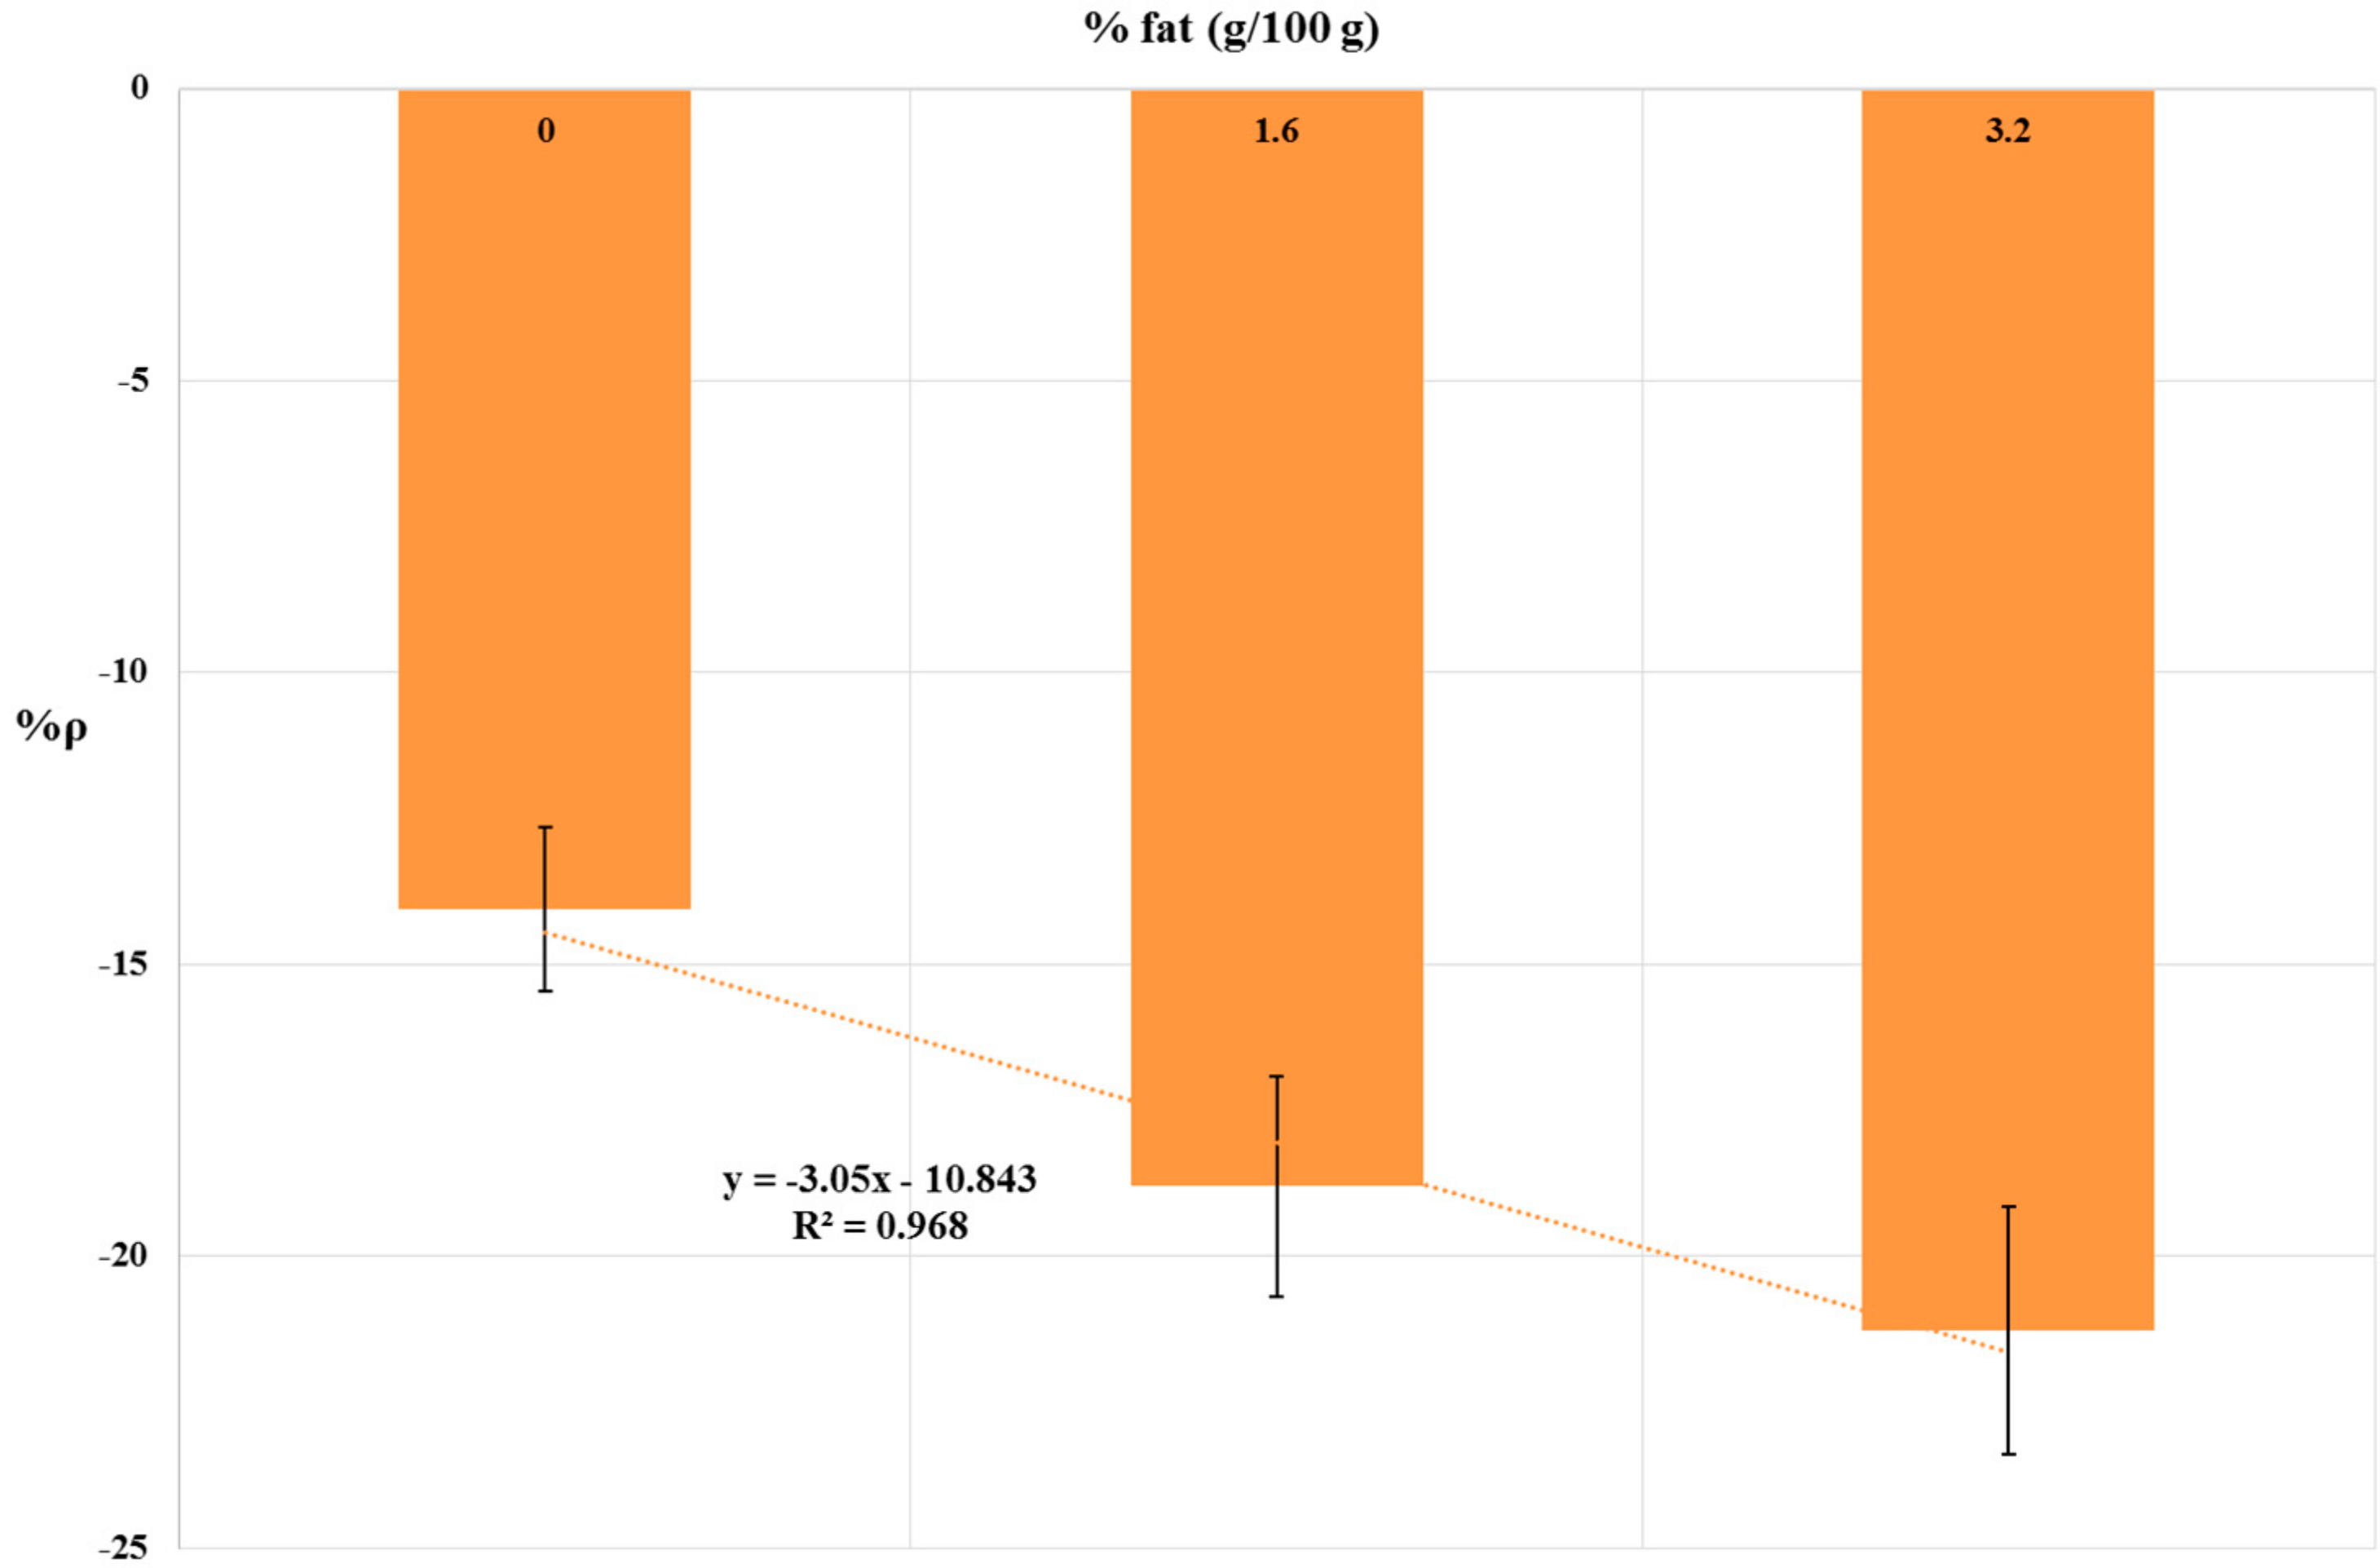
The results of 10 ppb simazine detection in UHT milk samples are summarized in Table 3. The relationship between fat content and %ρ values is shown by histograms in Figure 5. A linear correlation (R2 = 0.968) between fat content and %ρ values were found. Statistical tests were done using ANOVA testing for Randomized Block Design, and a significant relationship between exposed and control samples was found for all UHT milk samples tested (p < 0.05).

4. Discussion

4.1. Yeast Cell Proliferation Control

As previously described by Schmidt et al. 2010 [38], 0.31% w/v boric acid was the minimal concentration to exert a fungistatic action on S. cerevisiae for three-days growth in yeast extract peptone dextrose (YPD) medium at 30 °C. Our findings suggest that 0.16% w/v boric acid can exert a fungistatic action on S. cerevisiae for 12 h. incubation in raw cow’s milk at 28 °C. The discrepancy between the results may be due to differences in experimental conditions. Indeed, Schmidt et al. 2010 [38] performed a three days-long test in YPD medium, a complete medium optimal for yeast growth. Thus, in YPD medium, a higher concentration of boric acid (0.31% w/v) could be required than in cow’s milk (0.16% w/v).
Testing of other well-known fungistatic agents like benzoate, sorbate, and azole derivatives was not carried out because of the effects on metabolism and mitochondrial respiration of yeast, as previously described in the literature [39,40,41]. Indeed, these effects could negatively affect the performances of the bioassay, interfering with S. cerevisiae response to simazine. According to Smith et al., 2010, boric acid only interferes with cytokinesis [38]. We confirmed that, in our experimental conditions, no mitochondrial interferences occur during 12 h exposure of S. cerevisiae to 0.16% w/v boric acid. Overall, the use of boric acid as fungistatic agent is a suitable and cost-effective optimization of the method for bioassays in raw cow’s milk samples.

4.2. Bioassays on Livestock Drinking Water and Raw Cow’s Milk Samples

The dose-response histograms for bioassays on livestock drinking water and raw cow’s milk sample spiked with simazine (concentration from five-times below to two-fold above the EU legal limits) are showed in Figure 3 and Figure 4 respectively. Similar non-linear dose–response trends of %ρ values (changes from positive to negative values) with increased simazine concentrations can be observed for both water and milk samples.
According to our interpretation, %ρ values may originate from the combined action of three different mechanisms, i.e., inhibition of cellular respiration, hyperstimulation, and detoxification/adaptive responses. Its own dose-dependent priming and action characterize each of these mechanisms. Therefore, %ρ values should be viewed as a “snapshot” of yeast cellular respiration at 2 h exposure to a certain concentration of simazine. The combination of toxic mechanisms and adaptive response mechanisms in S. cerevisiae exposed to simazine may influence not only %ρ values, but also the changes from positive to negative %ρ values. Such combinations could result in a defined exposure-response pattern, as shown in Figure 3 and Figure 4.
In our previous works, we assumed similar combinations of toxic mechanisms and adaptive response mechanisms in S. cerevisiae exposed to platinum group elements [31] and herbicide diuron [33]. Our hypotheses were supported by literature data about the mechanisms involved. Concerning the present work, inhibition of cellular respiration, hyperstimulation of cellular respiration, and detoxification/adaptive responses have also been previously described in the literature for simazine exposure, as well as for S. cerevisiae.
Positive %ρ values indicate a lower O2 consumption by yeast cell in simazine-spiked samples (compared to blank samples). These results may be ascribed to the inhibition of cellular respiration by hyperproduction of reactive oxygen species (ROS), inhibition of cellular antioxidant capacity, oxidative damage to lipids and proteins, and interference of ATP synthesis [15,42,43]. Negative %ρ values indicate a higher O2 oxygen consumption by yeast cell in simazine-spiked samples (compared to blank samples). Concerning this effect, preliminary tests have proven that in our experimental conditions, yeast cells are in an optimal physiological state for cellular aerobic respiration, and therefore, yeast cells exhibit a maximum O2 consumption rate. Thus, our results may be ascribed to the uncoupling of oxidative phosphorylation by simazine. Uncouplers are chemicals that inhibit the coupling between the electron transport and phosphorylation, dissipate the electrochemical proton gradient across the inner mitochondrial membrane, and lead to increased oxygen consumption and inhibition of ATP synthesis [44]. Previous works have suggested that simazine may also acts as an uncoupler of oxidative phosphorylation [45,46], but the mechanism has not been characterized so far. Concerning detoxification/adaptive response to herbicides in yeast cells, in S. cerevisiae, at least two plasma-membrane transporters and multidrug extrusion pumps ATP-binding cassette or ABC transporter, pleiotropic drug resistance protein 5 (Pdr5p) and the Major Facilitator Superfamily multidrug resistance (MFS-MDR), Tpo1p are involved in resistance to simazine [47,48]. Considering the ATP dependence of ABC transporters to work as extrusion pumps, and that cited mechanisms of inhibition and hyperstimulation of cellular respiration lead to depletion of intracellular ATP, we can hypothesize a possible influence of cellular ATP content on the %ρ changes observed, but no data are available so far, and further measurements will be necessary.

Sample Matrix Effect: Influence of Milk Fat Content

The octanol/water partition coefficient (Kow) is used as an indicator of hydrophobicity of organic compounds, and thus, the partitioning of a chemical between aqueous and lipid phases [49]. Simazine is a moderately hydrophobic compound (log Kow of 2.18 at 25 °C), and the association of simazine with the lipid fraction of milk has been previously verified [9]. To verify the influence of milk fat content on analytical performance of the yeast-based bioprobe, a 10 ppb simazine concentration was chosen, because it is the EU maximum residue limit for simazine in cow’s milk. The results (shown in Figure 5) suggest a moderate masking effect of simazine by milk fat. Barchanska et al., 2012 [50] have obtained similar results with atrazine (a chloro-s-triazine related to simazine, with log Kow 2.61 at 25 °C) in milk samples using an enzyme—linked immunosorbent assay (ELISA). Indeed, when milk samples had been spiked with 10 ppb atrazine, the recovery was 97% with skimmed milk (0% fat) and 86% for whole milk (3.2% fat) [50]. In general, bovine milk typically contains 3–4% fat. Fat levels in milk may be influenced by several factors, including cow breed, stage of lactation, season, feed, and milking procedures; however, typically, fat percentage is not lower than 2% [51]. In our experimental conditions, %ρ values were not significantly different from semi-skimmed milk samples (1.6% fat) and whole milk samples (3.2% fat) (%ρ = −18.81%; %ρ = −21.28% respectively; %RSD ≤ 15%). Thus, influence of average milk fat content on the analytical performance of the yeast-based bioprobe could be considered to be negligible.

5. Conclusions

The potential use of the yeast-based bioprobe as a screening method for the detection of simazine in real samples was verified. In particular, the proposed bioprobe is able to detect simazine in real samples at concentrations up to five times below those of EU legal concentration limits, i.e., 0.02 ppb in drinking water and 2 ppb in cow’s milk.
A first pattern of cellular response in the presence of simazine at concentrations of interest has been presented. In future work we may carry out a more complete assessment of cellular response patterns and bioprobe performances in real samples.
Overall, these findings broaden the range of chemicals detectable by the yeast-based bioprobe, and confirm the suitability of this bioprobe to be employed as an integral toxicity monitoring system for environmental and food surveillance at critical control points for safeguarding animal welfare and food safety.
Furthermore, in future studies, we plan to validate the system, and automate/integrate the yeast-based bioprobe in the technological platform BEST (PCT WO/2010/001432): (Bio)Sensors’ system in Food Safety.

Supplementary Materials

The following are available online at https://www.mdpi.com/2079-6374/8/4/112/s1, Table S1: Results of chemical analyses of bulk tank raw milk; Table S2: Chemical composition of commercial UHT milk; Table S3: Chemical analyses of livestock drinking water; Figure S1: Calibration curve of OD525nm vs. cfu/mL; Figure S2: Photograph of the system used for bioassays.

Author Contributions

Conceptualization, G.G., R.D. and C.F.; Methodology, R.D.; Formal Analysis, G.C.; Investigation, L.C. and G.G.; Resources, R.D.; Data Curation, L.C., G.C.; Writing—Original Draft Preparation, G.G.; Writing-Review & Editing, C.F.; Visualization, G.G.; Supervision, R.D.

Funding

This research received no external funding

Acknowledgments

We thank ALERT project consortium, in particular ‘Elio Pascolini’ dairy farm for the supplying of samples and Istituto Zooprofilattico Sperimentale delle Regioni Lazio e Toscana for the raw cow’s milk samples analyses. ALERT project was funded by the Italian Ministry of Economic Development under the Call Industria 2015 “New Technologies for Made in Italy”.

Conflicts of Interest

The authors declare no conflict of interest.

References

  1. Velisek, J.; Stara, A.; Machova, J.; Svobodova, Z. Effects of long-term exposure to simazine in real concentrations on common carp (Cyprinus carpio L.). Ecotoxicol. Environ. Saf. 2012, 76, 79–86. [Google Scholar] [CrossRef] [PubMed]
  2. Council Directive (EU) No 91/414/ECC of 15 July 1991 Concerning the Placing of Plant Protection Products on the Market. Available online: https://eur-lex.europa.eu/legal-content/EN/TXT/PDF/?uri=CELEX:31991L0414&from=en (accessed on 7 July 2018).
  3. Silva, M.; Iyer, P. Toxicity endpoint selections for a simazine risk assessment. Birth Defects Res. Part B Dev. Reprod. Toxicol. 2014, 101, 308–324. [Google Scholar] [CrossRef] [PubMed]
  4. Heri, T.; Pfiser, F.; Carroll, B.; Parshley, T.; Nabors, J.B. Production, Development, and Registration of Triazine Herbicides. In The Triazines Herbicides 50 Years Revolutionizing Agriculture; LeBaron, H.M., McFarland, J.E., Burnside, O.C., Eds.; Elsevier: Amsterdam, The Netherlands, 2008; p. 34. ISBN 978044451167. [Google Scholar]
  5. Gunasekara, A.S. Environmental Fate of Simazine; Environmental Monitoring Branch, Cal/EPA Department of Pesticide Regulation; 2004; Available online:. Available online: http://citeseerx.ist.psu.edu/viewdoc/download?doi=10.1.1.444.9905&rep=rep1&type=pdf (accessed on 7 July 2018).
  6. ISPRA. National Report on Pesticides in Water—2013–2014 Data. 2016. Available online: http://www.isprambiente.gov.it/en/publications/reports/national-report-on-pesticides-in-water-2013-2013-2014-data?set_language=en (accessed on 8 Sepetember 2018).
  7. Jame, Y.W.; Cessna, A.J.; Biederbeck, V.O.; Grover, R.; Smith, A.E.; Korven, H.C. Herbicide residues and yield effects from repeated flood-irrigations of alfalfa with water containing monuron or simazine. Can. J. Plant Sci. 1999, 79, 639–645. [Google Scholar] [CrossRef] [Green Version]
  8. MacLachlan, D. Pesticide Risk Profile for the Grazing of Pasture and/or Cutting of Hay and Feeding to Cattle and Sheep. 2010. Available online: http://www.elmsavers.com.au/wp-content/uploads/downloads/misc/aqis.pdf (accessed on 8 September 2018).
  9. Farkaš, P.; Schultzová, K.; Kovačičová, J.; Szokolay, A. Analysis of triazine herbicides residues in butter and pasteurized milk. Z. Lebensm Unters Forch. 1988, 186, 319–322. [Google Scholar] [CrossRef]
  10. De Felipe, M.R.; Fernandez-Pascual, M.; Pozuelo, J.M. Effects of the herbicides Lindex and Simazine on chloroplast and nodule development, nodule activity, and grain yield in Lupinus albus L. Plant Soil. 1987, 101, 99–105. [Google Scholar] [CrossRef]
  11. Zorrilla, L.M.; Gibson, E.K.; Stoker, T.E. The effects of simazine, a chlorotriazine herbicide, on pubertal development in the female Wistar rat. Reprod. Toxicol. 2010, 29, 393–400. [Google Scholar] [CrossRef] [PubMed]
  12. Sai, L.; Liu, Y.; Qu, B.; Yu, G.; Guo, Q.; Bo, C.; Ng, J.C. The effects of simazine, a chlorotriazine herbicide, on the expression of genes in developing male Xenopus laevis. Bull. Environ. Contam. Toxicol. 2015, 95, 157–163. [Google Scholar] [CrossRef] [PubMed]
  13. Florian, C.P.; Mansfield, S.R.; Schroeder, J.R. Differences in GPR30 regulation by chlorotriazine herbicides in human breast cells. Biochem. Res. Int. 2016, 2016, 2984081. [Google Scholar] [CrossRef] [PubMed]
  14. Yu, J.; Li, X.; Yang, J.; Wu, Y.; Li, B. Effects of Simazine Exposure on Neuronal Development-Related Factors in MN9D Cells. Med. Sci. Monit. 2016, 22, 2831–2838. [Google Scholar] [CrossRef] [PubMed] [Green Version]
  15. Stara, A.; Machova, J.; Velisek, J. Effect of chronic exposure to simazine on oxidative stress and antioxidant response in common carp (Cyprinus carpio L.). Environ. Toxicol. Pharmacol. 2012, 33, 334–343. [Google Scholar] [CrossRef] [PubMed]
  16. Allender, W.J.; Glastonbury, J.W. Simazine toxicosis in sheep. Vet. Hum. Toxicol. 1992, 34, 422–423. [Google Scholar] [PubMed]
  17. Palmer, J.S.; Radeleff, R.D. The Toxicity of Some Organic Herbicides to Cattle, Sheep, and Chickens. US Dept Agric Prod Res Rep. 1969, 106, 26–27. [Google Scholar]
  18. Portolés, T.; Pitarch, E.; López, F.J.; Hernández, F. Development and validation of a rapid and wide-scope qualitative screening method for detection and identification of organic pollutants in natural water and wastewater by gas chromatography time-of-flight mass spectrometry. J. Chromatogr. A 2011, 1218, 303–315. [Google Scholar] [CrossRef] [PubMed] [Green Version]
  19. Diaz, R.; Ibáñez, M.; Sancho, J.V.; Hernández, F. Qualitative validation of a liquid chromatography–quadrupole-time of flight mass spectrometry screening method for organic pollutants in waters. J. Chromatogr. A 2013, 1276, 47–57. [Google Scholar] [CrossRef] [PubMed] [Green Version]
  20. Bueno, M.J.M.; Hernando, M.D.; Agüera, A.; Fernández-Alba, A.R. Application of passive sampling devices for screening of micro-pollutants in marine aquaculture using LC–MS/MS. Talanta 2009, 77, 1518–1527. [Google Scholar] [CrossRef]
  21. Segura, P.A.; MacLeod, S.L.; Lemoine, P.; Sauvé, S.; Gagnon, C. Quantification of carbamazepine and atrazine and screening of suspect organic contaminants in surface and drinking waters. Chemosphere 2011, 84, 1085–1094. [Google Scholar] [CrossRef] [PubMed]
  22. Tian, H. Determination of chloramphenicol, enrofloxacin and 29 pesticides residues in bovine milk by liquid chromatography–tandem mass spectrometry. Chemosphere 2011, 83, 349–355. [Google Scholar] [CrossRef] [PubMed]
  23. Beale, D.J.; Porter, N.A.; Roddick, F.A. A fast screening method for the presence of atrazine and other triazines in water using flow injection with chemiluminescent detection. Talanta 2009, 78, 342–347. [Google Scholar] [CrossRef] [PubMed]
  24. Obare, S.O.; De, C.; Guo, W.; Haywood, T.L.; Samuels, T.A.; Adams, C.P.; Masika, N.O.; Murray, D.H.; Anderson, G.A.; Campbell, K.; et al. Fluorescent chemosensors for toxic organophosphorus pesticides: A review. Sensors 2010, 10, 7018–7043. [Google Scholar] [CrossRef] [PubMed]
  25. Abegão, L.M.G.; Ribeiro, J.H.F.; Ribeiro, P.A.; Raposo, M. Nano-molar deltamethrin sensor based on electrical impedance of PAH/PAZO layer-by-layer sensing films. Sensors 2013, 13, 10167–10176. [Google Scholar] [CrossRef] [PubMed]
  26. Mazouz, Z.; Rahali, S.; Fourati, N.; Zerrouki, C.; Aloui, N.; Seydou, M.; Yaakoubi, N.; Chehimi, M.M.; Othmane, A.; Kalfat, R. Highly Selective Polypyrrole MIP-Based Gravimetric and Electrochemical Sensors for Picomolar Detection of Glyphosate. Sensors 2017, 17, 2586. [Google Scholar] [CrossRef] [PubMed]
  27. Dragone, R.; Grasso, G.; Muccini, M.; Toffanin, S. Portable bio/chemosensoristic devices: Innovative systems for environmental health and food safety diagnostics. Front. Public Health 2017, 5, 1–6. [Google Scholar] [CrossRef] [PubMed]
  28. Dragone, R.; Grasso, G. Biosensoristic Devices: Monitoring and Diagnostics in Agro-Zootechnical Productions. Cameroon-Nigeria-Italy Scientific Cooperation: Veterinary Public Health and Sustainable Food Safety to Promote “One Health/One Prevention”. 2012. Available online: http://old.iss.it/binary/publ/cont/12_49_web.pdf#page=80 (accessed on 7 July2018).
  29. Peña-Vázquez, E.; Maneiro, E.; Pérez-Conde, C.; Moreno-Bondi, M.C.; Costas, E. Microalgae fiber optic biosensors for herbicide monitoring using sol–gel technology. Biosens. Bioelectron. 2009, 24, 3538–3543. [Google Scholar] [CrossRef] [PubMed]
  30. Braconi, D.; Bernardini, G.; Santucci, A. Saccharomyces cerevisiae as a model in ecotoxicological studies: A post-genomics perspective. J. Proteom. 2016, 137, 19–34. [Google Scholar] [CrossRef] [PubMed]
  31. Frazzoli, C.; Dragone, R.; Mantovani, A.; Massimi, C.; Campanella, L. Functional toxicity and tolerance patterns of bioavailable Pd (II), Pt (II), and Rh (III) on suspended Saccharomyces cerevisiae cells assayed in tandem by a respirometric biosensor. Anal. Bioanal. Chem. 2007, 389, 2185–2194. [Google Scholar] [CrossRef] [PubMed]
  32. Dragone, R.; Frazzoli, C.; Grasso, G.; Rossi, G. Sensor with intact or modified yeast cells as rapid device for toxicological test of chemicals. J. Agric. Chem. Environ. 2014, 3, 35–40. [Google Scholar] [CrossRef]
  33. Dragone, R.; Cheng, R.; Grasso, G.; Frazzoli, C. Diuron in Water: Functional Toxicity and Intracellular Detoxification Patterns of Active Concentrations Assayed in Tandem by a Yeast-Based Probe. Int. J. Environ. Res. Public Health 2015, 12, 3731–3740. [Google Scholar] [CrossRef] [PubMed] [Green Version]
  34. Gonzales, C.; Touraud, E.; Spinelli, S.; Thomas, O. Organic Constituents. In Uv-Visible Spectrophotometry of Water and Wastewater, 2nd ed.; Thomas, O., Burgess, C., Eds.; Elsevier: Amsterdam, The Netherlands, 2017; p. 99. ISBN 9780444638977. [Google Scholar]
  35. Goodridge, L.; Hill, A.R.; Lencki, R.W. A review of international standards and the scientific literature on farm milk bulk-tank sampling protocols. J. Dairy Sci. 2004, 87, 3099–3104. [Google Scholar] [CrossRef]
  36. Appicciafuoco, B.; Dragone, R.; Frazzoli, C.; Bolzoni, G.; Mantovani, A.; Ferrini, A.M. Microbial screening for quinolones residues in cow milk by bio-optical method. J. Pharm. Biomed. Anal. 2015, 106, 179–185. [Google Scholar] [CrossRef] [PubMed]
  37. Roostita, R.; Fleet, G.H. Growth of yeasts in milk and associated changes to milk composition. Int. J. Food Microbiol. 1996, 31, 205–219. [Google Scholar] [CrossRef]
  38. Schmidt, M.; Schaumberg, J.Z.; Steen, C.M.; Boyer, M.P. Boric acid disturbs cell wall synthesis in Saccharomyces cerevisiae. Int. J. Microbiol. 2010, 2010, 930465. [Google Scholar] [CrossRef] [PubMed]
  39. Harada, K.; Higuchi, R.; Utsumi, I. Studies on Sorbic Acid: Part IV Inhibition of the Respiration in Yeast. Agric. Biol. Chem. 1968, 32, 940–946. [Google Scholar] [CrossRef]
  40. Burlini, N.; Pellegrini, R.; Facheris, P.; Tortora, P.; Guerritore, A. Metabolic effects of benzoate and sorbate in the yeast Saccharomyces cerevisiae at neutral pH. Arch. Microbiol. 1993, 159, 220–224. [Google Scholar] [CrossRef]
  41. Lupetti, A.; Danesi, R.; Campa, M.; Del Tacca, M.; Kelly, S. Molecular basis of resistance to azole antifungals. Trends Mol. Med. 2002, 8, 76–81. [Google Scholar] [CrossRef]
  42. Lotlikar, P.D. Effects of Herbicides on Oxidative Phosphorylation in Mitochondria from Cabbage, Brassica oleracea. Ph.D. Thesis, Oregon State University, Corvallis, OR, USA, 1960. [Google Scholar]
  43. Fitzmayer, K.M.; Geiger, J.G.; Van Den Avyle, M.J. Effects of chronic exposure to simazine on the cladoceran, Daphnia pulex. Arch. Environ. Contam. Toxicol. 1982, 111, 603–609. [Google Scholar] [CrossRef]
  44. Berg, J.M.; Tymoczko, J.L.; Stryer, L. The Regulation of Cellular Respiration Is Governed Primarily by the Need for ATP. In Biochemistry, 5th ed.; W H Freeman: New York, NY, USA, 2002; Section 18.6. Available online: https://www.ncbi.nlm.nih.gov/books/NBK22448/ (accessed on 8 September 2018).
  45. Lotlikar, P.D.; Remmert, L.F.; Freed, V.H. Effects of 2,4-D and other herbicides on oxidative phosphorylation in mitochondria from cabbage. Weed Sci. 1968, 16, 161–165. [Google Scholar] [CrossRef]
  46. Metcalf, E.C.; Collin, H.A. The effect of simazine on the growth and respiration of a cell suspension culture of celery. New Phytol. 1978, 81, 243–248. [Google Scholar] [CrossRef]
  47. Wolfger, H.; Mamnun, Y.M.; Kuchler, K. The yeast Pdr15p ATP-binding cassette (ABC) protein is a general stress response factor implicated in cellular detoxification. J. Biol. Chem. 2004, 279, 11593–11599. [Google Scholar] [CrossRef] [PubMed]
  48. Remy, E.; Niño-González, M.; Godinho, C.P.; Cabrito, T.R.; Teixeira, M.C.; Sá-Correia, I.; Duque, P. Heterologous expression of the yeast Tpo1p or Pdr5p membrane transporters in Arabidopsis confers plant xenobiotic tolerance. Sci. Rep. 2017, 7, 4529. [Google Scholar] [CrossRef] [PubMed]
  49. Connell, D.W. The Octanol-Water Partition Coefficient. In Handbook of Ecotoxicology; Peter Calow DSc: Oxford, UK, 1997; pp. 775–784. ISBN 9781444313512. [Google Scholar]
  50. Barchanska, H.; Jodo, E.; Price, R.G.; Baranowska, I.; Abuknesha, R. Monitoring of atrazine in milk using a rapid tube-based ELISA and validation with HPLC. Chemosphere 2012, 87, 1330–1334. [Google Scholar] [CrossRef] [PubMed]
  51. Fox, P.F.; Uniacke-Lowe, T.; McSweeney, P.L.; Paul, L. Milk lipids. In Dairy Chemistry and Biochemistry, 2nd ed.; Blackie Academic & Professional: London, UK, 1998; pp. 70–72. ISBN 978-3-319-14891-5. [Google Scholar]
Figure 1. Exemplary curve of dissolved oxygen (ppm O2) vs. time.
Biosensors 08 00112 g001
Figure 2. The experimental respirometric curve shows the dissolved oxygen (ppm O2) vs. time (adapted from Dragone et al., 2015 [33]).
Biosensors 08 00112 g002
Figure 3. Dose-effect histograms for 2 h exposure to simazine in livestock drinking water samples. %RSD ≤ 15%; ANOVA testing using Randomized Block Design was applied for statistical differences between means values of Δppm O2 exp and Δppm O2 blk (p < 0.05).
Biosensors 08 00112 g003
Figure 4. Dose-effect histograms for 2 h exposure to simazine in raw cow’s milk samples. %RSD ≤ 15%; ANOVA testing using Randomized Block Design was applied for statistical differences between means values of Δppm O2 exp and Δppm O2 blk (p < 0.05).
Biosensors 08 00112 g004
Figure 5. Dose-effect histogram for 2 h exposure to 10 ppb simazine in commercial whole, semi-skimmed and skimmed UHT milk. %RSD ≤ 15%; ANOVA testing using Randomized Block Design was applied for statistical differences between means values of Δppm O2 exp and Δppm O2 blk (p < 0.05).
Biosensors 08 00112 g005
Table 1. Simazine concentrations tested (in µg/L or ppb). The EU legal limits for simazine residue in water and milk are indicated in bold.
Livestock Drinking WaterRaw Cow’s Milk
0.022
0.1 110 2
0.220
1 Council Directive 98/83/EC of 3 November 1998 on the Quality of Water Intended for Human Consumption. Available online: http://eur-lex.europa.eu/legal-content/EN/TXT/?qid=1405609372533&uri=CELEX:31998L0083. 2 Commission Regulation (EU) No 310/2011 of 28 March 2011 amending Annexes II and III to Regulation (EC) No 396/2005 of the European Parliament and of the Council as regards maximum residue levels for aldicarb, bromopropylate, chlorfenvinphos, endosulfan, EPTC, ethion, fenthion, fomesafen, methabenzthiazuron, methidathion, simazine, tetradifon and triforine in or on certain products. Available online: http://eur-lex.europa.eu/LexUriServ/LexUriServ.do?uri=OJ:L:2011:086:0001:0050:EN:PDF.
Table 2. Simazine concentrations tested (in ppb) in livestock drinking water and raw cow’s milk samples with the corresponding means values of indexes of respiratory inhibition (%ρ). The EU legal limit for simazine residue in each matrix is indicated in bold.
Livestock Drinking WaterRaw Cow’s Milk
Simazine Concentration (ppb)1Simazine Concentration (ppb)1
0.0218.53220.43
0.1−18.1310−21.28
0.223.17204.15
1 Each mean value was calculate from four runs per day (four replicate per run) repeated for three different days (day-to-day reproducibility). %RSD ≤ 15%; Differences between mean values of Δppm O2 exp and Δppm O2 blk where all statistical significant (p < 0.05).
Table 3. Means %ρ values from 2 h-bioassays on 10 ppb simazine spiked UHT milk samples.
Milk Fat Content1
0−14.07
1.6−18.81
3.2−21.28
1 Each mean value was calculate from four runs per day (four replicate per run) repeated for three different days (day-to-day reproducibility). %RSD ≤ 15%; Differences between mean values of Δppm O2 exp and Δppm O2 blk where all statistical significant (p < 0.05).