Author Contributions
Project conceptualization, A.A., C.E.A., G.J.F., E.S.G.; methodology, A.A., R.J., D.T.K., J.H., S.J.O.C., C.E.A., E.S.G.; software, S.J.O.C., E.S.G.; formal analysis, A.A., P.K.-B., J.H., E.S.G.; investigation, A.A., P.K.-B., R.J., W.J., D.T.K..; resources, W.J., G.J.F., S.J.O.C., C.E.A., E.S.G.; data curation, A.A., P.K.-B., W.J., J.H., E.S.G.; writing—original draft preparation, A.A., E.S.G.; writing—review and editing, A.A., R.J., D.T.K., J.H., G.J.F., S.J.O.C., E.A., E.S.G.; supervision, D.K., W.J., G.J.F., S.J.O.C., C.E.A., E.S.G.; project administration, E.S.G.; funding acquisition, C.E.A. and E.S.G.
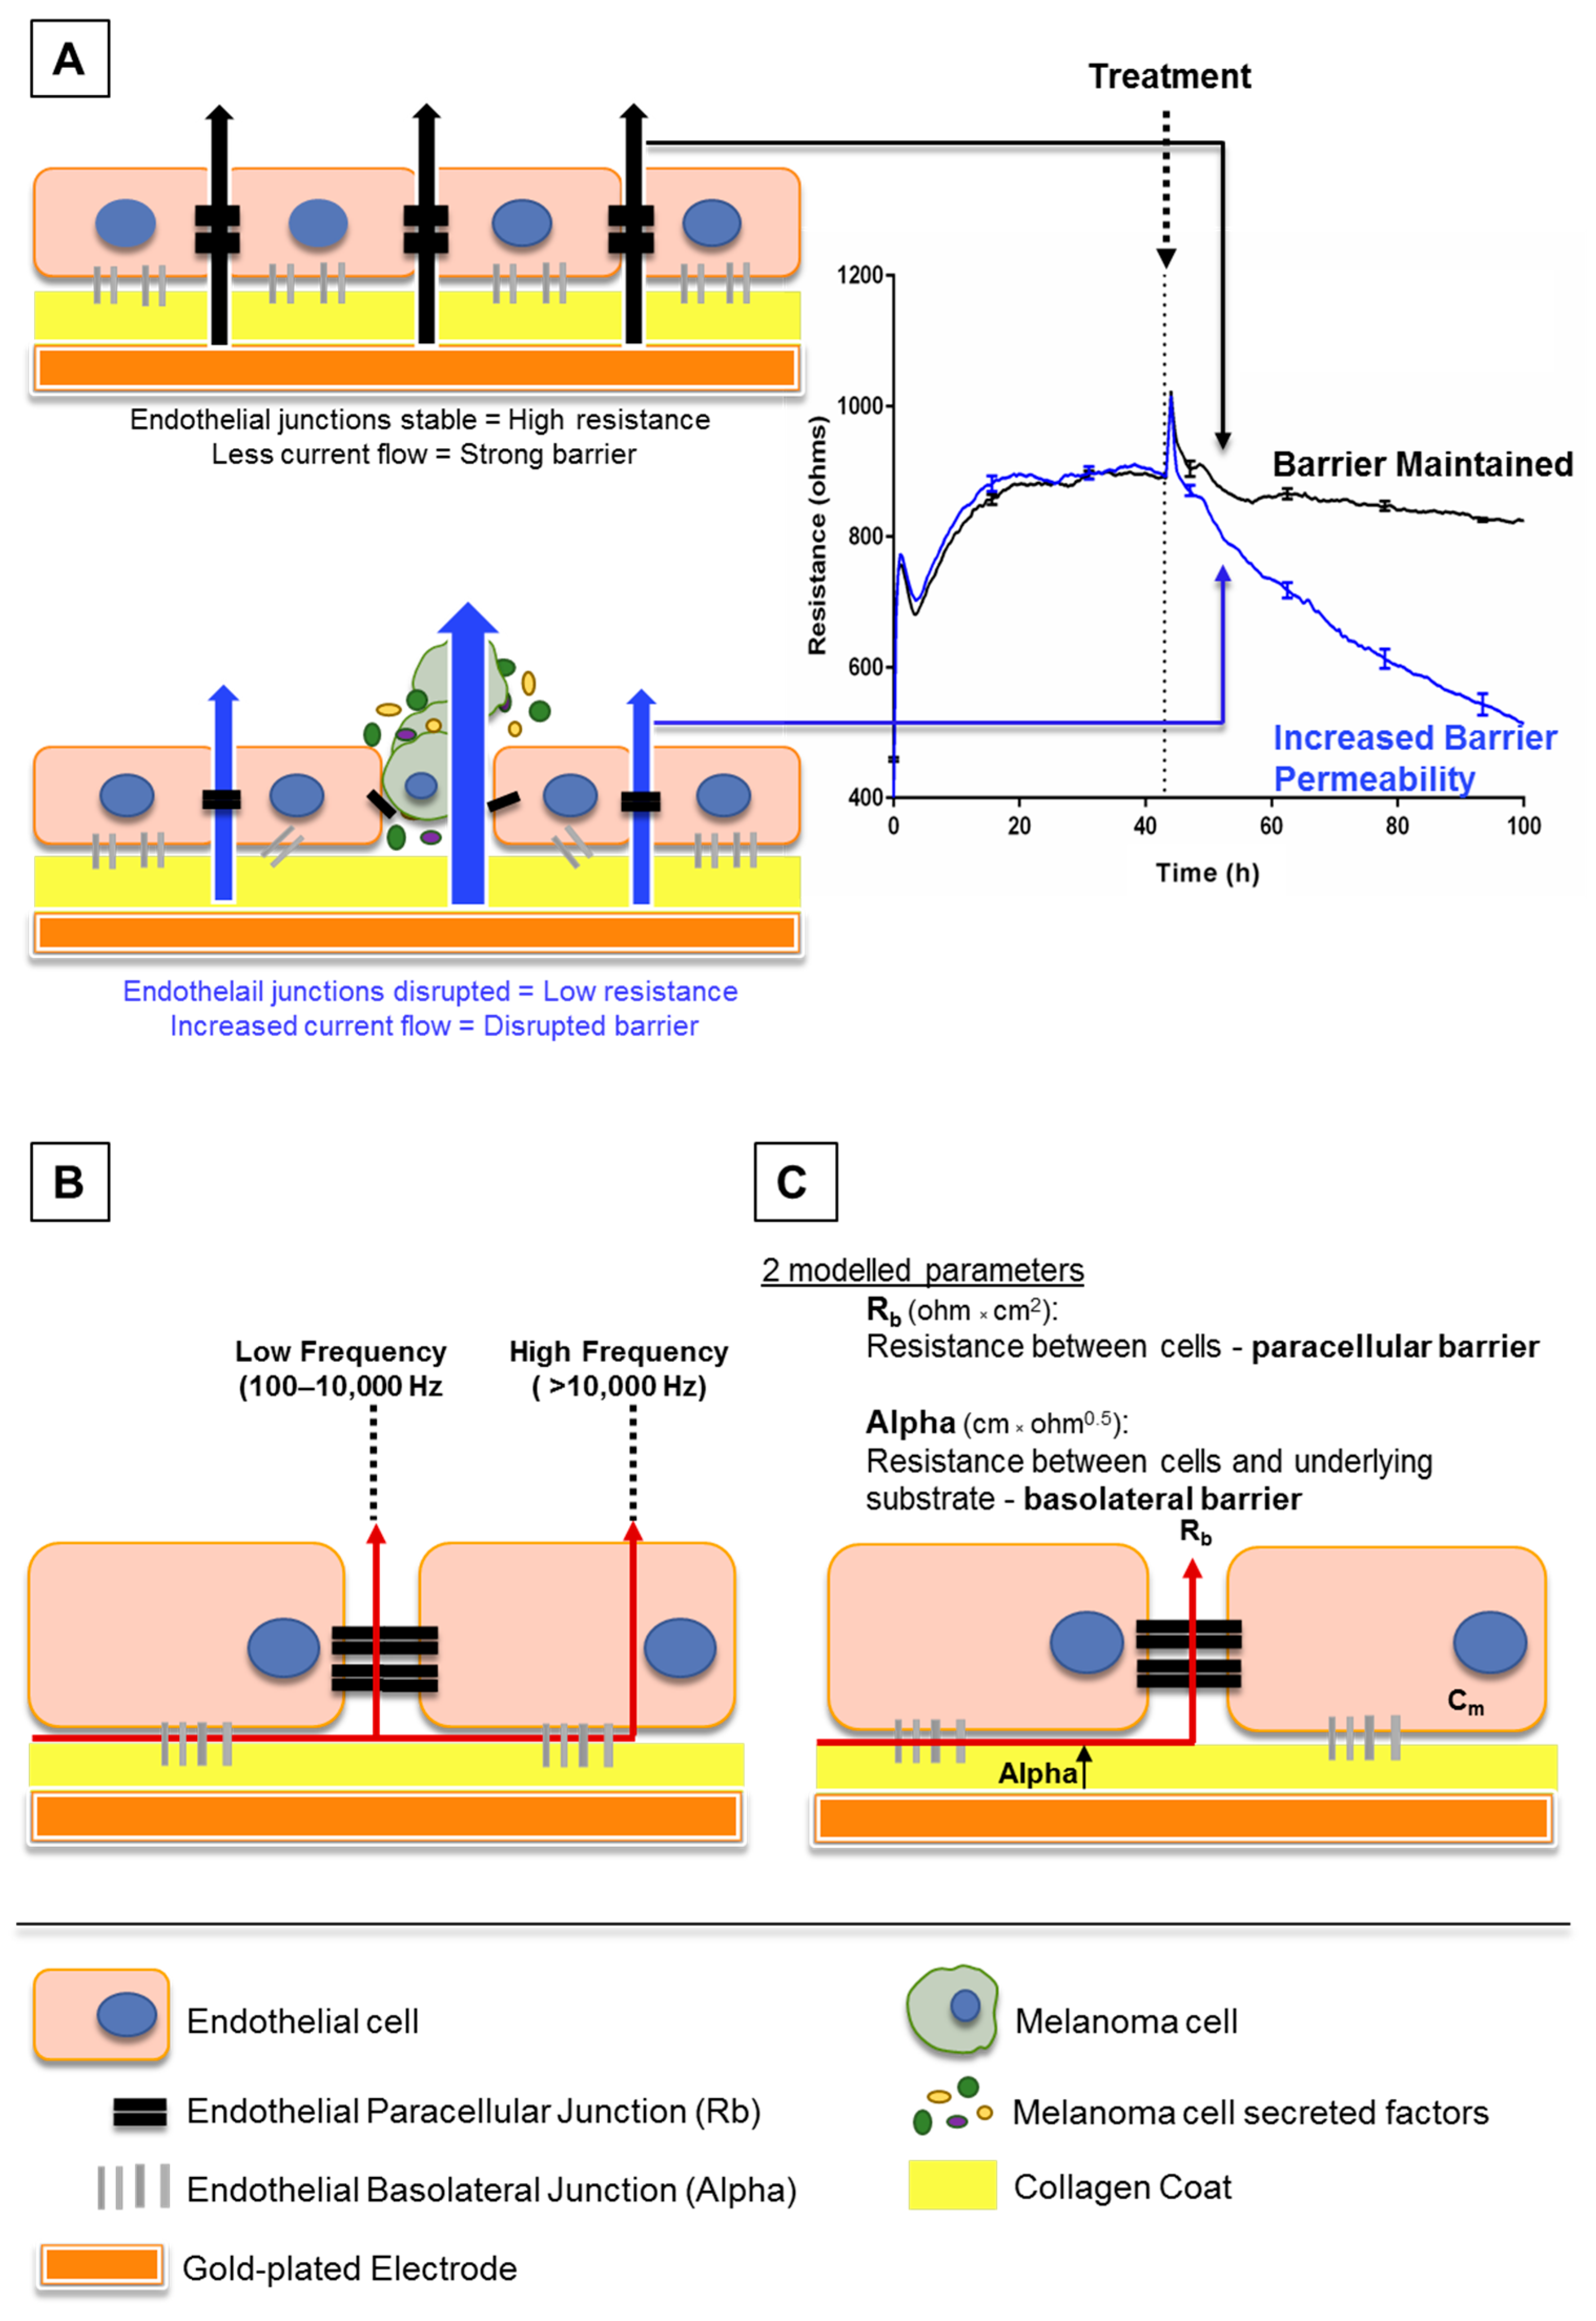
Figure 1.
Schematic explaining electric cell-substrate impedance sensing (ECIS) theory. (A) This shows endothelial cells growing on gold electrodes which are coated with rat tail collagen I. The endothelial cells form a monolayer by forming junctions with each other and the collagen substrate, shown by black and grey bars respectively. Once these junctions are formed, less current, supplied by the electrode, can flow through the cell junctions. This increases the electrical resistance as seen on the graph (right). As the cells become confluent, maximum resistance is achieved and the resistance plateaus. Upon treatment with factors that disrupt the endothelial barrier, the junctions weaken, current flows more freely between the cells and the electrical resistance decreases (blue trace, right). (B) This shows how the ECIS data can be modelled depending on the frequency at which the current is applied by the electrodes. At low frequencies (100–10,000 Hz), current flows only between cells, whereas at high frequencies (>10,000 Hz), the current can also flow through cells. (C) Collectively, the low and high frequency data can be modelled to provide information on the resistance between cells (Rb) and resistance between cells and the underlying substrate (Alpha).
![Biosensors 09 00056 g001]()
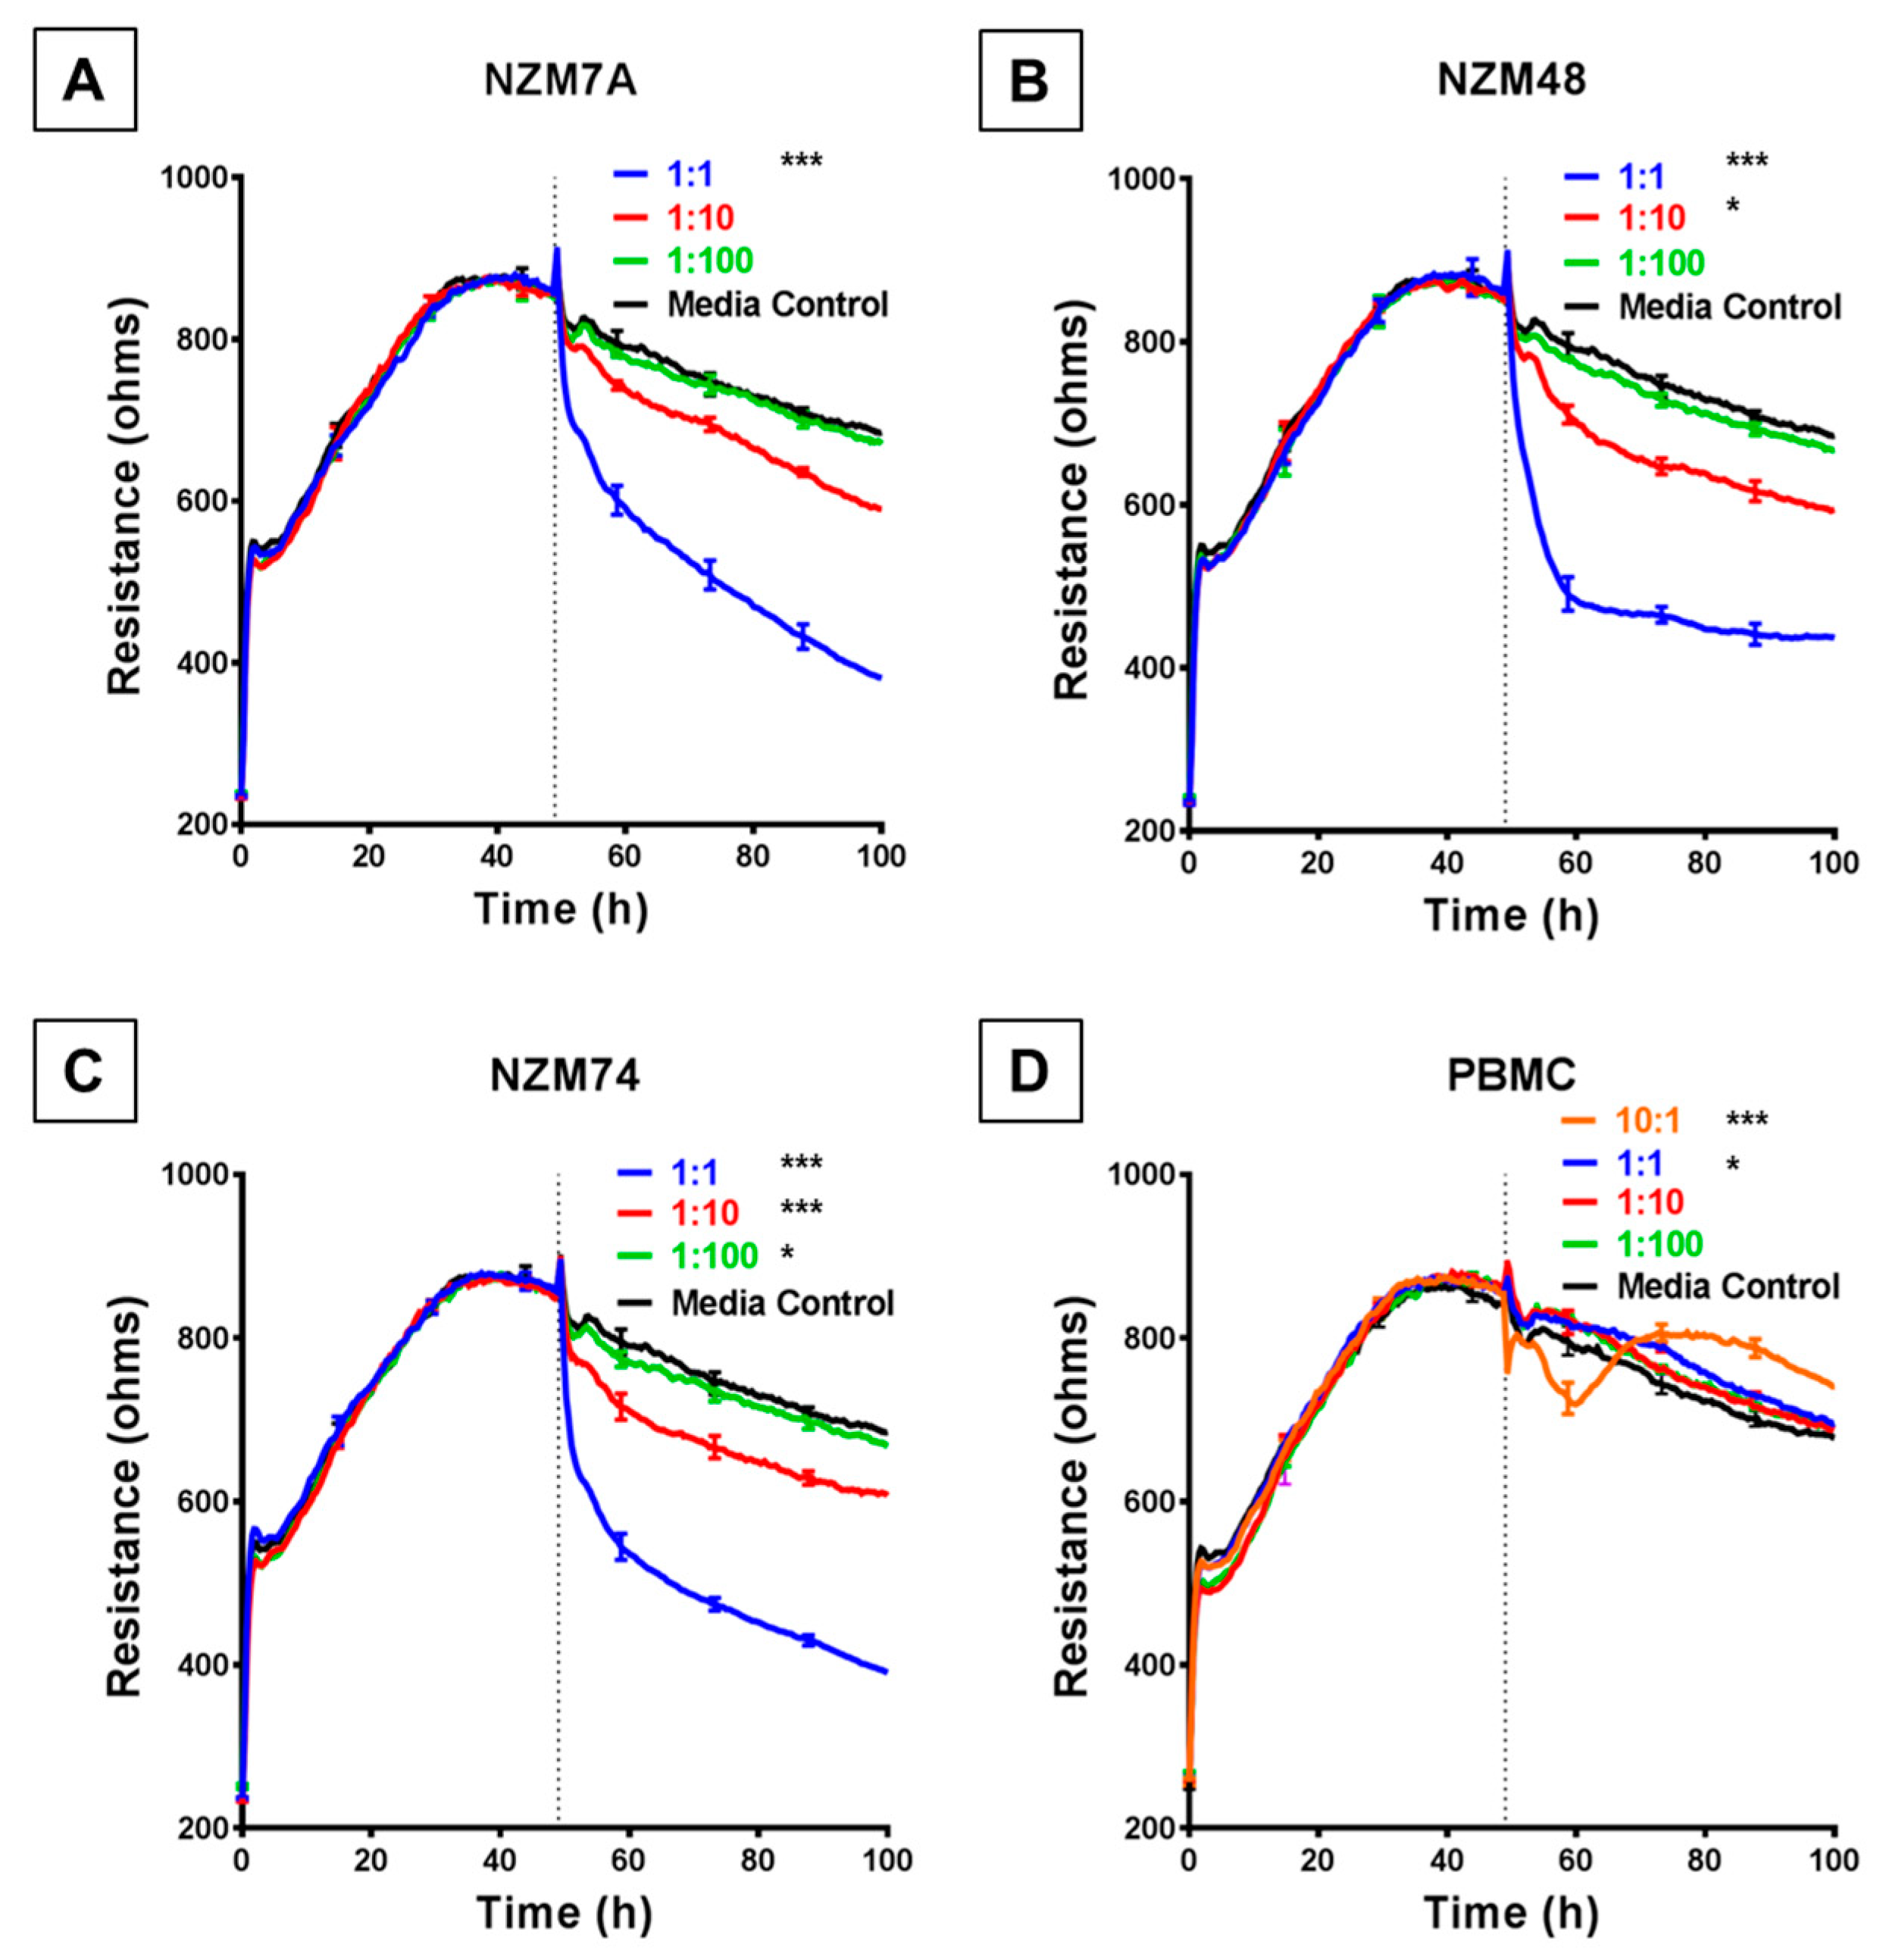
Figure 2.
ECIS reveals decreases in hCMVEC barrier resistance following exposure to NZM melanoma cells. (A–C) Unmodelled resistance (at 4000 Hz) of hCMVECs over time after addition of three different NZM cell lines. Cells were added at different effector:target (E:T) ratios, where 1:1 shows 1 NZM cell added to 1 endothelial cell. Data shown as mean ± SD (n = 3 wells) from one experiment which is representative of four independent experiments. (D) Unmodelled resistance (at 4000 Hz) of hCMVECs over time after addition of PBMCs as a cell-control, added at different effector:target (E:T) ratios, where 10:1 shows 10 PBMCs added to 1 endothelial cell. RPMI with 10% FBS was used as medium-only control. hCMVECs were seeded at 20,000 cells per well. PBMCs/NZM cells were added at 48 h (dotted line). Data shown as mean ± SD (n = 3 wells) from a single experiment; endpoints from three independent experiments were compared relative to their media control using two-way ANOVA with Tukey’s range test (* p < 0.05, *** p < 0.001).
![Biosensors 09 00056 g002]()
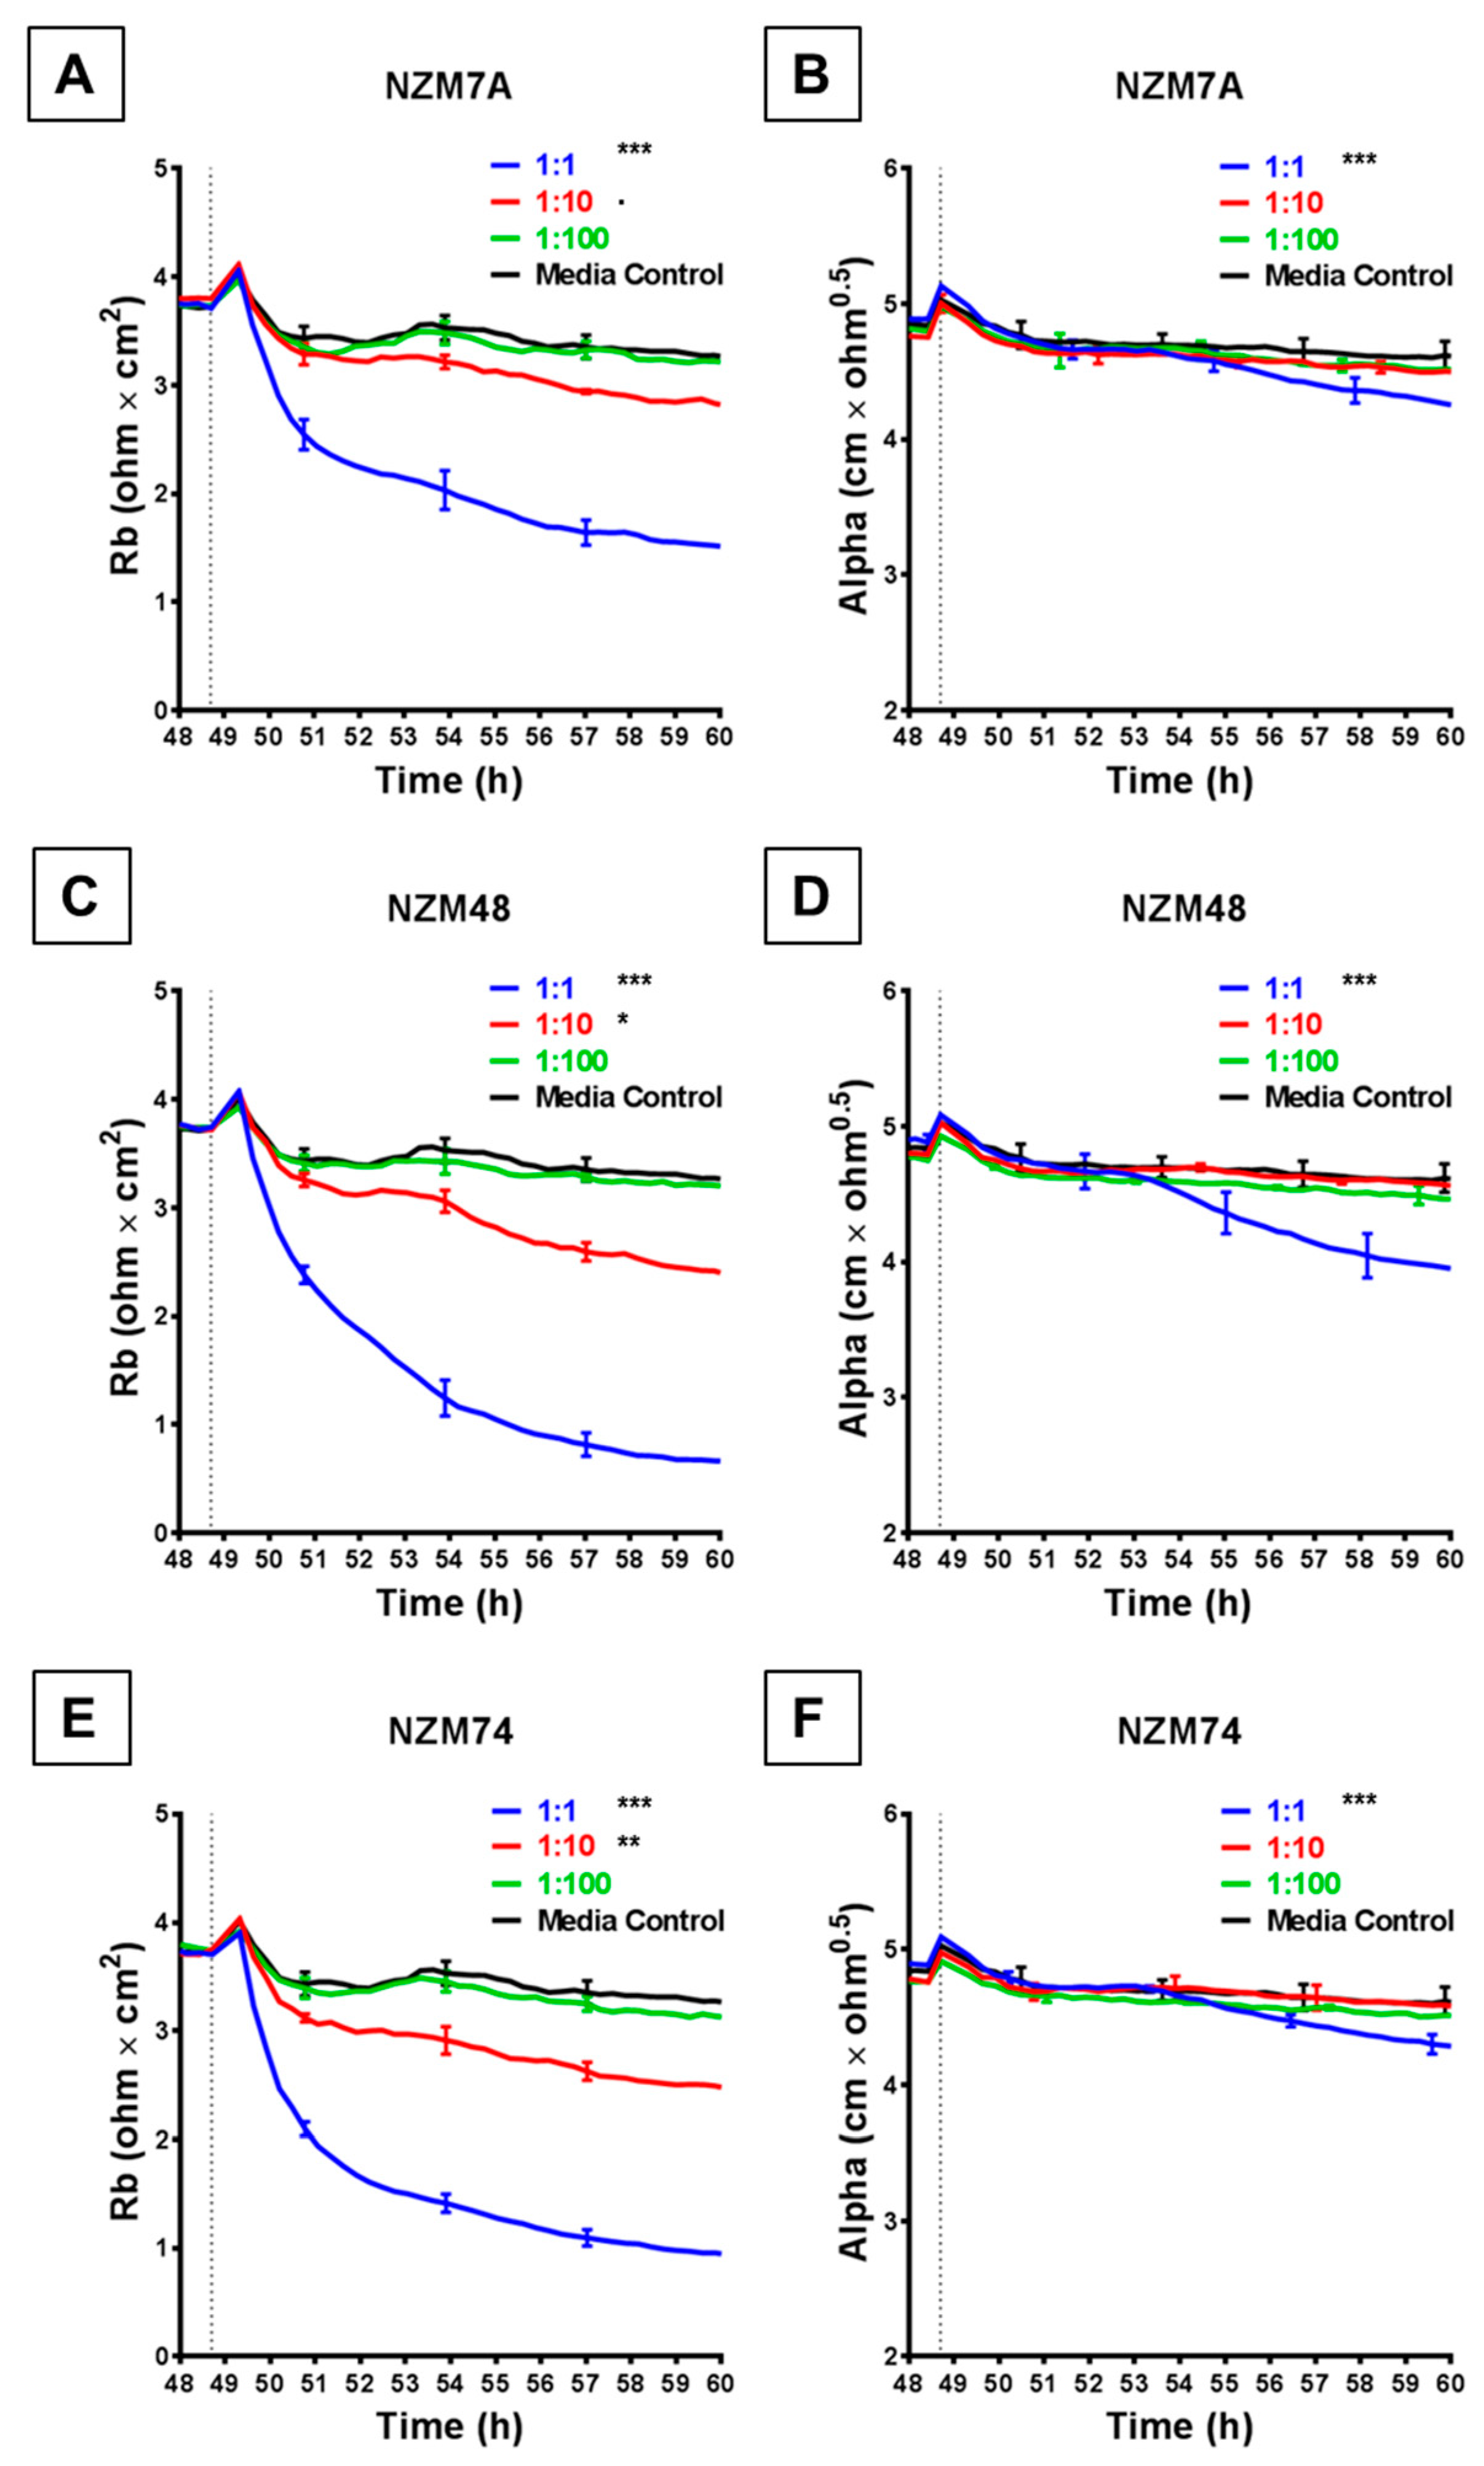
Figure 3.
ECIS reveals decreases in hCMVEC paracellular and basolateral resistance following exposure to melanoma cells NZM7, 48 and 74. (A), (C), (E) Modelled paracellular resistance (Rb) of hCMVECs over time after addition of NZM cell lines. (B), (D), (F) Modelled basolateral resistance (Alpha) of hCMVECs over time after addition of NZM cell lines. NZM cells were added at 48 h (dotted line). Data shown as mean ± SD (n = 3 wells) from a single experiment; endpoints from three independent experiments were compared relative to their media control using two-way ANOVA with Tukey’s range test (p < 0.1, * p < 0.05, ** p < 0.01, *** p < 0.001).
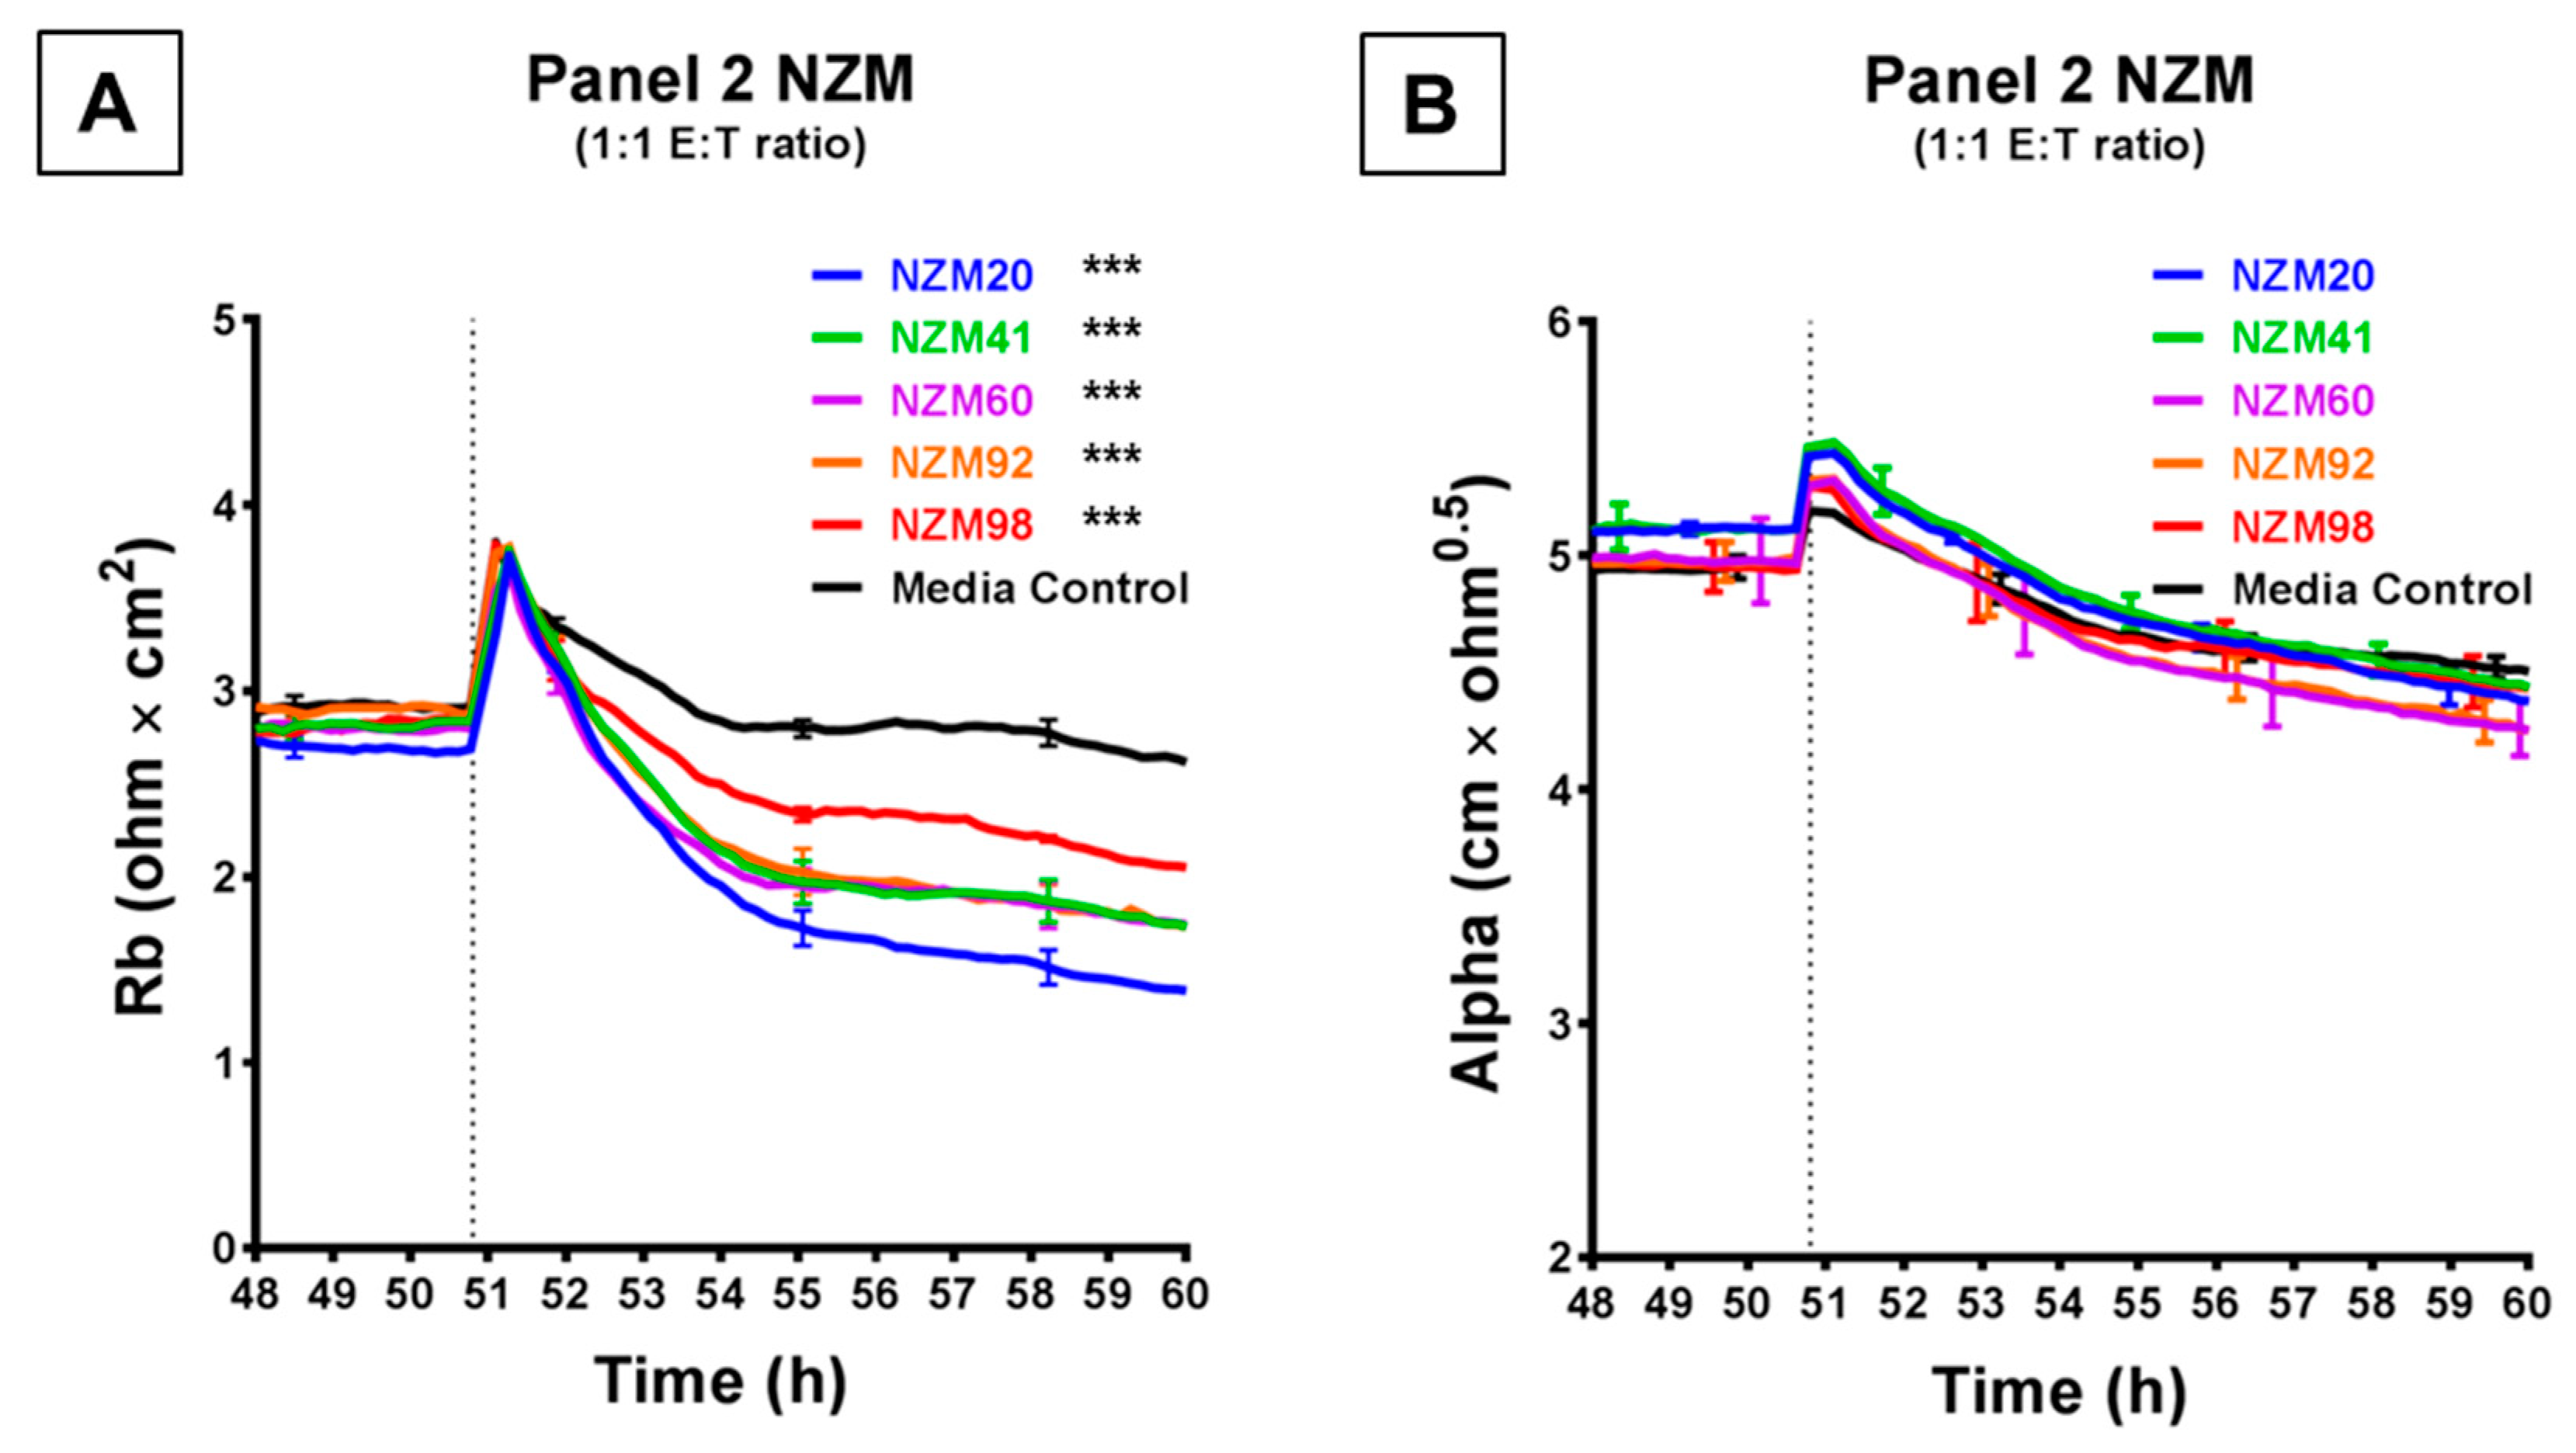
Figure 4.
ECIS demonstrates that while Panel 2 NZM melanoma cells induce a decrease in hCMVEC paracellular resistance, they do not influence basolateral resistance. Modelled (A) paracellular resistance and (B) basolateral resistance of hCMVECs over time after addition of Panel 2 NZM melanoma cell lines. Cells were added at a 1:1 E:T ratio. hCMVECs were seeded at 20,000 cells per well. NZM cells were added at 48 h (dotted line). Data shown as mean ± SD (n = 3 wells) from a single experiment; endpoints from two independent experiments were compared relative to their media control using two-way ANOVA with Tukey’s range test (*** p < 0.001).
Figure 5.
ECIS reveals that melanoma cell (NZM7, 48 and 74)-conditioned medium (CM) disrupts hCMVEC paracellular and basolateral resistance. (A) Unmodelled resistance (at 4000 Hz) of hCMVECs over time after addition of CM from NZM cell lines. Modelled (B) paracellular resistance (Rb) and (C) basolateral resistance (Alpha) of hCMVECs over time after addition of CM from NZM cell lines. NZM CM was added at 48 h (dotted line). αMEM is medium-only control. Data shown as mean ± SD (n = 3 wells) from a single experiment; Endpoints from three independent experiments were compared relative to their media control using two-way ANOVA with Tukey’s range test (* p < 0.05, ** p < 0.01, *** p < 0.001).
Figure 6.
Preferential adhesion of melanoma cells (NZM7) to hCMVEC endothelial junctions. NZM7 cells were live-stained with CMFDA (green) and applied to the apical face of hCMVECs. Cells were co-cultured for 30 min, fixed and endothelial junctions were visualized with anti-α-catenin (red). Nuclei were visualized using DAPI. (A–F) Multiple examples of a melanoma cell (green/yellow) localising at endothelial junctions (red). Images (A) and (D) are good examples of the melanoma cell residing at a multi-junctional location (corner of several endothelial cells). (B) shows a small melanoma cells at the junction of a large clearly visible endothelial cell. (C) is an example of multiple melanoma cells adhered at the same junctional positon. (E) exemplifies a large melanoma cell positioned at multiple endothelial junctions and (F) shows a melanoma cells on the junctional border of four neighbouring endothelial cells. Images shown are representative of two independent experiments. Scale bar is 20 µm.
![Biosensors 09 00056 g006]()
Figure 7.
Time-lapse series illustrating melanoma cells (NZM7) adhering to and integrating into hCMVEC endothelial layer. Time 0 represents the time point immediately before the addition of the melanoma cells, which appear spherical and refractile. The red and blue arrows follow spherical melanoma cells above endothelium that distinctly integrate into the endothelial monolayer over time. White arrow indicates evidence of endothelial cell death. Images shown are representative of two independent experiments.
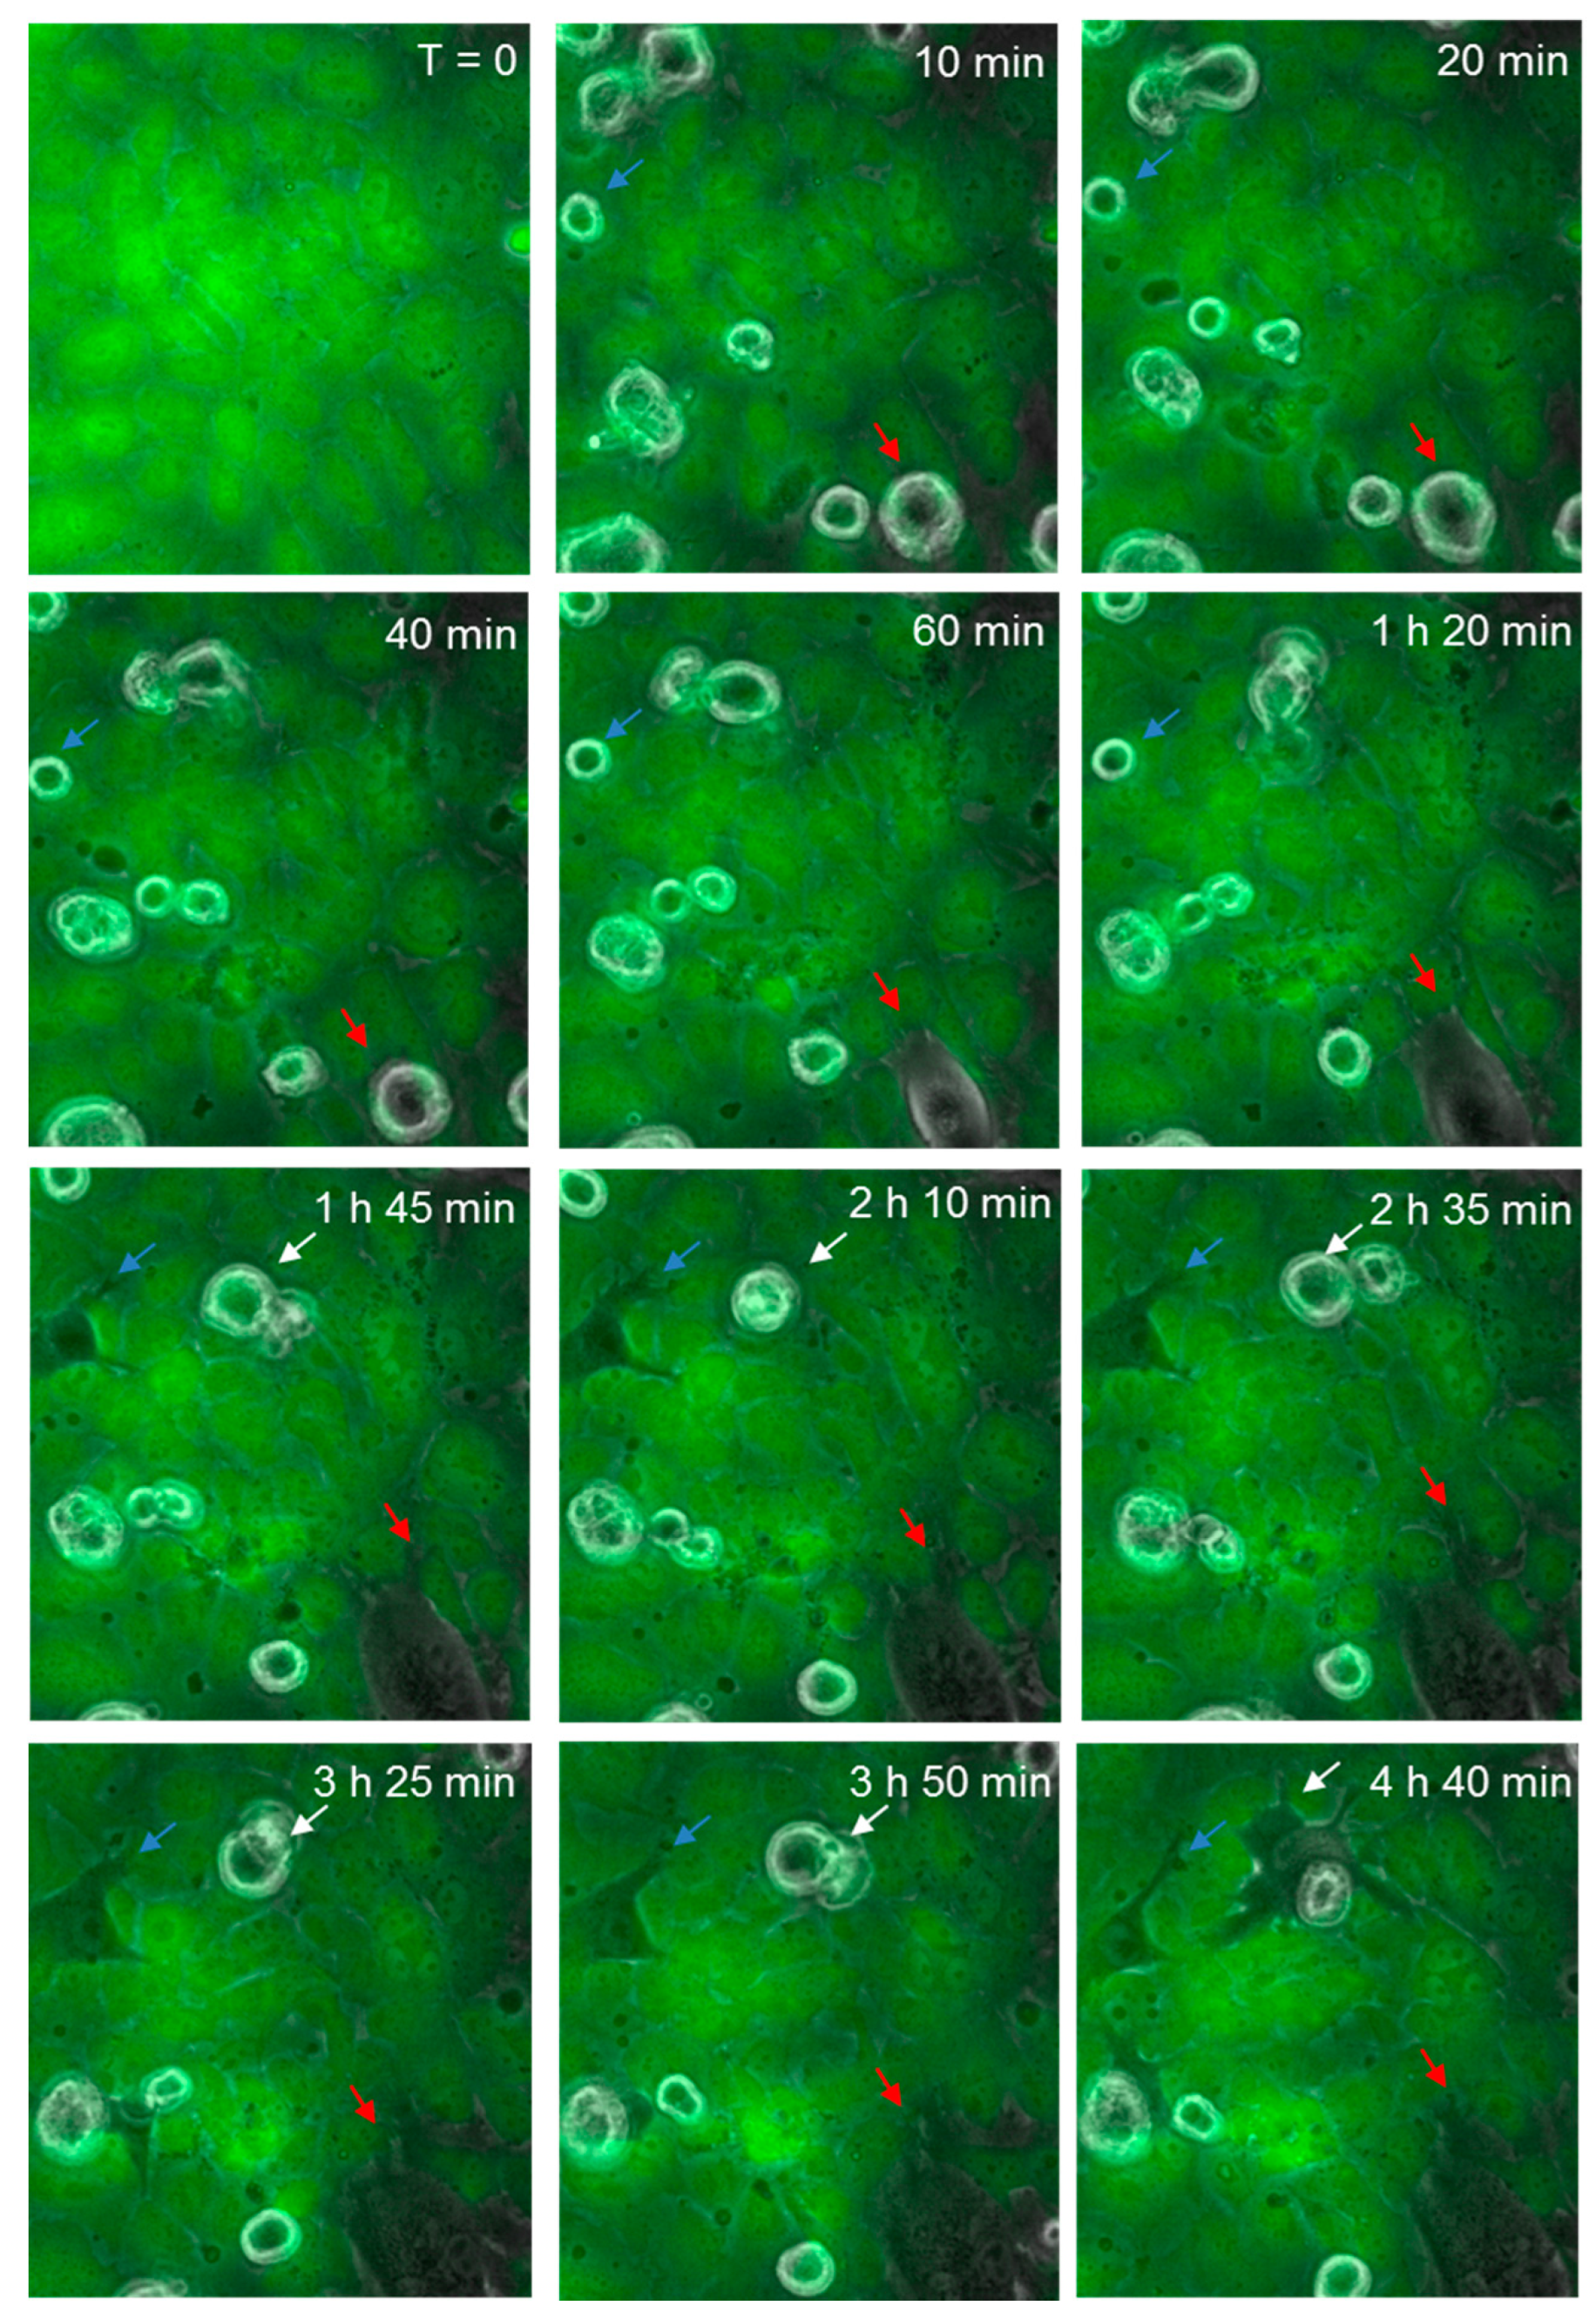
Figure 8.
Time-lapse series illustrating melanoma cells (NZM74) integrating into hCMVEC endothelial layer. Images show endothelial cells stained with CMFDA (green), merged with phase only to visualize unstained spherical melanoma cells. Coloured arrows indicate melanoma cells that extend protrusions between endothelial cells, which over time enable them to penetrate the endothelial monolayer. Images shown are representative of two independent experiments.
Figure 9.
Schematic showing possible sequence of events which occur when melanoma cells encounter endothelial monolayer. Paracellular resistance (Rb) and basolateral resistance (Alpha) together form the overall barrier resistance of the endothelial monolayer. Diagram not to scale.
Figure 9.
Schematic showing possible sequence of events which occur when melanoma cells encounter endothelial monolayer. Paracellular resistance (Rb) and basolateral resistance (Alpha) together form the overall barrier resistance of the endothelial monolayer. Diagram not to scale.

 ,
, 
