
Experimental Evolution of Copper Resistance in Escherichia coli Produces Evolutionary Trade-Offs in the Antibiotics Chloramphenicol, Bacitracin, and Sulfonamide

 , , and
Abstract
:1. Introduction
2. Results
2.1. E. coli K-12 MG1655 Adapts to Excess CuSO4
2.2. Genomic Results
2.2.1. Functional Annotation Analysis of Upregulated and Downregulated Genes
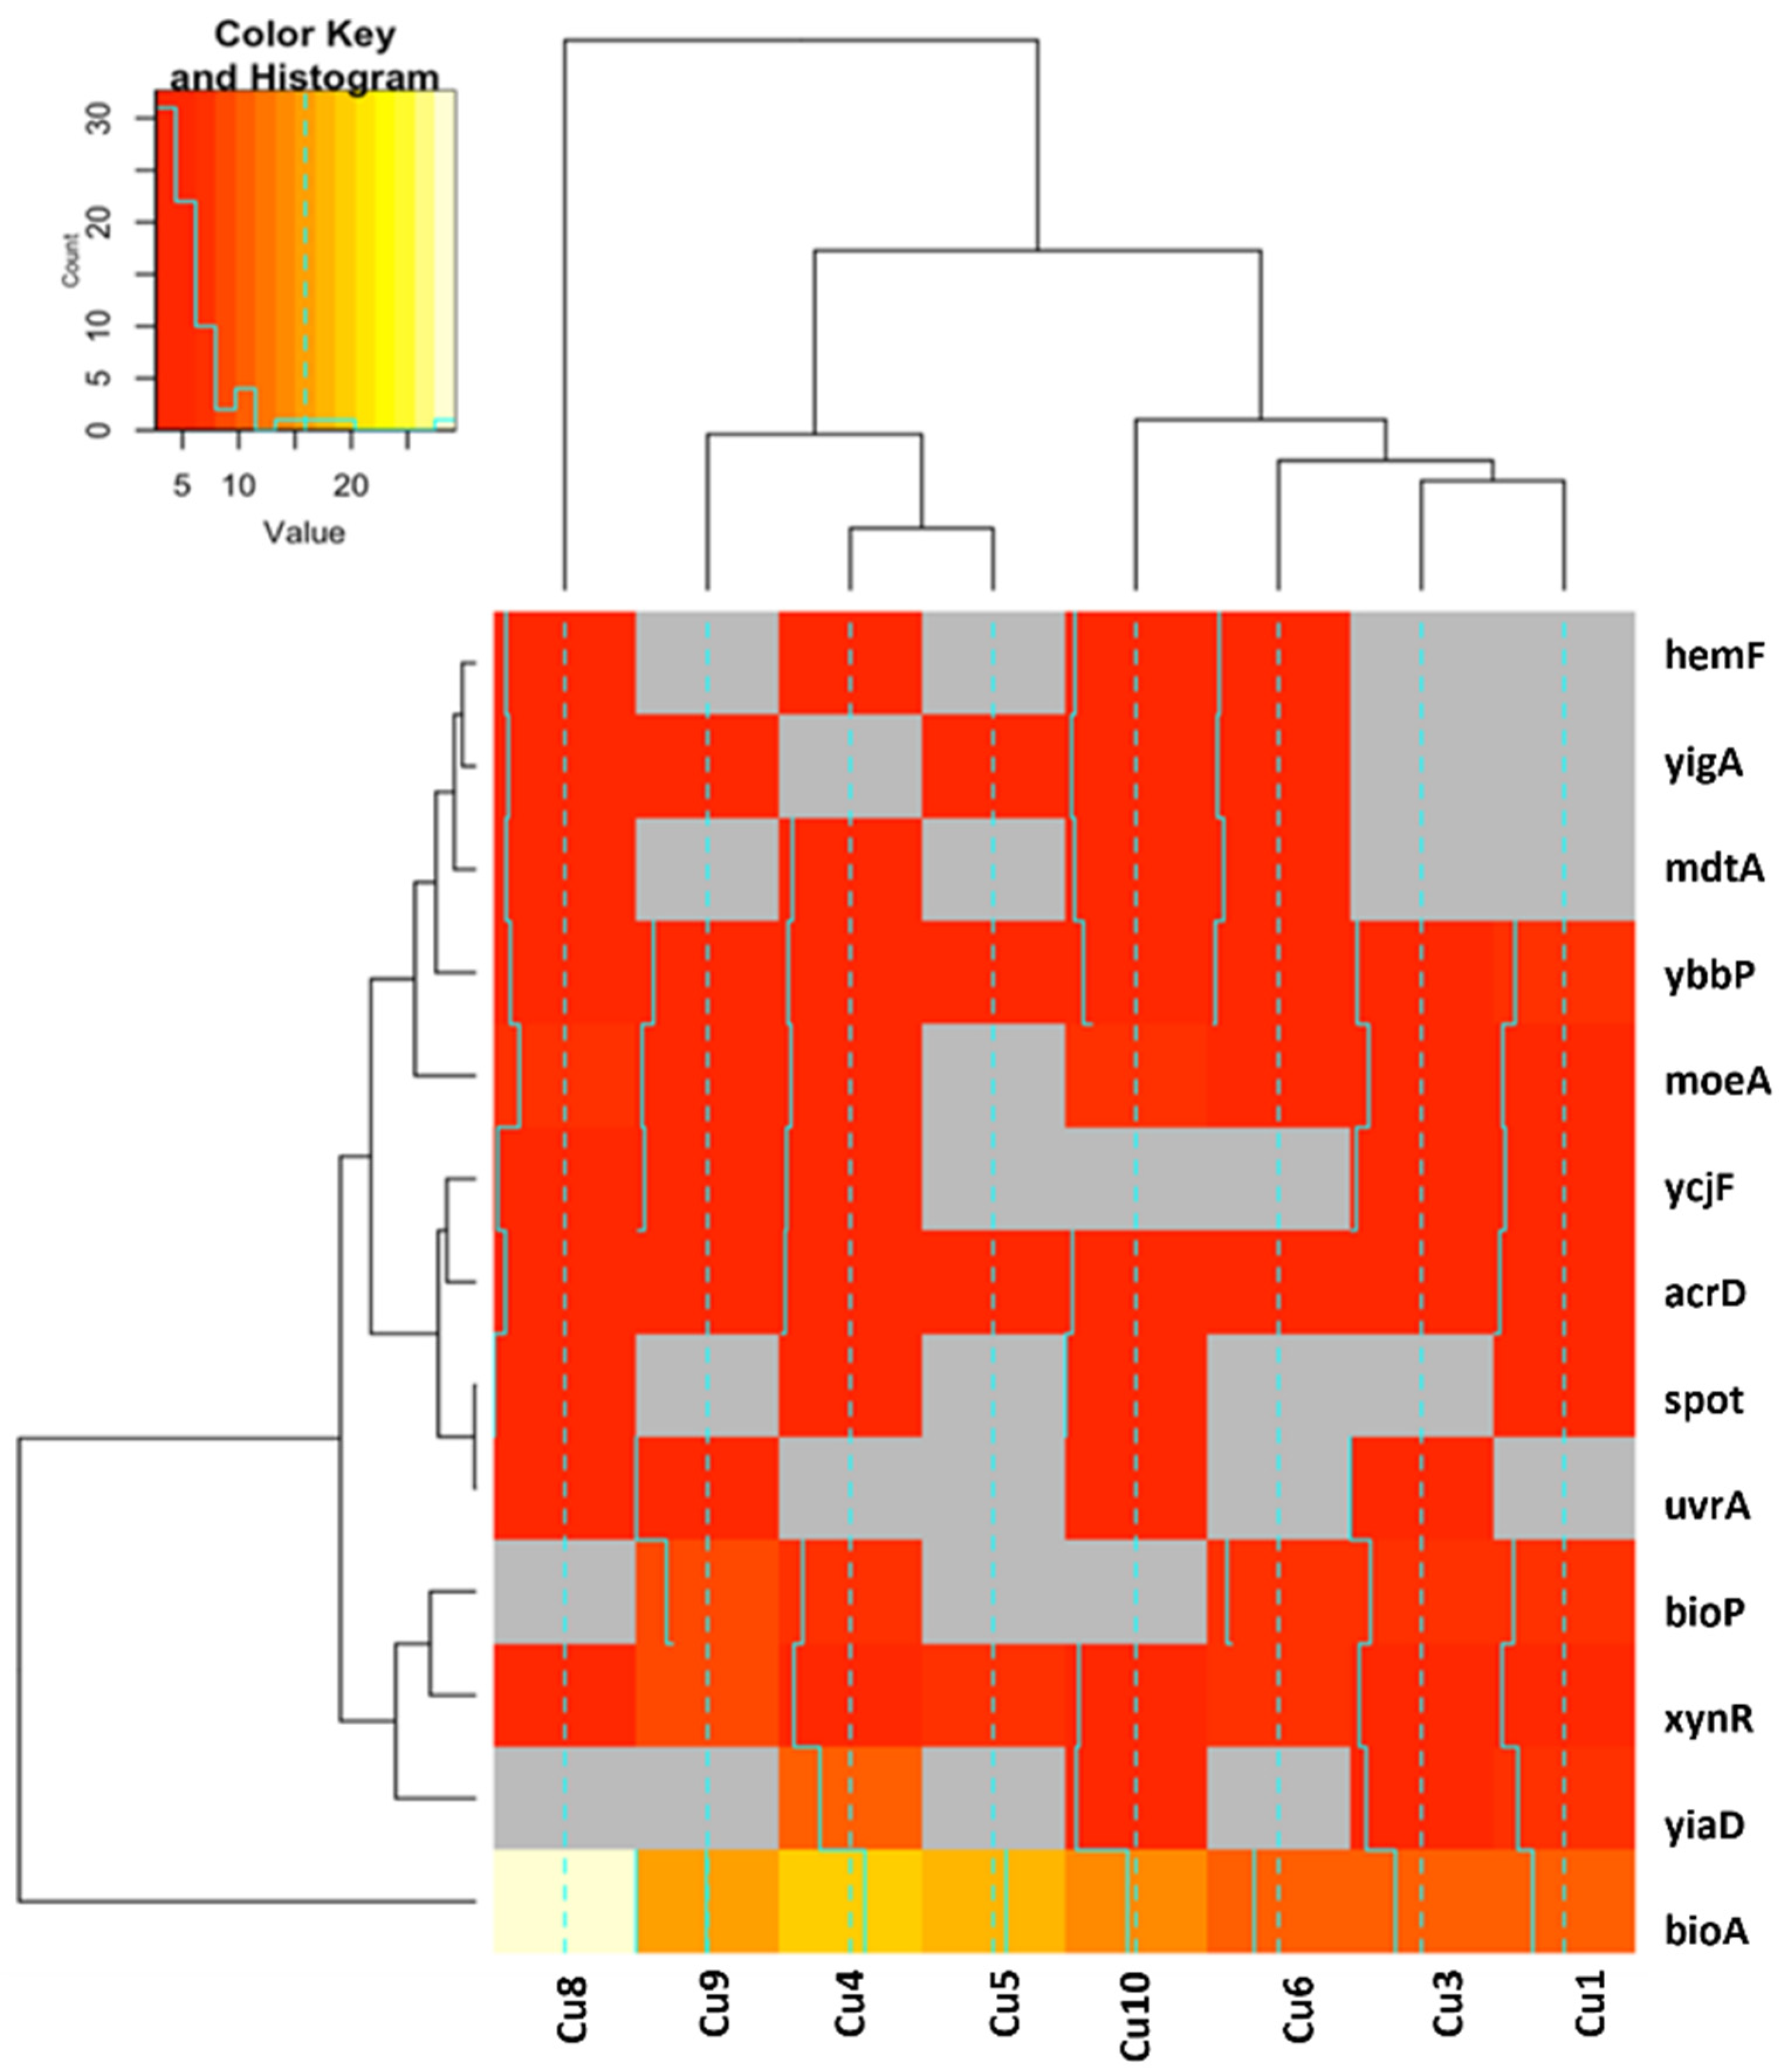
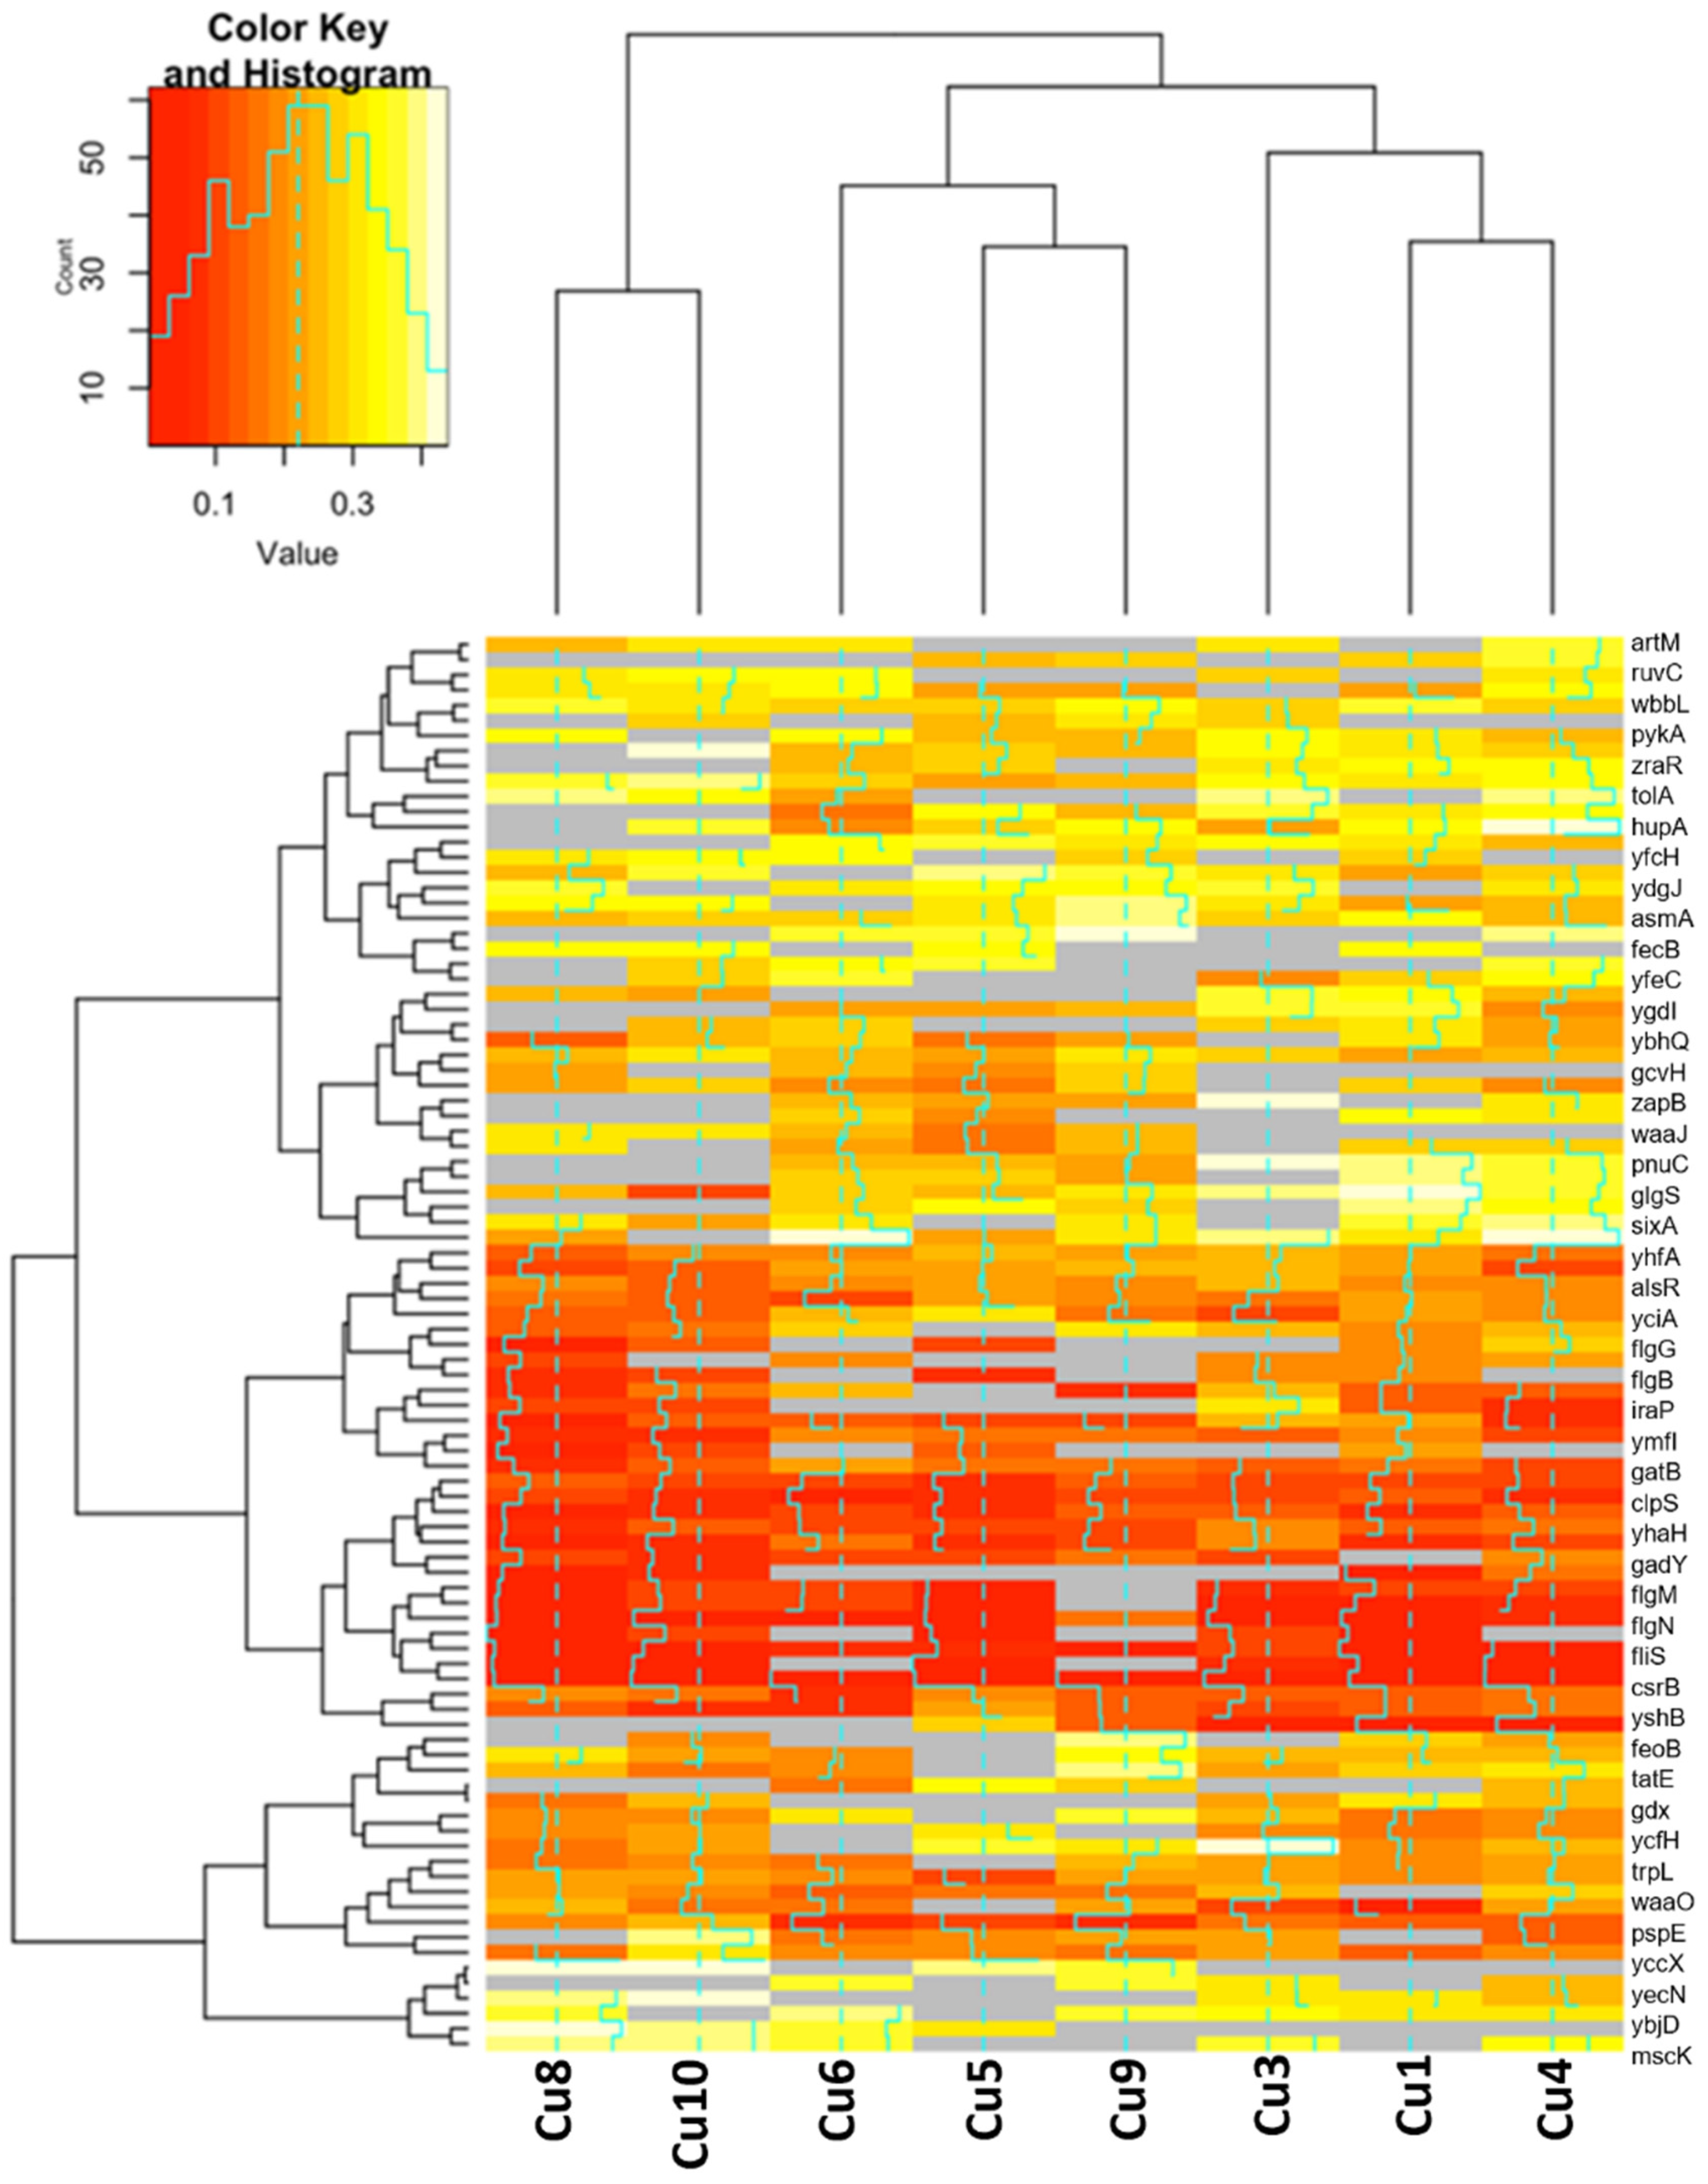
2.2.2. Differences in Gene Expression for Upregulated and Downregulated Genes
2.3. 24 h Growth Curves for Antibiotics
3. Discussion
4. Materials and Methods
4.1. Bacterial Strains and Culture Media
4.2. Experimental Evolution
4.3. 24 h Growth Assay in CuSO4
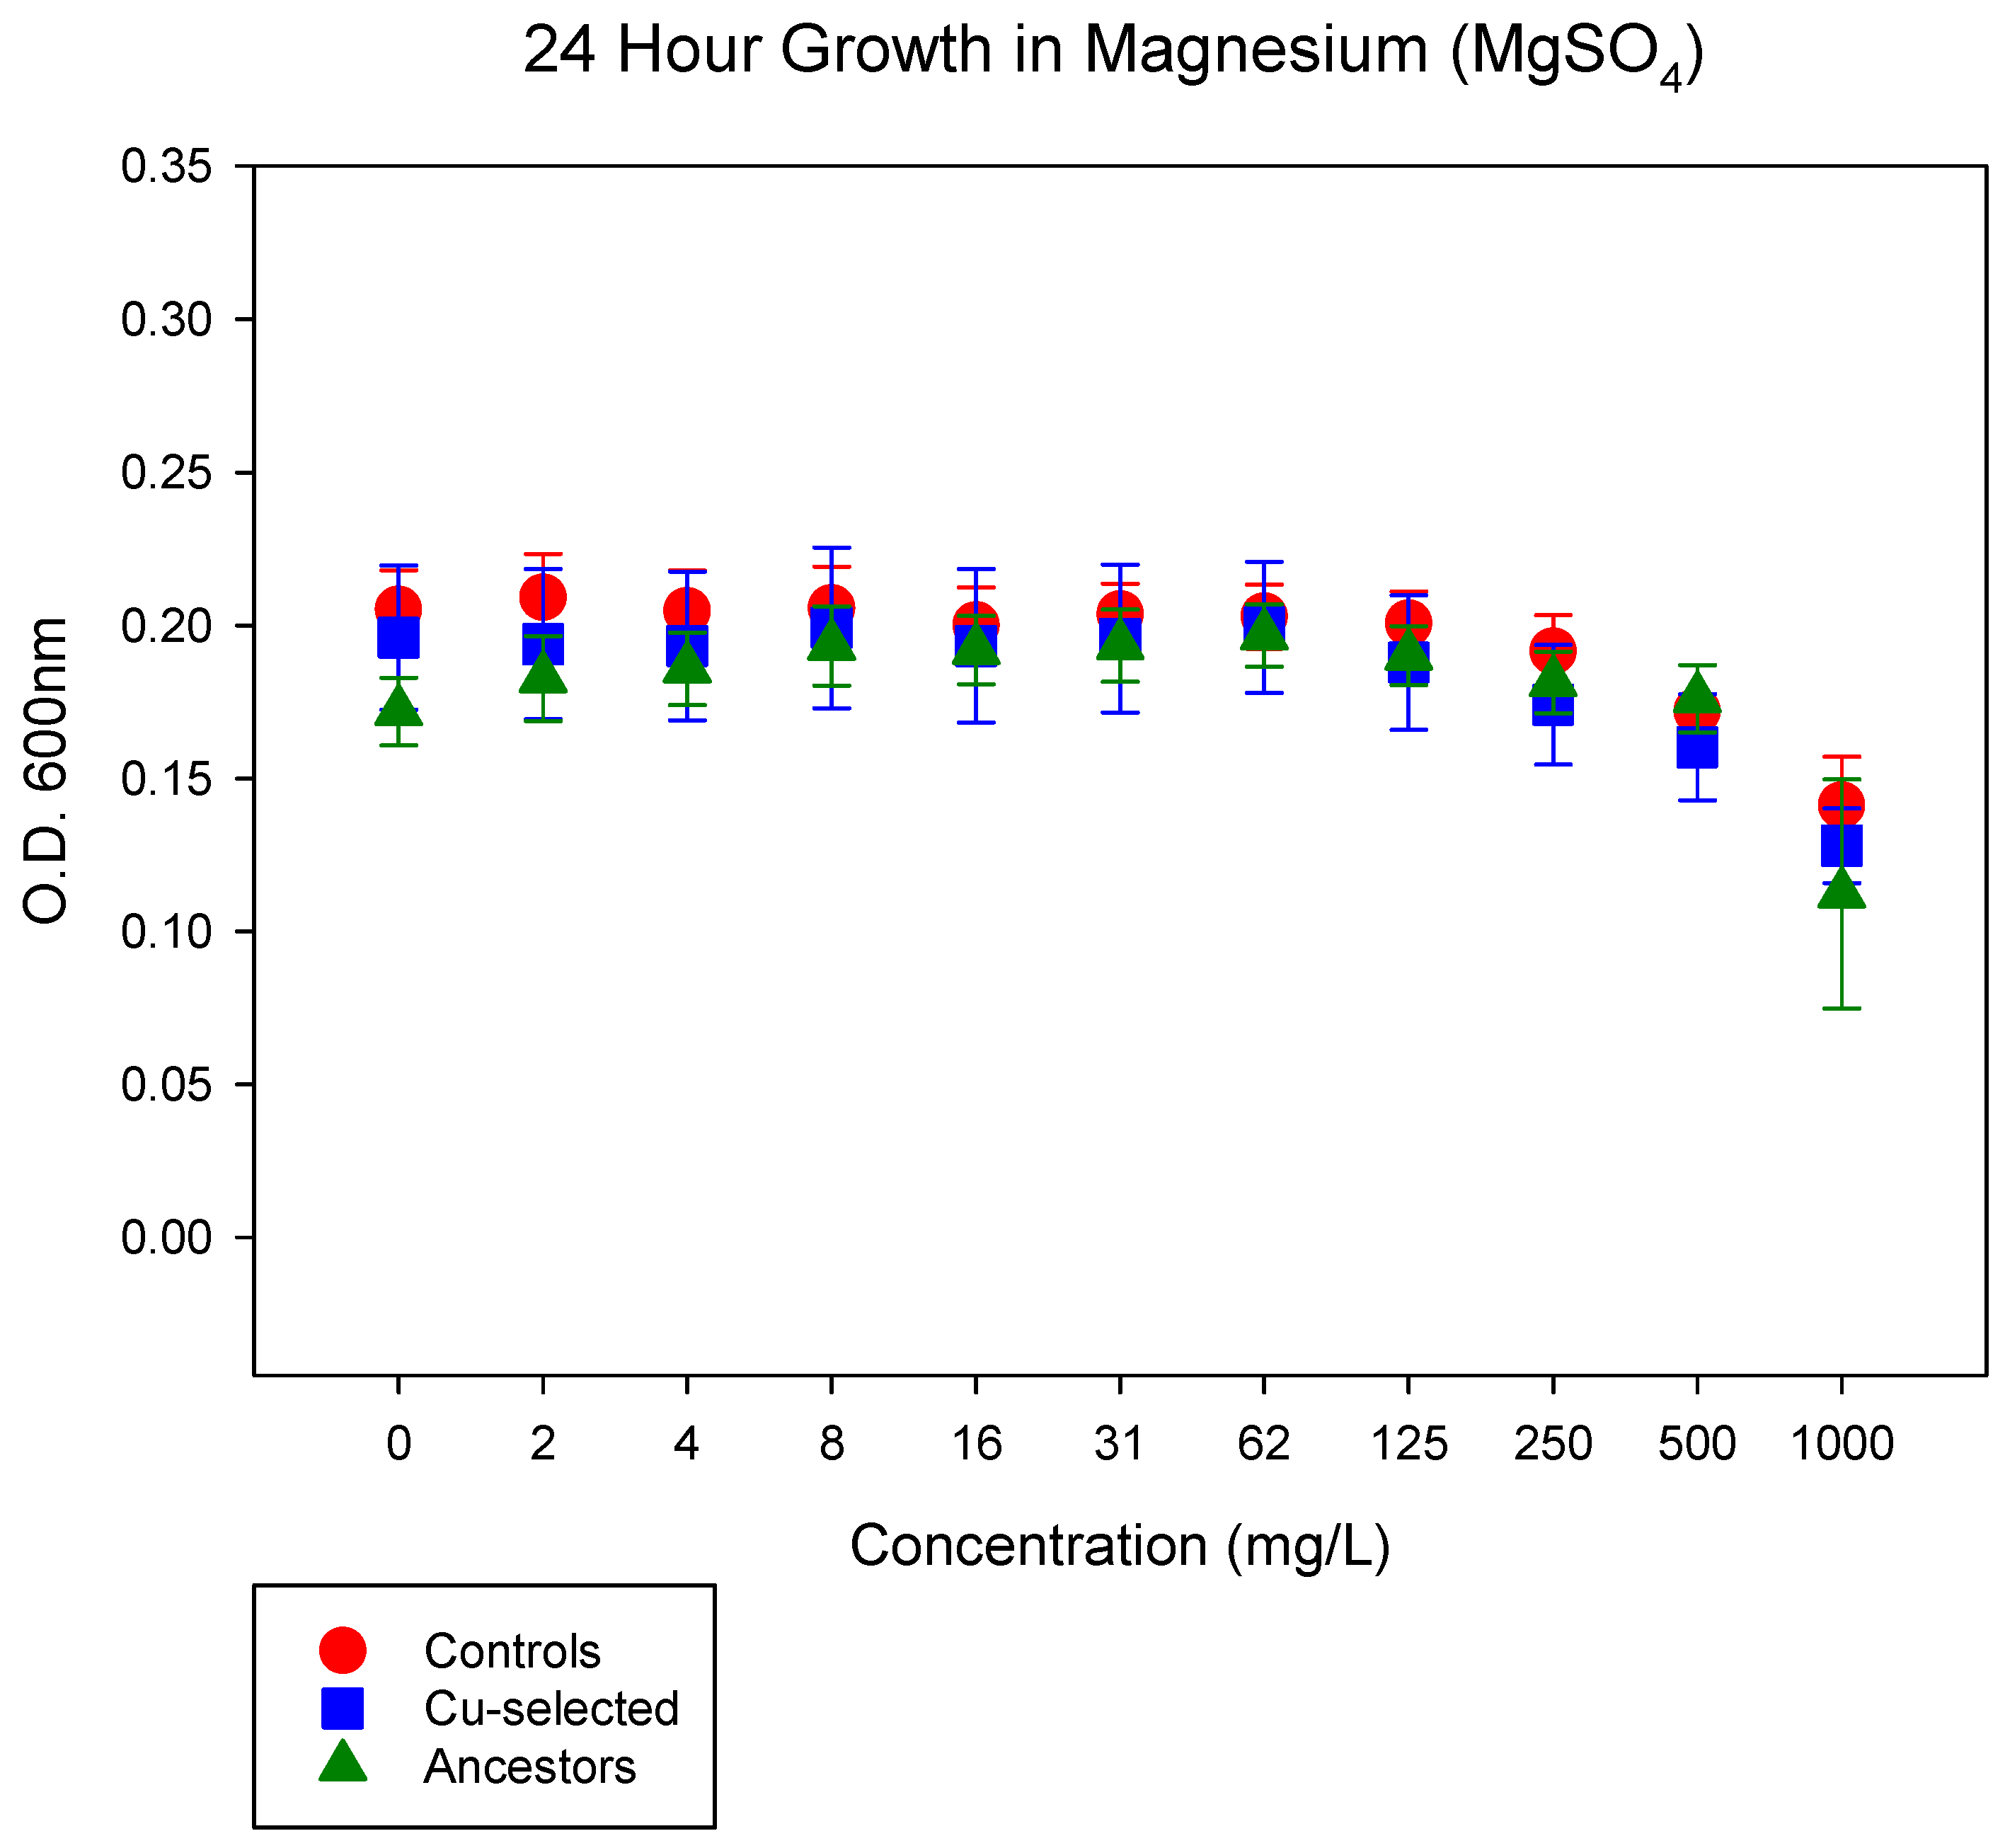
4.4. 24-h Growth Assay in MgSO4
4.5. Whole-Genome Sequencing and Sequence Analysis
4.6. RNA Extraction
4.7. Differential Gene Expression Analysis
4.7.1. Fold-Change Analysis
4.7.2. Functional Annotation of Expressed Genes
4.7.3. Differential Gene Expression
4.8. 24-h Growth Assay Antibiotics
4.9. Statistical Analysis
5. Conclusions
Author Contributions
Funding
Institutional Review Board Statement
Informed Consent Statement
Data Availability Statement
Acknowledgments
Conflicts of Interest
Appendix A

| Gene Name | Mutations | Ancestral Populations | Gene Description | ||||
|---|---|---|---|---|---|---|---|
| 1 | 2 | 3 | 4 | 5 | |||
| [crl] | Δ776 bp | 1.000 | 1.000 | 1.000 | 1.000 | 1.000 | [crl] |
| ychE/oppA | Δ1199 bp | 0.00 | 1.000 | 0.00 | 0.00 | 0.00 | UPF0056 family inner membrane protein/oligopeptide transporter subunit |
| insB1–insA | Δ776 bp | 1.000 | 1.000 | 1.000 | 0.00 | 1.000 | insB1, insA |
| insA/uspC | IS5(+) + 4 bp | 1.000 | 1.000 | 1.000 | 1.000 | 1.000 | IS1 repressor TnpA/universal stress protein |
| gatC | Δ2 bp | 1.000 | 1.000 | 1.000 | 1.000 | 1.000 | pseudogene, galactitol-specific enzyme IIC component of PTS transport; transport of small molecules: carbohydrates, organic acids, alcohols; PTS system galactitol-specific enzyme IIC |
| [rph]–[rph] | Δ82 bp | 0.442 | 0.00 | 0.104 | 0.912 | 0.00 | [rph], [rph] |
| gltP/yjcO | C → T | 0.081 | 0.098 | 0.00 | 0.089 | 0.00 | glutamate/aspartate:proton symporter/Sel1 family TPR-like repeat protein |
| gltP/yjcO | A → G | 0.00 | 0.198 | 0.00 | 0.00 | 0.292 | “ |
| gltP/yjcO | A → C | 0.00 | 0.158 | 0.00 | 0.00 | 0.283 | “ |
| gltP/yjcO | T → C | 0.238 | 0.180 | 0.310 | 0.281 | 0.265 | “ |
| gltP/yjcO | C → T | 0.00 | 0.439 | 0.00 | 0.00 | 0.00 | “ |
| glpR/glpR | +G | 0.00 | 0.00 | 0.00 | 0.836 | pseudogene, DNA-binding transcriptional repressor; regulator; energy metabolism, carbon: anaerobic respiration; repressor of the glp operon/pseudogene, DNA-binding transcriptional repressor; regulator; energy metabolism, carbon: anaerobic respiration; repressor of the glp operon | |
| gltP/yjcO | +CG | 0.00 | 0.00 | 0.00 | 0.113 | 0.00 | maltose transporter subunit |
| Gene Name | Mutations | Control Replicate Populations | Gene Description | ||||
|---|---|---|---|---|---|---|---|
| C1 | C2 | C3 | C4 | C5 | |||
| rpoA | R191C (CGT → TGT) | 0.00 | 0.318 | 0.00 | 0.00 | 0.00 | RNA polymerase, alpha subunit |
| rpoB | S712F (TCC → TTC) | 0.00 | 0.220 | 0.00 | 0.00 | 0.00 | RNA polymerase, beta subunit |
| rpoB | R12H (CGT → CAT) | 0.00 | 0.00 | 0.462 | 0.00 | 0.00 | putative multidrug transporter subunit of ABC superfamily, membrane component/ATP-binding component |
| rpoC | N762H (AAC → CAC) | 0.00 | 0.00 | 0.00 | 0.843 | 0.00 | RNA polymerase, beta prime subunit |
| oppB | coding (416–421/921 nt) | 0.00 | 0.252 | 0.00 | 0.00 | 0.00 | oligopeptide transporter subunit |
| oppC | coding (361/909 nt) | 0.00 | 0.565 | 0.00 | 0.00 | 0.00 | “ |
| oppF | Q128* (CAG → TAG) | 0.00 | 0.00 | 0.00 | 0.883 | 0.00 | “ |
| oppC | coding (361/909 nt) | 0.00 | 0.00 | 0.00 | 0.00 | 0.468 | “ |
| oppB | coding (416-421/921 nt) | 0.00 | 0.00 | 0.00 | 0.00 | 0.337 | “ |
| oppC | W254* (TGG → TGA) | 0.00 | 0.00 | 0.00 | 0.00 | 0.144 | “ |
| malT | V259D (GTT → GAT) | 0.00 | 0.439 | 0.00 | 0.00 | 0.00 | mal regulon transcriptional activator |
| malT | L431R (CTG → CGG) | 0.00 | 0.00 | 0.00 | 0.836 | 0.00 | “ |
| malE | W155* (TGG → TAG) | 0.00 | 0.00 | 0.00 | 0.113 | 0.00 | maltose transporter subunit |
| dgoR | E47G (GAG → GGG) | 0.113 | 0.00 | 0.00 | 0.00 | 0.00 | putative DNA-binding transcriptional regulator |
| dgoR | E47G (GAG → GGG) | 0.00 | 0.0 | 0.00 | 0.153 | 0.00 | “ |
| hypF | E526G (GAG → GGG) | 0.097 | 0.00 | 0.00 | 0.00 | 0.00 | carbamoyl phosphate phosphatase and maturation protein for [NiFe] hydrogenases |
| waaS | L20L (CTG → CTA) | 0.00 | 0.091 | 0.00 | 0.00 | 0.00 | lipopolysaccharide core biosynthesis protein |
| ftsN | S22P (TCA → CCA) | 0.00 | 0.168 | 0.00 | 0.00 | 0.00 | essential cell division protein |
| inaA | E69G (GAG → GGG) | 0.00 | 0.00 | 0.137 | 0.00 | 0.00 | acid-inducible Kdo/WaaP family putative kinase |
| atpG | H65P (CAC → CCC) | 0.00 | 0.00 | 1.000 | 0.00 | 0.00 | F1 sector of membrane-bound ATP synthase, gamma subunit |
| ddlB | G85G (GGA → GGG) | 0.00 | 0.00 | 0.00 | 0.180 | 0.00 | d-alanine:d-alanine ligase |
| mutT | D104N (GAT → AAT) | 0.00 | 0.00 | 0.00 | 0.868 | 0.00 | nucleoside triphosphate pyrophosphohydrolase, marked preference for dGTP |
| bamA / skp | coding (229/2676 nt) | 0.00 | 0.00 | 0.00 | 0.847 | 0.00 | BamABCDE complex OM biogenesis outer membrane pore-forming assembly factor/periplasmic chaperone |
| yagH | coding (228/2676 nt) | 0.00 | 0.00 | 0.00 | 0.132 | 0.00 | CP4-6 prophage; putative xylosidase/arabinosidase |
| nusB | V130I (GTT → ATT) | 0.00 | 0.00 | 0.00 | 0.110 | 0.00 | transcription antitermination protein |
| nfsA | H600Q (CAC → CAG) | 0.00 | 0.00 | 0.00 | 0.823 | 0.00 | nitroreductase A, NADPH-dependent, FMN-dependent |
| feaR | F62L (TTT → CTT) | 0.00 | 0.00 | 0.00 | 0.150 | 0.00 | transcriptional activator for tynA and feaB |
| paaH | Q128* (CAG → TAG) | 0.00 | 0.00 | 0.00 | 0.111 | 0.00 | 3-hydroxyadipyl-CoA dehydrogenase, NAD+-dependent |
| mnaT | Q128* (CAG → TAG) | 0.00 | 0.00 | 0.00 | 0.214 | 0.00 | methionine N-acyltransferase; l-amino acid N-acyltransferase |
| gatR | pseudogene (381/475 nt) | 0.00 | 0.00 | 0.00 | 0.922 | 0.00 | pseudogene (381/475 nt) |
| fryA | K283N (AAA → AAC) | 0.00 | 0.000 | 0.00 | 0.854 | 0.00 | putative PTS enzyme, Hpr component/enzyme I component/enzyme IIA component |
| cysK / ptsH | intergenic (+18/−366) | 0.00 | 0.00 | 0.00 | 0.860 | 0.00 | cysteine synthase A, O-acetylserine sulfhydrolase A subunit/phosphohistidinoprotein-hexose phosphotransferase component of PTS system (Hpr) |
| feaR | F62L (TTT → CTT) | 0.00 | 0.00 | 0.00 | 0.150 | 0.00 | transcriptional activator for tynA and feaB |
| paaH | Q128* (CAG → TAG) | 0.00 | 0.00 | 0.00 | 0.111 | 0.00 | 3-hydroxyadipyl-CoA dehydrogenase, NAD+-dependent |
| acrD | T204P (ACT → CCT) | 0.00 | 0.00 | 0.00 | 0.185 | 0.00 | aminoglycoside/multidrug efflux system |
| gss | E368D (GAA → GAC) | 0.00 | 0.00 | 0.00 | 0.876 | 0.00 | fused glutathionylspermidine amidase/glutathionylspermidine synthetase |
| hybO | I54S (ATT → AGT) | 0.00 | 0.00 | 0.00 | 0.921 | 0.00 | hydrogenase 2, small subunit |
| ygjV | G87D (GGC → GAC) | 0.00 | 0.00 | 0.00 | 0.165 | 0.00 | Imp-YgjV family inner membrane protein |
| csrD | F10V (TTT → GTT) | 0.00 | 0.00 | 0.00 | 0.857 | 0.00 | targeting factor for csrBC sRNA degradation |
| rplW | V63V (GTT → GTG) | 0.00 | 0.00 | 0.00 | 0.861 | 0.00 | 50S ribosomal subunit protein L23 |
| yibB | A45E (GCA → GAA) | 0.00 | 0.00 | 0.00 | 0.091 | 0.00 | YibB family protein, function unknown |
| yjhU | L61R (CTG → CGG) | 0.00 | 0.00 | 0.00 | 0.124 | 0.00 | putative DNA-binding transcriptional regulator; KpLE2 phage-like element |
| pfkA | G282G (GGT → GGG) | 0.00 | 0.00 | 0.00 | 0.798 | 0.00 | 6-phosphofructokinase I |
| agaA / agaS | intergenic (+229/−122) | 0.00 | 0.00 | 0.00 | 0.127 | 0.00 | pseudogene, N-acetylgalactosamine-6-phosphate deacetylase fragment; putative N-acetylgalactosamine-6-phosphate deacetylase/tagatose-6-phosphate ketose/aldose isomerase |
| Column 1 | Gene ID |
| Column 2 | Counts for unstranded RNA-seq |
| Column 3 | Counts for the 1st read strand aligned with RNA |
| Column 4 | Counts for the 2nd read strand aligned with RNA |
| Groups | Fold-Change Comparison |
|---|---|
| Group 1 | Cu-selected in CuSO4 compared to Controls in CuSO4 |
| Group 2 | Cu-selected in CuSO4 compared to Cu-selected in DMB only |
| Group 3 | Controls in CuSO4 compared to controls in DMB only |
| Group 4 | Uniquely expressed genes in Cu-selected in CuSO4 not expressed in the controls in CuSO4 (compares Groups 1 and 3) |
References
- Alavi, M.; Rai, M. Recent advances in antibacterial applications of metal nanoparticles (MNPs) and metal nanocomposites (MNCs) against multidrug-resistant (MDR) bacteria. Expert Rev. Anti Infect. Ther. 2019, 17, 419. [Google Scholar] [CrossRef] [PubMed]
- Frei, A.; Zuegg, J.; Elliott, A.G.; Baker, M.; Braese, S.; Brown, C.; Chen, F.; Dowson, C.; Dujardin, G.; Jung, N.; et al. Metal complexes as a promising source for new antibiotics. Chem. Sci. 2020, 11, 2627. [Google Scholar] [CrossRef] [PubMed] [Green Version]
- Hobman, J.L.; Crossman, L.C. Bacterial antimicrobial metal ion resistance. J. Med. Microbiol. 2015, 64, 471–497. [Google Scholar] [CrossRef] [PubMed]
- Rosenberg, M.; Vija, H.; Kahru, A.; Keevil, C.; Ivask, A. Rapid in situ assessment of Cu-ion mediated effects and antibacterial efficacy of copper surfaces. Sci. Rep. 2018, 8, 8112–8172. [Google Scholar] [CrossRef] [PubMed]
- Mikolay, A.; Huggett, S.; Tikana, L.; Grass, G.; Braun, J.; Nies, D. Survival of bacteria on metallic copper surfaces in a hospital trial. Appl. Microbiol. Biotechnol. 2010, 87, 1875–1879. [Google Scholar] [CrossRef] [PubMed]
- Karpanen, T.J.; Casey, A.L.; Lambert, P.A.; Cookson, B.; Nightingale, P.; Miruszenko, L.; Elliot, T. The Antimicrobial Efficacy of Copper Alloy Furnishing in the Clinical Environment: A Crossover Study. Infect. Control Hosp. Epidemiol. 2012, 33, 3–9. [Google Scholar] [CrossRef] [Green Version]
- Hinsa-Leasure, S.M.; Nartey, Q.; Vaverka, J.; Schmidt, M. Copper alloy surfaces sustain terminal cleaning levels in a rural hospital. Am. J. Infect. Control 2016, 44, e195–e203. [Google Scholar] [CrossRef] [Green Version]
- Montero, D.A.; Arellano, C.; Pardo, M.; Vera, R.; Galvez, R.; Cifuentes, M.; Berasain, M.; Gomez, M.; Ramirez, C.; Vidal, R. Antimicrobial properties of a novel copper-based composite coating with potential for use in healthcare facilities. Antimicrob. Resist. Infect. Control 2019, 8, 3. [Google Scholar] [CrossRef]
- Crawford, C.L.; Dalecki, A.G.; Perez, M.D.; Schaaf, K.; Wolschendorf, F.; Kutsch, O. A copper-dependent compound restores ampicillin sensitivity in multidrug-resistant Staphylococcus aureus. Sci. Rep. 2020, 10, 8955. [Google Scholar] [CrossRef]
- Peña, M.M.; Lee, J.; Thiele, D.J. A delicate balance: A delicate balance: Homeostatic control of copper uptake and distribution. J. Nutr. 1999, 129, 1251–1260. [Google Scholar] [CrossRef] [Green Version]
- Rensing, C.; Fan, B.; Sharma, R.; Mitra, B.; Rosen, B. CopA: An Escherichia coli Cu(I)-Translocating P-Type ATPase. Proc. Natl. Acad. Sci. USA 2000, 97, 652–656. [Google Scholar] [CrossRef] [PubMed] [Green Version]
- Hong, R.; Kang, T.Y.; Michels, C.A.; Gadura, N. Membrane Lipid Peroxidation in Copper Alloy-Mediated Contact Killing of Escherichia coli. Appl. Environ. Microbiol. 2012, 78, 1776–1784. [Google Scholar] [CrossRef] [PubMed] [Green Version]
- Grass, G.; Rensing, C.; Solioz, M. Metallic Copper as an Antimicrobial Surface. Appl. Environ. Microbiol. 2011, 77, 1541–1547. [Google Scholar] [CrossRef] [PubMed] [Green Version]
- Angelé-Martínez, C.; Nguyen, K.V.T.; Ameer, F.S.; Anker, J.N.; Brumaghim, J.L. Reactive oxygen species generation by copper(II) oxide nanoparticles determined by DNA damage assays and EPR spectroscopy. Nanotoxicology 2017, 11, 278. [Google Scholar] [CrossRef] [Green Version]
- Macomber, L.; Rensing, C.; Imlay, J.A. Intracellular Copper Does Not Catalyze the Formation of Oxidative DNA Damage in Escherichia coli. J. Bacteriol. 2007, 189, 1616–1626. [Google Scholar] [CrossRef] [Green Version]
- Macomber, L.; Imlay, J.A. The iron-sulfur clusters of dehydratases are primary intracellular targets of copper toxicity. Proc. Natl. Acad. Sci. USA 2009, 106, 8344–8349. [Google Scholar] [CrossRef] [Green Version]
- Outten, F.W.; Outten, C.E.; Hale, J.; O’Halloran, T.V. Transcriptional activation of an Escherichia coli copper efflux regulon by the chromosomal MerR homologue, cueR. J. Biol. Chem. 2000, 275, 31024–31029. [Google Scholar] [CrossRef] [Green Version]
- Rensing, C.; Grass, G. Escherichia coli mechanisms of copper homeostasis in a changing environment. FEMS Microbiol. Rev. 2003, 27, 197–213. [Google Scholar] [CrossRef] [Green Version]
- Munson, G.P.; Lam, D.L.; Outten, F.W.; O’Halloran, T.V. Identification of a copper-responsive two-component system on the chromosome of Escherichia coli K-12. J. Bacteriol. 2000, 182, 5864–5871. [Google Scholar] [CrossRef] [Green Version]
- Franke, S.; Grass, G.; Rensing, C.; Nies, D.H. Molecular Analysis of the Copper-Transporting Efflux System CusCFBA of Escherichia coli. J. Bacteriol. 2003, 185, 3804–3812. [Google Scholar] [CrossRef] [Green Version]
- Yu, E.W.; Zimmermann, M.T.; Long, F.; Feng, R.; Kanagalaghatta, R.; Boyken, S.E.; Jernigan, R.L.; Su, C. Crystal structures of the CusA efflux pump suggest methionine-mediated metal transport. Nature 2010, 467, 484–488. [Google Scholar] [CrossRef] [Green Version]
- Yamamoto, K.; Ishihama, A. Transcriptional response of Escherichia coli to external copper. Mol. Microbiol. 2005, 56, 215. [Google Scholar] [CrossRef] [PubMed]
- Outten, F.W.; Huffman, D.L.; Hale, J.A.; O’Halloran, T.V. The Independent cue and cusSystems Confer Copper Tolerance during Aerobic and Anaerobic Growth in Escherichia coli. J. Biol. Chem. 2001, 276, 30670–30677. [Google Scholar] [CrossRef] [PubMed] [Green Version]
- Grass, G.; Rensing, C. CueO is a multi-copper oxidase that confers copper tolerance in Escherichia coli. Biochem. Biophys. Res. Commun. 2001, 286, 902–908. [Google Scholar] [CrossRef] [PubMed]
- Festa, R.A.; Thiele, D.J. Copper: An essential metal in biology. Curr. Biol. 2011, 21, R877–R883. [Google Scholar] [CrossRef] [Green Version]
- Ashajyothi, C.; Harish, K.H.; Dubey, N.; Chandrakanth, R.K. Antibiofilm activity of biogenic copper and zinc oxide nanoparticles-antimicrobials collegiate against multiple drug resistant bacteria: A nanoscale approach. J. Nanostruct. Chem. 2016, 6, 329–341. [Google Scholar] [CrossRef] [Green Version]
- Benhalima, L.; Amri, S.; Bensouilah, M.; Ouzrout, R. Antibacterial effect of copper sulfate against multi-drug resistant nosocomial pathogens isolated from clinical samples. Pak. J. Med. Sci. 2019, 35, 1322–1328. [Google Scholar] [CrossRef] [Green Version]
- Moreira Martins, P.M.; Gong, T.; de Souza, A.A.; Wood, T.K. Copper Kills Escherichia coli Persister Cells. Antibiotics 2020, 9, 506. [Google Scholar] [CrossRef]
- Yamamoto, K.; Ishihama, A. Characterization of copper-inducible promoters regulated by CpxA/CpxR in Escherichia coli. Biosci. Biotechnol. Biochem. 2006, 70, 1688. [Google Scholar] [CrossRef] [Green Version]
- Thede, G.L.; Arthur, D.C.; Edwards, R.A.; Buelow, D.R.; Wong, J.L.; Raivio, T.L. Structure of the Periplasmic Stress Response Protein CpxP. J. Bacteriol. 2011, 193, 2149–2157. [Google Scholar] [CrossRef] [Green Version]
- López, C.; Checa, S.K.; Soncini, F.C. CpxR/CpxA Controls scsABCD Transcription To Counteract Copper and Oxidative Stress in Salmonella enterica Serovar Typhimurium. J. Bacteriol. 2018, 200, E00126-18. [Google Scholar] [CrossRef] [PubMed] [Green Version]
- Vogt, S.L.; Evans, A.D.; Guest, R.L.; Raivio, T.L. The Cpx envelope stress response regulates and is regulated by small noncoding RNAs. J. Bacteriol. 2014, 196, 4229–4238. [Google Scholar] [CrossRef] [PubMed] [Green Version]
- Pezza, A.; Pontel, L.B.; López, C.; Soncini, F.C. Compartment and signal-specific codependence in the transcriptional control of Salmonella periplasmic copper homeostasis. Proc. Natl. Acad. Sci. USA 2016, 113, 11573–11578. [Google Scholar] [CrossRef] [PubMed] [Green Version]
- Raivio, T.L.; Price, N.L. The Escherichia coli Cpx Envelope Stress Response Regulates Genes of Diverse Function That Impact Antibiotic Resistance and Membrane Integrity. J. Bacteriol. 2013, 195, 2755–2767. [Google Scholar] [CrossRef] [PubMed] [Green Version]
- Giachino, A.; Waldron, K.J. Copper tolerance in bacteria requires the activation of multiple accessory pathways. Mol. Microbiol. 2020, 114, 377–390. [Google Scholar] [CrossRef]
- Mechaly, A.E.; Diaz, S.S.; Sassoon, N.; Buschiazzo, A.; Betton, J.M.; Alzari, P.M. Structural coupling between autokinase and phosphotransferase reactions in a bacterial histidine kinase. Structure 2017, 25, 939–944. [Google Scholar] [CrossRef] [Green Version]
- Raivio, T.L.; Silhavy, T.J. Transduction of envelope stress in Escherichia coli by the Cpx two-component system. J. Bacteriol. 1997, 179, 7724–7733. [Google Scholar] [CrossRef] [Green Version]
- Mechaly, A.E.; Sassoon, N.; Betton, J.-M.; Alzari, P.M. Segmental Helical Motions and Dynamical Asymmetry Modulate Histidine Kinase Autophosphorylation. PLoS Biol. 2014, 12, e1001776. [Google Scholar] [CrossRef]
- Graves, J.L.J.; Tajkarimi, M.; Cunningham, Q.; Campbell, A.; Nonga, H.; Harrison, S.H.; Barrick, J.E. Rapid evolution of silver nanoparticle resistance in Escherichia coli. Front. Genet. 2015, 6, 42. [Google Scholar] [CrossRef] [Green Version]
- Tajkarimi, M.; Rhinehardt, K.; Thomas, M.; Ewunkem, A.; Campbell, A.; Boyd, S.; Turner, D.; Harrison, S.; Graves, J.L.J. Selection for Ionic- Confers Silver Nanoparticle Resistance in Escherichia coli. JSM Nanotechnol. Nanomed. 2017, 1, 1047. [Google Scholar]
- Graves Joseph, L.J.; Ewunkem, A.J.; Ward, J.; Staley, C.; Thomas, M.D.; Rhinehardt, K.L.; Han, J.; Harrison, S.H. Experimental evolution of gallium resistance in Escherichia coli. Evol. Med. Public Health 2019, 2019, 169. [Google Scholar] [CrossRef] [PubMed] [Green Version]
- Thomas, M.D.; Ewunkem, A.J.; Boyd, S.; Williams, D.K.; Moore, A.; Rhinehardt, K.L.; Van Beveren, E.; Yang, B.; Tapia, A.; Han, J.; et al. Too much of a good thing: Adaption to iron (II) intoxication in Escherichia coli. Evol. Med. Public Health 2021, 9, 53. [Google Scholar] [CrossRef] [PubMed]
- Ewunkem, A.J.; Rodgers, L.; Campbell, D.; Staley, C.; Subedi, K.; Boyd, S.; Graves, J.L., Jr. Experimental Evolution of Magnetite Nanoparticle Resistance in Escherichia coli. Nanomaterials 2021, 11, 790. [Google Scholar] [CrossRef] [PubMed]
- Tanaka, K.J.; Song, S.; Mason, K.; Pinkett, H.W. Selective substrate uptake: The role of ATP-binding cassette (ABC) importers in pathogenesis. Biochim. Biophys. Acta Biomembr. 2018, 1860, 868–877. [Google Scholar] [CrossRef]
- Ma, Z.; Jacobsen, F.E.; Giedroc, D.P. Coordination Chemistry of Bacterial Metal Transport and Sensing. Chem. Rev. 2009, 109, 4644–4681. [Google Scholar] [CrossRef] [Green Version]
- Argüello, J.M.; Raimunda, D.; Padilla-Benavides, T. Mechanisms of copper homeostasis in bacteria. Front. Cell Infect. Microbiol. 2013, 3, 73. [Google Scholar] [CrossRef] [Green Version]
- Nishino, K.; Nikaido, E.; Yamaguchi, A. Regulation of Multidrug Efflux Systems Involved in Multidrug and Metal Resistance of Salmonella enterica Serovar Typhimurium. J. Bacteriol. 2007, 189, 9066–9075. [Google Scholar] [CrossRef] [Green Version]
- Taylor, A.M.; Farrar, C.E.; Jarrett, J.T. 9-Mercaptodethiobiotin is formed as a competent catalytic intermediate by Escherichia coli biotin synthase. Biochemistry 2008, 47, 9309–9317. [Google Scholar] [CrossRef] [Green Version]
- Guttenplan, S.B.; Kearns, D.B. Regulation of flagellar motility during biofilm formation. FEMS Microbiol. Rev. 2013, 37, 849–871. [Google Scholar] [CrossRef] [Green Version]
- Yu, S.; Wang, Y.; Shen, F.; Fang, H.; Yu, Y. Copper-based fungicide copper hydroxide accelerates the evolution of antibiotic resistance via gene mutations in Escherichia coli. Sci. Total Environ. 2022, 815, 152885. [Google Scholar] [CrossRef]
- Glibota, N.; Grande Burgos, M.J.; Gálvez, A. Copper tolerance and antibiotic resistance in soil bacteria from olive tree agricultural fields routinely treated with copper compounds. J. Sci. Food Agric. 2019, 99, 4677–4685. [Google Scholar] [CrossRef] [PubMed]
- Zhang, Y.; Gu, A.Z.; Cen, T.; Li, X.; He, M.; Li, D.; Chen, J. Sub-inhibitory concentrations of heavy metals facilitate the horizontal transfer of plasmid-mediated antibiotic resistance genes in water environment. Environ. Pollut. 2018, 237, 74–82. [Google Scholar] [CrossRef] [PubMed]
- Pal, C.; Bengtsson-Palme, J.; Kristiansson, E.; Larsson, D.G.J. Co-occurrence of resistance genes to antibiotics, biocides and metals reveals novel insights into their co-selection potential. BMC Genom. 2015, 16, 964. [Google Scholar] [CrossRef] [PubMed] [Green Version]
- Amachawadi, R.G.; Scott, H.M.; Alvarado, C.A.; Mainini, R.T.; Vinasco, J.; Drouillard, S.J.; Nagaraja, G.T. Occurrence of the Transferable Copper Resistance Gene tcrB among Fecal Enterococci of U.S. Feedlot Cattle Fed Copper-Supplemented Diets. Appl. Environ. Microbiol. 2013, 79, 4369–4375. [Google Scholar] [CrossRef] [Green Version]
- Michels, H.T.; Keevil, C.W.; Salgado, C.D.; Schmidt, M.G. From Laboratory Research to a Clinical Trial: Copper Alloy Surfaces Kill Bacteria and Reduce Hospital-Acquired Infections. HERD 2015, 9, 64–79. [Google Scholar] [CrossRef]
- Schmidt, M.G.; Fairey, S.E.; Steed, L.L.; Michels, H.T.; Salgado, C.D. Copper Continuously Limits the Concentration of Bacteria Resident on Bed Rails within the Intensive Care Unit. Infect. Control Hosp. Epidemiol. 2013, 34, 530–533. [Google Scholar] [CrossRef] [Green Version]
- O’Gorman, J.; Humphreys, H. Application of copper to prevent and control infection. Where are we now? J. Hosp. Infect. 2012, 81, 217–223. [Google Scholar] [CrossRef]
- Jing, W.; Liu, J.; Wu, S.; Li, X.; Liu, Y. Role of cpxA Mutations in the Resistance to Aminoglycosides and β-Lactams in Salmonella enterica serovar Typhimurium. Front. Microbiol. 2021, 12, 106. [Google Scholar] [CrossRef]
- Deatherage, D.E.; Barrick, J.E. Identification of Mutations in Laboratory-Evolved Microbes from Next-Generation Sequencing Data Using breseq. Eng. Anal. Multicell. Syst. 2014, 1151, 165–188. [Google Scholar] [CrossRef] [Green Version]
- Love, M.I.; Huber, W.; Anders, S. Moderated estimation of fold change and dispersion for RNA-seq data with DESeq2. Genome Biol. 2014, 15, e02804-20. [Google Scholar] [CrossRef] [Green Version]
- Huang, D.W.; Sherman, B.T.; Lempicki, R.A. Bioinformatics enrichment tools: Paths toward the comprehensive functional analysis of large gene lists. Nucleic Acids Res. 2009, 37, 1–13. [Google Scholar] [CrossRef] [PubMed] [Green Version]

| Antimicrobial | Concentration Effect | Population Effect | Interaction (Concentration × Population Effect) |
|---|---|---|---|
| Cu-selected > Controls | |||
| Copper (CuSO4) | F = 7.2 p < 0.001 | F = 20.2 p < 0.001 | NS |
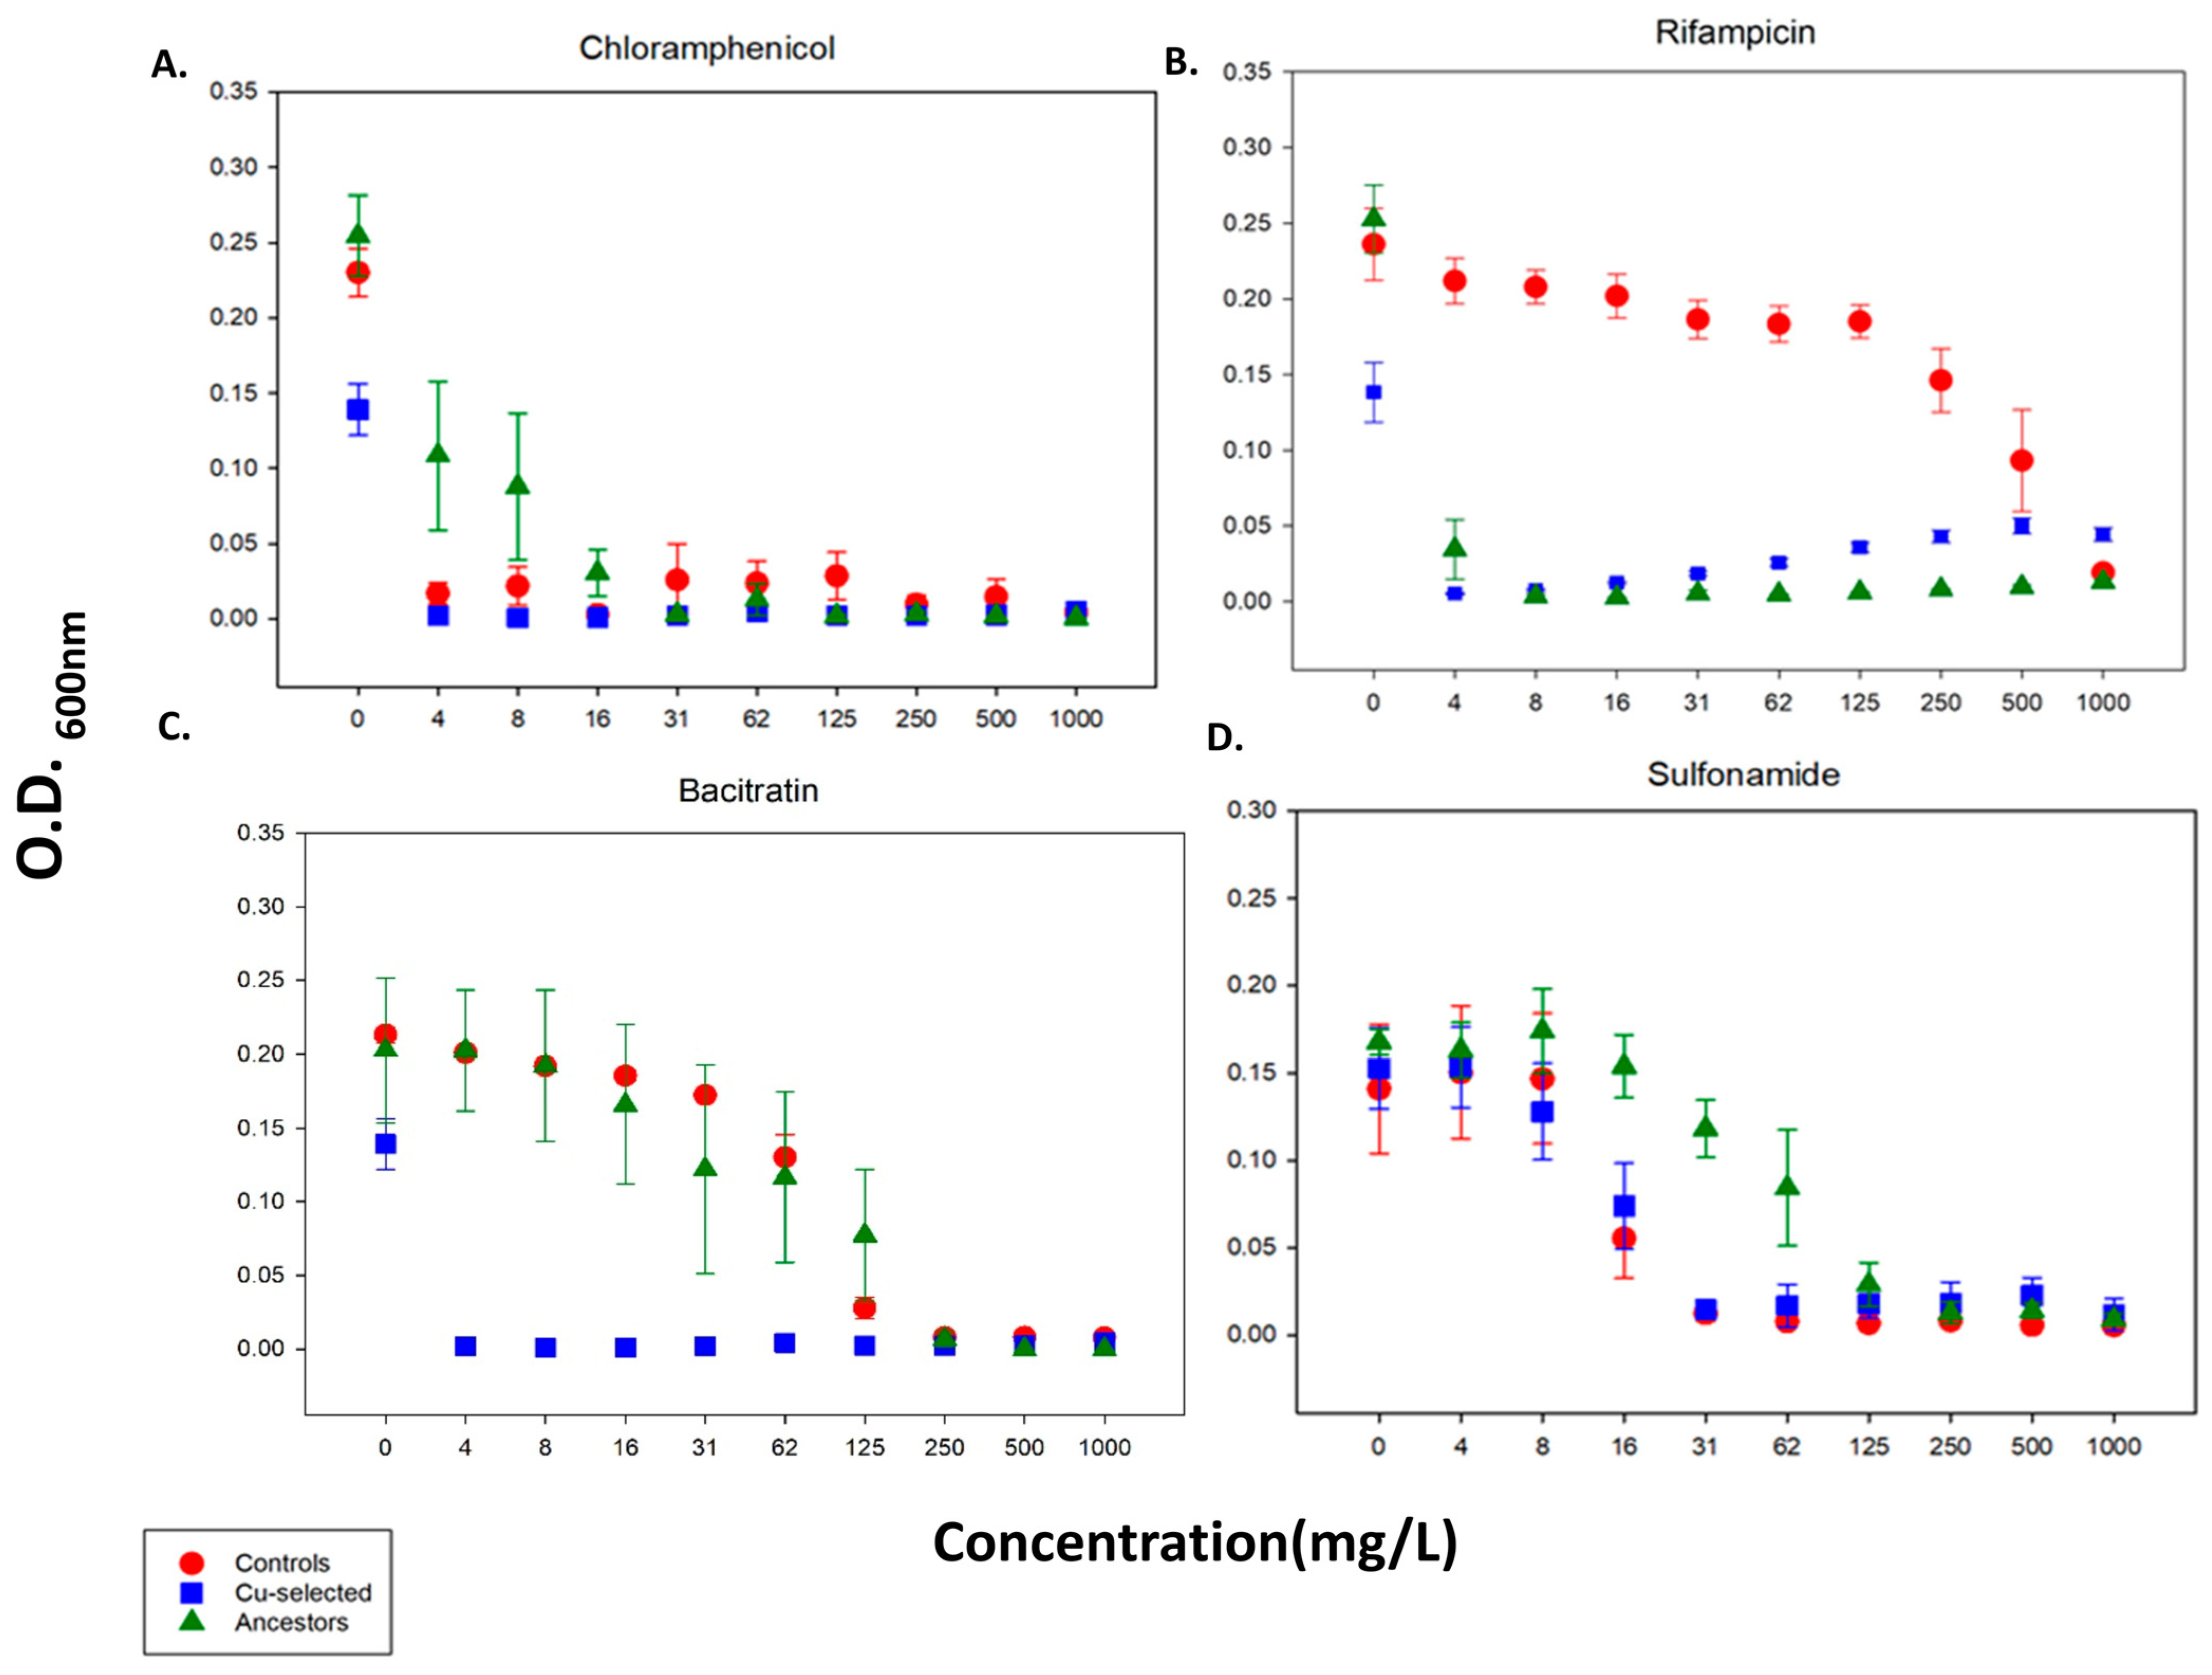
| Chloramphenicol | NS | NS | NS |
| Sulfonamide | F = 16.5 p < 0.001 | NS | NS |
| Cu-selected > Ancestor | |||
| Copper (CuSO4) | F = 6.96 p < 0.001 | F = 20.5 p < 0.001 | NS |
| Rifampicin | NS | F = 21 p < 0.001 | NS |
| Controls > Ancestors | |||
| Copper (CuSO4) | F = 5.52 p < 0.001 | NS | NS |
| Rifampicin | NS | F = 54 p < 0.001 | F = 3 p < 0.05 |
| Controls > Cu-selected | |||
| Chloramphenicol | F = 23.5 p < 0.001 | 19.57 p < 0.001 | NS |
| Bacitracin | F = 21.6 p < 0.001 | NS | F = 2.14 p < 0.05 |
| Magnesium | NS | NS | NS |
| Ancestor > Control | |||
| Chloramphenicol | F = 4.1 p < 0.001 | 3.23 p < 0.005 | NS |
| Bacitracin | F = 9.56 p < 0.001 | NS | NS |
| Sulfonamide | F = 23.5 p < 0.001 | F = 19 p < 0.001 | NS |
| Ancestor > Cu-selected | |||
| Bacitracin | F = 17 p < 0.001 | F = 13 p < 0.001 | NS |
| Rifampicin | F = 16 p < 0.001 | F = 9.1 p < 0.05 | F = 5 p < 0.001 |
| Chloramphenicol | F = 4 p < 0.001 | NS | F = 3 p < 0.05 |
| Sulfonamide | F = 17.4 p < 0.001 | F = 8.5 p < 0.05 | NS |
| Cu-Selected Replicate Populations after 37 Days of Selection to CuSO4 | |||||||||||
|---|---|---|---|---|---|---|---|---|---|---|---|
| Gene Name | Mutations | Cu1 | Cu2 | Cu3 | Cu4 | Cu5 | Cu6 | Cu8 | Cu9 | Cu10 | Gene Descriptions *Breseq and Uniprot |
| cpxA | K194T (AAA → ACA) | 0.16 | 0.00 | 0.00 | 0.00 | 0.00 | 0.00 | 0.00 | 0.00 | 0.00 | sensory histidine kinase in two-component regulatory system with CpxR |
| cpxA | K121R (AAA → AGA) | 0.44 | 0.00 | 0.00 | 0.00 | 0.00 | 0.00 | 0.00 | 0.00 | 0.00 | “ |
| cpxA | V94A (GTG → GCG) | 0.09 | 0.00 | 0.00 | 0.00 | 0.00 | 0.00 | 0.00 | 0.00 | 0.00 | “ |
| cpxA | R93H (CGC → CAC) | 0.13 | 0.00 | 0.00 | 0.00 | 0.00 | 0.00 | 0.00 | 0.00 | 0.00 | “ |
| cpxA | K188Q (AAA → CAA) | 0.00 | 1.00 | 0.00 | 0.00 | 0.00 | 0.00 | 0.00 | 0.00 | 0.00 | “ |
| cpxA | L178R (CTG → CGG) | 0.00 | 0.00 | 0.35 | 0.00 | 0.00 | 0.00 | 0.00 | 0.00 | 0.00 | sensory histidine kinase in two-component regulatory system with CpxR |
| cpxA | A78V (GCG → GTG) | 0.00 | 0.00 | 0.00 | 1.00 | 0.00 | 0.00 | 0.00 | 0.00 | 0.00 | “ |
| cpxR | L20R (CTG → CGG) | 0.00 | 1.00 | 0.00 | 0.00 | 0.00 | 0.00 | 0.00 | 0.00 | 0.00 | response regulator in two-component regulatory system with CpxA |
| cpxR | D104N (GAT → AAT) | 0.00 | 0.00 | 0.00 | 0.00 | 0.23 | 0.00 | 0.00 | 0.00 | 0.00 | “ |
| cpxP | F62L (TTT → CTT) | 0.00 | 0.00 | 0.00 | 0.00 | 0.00 | 0.00 | 0.934 | 0.00 | 0.00 | inhibitor of the cpx response; periplasmic adaptor protein |
| cpxP | Q128* (CAG → TAG) | 0.00 | 0.00 | 0.00 | 0.00 | 0.00 | 0.00 | 0.00 | 0.00 | 0.87 | “ |
| adhE | coding (228/2676 nt) | 0.00 | 0.00 | 0.00 | 0.00 | 0.385 | 0.00 | 0.00 | 0.00 | 0.00 | fused acetaldehyde-CoA dehydrogenase/iron-dependent alcohol dehydrogenase/pyruvate-formate lyase deactivase |
| adhE | coding (143-147/2676 nt) | 0.00 | 0.00 | 0.736 | 0.00 | 0.00 | 0.00 | 0.00 | 0.00 | 0.00 | fused acetaldehyde-CoA dehydrogenase/iron-dependent alcohol dehydrogenase/pyruvate-formate lyase deactivase |
| adhE | V130I (GTT → ATT) | 0.00 | 0.00 | 0.00 | 0.00 | 0.392 | 0.00 | 0.00 | 0.00 | 0.00 | “ |
| rho | coding (229/2676 nt) | 0.00 | 0.00 | 0.00 | 0.00 | 0.41 | 0.00 | 0.00 | 0.00 | 0.00 | transcription termination factor |
| rho | Q128* (CAG → TAG) | 0.00 | 0.00 | 0.00 | 0.00 | 0.00 | 1.00 | 0.00 | 0.00 | 0.00 | transcription termination factor |
| rho | Q128* (CAG → TAG) | 0.00 | 0.00 | 0.00 | 0.00 | 0.00 | 0.00 | 0.00 | 0.81 | 0.00 | transcription termination factor |
| rpoD | H600Q (CAC → CAG) | 0.00 | 0.00 | 0.00 | 0.00 | 0.00 | 0.34 | 0.00 | 0.00 | 0.00 | RNA polymerase, sigma 70 (sigma D) factor |
| rpoD | R109C (CGC → TGC) | 0.00 | 0.00 | 0.00 | 0.00 | 0.00 | 0.50 | 0.00 | 0.00 | 0.00 | “ |
| yddA | P215L (CCA → CTA) | 0.00 | 0.00 | 0.674 | 0.00 | 0.00 | 0.00 | 0.00 | 0.00 | 0.00 | Inner membrane ABC transporter ATP-binding protein |
| fis | Δ1 bp | 0.00 | 0.00 | 0.653 | 0.00 | 0.00 | 0.00 | 0.00 | 0.00 | 0.00 | DNA-binding protein |
| yidL | coding (313-316/894 nt) | 0.00 | 0.00 | 0.00 | 1.00 | 0.00 | 0.00 | 0.00 | 0.00 | 0.00 | uncharacterized HTH-type transcriptional regulator |
| yfcZ /fadL | A262E (GCG → GAG) | 0.00 | 0.00 | 0.00 | 1.00 | 0.00 | 0.00 | 0.00 | 0.00 | 0.00 | family protein/long-chain fatty acid outer membrane transporter |
| Functional Annotation Cluster | Enrichment Score a | Gene Count | |
|---|---|---|---|
| Upregulated | Cluster 1 ABC transporter ATP-binding Nucleotide-binding ATP binding transport | 1.34 | 17 |
| Downregulated | Cluster 1 Bacterial flagellum | 3.51 | 14 |
| Cluster 2 Iron transport Ion transport | 1.37 | 11 | |
| Cluster 3 Cell division Cell cycle | 1.07 | 6 |
Publisher’s Note: MDPI stays neutral with regard to jurisdictional claims in published maps and institutional affiliations. |
© 2022 by the authors. Licensee MDPI, Basel, Switzerland. This article is an open access article distributed under the terms and conditions of the Creative Commons Attribution (CC BY) license (https://creativecommons.org/licenses/by/4.0/).
Share and Cite
Boyd, S.M.; Rhinehardt, K.L.; Ewunkem, A.J.; Harrison, S.H.; Thomas, M.D.; Graves, J.L., Jr. Experimental Evolution of Copper Resistance in Escherichia coli Produces Evolutionary Trade-Offs in the Antibiotics Chloramphenicol, Bacitracin, and Sulfonamide. Antibiotics 2022, 11, 711. https://doi.org/10.3390/antibiotics11060711
Boyd SM, Rhinehardt KL, Ewunkem AJ, Harrison SH, Thomas MD, Graves JL Jr. Experimental Evolution of Copper Resistance in Escherichia coli Produces Evolutionary Trade-Offs in the Antibiotics Chloramphenicol, Bacitracin, and Sulfonamide. Antibiotics. 2022; 11(6):711. https://doi.org/10.3390/antibiotics11060711
Chicago/Turabian StyleBoyd, Sada M., Kristen L. Rhinehardt, Akamu J. Ewunkem, Scott H. Harrison, Misty D. Thomas, and Joseph L. Graves, Jr. 2022. "Experimental Evolution of Copper Resistance in Escherichia coli Produces Evolutionary Trade-Offs in the Antibiotics Chloramphenicol, Bacitracin, and Sulfonamide" Antibiotics 11, no. 6: 711. https://doi.org/10.3390/antibiotics11060711