Article

X-ray Photoelectron Spectroscopy Analysis of Nitrogen-Doped TiO2 Films Prepared by Reactive-Ion-Beam Sputtering with Various NH3/O2 Gas Mixture Ratios

1
Department of Physics, Fu Jen Catholic University, No.510 Zhongzheng Rd., Xinzhuang Dist., New Taipei City 24205, Taiwan
2
Graduate Institute of Applied Science and Engineering, Fu Jen Catholic University, No. 510 Zhongzheng Rd., Xinzhuang Dist., New Taipei City 24205, Taiwan
3
Department of Physics, Bradley University, Peoria, IL 61606, USA
*
Author to whom correspondence should be addressed.
Coatings 2020, 10(1), 47; https://doi.org/10.3390/coatings10010047
Submission received: 4 December 2019 / Revised: 22 December 2019 / Accepted: 2 January 2020 / Published: 4 January 2020
(This article belongs to the Special Issue Coating—A Sustainable Future)

Abstract

:
Nitrogen-doped TiO2 films were prepared by reactive ion-beam sputtering deposition (IBSD) in a mixed atmosphere of NH3 and O2 at a substrate temperature of 400 °C. X-ray photoelectron spectra revealed the presence of six ions, i.e., N3−, N2−, N1−, N+, N2+, and N3+, respectively, in the films. The amorphous films had complex, randomly oriented chemical bonds. The Tauc–Lorentz model was employed to determine the bandgap energy of the amorphous films prepared using different NH3/O2 gas mixing ratios by ellipsometry. In addition, the optical constants of the films were measured. With the increase in the NH3/O2 gas mixture ratio to 3.0, the bandgap of N-doped TiO2 narrowed to ~2.54 eV.

1. Introduction

TiO2 films doped with metal and non-metal species are extremely interesting materials due to their potential for use in heterogeneous photocatalysis. Among all nonmetal-doped TiO2 materials, N-doped TiO2 is the most investigated material due to the fact that its nanomaterials exhibit superior photocatalytic activity with respect to pure TiO2 due to band-gap narrowing under visible-light irradiation. There are three major views with respect to the modification mechanism of N-doped TiO2, namely, bandgap narrowing, impurity energy level, and oxygen vacancies [1]. The N2p state undergoes hybridization with the O2p states in N-doped TiO2 due to their similar energies. Thus, the narrow bandgap can absorb visible light [2]. As N atoms replace O sites of TiO2, isolated impurity levels above the valence band (VB) are formed as shallow acceptor states, with visible-light illumination leading to electron excitation [3,4]. Oxygen-deficient sites that form in the grain boundaries of N-doped TiO2 films are key to the emerging visible-light activity. The N-doped part of an oxygen-deficient site is crucial to block reoxidation [5].
Kusano et al. concluded that N atoms were incorporated into TiO2 lattices as interstitial nitrogen (Ni) and substitutional nitrogen (Ns) [6]. Density functional theory revealed that N preferred to replace Ti atoms rather than O atoms [7]. Asahi et al. made a theoretical comparison between Ns, Ni, and both types of dopants in the anatase TiO2. The dopants give rise to the bonding states below the O2p valence bands and antibonding states deep in the bandgap. However, these states were well screened and hardly interacted with the band states of TiO2 [2]. They also emphasized the importance of substitutional site N doping and clearly observed an increase of photocatalytic activity by increasing the component of N, with an X-ray photoelectron spectroscopy (XPS) peak at 396 eV. Although several theoretical and experimental studies have been conducted on N-doped TiO2, some issues, such as the photocatalytic activity origin of structural defects under visible light and the chemical and electronic states of the constituent elements (Ti, O, N), are still worthy of further study. Generally, photocatalytic activity and chemical and electronic states were investigated by UV-visible absorption experiments and X-ray photoelectron spectroscopy (XPS) analysis, respectively. N-doped TiO2 can be prepared by physical or chemical methods, such as the sol-gel method [6], microwave plasma synthesis [8], sputtering [9], laser pyrolysis [10], plasma-enhanced chemical vapor deposition [11], hydrothermal processing [12], or annealing of TiO2 films in gaseous NH3 [13]. In this study, N-doped TiO2 films were fabricated using different NH3/O2 gas mixture ratios with reactive ion-beam sputtering deposition (IBSD) to achieve nitridization or oxidation of the film at a high substrate temperature of 400 °C under high vacuum conditions of ~10−4 Torr. During the process, the above-mentioned debate was expected to be solved via the reaction control of pure titanium atoms generated by ion-beam sputtering with the nitrogen atoms produced by the ionization of the NH3 ambient gas due to its low bond energy of 3.5 eV [14].

2. Materials and Methods

Figure 1 shows a schematic representation of the experimental procedure.

2.1. Preparation of Coated Surfaces

Optical properties and compositions of titanium oxynitride films prepared by IBSD were investigated. IBSD technology exhibits characteristics of a stable deposition speed, low pollution, and precise composition control [15]. Titanium oxynitride films were deposited onto fused silica substrates at a substrate temperature of 400 °C via sputtering of a metal titanium target (99.99% purity) mounted on a water-cooled copper block at an angle of 45° in the ion-beam direction. A homemade vacuum chamber with a diameter of 40 cm was evacuated using a cryogenic pump at a base pressure of less than 5 × 10⁻⁶ Torr and was arranged in a 3-cm Kaufman ion source with a mass-flow meter to supply Ar working gas. NH3 and O2 gases were fed into the chamber by controlling mass-flow meters. The total pressure was 2 × 10⁻⁴ Torr during the deposition. An energetic ion beam at a voltage of 1000 V and a current of 30 mA cleared the titanium target surface for 15 min before deposition. When opening the substrate shutter, the films were deposited at a rate of 0.02–0.03 nm/s, and their thicknesses were controlled at ~400 nm by using a quartz crystal monitor. During the deposition, the partial NH3 pressure was controlled at 0.5 × 10⁻⁴, 0.75 × 10⁻⁴, 1.0 × 10⁻⁴, and 1.5 × 10⁻⁴ Torr. Then, oxygen gas was simultaneously supplied at NH3 to O2 partial pressure ratios of 0.5, 1, 2, and 3, and the as-deposited films were labeled as TiON-0.5, TiON-1, TiON-2, and TiON-3, respectively.

2.2. Investigation of Samples

Crystalline structures of the films were examined using an X-ray diffractometer (Multiflex, Rigaku Corporation, Tokyo, Japan) with a copper Kλ line at 1.54055 Å. The film morphology was monitored using a Dimension 3100 atomic force microscope (Veeco Instruments Inc., New York, NY, USA). XPS profiles of the films were recorded on a Kratos Axis Ultra DLD spectrometer (Warwick Photoemission Facility, West Midlands, UK). Film transmittance was examined on a Varian Cary 5E spectrometer (Varian, CA, USA) at wavelengths of 200–1000 nm in the visible spectrum. Other optical properties, such as the refractive index (n) and extinction coefficient (k), were measured using an ellipsometer, VASE M44 (J. A. Woollam Co., Inc., Lincoln, NE, USA). The front surfaces of the samples were irradiated by polarization light at four incident angles of 60°, 65°, 70°, and 75°, respectively. The Ψ and Δ values of the films deposited on fused silica substrates in an optical wavelength range from 350–1000 nm were obtained by ellipsometry, which was performed with a focused beam. A model other than the Tauc–Lorentz model was used to fit the ellipsometry data, therefore, it was difficult to determine the bandgap energy caused by the optical absorption of the intraband or defects in the composite amorphous film [16,17,18]. The model expressed the imaginary part of the dielectric function ε2 (= 2nk) at a photon energy E as follows:
ε 2 = A ( E E g ) 2 C E 0 ( E 2 E 0 2 ) 2 + C 2 E 2 ,   as   E   >   E g
ε 2 = 0 ,   as   E     E g
where four parameters are comprised: The prefactor A (the amplitude of the oscillator), the bandgap energy Eg, the broadening parameter C, and the peak in the joint density of states E0. This four-parameter model is typically sufficient to describe the optical functions of the amorphous film by the ellipsometry software of VASE M44 [19].
In this study, the Tauc–Lorentz model was utilized to fit the measured Ψ and Δ values for the four incident angles. The mean squared error (MSE) is a measure of the quality of an estimator, i.e.,
MSE = 1 2 N M i = 1 N [ ( Ψ i mod Ψ i exp σ Ψ , i exp ) 2 + ( Δ i mod Δ i exp σ Δ , i exp ) 2 ]
where i = 1 to N; Ψexp and Δexp represent the experimental data and Ψmod and Δmod represent the fitting data, respectively. N and M represent the number of the measured Ψ–Δ pairs and the fitting parameters, respectively and σΨexp and σexp represent the standard deviations of Ψ and Δ experimental data points, respectively. In the equation, the prefactor comprises 2N due to the inclusion of the two measured values in the calculation for each Ψ–Δ pair [19]. Figure 2 shows a fitting example of the TiON-3 film expressed by Ψ and Δ. The MSE values of the samples were less than 5.
Fourier transform infrared (FTIR) spectroscopy (PE-2000-type PerkinElmer, Waltham, MA, USA) was employed to investigate the hydrogen, hydroxyl, and NH3 bonds in the films. XPS (Axis Ultra DLD system, Kratos Analytical Ltd., Manchester, UK) was employed to examine the chemical bonds and atomic concentrations of the films, which were etched for 30 s before measurement. Binding energies (BEs) of the components obtained from the fitting program applied to the Ti2p, O1s, and N1s XPS spectra were utilized to deduce the oxidation states and chemical bonding environments of the atoms in the films.

3. Results and Discussion

3.1. XRD of N-Doped TiO2 Films

Generally, the titanium dioxide film deposited at a substrate temperature of 400 °C exhibited an anatase structure, with a sharp (101) peak observed at 2θ = 25° in the XRD spectrum [20,21]. Karunagaran et al. also found that the structures of the films deposited at ambient temperature were amorphous, whereas the films annealed at 400 °C and above were crystalline with anatase [22]. However, doped titanium oxide co-sputtered with a metallic aluminum target or a semiconductor silicon target led to reduced polycrystallinity in the structure [23,24]. In this study, the titanium dioxide film was doped with nitride by IBSD under different NH3/O2 gas mixtures. The argon ion beam bombarded the metallic titanium target, and the sputtered titanium atoms exhibited more energy to react with the NH3 and O2 gases on the target surface [21]. Equipped with the kinetic energy of several electron volts, the reaction atoms that accumulated on the fused silica substrate surface [25], where the substrate temperature was 400 °C, enhanced the formation of the deposited titanium oxynitride species. However, although these films were deposited at high substrate temperatures under an NH3/O2 gas mixture ratio of ≥0.5, the XRD spectra indicated that the films were not anatase, but rather amorphous, due to the change in the lattice parameters, bond length, and charges on the Ti atom caused by the complex dopant N ions [4].

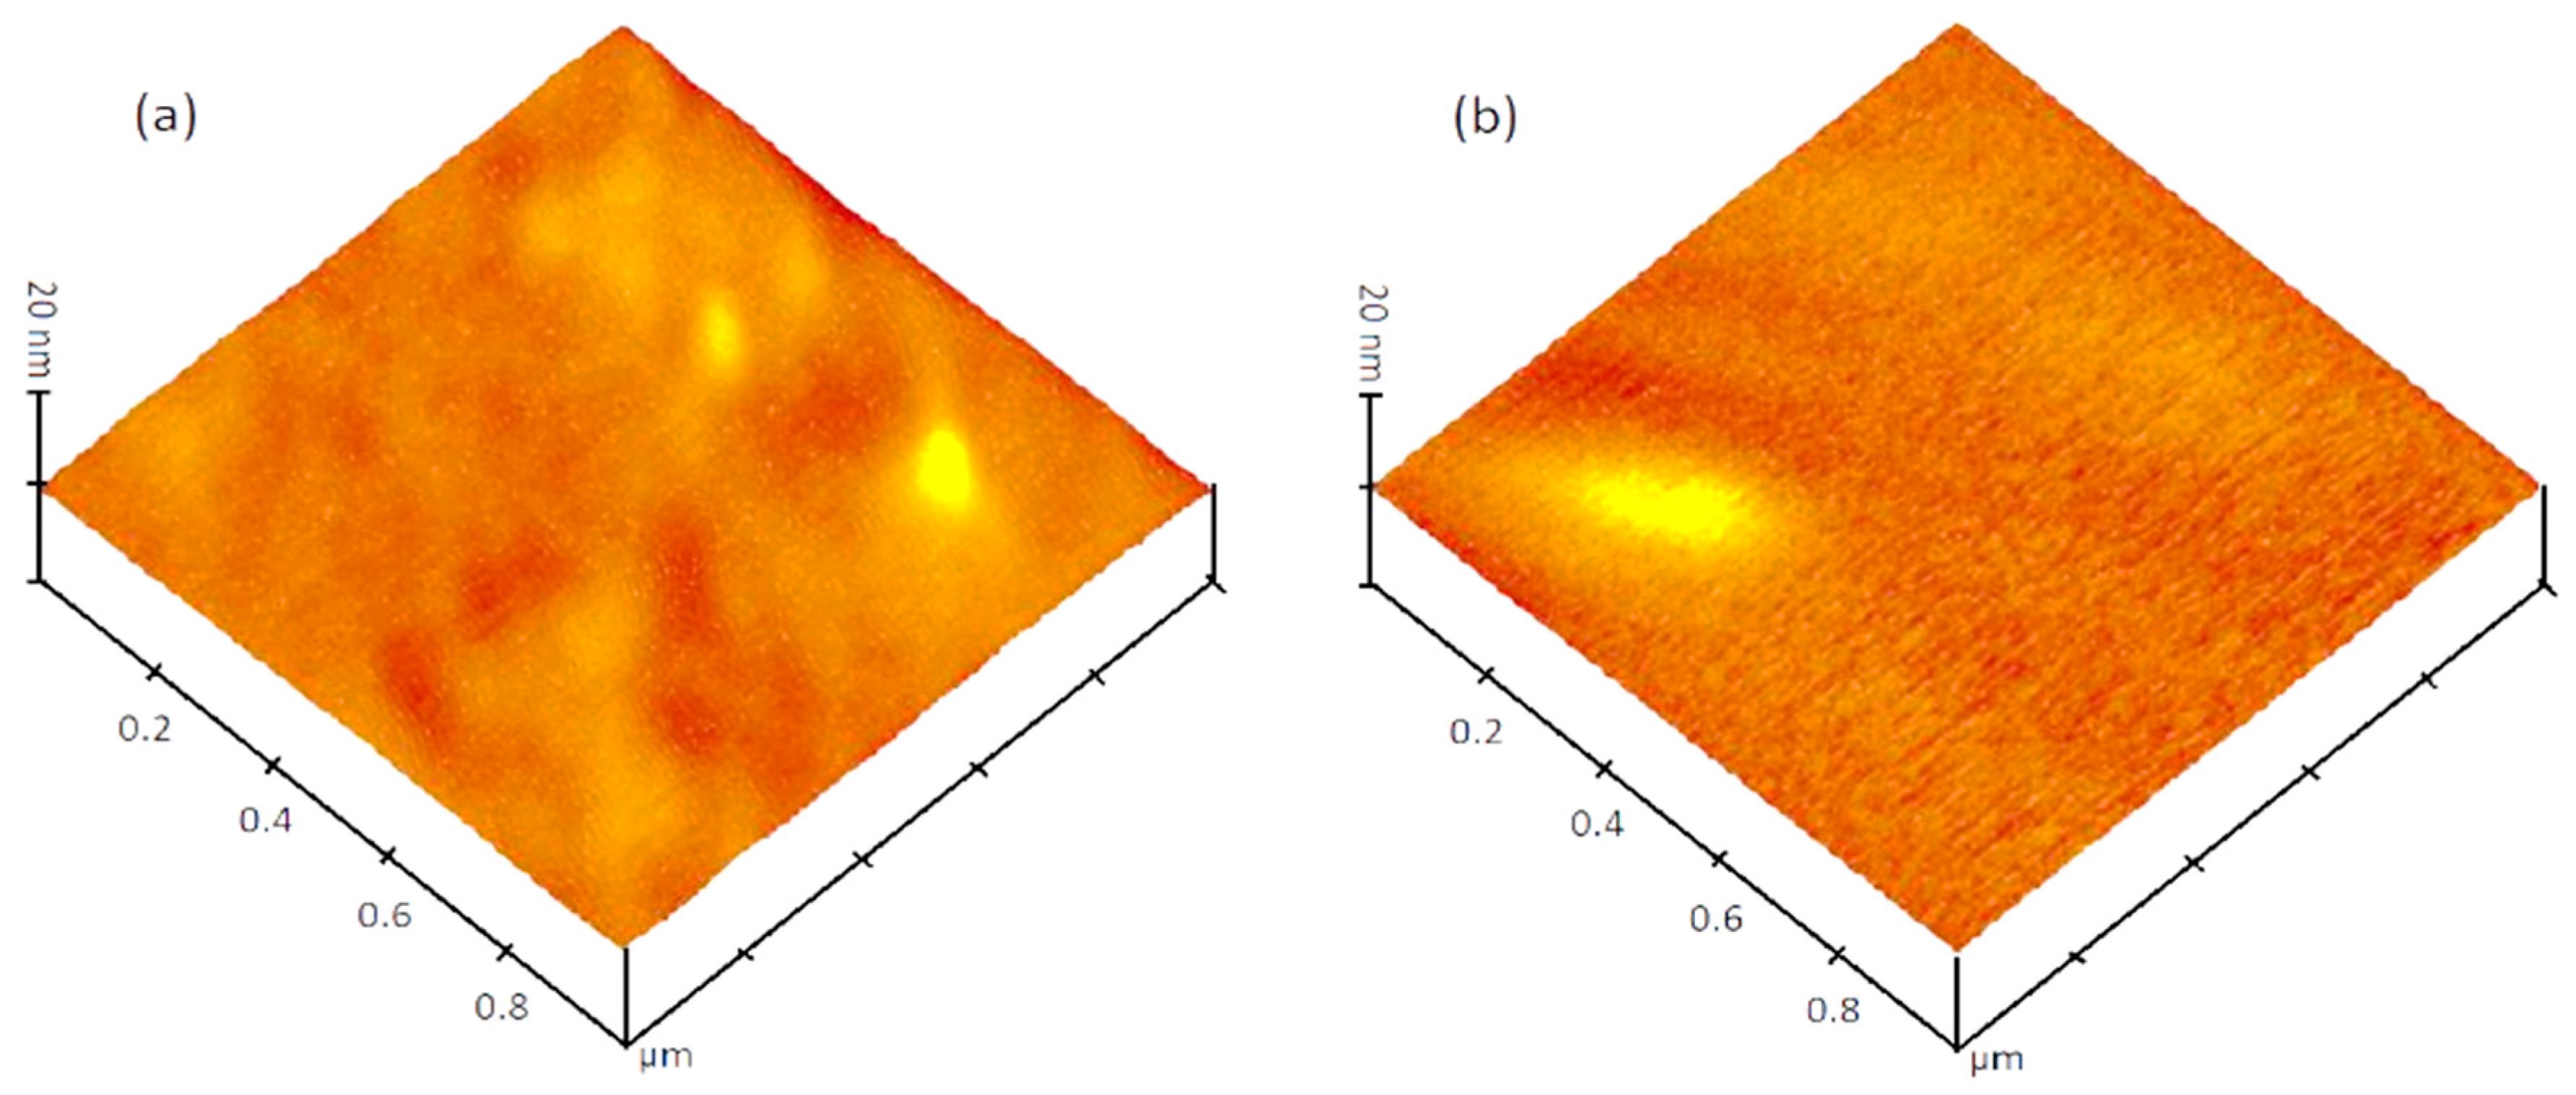
3.2. Surface Morphology of N-Doped TiO2 Films

The surface morphology of amorphous films revealed that the surface roughness was less than that of a pure polycrystalline film [21]. The NH3/O2 gas mixture ratio affected the surface roughness of the film prepared by IBSD. For example, the root mean square (RMS) roughness of the TiON-2 sample was 0.187 nm, a value that was about four times less than TiON-0.5, which was 0.651 nm (Figure 3). Moreover, the atomic radius of the nitrogen atom was greater than that of the oxygen atom. When N atoms were substituted for O atoms in the TiO2 film, the bond length, lattice constant, and atomic volume all changed, leading to the weak anisotropy of anatase. The N-dopants randomly bonded to titanium dioxide in the film, as observed by the XRD inhibition. In the pitch multiplication process for integrated circuit fabrication, the amorphous titanium oxynitride film was capable of depositing a thick, smooth, and amorphous film to form spacers [26].

3.3. FTIR Spectra of N-Doped TiO2 Films

Vietro et al. examined the dissociation of the NH3/O2 gas mixture by radio-frequency (RF) glow discharge. NH3 gas feed produced H atoms, NH radicals, and excited N2; and O2 gas feeds produced O atoms and excited O2 [27]. Therefore, the plasma contained OH radicals, H2O, and NOx species in the IBSD process. Species of NH3 and H2O molecules in the plasma that did not react with the sputtered titanium atoms might have been present in the film, even though the molecules were continuously pumped out of the chamber under high vacuum conditions. Figure 4 shows the FTIR spectra of the films, which were recorded under various NH3/O2 gas mixing ratios.
Characteristics of anatase and rutile corresponding to the Ti–O stretching vibrations [28] were absent in the range from 440 to ~505 cm−1 in their FTIR spectra compared with that of the fused silica substrate. Hence, the as-deposited films were amorphous, as mentioned in Section 3.1. The small peak observed at 800 cm−1 corresponded to the Si–O–Si bending vibration. The peak at 950 cm−1 (O-doped amorphous silicon) to 1075 cm−1 (stoichiometric SiO2) corresponded to the SiOx stretching vibration (0 < x < 2) in the FTIR spectrum of the fused silica substrate. With the decrease in the oxygen concentration, the broad shoulder extended to a high frequency of 1300 cm−1 and merged with the main band [29]. Small peaks were observed at ~1460, 1514, and 1735 cm−1, which were characteristic of C–H, C=C, and C=O bonds of the contaminant, respectively [30,31]. NH3 (1225, 3154, 3195, 3255, and 3393 cm−1) [32], nitrogen-related hydrogen bonds (at 1150–1220, 1300–1350, 1560–1610, and 3150–3393 cm−1) and hydroxyl radical bonds (3200–3400 cm−1) [33] completely disappeared from the FTIR spectra when the substrate temperature was 400 °C during the deposition. The FTIR spectra of the films prepared using various gas ratios were similar to that of the fused silica substrate, except for a low-intensity broad peak at 620 cm−1 for the N-doped TiO2 [28] and a small peak at 1250 cm−1 for the monodentate nitrate [34]. The absorber NO species of the film that were deposited using different NH3/O2 gas mixture ratios are discussed in the following section.

3.4. X-ray Photoelectron Spectra of N-Doped TiO2 Films

The XRD inhibition of the N-doped TiO2 film exhibited a change in the chemical bonds of the film. XPS is one of the most suitable techniques to directly observe the N-derived state from the photoelectron BE.

3.4.1. O1s XPS Spectra

Figure 5 shows the O1s XPS spectra of the N-doped TiO2 films fabricated under various NH3/O2 gas mixing ratios. All of the films exhibited amorphous structures, as mentioned in Section 3.1. Typically, the XPS peaks corresponding to core-level electrons were broad due to the less-localized electron density distribution [35]. The XPS spectra with shoulders were decomposed into two peaks, i.e., bridging oxygen (BO) and high-binding-energy oxygen (HBO). The main peak at 530.1 eV with the largest area corresponded to BO, where the O atom was the dominant species in the Ti–O linkage.
The HBO sub-peak at a higher BE energy of 531.5–532 eV resulted from a lack of electrons in the non-stoichiometric oxygen atom, which corresponded to oxygen in the Ti–O–N or Ti–N–O bonds [36,37,38]. With the increase in the NH3/O2 gas ratio, the peak area and BE decreased, resulting from the increase in the number of electrons provided by the nitrogen atoms. Compared with our previous results regarding co-sputtering of a Ti target with an Al or Si target [22,23], the HBO area of N-doped TiO2 decreased with the increase in the doping material, which was contrary to the increase in HBO areas of Al-doped or Si-doped TiO2, also indicating that nitrogen-dopants provided more electrons to oxygen atoms than the Al and Si dopants during the IBSD process. The oxidation states of the N atoms in N-doped films fabricated by IBSD using different NH3/O2 gas mixtures are discussed again in Section 3.4.3.

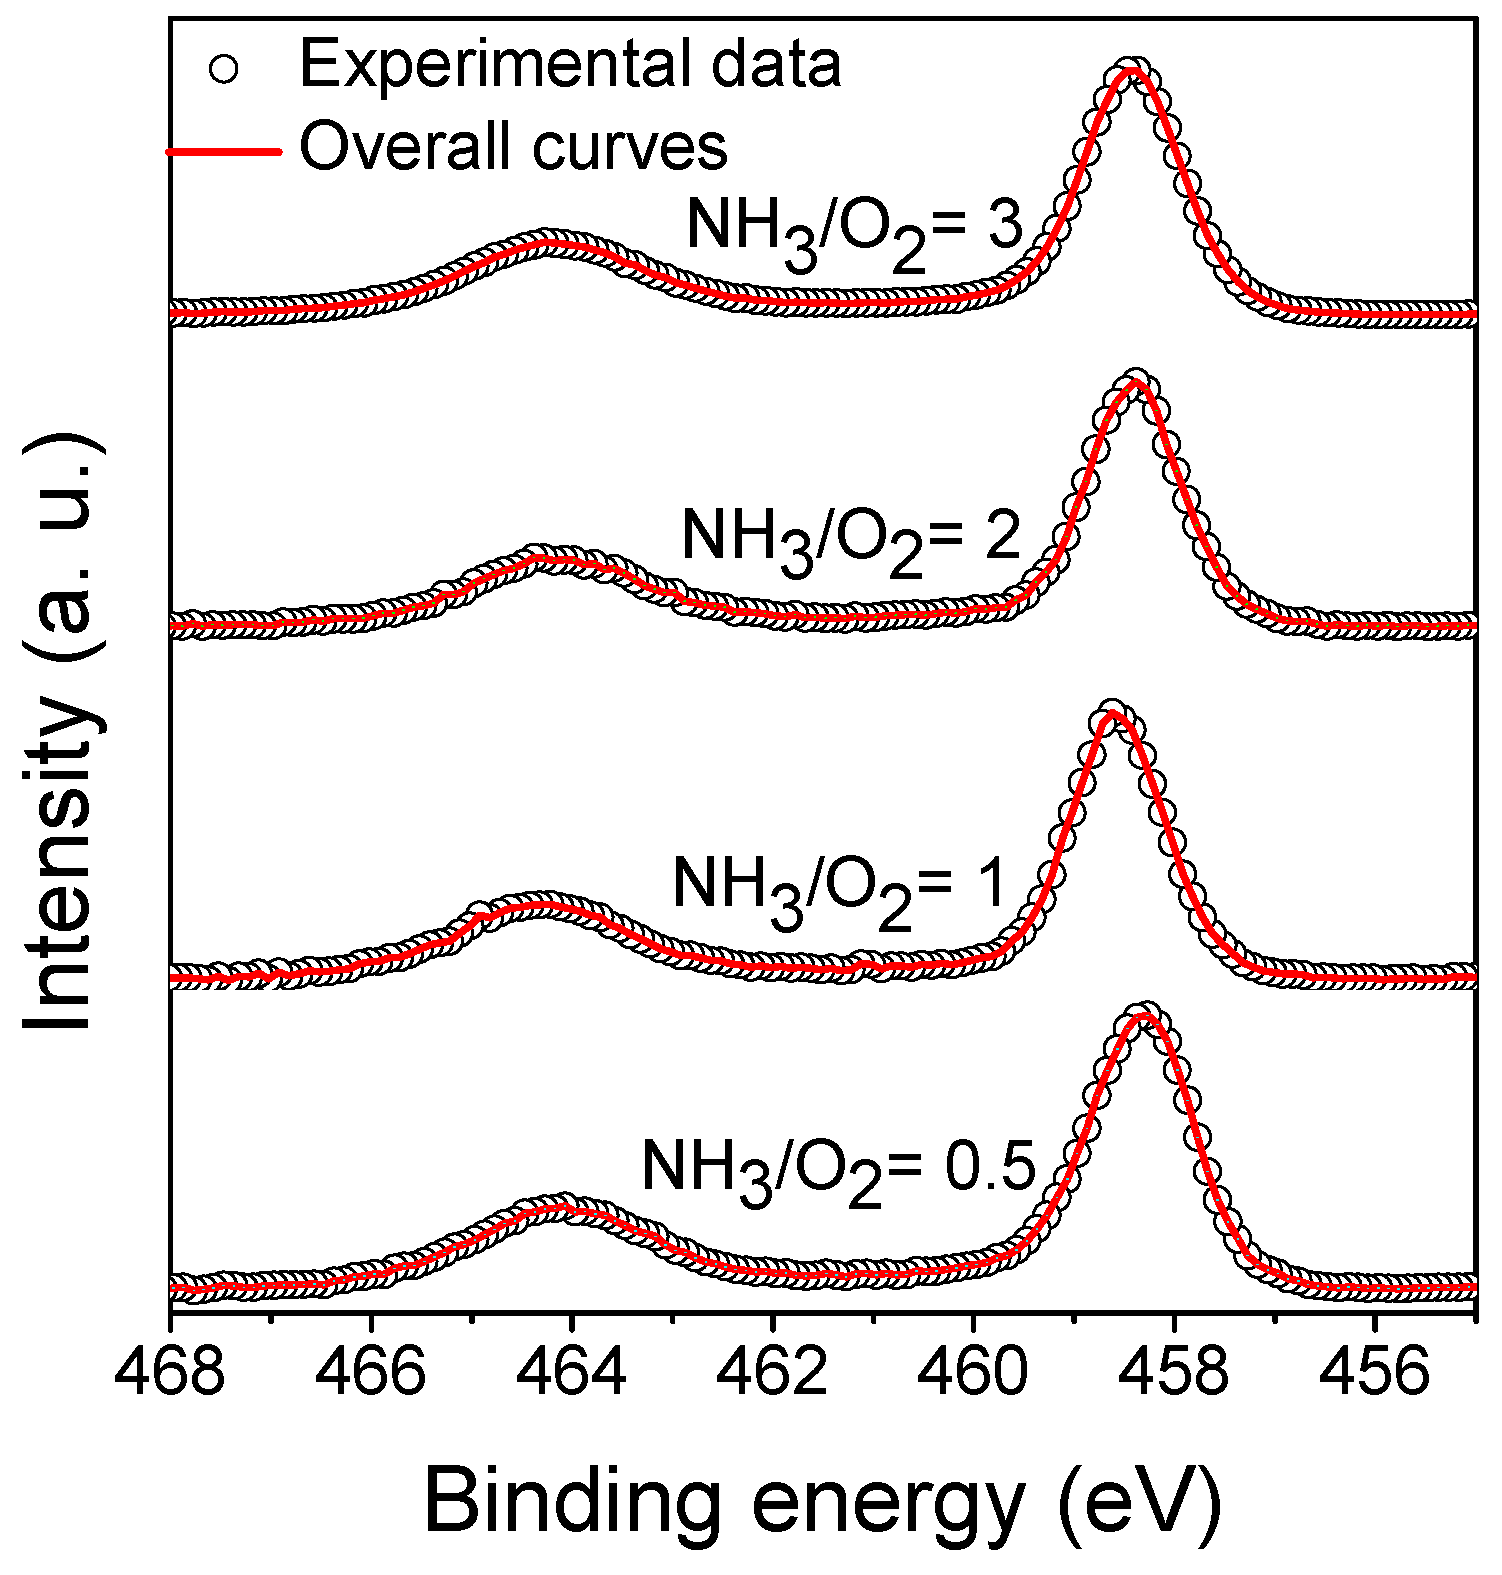
3.4.2. X-ray Photoelectron Spectroscopy of Ti
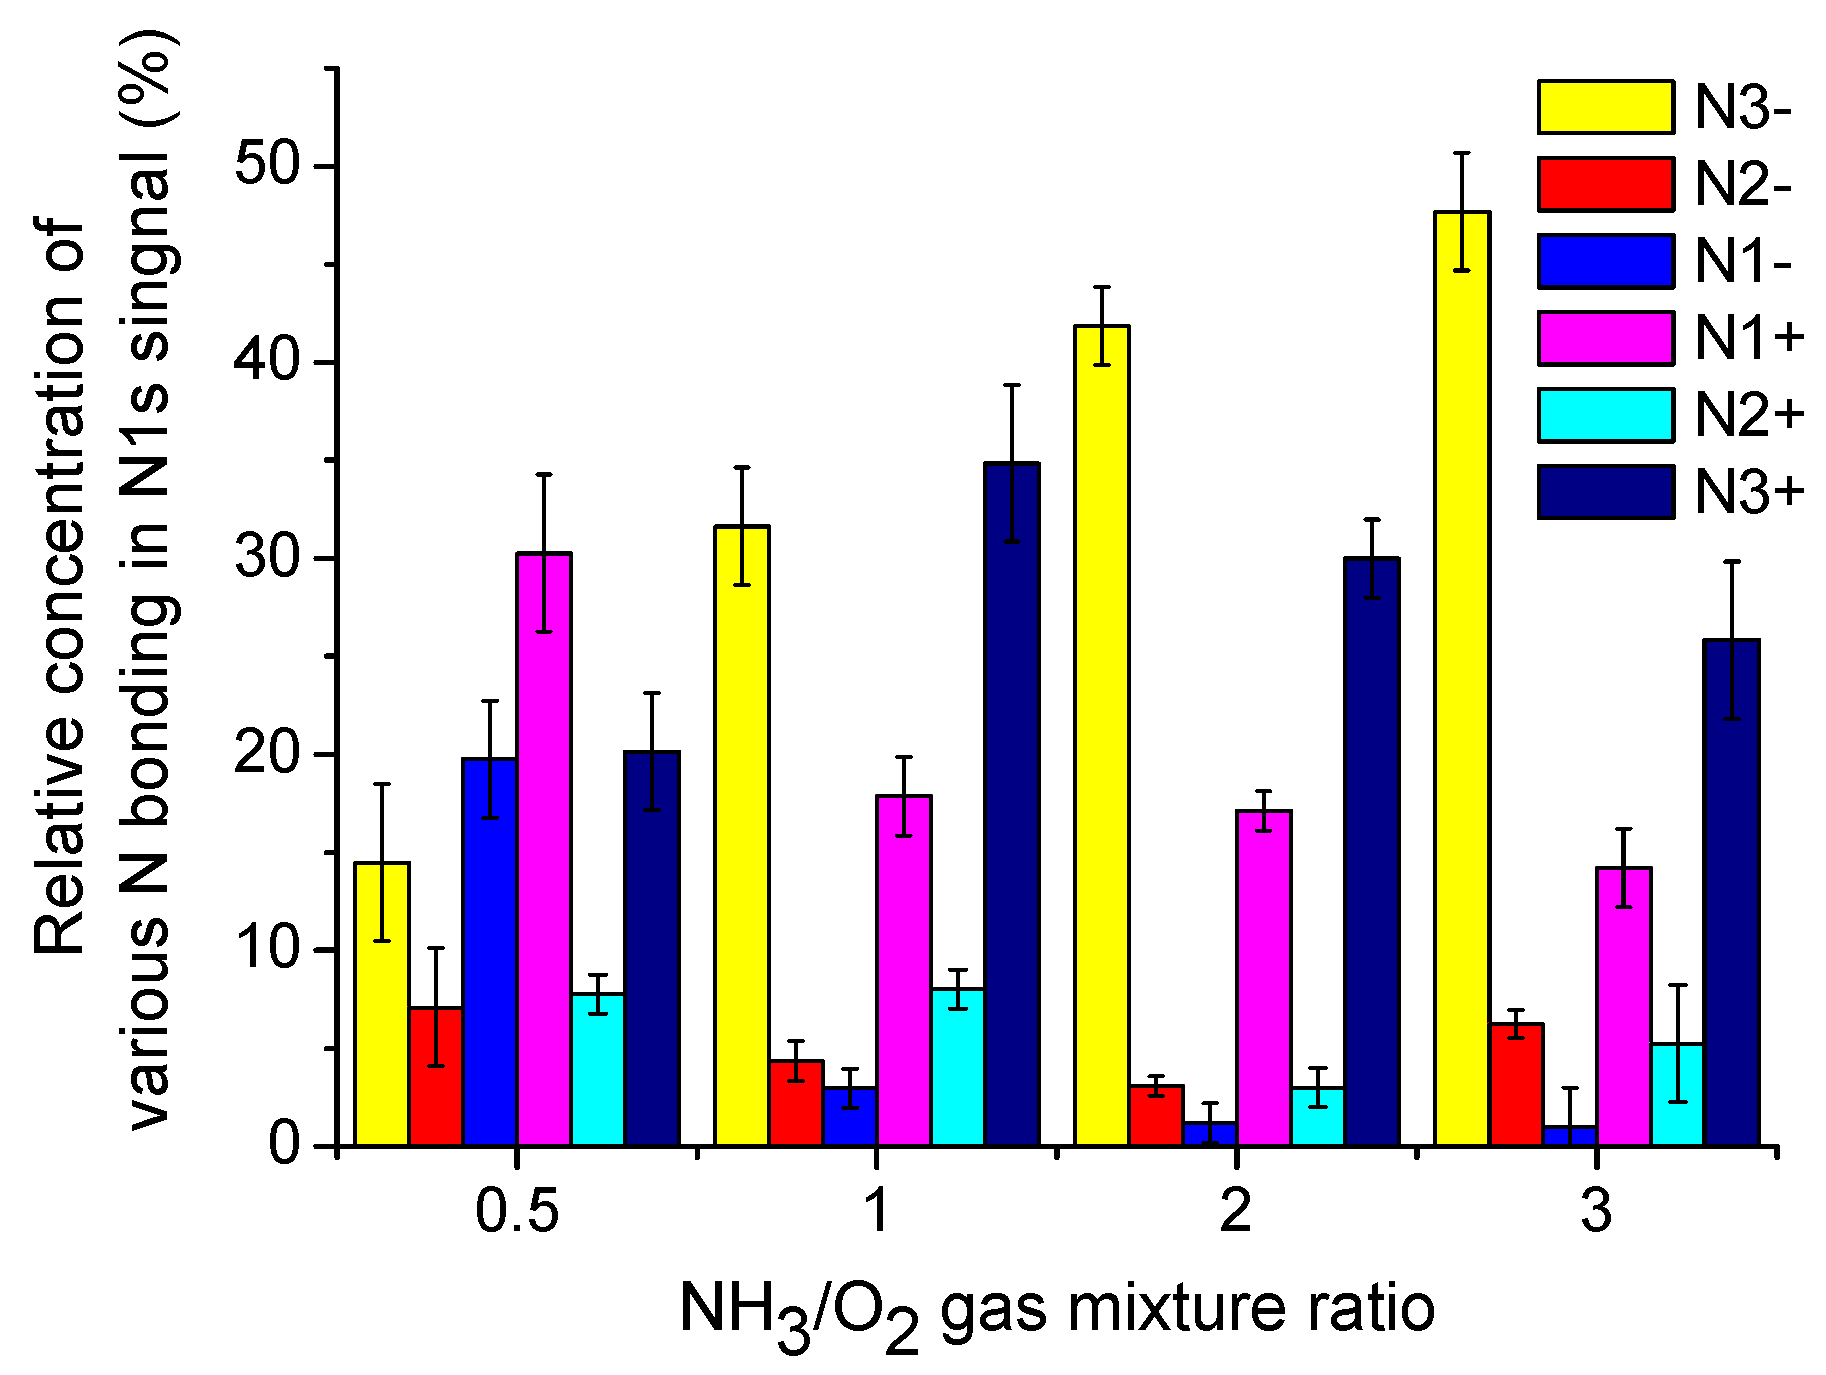
The Ti XPS signal comprised two peaks, i.e., weak Ti2p1/2 and strong Ti2p3/2 (Figure 6). Previous studies reported that each peak was decomposed into three sub-peaks, with components of Ti4+, Ti3+, and Ti2+, respectively: Ti4+ (2p1/2 at ~464.5 eV, 2p3/2 at ~458.9 eV), Ti3+ (2p1/2 at ~462.8 eV, 2p3/2 at ~457.3 eV), and Ti2+ (2p1/2 at ~460.9 eV, 2p3/2 at ~455.6 eV) [23,39]. In this study, however, the Ti2p1/2 and Ti2p3/2 XPS peaks were mainly located at 464.2 and 458.5 eV, respectively. With the change in the NH3/O2 gas mixture ratio, their areas exhibited marginal changes and were composed of lower-energy peaks of Ti3+ and Ti2+, as reported by Jia et al. for N-doped TiO2 nanocrystals [40].
Compared with our previous study involving the co-sputtering of Al or Si, the increases in the amounts of Ti3+ and Ti2+ in the N-doped film were less than those of the Al-doped or Si-doped TiO2 films [22,23]. Moreover, the electronegativity of the nitrogen atom (3.06) was similar to that of the oxygen atom (3.44). That is, the high electronegativity of the nitrogen atom led to the complete oxidation of the titanium atom in the N-doped TiO2 film. Hence, Ti4+ peaks were mainly observed in the XPS spectra of the N-doped TiO2 films. Yu et al. also explained that some Ti2+ reacted with N1− to form Ti3+, followed by a reaction with N1− or N2− to form Ti4+. Therefore, only Ti4+ was present in all of the films deposited using various NH3/O2 gas mixing ratios [36].

3.4.3. XPS of N

The XPS N1s spectra exhibited six fitted sub-peaks (Figure 7). The six sub-peaks were located at average BEs of 395.93, 396.92, 397.84, 399.55, 400.58, and 401.68 eV, corresponding to the oxidation states of N3−, N2−, N1−, N1+, N2+, and N3+ species, respectively (Table 1).
Table 1 summarizes the full width at half maximum (FWHM), BE, and the difference (Δ) between adjacent oxidation states of the six sub-peaks. The Δ values fluctuated by ~1 eV due to the complex nitrogen bonding. The N0 oxidation state is not listed in Table 1 due to the absence of the N0 bond from the films, which was caused by electrical neutralization. Table 2 summarizes the BEs and types of bonds in the six N oxidation states of N3− to N3+. The N3− species at the lowest average BE of 395.9 eV substituted the O2− site in TiO2 and formed the N–Ti chemical bond [2,36,41]. With the increase in the NH3/O2 gas mixing ratio, the relative concentration of the N3− species clearly increased, while those of the N1− and N2− species decreased (Figure 7). The BE of the N3− slightly increased and the FWHM decreased (Table 1) due to the purification of the N3− species. Hence, N–Ti bonds were formed at high NH3/O2 gas mixing ratios. However, the optical absorption increased as the form of the N–Ti bonds changed in the optical spectrum, as explained in Section 3.5.
As summarized in Table 1, the average next lower BE for the N2− species was 396.92 eV due to the decrease in the number of electrons surrounding the N ions, which was formed by Ti–N–Ti–O or Ti–N–Ti–N bonds due to the chemical absorption of nitrogen on the surface or complex bonding of oxynitride (Table 2). The Ti atom was bonded to not only the N atoms but also another atom, leading to an increase in the BE of N2− compared with N3−. With the increase in the gas mixture ratio, the BE increased and the FWHM decreased, similar to the trend observed for the N3− species.
When the oxidation decreased again, the N1− species were located at an average BE of 397.84 eV in Table 1. The intensities of the N1− XPS spectra apparently decayed with the increase in the NH3/O2 gas mixing ratio and disappeared in the TiON-3 sample (Figure 1). The trend of the changing BE was opposite to what was observed for the N2− and N3− species. Nitrogen attracts electrons with difficulty when surrounded by an increased amount of oxygen, therefore, the shift of the outermost nitrogen electrons to their neighbors was affected by an increase in the amount of oxygen.
As the nitrogen ions were surrounded by many oxygen atoms, these ions were transferred from the electron acceptor to the electron donor. Positive nitrogen ions at high BEs transfer electrons to adjacent oxygen atoms more easily than to nitrogen ions due to the lower electronegativity of nitrogen atoms than oxygen atoms. The N chemical states of the positively charged nitrogen species corresponded to N–Ti–O and Ti–O–N–O (Table 2) [50], where nitrogen oxidation states may have corresponded to the higher BE components of N1+, N2+, and N3+ in the films deposited at low NH3/O2 gas mixture ratios.
Figure 8 shows the relative concentrations of various nitrogen bonding states in the total N1s signal. With the increase in the NH3/O2 gas mixing ratio from 0.5 to 1.0, the relative concentrations of the N1− and N1+ oxidization states decreased, while those of N3− and N3+ oxidation states increased. NH3 gas affected the nitridation of N-doped TiO2. Furthermore, with the increase in the NH3/O2 gas mixing ratio, the relative concentration of the N3− species continuously increased. The N3− species slightly served as an electron buffer for the remaining Ti at positive tetravalent ions, the electrons of which attracted the N3− and O2− species. The amount of N3− was affected by the NH3/O2 gas mixing ratio. Moreover, at a low gas mixing ratio, the lack of attracted electrons led to an increase in the number of HBO species and positive N ions. Contrastingly, a large amount of N3− at a high NH3/O2 gas mixture ratio reduced the BE and transmission of the film. These changes in N3+ and N3- concentrations were similar to those observed by Yang et al. [51].

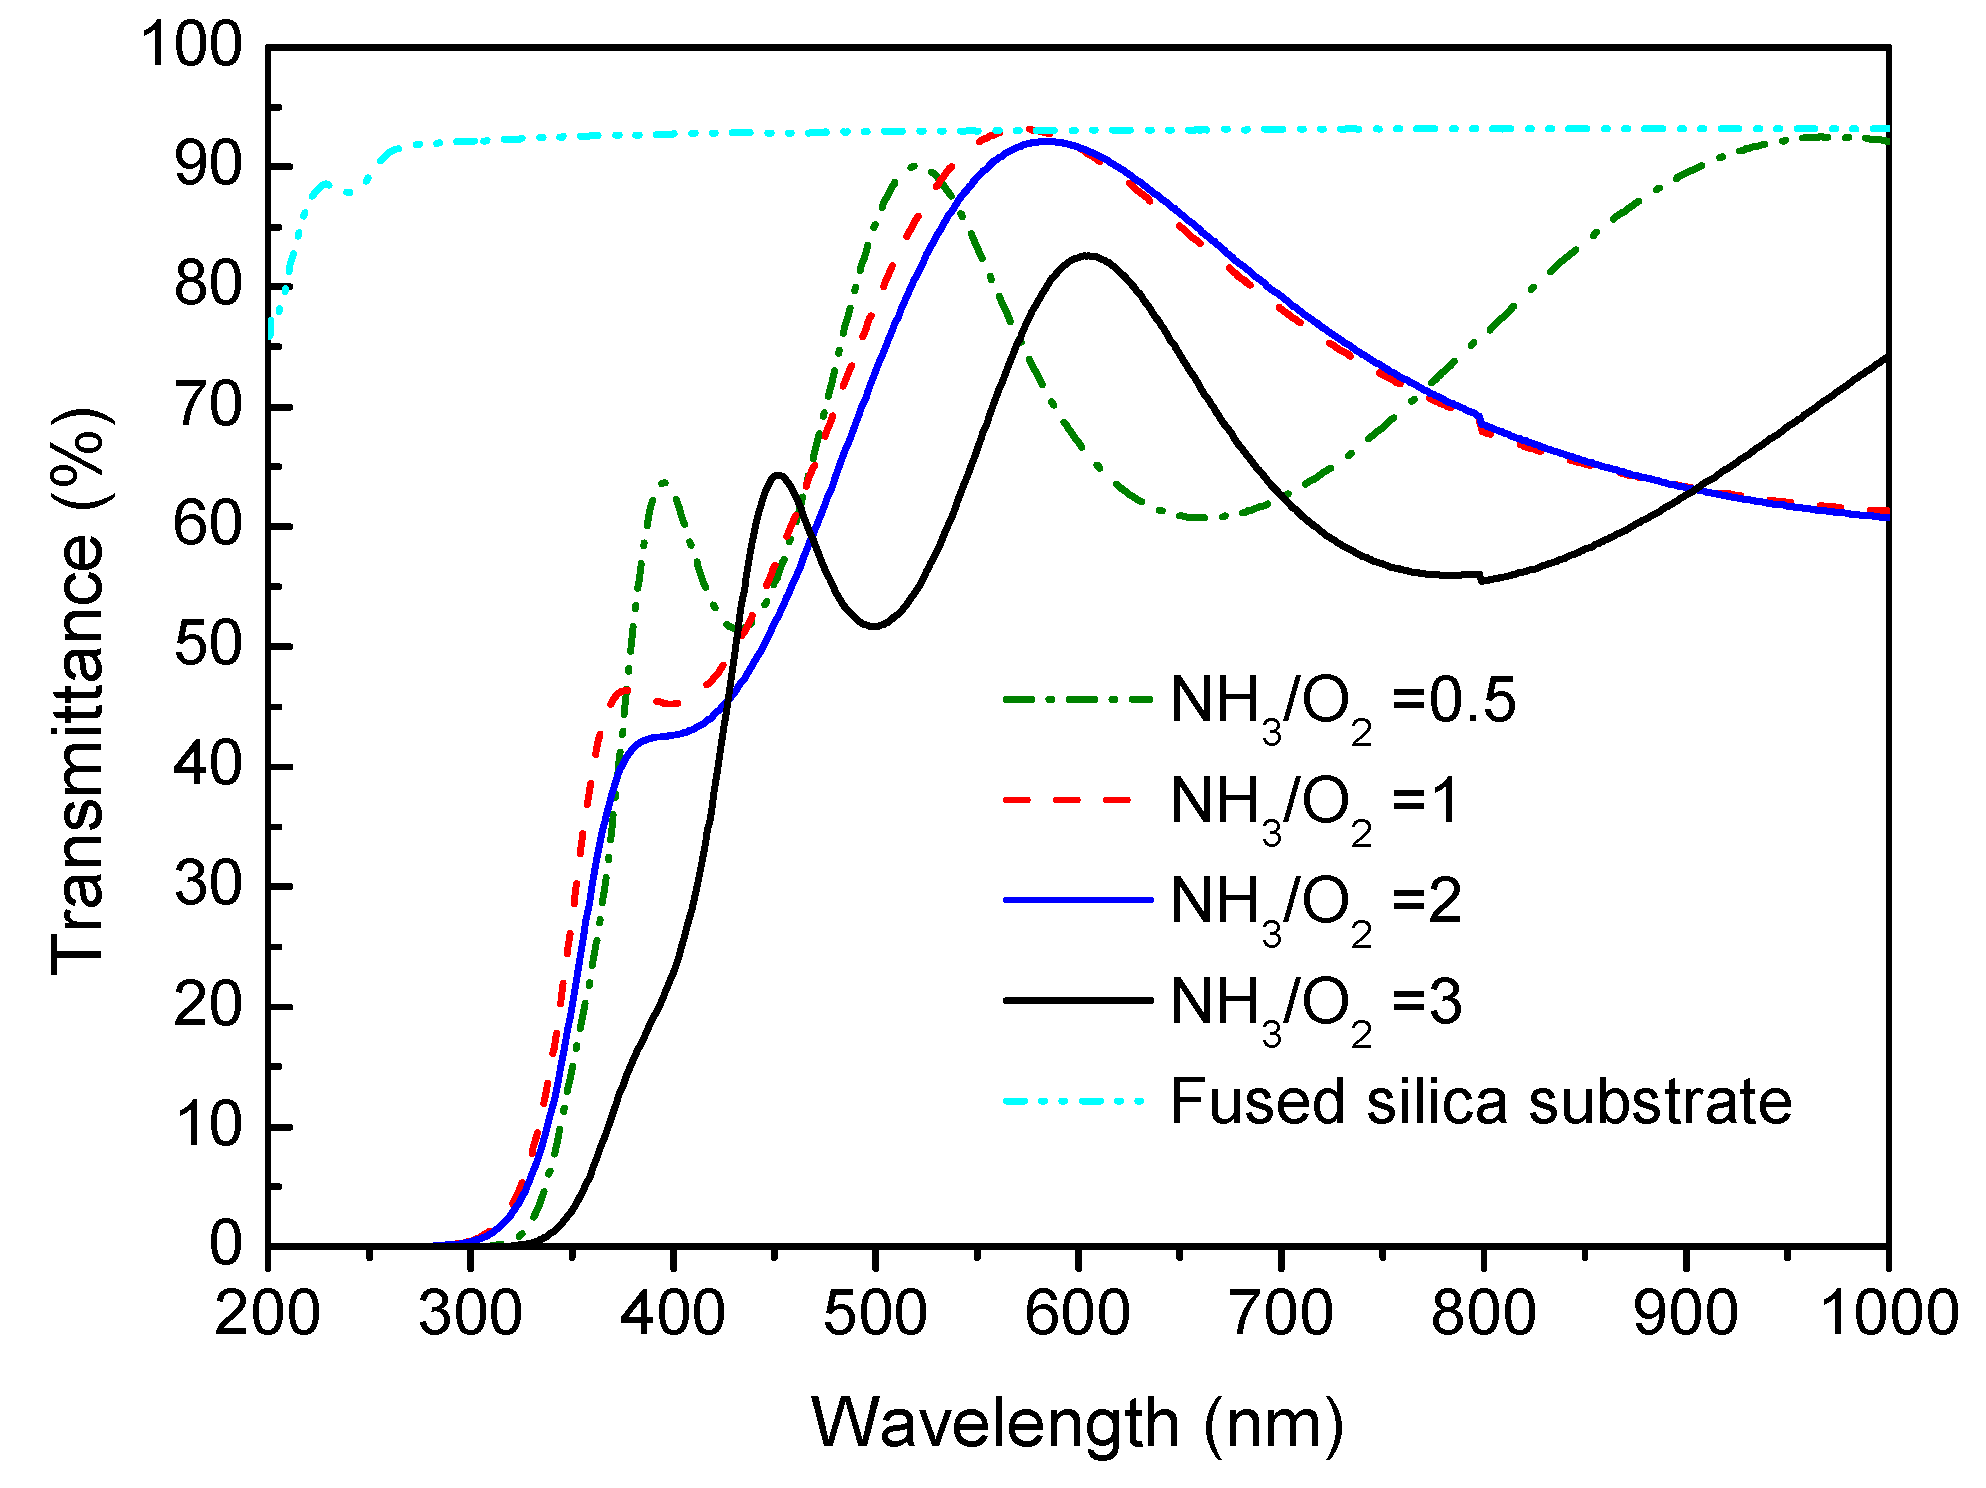
3.5. Optical UV-Vis Transmittance of Nitrogen-Doped TiO2 Films

Figure 9 shows the UV-vis transmission spectra of the fused quartz substrate and as-deposited N-doped TiO2 samples prepared by IBSD. The UV cutoff wavelengths of the N-doped TiO2 films were considerably greater than that of the fused silica substrate. The NH3/O2 mixture gas apparently affected the transmission spectra of the deposited films. With the increase in the NH3/O2 gas mixture ratio, the transmittance decreased from 350 to 500 nm. The transmittance of samples with NH3/O2 ratios of 1 and 2 were higher than those of NH3/O2 ratios of 0.5 and 3 because the thickness of the samples with NH3/O2 ratios of 1 and 2 was larger than the samples with NH3/O2 ratios of 0.5 and 3. Regardless of the fact that the transmittances of the TiON-1 and -2 samples at 600 nm were greater than 80%, the deposited samples exhibited a red-shift due to the amount of the N-dopant, as reported by Mohamed et al. [52]. The more nitrogen and the less oxygen in the vacuum, the more O2− in the Ti–O bond was replaced by N3− in the film. The TiO2−xNx films noticeably absorbed the light at less than 500 nm, which was in good agreement with the theoretical and experimental results studied by Asahi et al. [2]. This observation is further discussed in the next section.

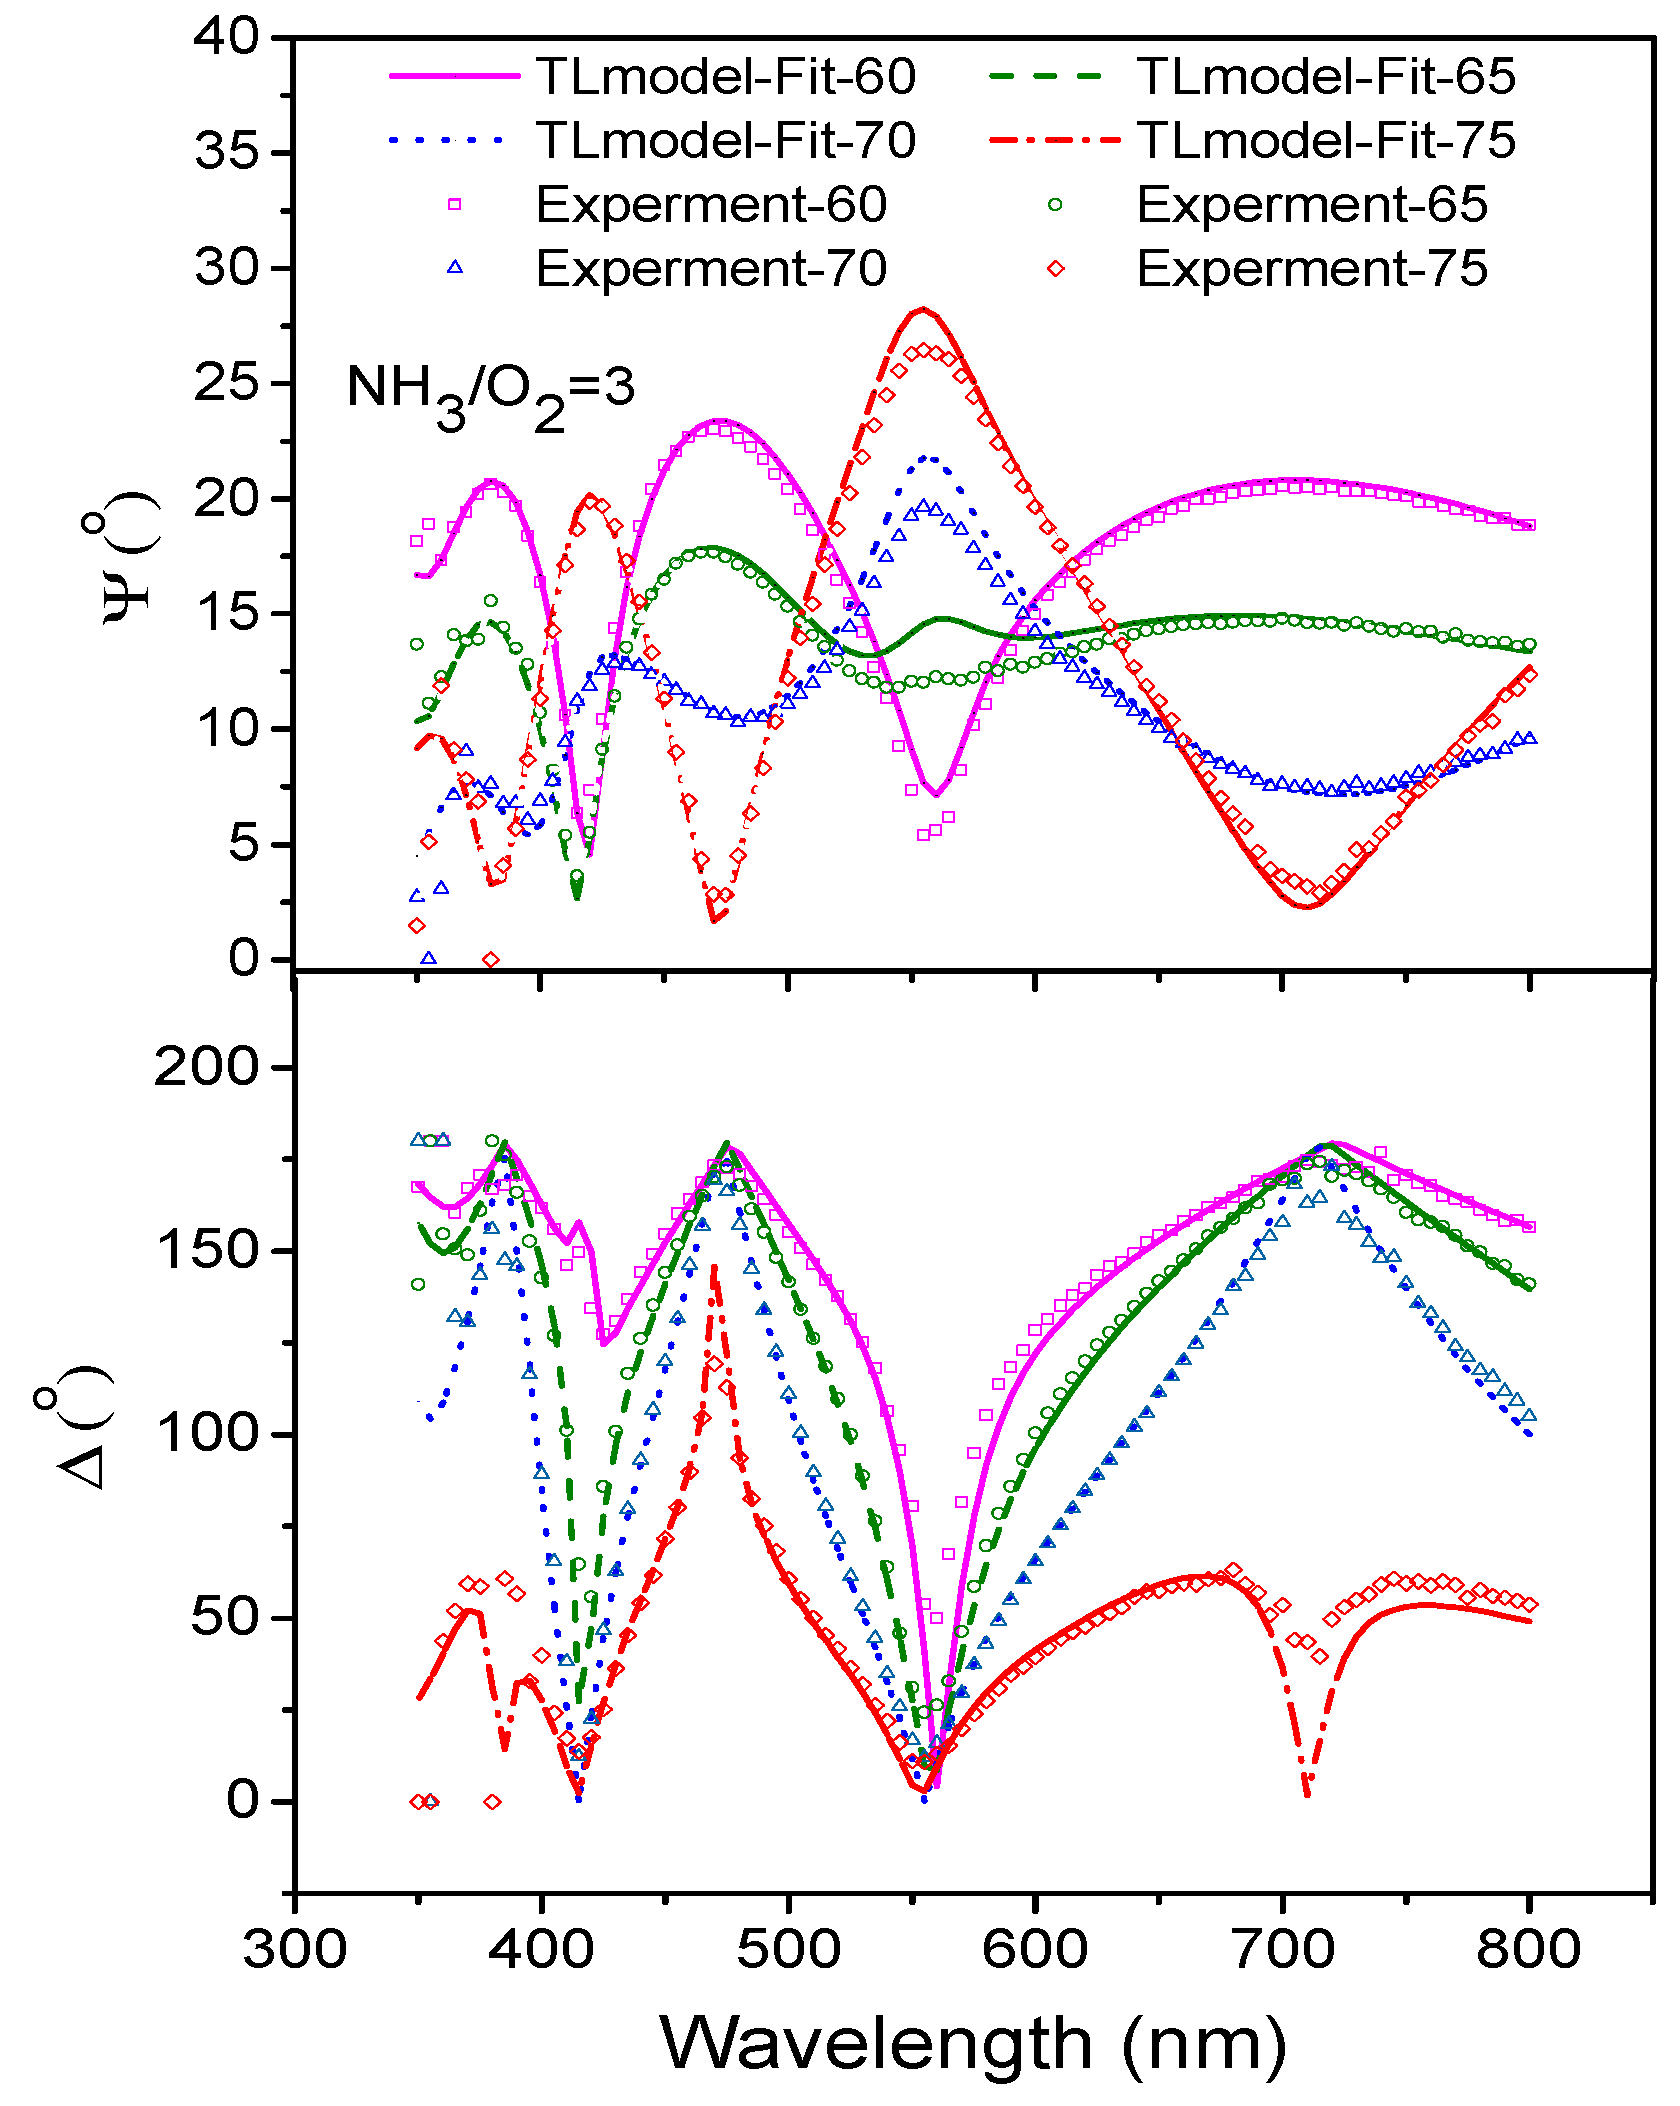
3.6. Ellipsometry of Nitrogen-Doped TiO2 Films

Figure 10 shows the refractive indices and extinction coefficients of the films as a function of the NH3/O2 gas ratio, as investigated by the Tauc–Lorentz model. These films exhibited an optical index of 2.52 ± 0.02 at a wavelength of 550 nm. Moreover, the indices exhibited a large optical dispersion in a short wavelength range of 350–500 nm (Figure 10a). The TiON-0.5, -1, and -2 samples exhibited similar trends of refractive indices as functions of the wavelength.
The films deposited using a high NH3/O2 gas mixing ratio also exhibited high extinction coefficients in the short wavelength range of 350–500 nm (Figure 10b). The starting absorption wavelengths, the extinction coefficients of which were zero, of TiON-0.5, TiON-1, TiON-2, and TiON-3 samples were located at ~400, 425, 450, and 500 nm, respectively, indicating that the optical bandgap energies of the films strongly depended on the NH3/O2 gas mixture ratio.
To increase photocatalytic reaction efficiency, it was crucial to reduce the optical bandgap of the TiO2 film from 3.2 V. The preparation of N-doped TiO2 with visible-light activity was considered to be a promising approach. During doping, two characteristic deep levels were located below the conduction band. The O vacancy state was active as an efficient generation–recombination center. The newly introduced N2p-doped state that was generated directly above the valence band mixed with the O2p valence band and contributed to the narrowing of the bandgap [53]. Asahi et al. predicted the narrowing of the bandgap using first-principle calculations [2]. In this study, when the NH3/O2 gas mixture ratio increased, the bandgaps evaluated by the Tauc–Lorentz model decreased from 3.1 to 2.54 eV (Figure 11). The tuning of the bandgap from 3.1 to 2.54 eV resulted from increases in complex, randomly oriented chemical N bonds and N3− in the films when the NH3/O2 gas mixing ratio was increased, as shown in Figure 8. The bandgap narrowed in the range of 0.1 to 0.56 eV, thus, the fundamental absorption edges of the films extended to the visible-light region.

4. Conclusions

N-doped TiO2 films fabricated by IBSD were prepared under various NH3/O2 gas mixing ratios at a substrate temperature of 400 °C. All of the films were amorphous because of the complex, randomly oriented chemical bonds in the films due to the N-dopant. A significant bandgap-narrowing effect was observed on the optical bandgap down to a visible light range of 2.54 eV by fitting the data measured by ellipsometry using the Tauc–Lorentz model. Six oxidation states, N3−, N2−, N1−, N1+, N2+, and N3+ in the fitting of the N1s spectra, respectively, were evaluated, even though Ti4+ was almost the only species involved in the fitting of the Ti2p spectra. With the increase in the NH3/O2 gas mixing ratio, the bandgap narrowing reduced due to the presence of N3− in the film. Various optical properties resulted from the complex N bonds in the completely oxidized N-doped TiO2 films. This conclusion provides understanding and further development regarding the N-doped TiO2 photocatalysts that are active under visible-light irradiation.

Author Contributions

Conceptualization, J.-C.H. and Y.-H.L.; data curation, Y.-H.L.; formal analysis, P.W.W.; funding acquisition, J.-C.H.; investigation, Y.-H.L.; methodology, J.-C.H.; project administration, J.-C.H.; resources, J.-C.H.; software, J.-C.H. and Y.-H.L.; supervision, J.-C.H.; validation, J.-C.H. and Y.-H.L.; visualization, J.-C.H.; writing—original draft preparation, P.W.W.; writing—review and editing, J.-C.H. All authors have read and agreed to the published version of the manuscript.

Funding

This research was funded by the Ministry of Science and Technology of Taiwan (Nos. MOST 105-2221-E-030-007-MY3 and MOST 106-2112-M-030-001-MY2).

Conflicts of Interest

The authors declare no conflict of interest.

References

  1. Zaleska, A. Doped-TiO2: A review. Recent Pat. Eng. 2008, 2, 157–164. [Google Scholar] [CrossRef]
  2. Asahi, R.; Morikawa, T.; Ohwaki, T.; Aoki, K.; Taga, Y. Visible-light photocatalysis in nitrogen-doped titanium dioxide. Science 2001, 293, 269–271. [Google Scholar] [CrossRef] [PubMed]
  3. Irie, H.; Watanabe, Y.; Hashimoto, K. Nitrogen-concentration dependence on photocatalytic activity of TiO2−xNx powders. J. Phys. Chem. B 2003, 107, 5483–5486. [Google Scholar] [CrossRef]
  4. Zhao, Z.; Liu, Q. Mechanism of higher photocatalytic activity of anatase TiO2 doped with nitrogen under visible-light irradiation from density functional theory calculation. J. Phys. D Appl. Phys. 2007, 41, 025105. [Google Scholar] [CrossRef]
  5. Ihara, T.; Miyoshi, M.; Iriyama, Y.; Matsumoto, O.; Sugihara, S. Visible-light-active titanium oxide photocatalyst realized by an oxygen-deficient structure and by nitrogen doping. Appl. Catal. B Environ. 2003, 42, 403–409. [Google Scholar] [CrossRef]
  6. Kusano, D.; Emori, M.; Sakama, H. Influence of electronic structure on visible light photocatalytic activity of nitrogen-doped TiO2. RSC Adv. 2017, 7, 1887–1898. [Google Scholar] [CrossRef] [Green Version]
  7. Chen, H.; Dawson, J.A. Nature of nitrogen-doped anatase TiO2 and the origin of its visible-light activity. J. Phys. Chem. C 2015, 119, 15890–15895. [Google Scholar] [CrossRef]
  8. Livraghi, S.; Chierotti, M.R.; Giamello, E.; Magnacca, G.; Paganini, M.C.; Cappelletti, G.; Bianchi, C.L. Nitrogen-doped titanium dioxide active in photocatalytic reactions with visible light: A multi-technique characterization of differently prepared materials. J. Phys. Chem. C 2008, 112, 17244–17252. [Google Scholar] [CrossRef]
  9. Sakthivel, S.; Kisch, H. Photocatalytic and photoelectrochemical properties of nitrogen-doped titanium dioxide. Chem. Phys. Chem. 2003, 4, 487–490. [Google Scholar] [CrossRef]
  10. Bouhadoun, S.; Guillard, C.; Sorgues, S.; Hérissan, A.; Colbeau-Justin, C.; Dapozze, F.; Habert, A.; Maurl, V.; Herlin-Boime, N. Laser synthesized TiO2-based nanoparticles and their efficiency in the photocatalytic degradation of linear carboxylic acids. Sci. Technol. Adv. Mater. 2017, 18, 805–815. [Google Scholar] [CrossRef] [Green Version]
  11. Youssef, L.; Leoga, A.J.K.; Roualdes, S.; Bassil, J.; Zakhour, M.; Rouessac, V.; Ayral, A.; Nakhl, M. Optimization of N-doped TiO2 multifunctional thin layers by low frequency PECVD process. J. Eur. Ceram. Soc. 2017, 37, 5289–5303. [Google Scholar] [CrossRef]
  12. Wang, J.; Tafen, D.N.; Lewis, J.P.; Hong, Z.; Manivannan, A.; Zhi, M.; Li, M.; Wu, N. Origin of photocatalytic activity of nitrogen-doped TiO2 nanobelts. J. Am. Chem. Soc. 2009, 131, 12290–12297. [Google Scholar] [CrossRef] [PubMed]
  13. Miyauchi, M.; Ikezawa, A.; Tobimatsu, H.; Irie, H.; Hashimoto, K. Zeta potential and photocatalytic activity of nitrogen doped TiO2 thin films. Phys. Chem. Chem. Phys. 2004, 6, 865–870. [Google Scholar] [CrossRef]
  14. Kerr, J.A. A ready-reference book of chemical and physical data. In CRC Handbook of Chemistry and Physics, 1st ed.; Lide, D.R., Ed.; CRC Press: Florida, FL, USA, 2000. [Google Scholar]
  15. Lee, C.C.; Hsu, J.C.; Wong, D.H. The characteristics of some metallic oxides prepared in high vacuum by ion beam sputtering. Appl. Surf. Sci. 2001, 171, 151–156. [Google Scholar] [CrossRef]
  16. Jellison, G.E., Jr.; Modine, F.A. Parameterization of the optical functions of amorphous materials in the interband region. Appl. Phys. Lett. 1996, 69, 371–373. [Google Scholar] [CrossRef]
  17. Tauc, J.; Grigorovici, R.; Vancu, A. Optical properties and electronic structure of amorphous germanium. Phys. Status Solidi B 1966, 15, 627–637. [Google Scholar] [CrossRef]
  18. Forouhi, A.R.; Bloomer, I. Optical dispersion model relations for amorphous semiconductors and amorphous dielectrics. Phys. Rev. B 1986, 34, 7018–7026. [Google Scholar] [CrossRef]
  19. Woollam, J.A. Guide to Using WVASE 32; J. A. Woollam Co. Inc.: Nebraska, NE, USA, 2002. [Google Scholar]
  20. Selcuk, S.; Selloni, A. Facet-dependent trapping and dynamics of excess electrons at anatase TiO2 surfaces and aqueous interfaces. Nat. Mater. 2016, 15, 1107–1112. [Google Scholar] [CrossRef]
  21. Hsu, J.C.; Lee, C.C. Single- and dual-ion-beam sputter deposition of titanium oxide films. Appl. Opt. 1998, 37, 1171–1176. [Google Scholar] [CrossRef]
  22. Karunagaran, B.; Rajendra Kumar, R.T.; Mangalaraj, D.; Narayandass, S.K.; Mohan Rao, G. Influence of thermal annealing on the composition and structural parameters of DC magnetron sputtered titanium dioxide thin films. Cryst. Res. Technol. 2002, 37, 1285–1292. [Google Scholar] [CrossRef]
  23. Hsu, J.C.; Wang, P.W.; Lee, C.C. X-ray photoelectron spectroscopy study of thin TiO2 films cosputtered with Al. Appl. Opt. 2006, 45, 4303–4309. [Google Scholar] [CrossRef] [PubMed]
  24. Hsu, J.C.; Lee, C.C.; Chen, H.L.; Kuo, C.C.; Wang, P.W. Investigation of thin TiO2 films cosputtered with Si species. Appl. Surf. Sci. 2009, 255, 4852–4858. [Google Scholar] [CrossRef]
  25. Lee, C.C.; Wei, D.T.; Hsu, J.C.; Shen, C.H. Influence of oxygen on some oxide films prepared by ion beam sputter deposition. Thin Solid Films 1996, 290, 88–93. [Google Scholar] [CrossRef]
  26. Pore, V.J.; Okura, S.; Suemori, H. Process for Deposition of Titanium Oxynitride for Use in Integrated Circuit Fabrication. U.S. Patent No. 9,523,148, 20 December 2016. [Google Scholar]
  27. De Vietro, N.; Favia, P.; Fracassi, F.; d’Agostino, R. Acid/Base Gas/Liquid adsorption properties of carbon black modified in NH3/O2 RF glow discharges. Plasma Process. Polym. 2010, 7, 582–587. [Google Scholar] [CrossRef]
  28. Delegan, N.; Daghrir, R.; Drogui, P.; El Khakani, M.A. Bandgap tailoring of in-situ nitrogen-doped TiO2 sputtered films intended for electrophotocatalytic applications under solar light. J. Appl. Phys. 2014, 116, 153510. [Google Scholar] [CrossRef]
  29. Pai, P.G.; Chao, S.S.; Takagi, Y.; Lucovsky, G. Infrared spectroscopic study of SiOx films produced by plasma enhanced chemical vapor deposition. J. Vac. Sci. Technol. A 1986, 4, 689–694. [Google Scholar] [CrossRef] [Green Version]
  30. Shahzadi, P.; Muhammad, A.; Mehmood, F.; Chaudhry, M.Y. Synthesis of 3, 7-dimethyl-2, 6-octadienal acetals from citral extracted from lemon grass, cymbopogon citrates L. J. Antivir. Antiretrovir. 2014, 6, 028–031. [Google Scholar] [CrossRef] [Green Version]
  31. Abdullah, M.F.E.; Madzrol, N.; Sandin, R.W.P. Effects of biodiesel saturation degrees on NOx emission and FTIR spectroscopy. J. Appl. Sci. Proc. Eng. 2016, 3, 1. [Google Scholar] [CrossRef] [Green Version]
  32. Amores, J.G.; Escribano, V.S.; Ramis, G.; Busca, G. An FT-IR study of ammonia adsorption and oxidation over anatase-supported metal oxides. Appl. Catal. B Environ. 1997, 13, 45–58. [Google Scholar] [CrossRef]
  33. Hadjiivanov, K. FTIR study of CO and NH3 co-adsorption on TiO2 (rutile). Appl. Surf. Sci. 1998, 135, 331–338. [Google Scholar] [CrossRef]
  34. Wu, Y.T.; Yu, Y.H.; Nguyen, V.H.; Wu, J.C. In-situ FTIR spectroscopic study of the mechanism of photocatalytic reduction of NO with methane over Pt/TiO2 photocatalysts. Res. Chem. Intermed. 2015, 41, 2153–2164. [Google Scholar] [CrossRef]
  35. Wagner, C.; Riggs, W.; Davis, L.; Moulder, J.; Muilenberg, G. Handbook of X-Ray Photoelectron Spectroscopy; Perkin-Elmer Inc.: Massachusetts, MA, USA, 1979. [Google Scholar]
  36. Yu, Y.P.; Xing, X.J.; Xu, L.M.; Wu, S.X.; Li, S.W. N-derived signals in the X-ray photoelectron spectra of N-doped anatase TiO2. J. Appl. Phys. 2009, 105, 123535. [Google Scholar] [CrossRef]
  37. Zajac, A.T.; Radecka, M.; Zakrzewska, K.; Brudnik, A.; Kusior, E.; Bourgeois, S.; Marco de Lucas, M.C.; Imhoff, L. Structural and electrical properties of magnetron sputtered Ti(ON) thin films: The case of TiN doped in situ with oxygen. J. Power Sources 2009, 194, 93–103. [Google Scholar] [CrossRef]
  38. Lahoz, R.; Espinós, J.P.; Fuente, G.F.D.; Elipe, A.R.G. “in situ” XPS studies of laser induced surface cleaning and nitridation of Ti. Surf. Coat. Tech. 2008, 202, 1486–1492. [Google Scholar] [CrossRef]
  39. Panda, A.B.; Laha, P.; Harish, K.; Sarkar, B.; Chaure, S.V.; Sayyad, W.A.; Jadhav, V.S.; Kulkarni, G.R.; Sasmal, D.; Barhai, P.K.; et al. Study of bactericidal efficiency of magnetron sputtered TiO2 films deposited at varying oxygen partial pressure. Surf. Coat. Tech. 2010, 205.5, 1611–1617. [Google Scholar] [CrossRef]
  40. Jia, T.; Fu, F.; Yu, D.; Cao, J.; Sun, G. Facile synthesis and characterization of N-doped TiO2/C nanocomposites with enhanced visible-light photocatalytic performance. Appl. Surf. Sci. 2018, 430, 438–447. [Google Scholar] [CrossRef]
  41. Cheung, S.H.; Nachimuthu, P.; Joly, A.G.; Engelhard, M.H.; Bowman, M.K.; Chambers, S.A. N incorporation and electronic structure in N-doped TiO2 (110) rutile. Surf. Sci. 2007, 601, 1754. [Google Scholar] [CrossRef]
  42. Gartner, M.; Osiceanu, P.; Anastasescu, M.; Stoica, T.; Stoica, T.F.; Trapalis, C.; Todorova, N.; Lagoyannis, A. Investigation on the nitrogen doping of multilayered, porous TiO2 thin films. Thin Solid Films 2008, 516, 8184–8189. [Google Scholar] [CrossRef]
  43. Yamada, K.; Yamane, H.; Matsushima, S.; Nakamura, H.; Sonoda, T.; Miura, S.; Kumada, K. Photocatalytic activity of TiO2 thin films doped with nitrogen using a cathodic magnetron plasma treatment. Thin Solid Films 2008, 516, 7560–7564. [Google Scholar] [CrossRef]
  44. Balaceanu, M.; Braic, V.; Braic, M.; Kiss, A.; Zoita, C.N.; Vladescu, A.; Drob, P.; Vasilescu, C.; Dudu, D.; Muresanu, O. Structural, mechanical and corrosion properties of TiOxNy/ZrOxNy multilayer coatings. Surf. Coat. Technol. 2008, 202, 2384–2388. [Google Scholar] [CrossRef]
  45. Glaser, A.; Surnev, S.; Netzer, F.P.; Fateh, N.; Fontalvo, G.A.; Mitterer, C. Oxidation of vanadium nitride and titanium nitride coatings. Surf. Sci. 2007, 601, 1153–1159. [Google Scholar] [CrossRef]
  46. Jeyachandran, Y.L.; Venkatachalam, S.; Karunagaran, B.; Narayandass, S.K.; Mangalaraj, D.; Bao, C.Y.; Zhang, C.L. Bacterial adhesion studies on titanium, titanium nitride and modified hydroxyapatite thin films. Mater. Sci. Eng. C 2007, 27, 35–41. [Google Scholar] [CrossRef]
  47. Zhang, M.; Lin, G.; Dong, C.; Kim, K.H. Mechanical and optical properties of composite TiOxNy films prepared by pulsed bias arc ion plating. Curr. Appl. Phys. 2009, 9, S174–S178. [Google Scholar] [CrossRef]
  48. Braic, M.; Balaceanu, M.; Vladescu, A.; Kiss, A.; Braic, V.; Epurescu, G.; Dinescu, G.; Moldovan, A.; Birjega, R.; Dinescu, M. Preparation and characterization of titanium oxy-nitride thin films. Appl. Surf. Sci. 2007, 253, 8210–8214. [Google Scholar] [CrossRef]
  49. Chan, M.H.; Lu, F.H. Preparation of titanium oxynitride thin films by reactive sputtering using air/Ar mixtures. Surf. Coat. Technol. 2008, 203, 614–618. [Google Scholar] [CrossRef]
  50. Peng, F.; Cai, L.; Huang, L.; Yu, H.; Wang, H. Preparation of nitrogen-doped titanium dioxide with visible-light photocatalytic activity using a facile hydrothermal method. J. Phys. Chem. Solids 2008, 69, 1657–1664. [Google Scholar] [CrossRef]
  51. Yang, T.S.; Yang, M.C.; Shiu, C.B.; Chang, W.K.; Wong, M.S. Effect of N2 ion flux on the photocatalysis of nitrogen-doped titanium oxide films by electron-beam evaporation. Appl. Surf. Sci. 2006, 252, 3729–3736. [Google Scholar] [CrossRef]
  52. Mohamed, S.H.; Kappertz, O.; Niemeier, T.; Drese, R.; Wakkad, M.M.; Wuttig, M. Effect of heat treatment on structural, optical and mechanical properties of sputtered TiOxNy films. Thin Solid Films 2004, 468, 48–56. [Google Scholar] [CrossRef]
  53. Nakano, Y.; Morikawa, T.; Ohwaki, T.; Taga, Y. Deep-level optical spectroscopy investigation of N-doped TiO2 films. Appl. Phys. Lett. 2005, 86, 132104. [Google Scholar] [CrossRef]
Figure 1. Schematic representation of the experimental procedure.
Coatings 10 00047 g001
Figure 2. A fitting example of the TiON-3 film expressed by Ψ and Δ with a root mean square (RMS) of 4.8.
Coatings 10 00047 g002
Figure 3. (a) Surface morphology of TiON-0.5 with a surface roughness (RMS) of 0.7 ± 0.1 nm. (b) Surface morphology of TiON-2 with a surface roughness (RMS) of 0.2 ± 0.1 nm.
Coatings 10 00047 g003
Figure 4. Fourier transform infrared (FTIR) spectra of N-doped TiO2 films.
Coatings 10 00047 g004
Figure 5. O1s XPS spectra of the films fabricated under various gas ratios.
Coatings 10 00047 g005
Figure 6. Ti2p XPS spectra of the films fabricated under various gas ratios.
Coatings 10 00047 g006
Figure 7. Original and fitted N1s XPS spectra of titanium oxynitride films prepared using different NH3/O2 ratios. Six components of N3−, N2−, N1−, N1+, N2+, and N3+, respectively, from low to high binding energy (BE), were applied to spectral fitting.
Coatings 10 00047 g007
Figure 8. Changes in the N3−, N2−, N1−, N1+, N2+, and N3+ species as functions of the NH3/O2 gas mixture ratios.
Coatings 10 00047 g008
Figure 9. UV-vis transmittance of the films fabricated under various NH3/O2 gas ratios.
Coatings 10 00047 g009
Figure 10. Refractive indices (a) and extinction coefficients (b) of the films as functions of NH3/O2 gas ratio and wavelength.
Coatings 10 00047 g010
Figure 11. The decrease in the bandgap energy when the NH3/O2 gas mixture ratio increased.
Coatings 10 00047 g011
Table 1. Summary of all of the components of N1s in titanium oxynitride films.
Oxidation StatesN3+N2+N1+N1−N2−N3−
TiON-0.5BE401.6400.5399.5397.9396.9395.9
Δ *1.01.11.11.0
FWHM0.600.60.70.70.70.7
TiON-1BE401.7400.6399.6397.8396.9395.9
Δ1.11.00.91.0
FWHM0.60.60.70.50.60.5
TiON-2BE401.7400.6399.6397.8396.9395.9
Δ1.11.00.91.0
FWHM0.60.60.60.60.50.5
TiON-3BE401.7400.7399.6397.0396.0
Δ1.01.10.9
FWHM0.60.60.60.50.5
Average of BE401.7400.6399.6397.8396.9395.9
* Δ: BE difference between adjacent oxidation states; Unit: eV. Error = 0.5 eV.
Table 2. Binding energies and types of bonding in the six N oxidation states.
Oxidation StatesBinding Energy (eV)BondingReference
N3−396N–Ti, N–Ti–O[2,36,41]
N2−395.4, 395.7, 396, 396.3, 396.6, 396.9, 397.2, 397.5Ti–N–Ti–O, Ti–N–Ti–N, O–Ti–N
(N3− substitute O2−)
[36,37,38,39,40,41,42,43,44,45,46,47,48,49,50]
N1−, N1+398.7, 398.2, 399, 399.1N–O, N–Ti–O, N≡O (in TiOxNy)[37,39,41,42,46,47,50]
N2+, N3+399.8, 400, 400.2, 401.8, 402Ti–O–N–O[41,43,44,47]

