Article

Fabrication and Characterization of Ceramic Coating on Al7075 Alloy by Plasma Electrolytic Oxidation in Molten Salt

by
Alexander Sobolev
,
Tamar Peretz
and
Konstantin Borodianskiy
*
Department of Chemical Engineering, Ariel University, Ariel 40700, Israel
*
Author to whom correspondence should be addressed.
Coatings 2020, 10(10), 993; https://doi.org/10.3390/coatings10100993
Submission received: 6 September 2020 / Revised: 8 October 2020 / Accepted: 14 October 2020 / Published: 17 October 2020
(This article belongs to the Special Issue Plasma Electrolytic Oxidation (PEO) Coatings)

Abstract

:
The fabrication of a ceramic coating on the metallic substrate is usually applied to achieve the improved performance of the material. Plasma electrolytic oxidation (PEO) is one of the most promising methods to reach this performance, mostly wear and corrosion resistance. Traditional PEO is carried out in an aqueous electrolyte. However, the current work showed the fabrication and characterization of a ceramic coating using PEO in molten salt which was used to avoid disadvantages in system heating-up and the formation of undesired elements in the coating. Aluminum 7075 alloy was subjected to the surface treatment using PEO in molten nitrate salt. Various current frequencies were applied in the process. Coating investigations revealed its surface porous structure and the presence of two oxide layers, α-Al2O3 and γ-Al2O3. Microhardness measurements and chemical and phase examinations confirmed these results. Potentiodynamic polarization tests and electrochemical impedance spectroscopy revealed the greater corrosion resistance for the coated alloy. Moreover, the corrosion resistance was increased with the current frequency of the PEO process.

1. Introduction

Modern industry widely applies the fabrication of different ceramic coatings on metallic substrates to obtain required properties. Usually, metals are implemented for wear and corrosion resistance. Nowadays, aluminum is the most promising metal since it is a main candidate to replace iron-based materials in various industrial applications. Among aluminum alloys, Al7075 alloy is a high strength alloy whose mechanical properties are comparable to many types of steel. Al7075 is applicable as aircraft fittings, shafts, and gears, valve components, and many other structural parts. However, this alloy has lower corrosion resistance than other aluminum alloys. This problem may be overcome by the development of a ceramic oxide coating on the Al substrate.
Plasma electrolytic oxidation (PEO) is one of the most promising environmentally friendly surface treatment processes to achieve the ceramic oxide coating on valve metals as Al, Mg, and Ti [1,2,3,4,5,6]. In PEO, a target metal is subjected to a high voltage which leads to the discharge appearance on the surface with the extremely high temperature and pressure that both provide oxidation of the surface. Usually, PEO treatment is conducted in an aqueous electrolyte made of silicates, phosphates, aluminates, fluorides, and other [7,8,9,10,11,12]. Recently, we have showed a possible implementation of the electrolyte of the molten salt in the PEO process [13,14,15]. Results of these works evaluated the formation of a denser coating free of any contaminants in comparison with a traditional method, which is usually obtained in an aqueous electrolyte.
Several works on the application of the PEO process on Al7075 alloy were recently published. Wang et al. investigated the corrosion resistance of scratched oxide and reported that scratches have reduced impedance and increased the corrosion current density [16]. Bahramian et al. reported the effect of TiO2 nanoparticles addition to a PEO silicate-based electrolyte in Al7075 alloy [17]. The authors showed that the fabricated composite coating demonstrated improved corrosion resistance and mechanical properties due to the lower porosity content. Arunnellaiappan et al. investigated the effect of Al2O3 and ZrO2 additions to an aqueous electrolyte on the coating formation. The authors showed improvement of a corrosion resistance of the fabricated coated alloy obtained in electrolyte with nanoparticles [18].
The aim of the current work is to fabricate and to characterize a newly formed oxide coating on Al7075 alloy using PEO in molten salt. The influence of the process current frequency on the structure and properties of the formed coatings was also analyzed. Morphology examinations and chemical composition were investigated by scanning electron microscopy (SEM) and energy dispersive spectroscopy (EDS). Phase composition was determined by X-ray diffraction (XRD) analysis. The corrosion resistance of the obtained coatings was studied by potentiodynamic polarization tests and electrochemical impedance spectroscopy (EIS).

2. Materials and Methods

Aluminum 7075-6 temper alloy (Scope Metal Group Ltd., Bnei Ayish, Israel) with chemical composition listed in Table 1 was used as the substrate for the PEO treatment. Investigated samples were of rectangle shape with 45 × 25 mm2 and the thickness of 2 mm. Prior to PEO treatment, all specimens were ground using 400–1200 grit sandpapers, followed by ethanol cleaning and rinsing with distilled water.
The PEO treatment was carried out in a cylindrical furnace at a constant temperature of 280 °C in molten salt electrolyte with a eutectic composition of KNO3–NaNO3 (Sigma-Aldrich, St. Louis, MO, USA). The electrolyte was charged in a nickel crucible, which also acted as a counter electrode, while the Al alloy sample acted as a working electrode. The process was controlled by a MP2-AS 35 power supply (Magpulls, Sinzheim, Germany) with the electrical parameters: Imax = 5 A, Umax = 1000 V. Electrical parameters were pulsed at a frequency of 200 Hz (Sam-200 Hz), 300 Hz (Sam-300 Hz), and 400 Hz (Sam-400 Hz) with a duty cycle of 50% and recorded by Scope Meter 199C (Fluke, Everett, WA, USA). The process time was 30 min. After the treatment, all samples were washed with distilled water and dried in warm air.
The surface and the cross-section morphologies of the fabricated coatings were studied with SEM (MAIA3 TESCAN, Brno, Czech Republic). The elemental composition of the coatings was analyzed by EDS X-MaxN (Oxford Instruments plc, Abingdon, UK) detector in conjunction with the mentioned SEM. The phase analysis was determined by the X’Pert Pro diffractometer (PANalytical B.V., Almelo, the Netherlands) with Cu α radiation (λ = 1.542 Å) at the grazing incidence angle of 3° with a 2θ range from 20° to 90° (step size of 0.03°) at 40 kV and 40 mA.
The microhardness measurements were performed on cross-sections of the obtained coatings using a micro-hardness tester, Buehler Micrometer 2103 (Lake Bluff, IL, USA) under a load of 10 g. The average of five measurements for each oxide layer was presented in the results.
The corrosion resistance examination performed with a PARSTAT 4000A potentiostat (Princeton Applied Research, Oak Ridge, TN, USA). The potentiodynamic polarization test evaluated in 3.5 wt.% NaCl (Sigma-Aldrich, St. Louis, MO, USA) solution at pH 7 using a three-electrode cell configuration wherein a Pt acted as a counter electrode and a saturated Ag/AgCl (Metrohm Autolab B.V., Utrecht, The Netherlands) acted as a reference electrode. The polarization resistance was detected at the range of ± 250 mV with the respect to the recorded corrosion potential at a scan rate of 0.1 mV/s. Prior to the test, all samples were kept in the solution of 3.5 wt.% NaCl for 30 min to reach the open-circuit potential (OCP) of a working electrode. The EIS measurements were performed at the OCP over a frequency range of 100 kHz to 1 mHz using a 5mV amplitude of sinusoidal voltage. The analysis of obtained spectra was made with the EC–Lab® software V11.10 fitting program.

3. Results and Discussion
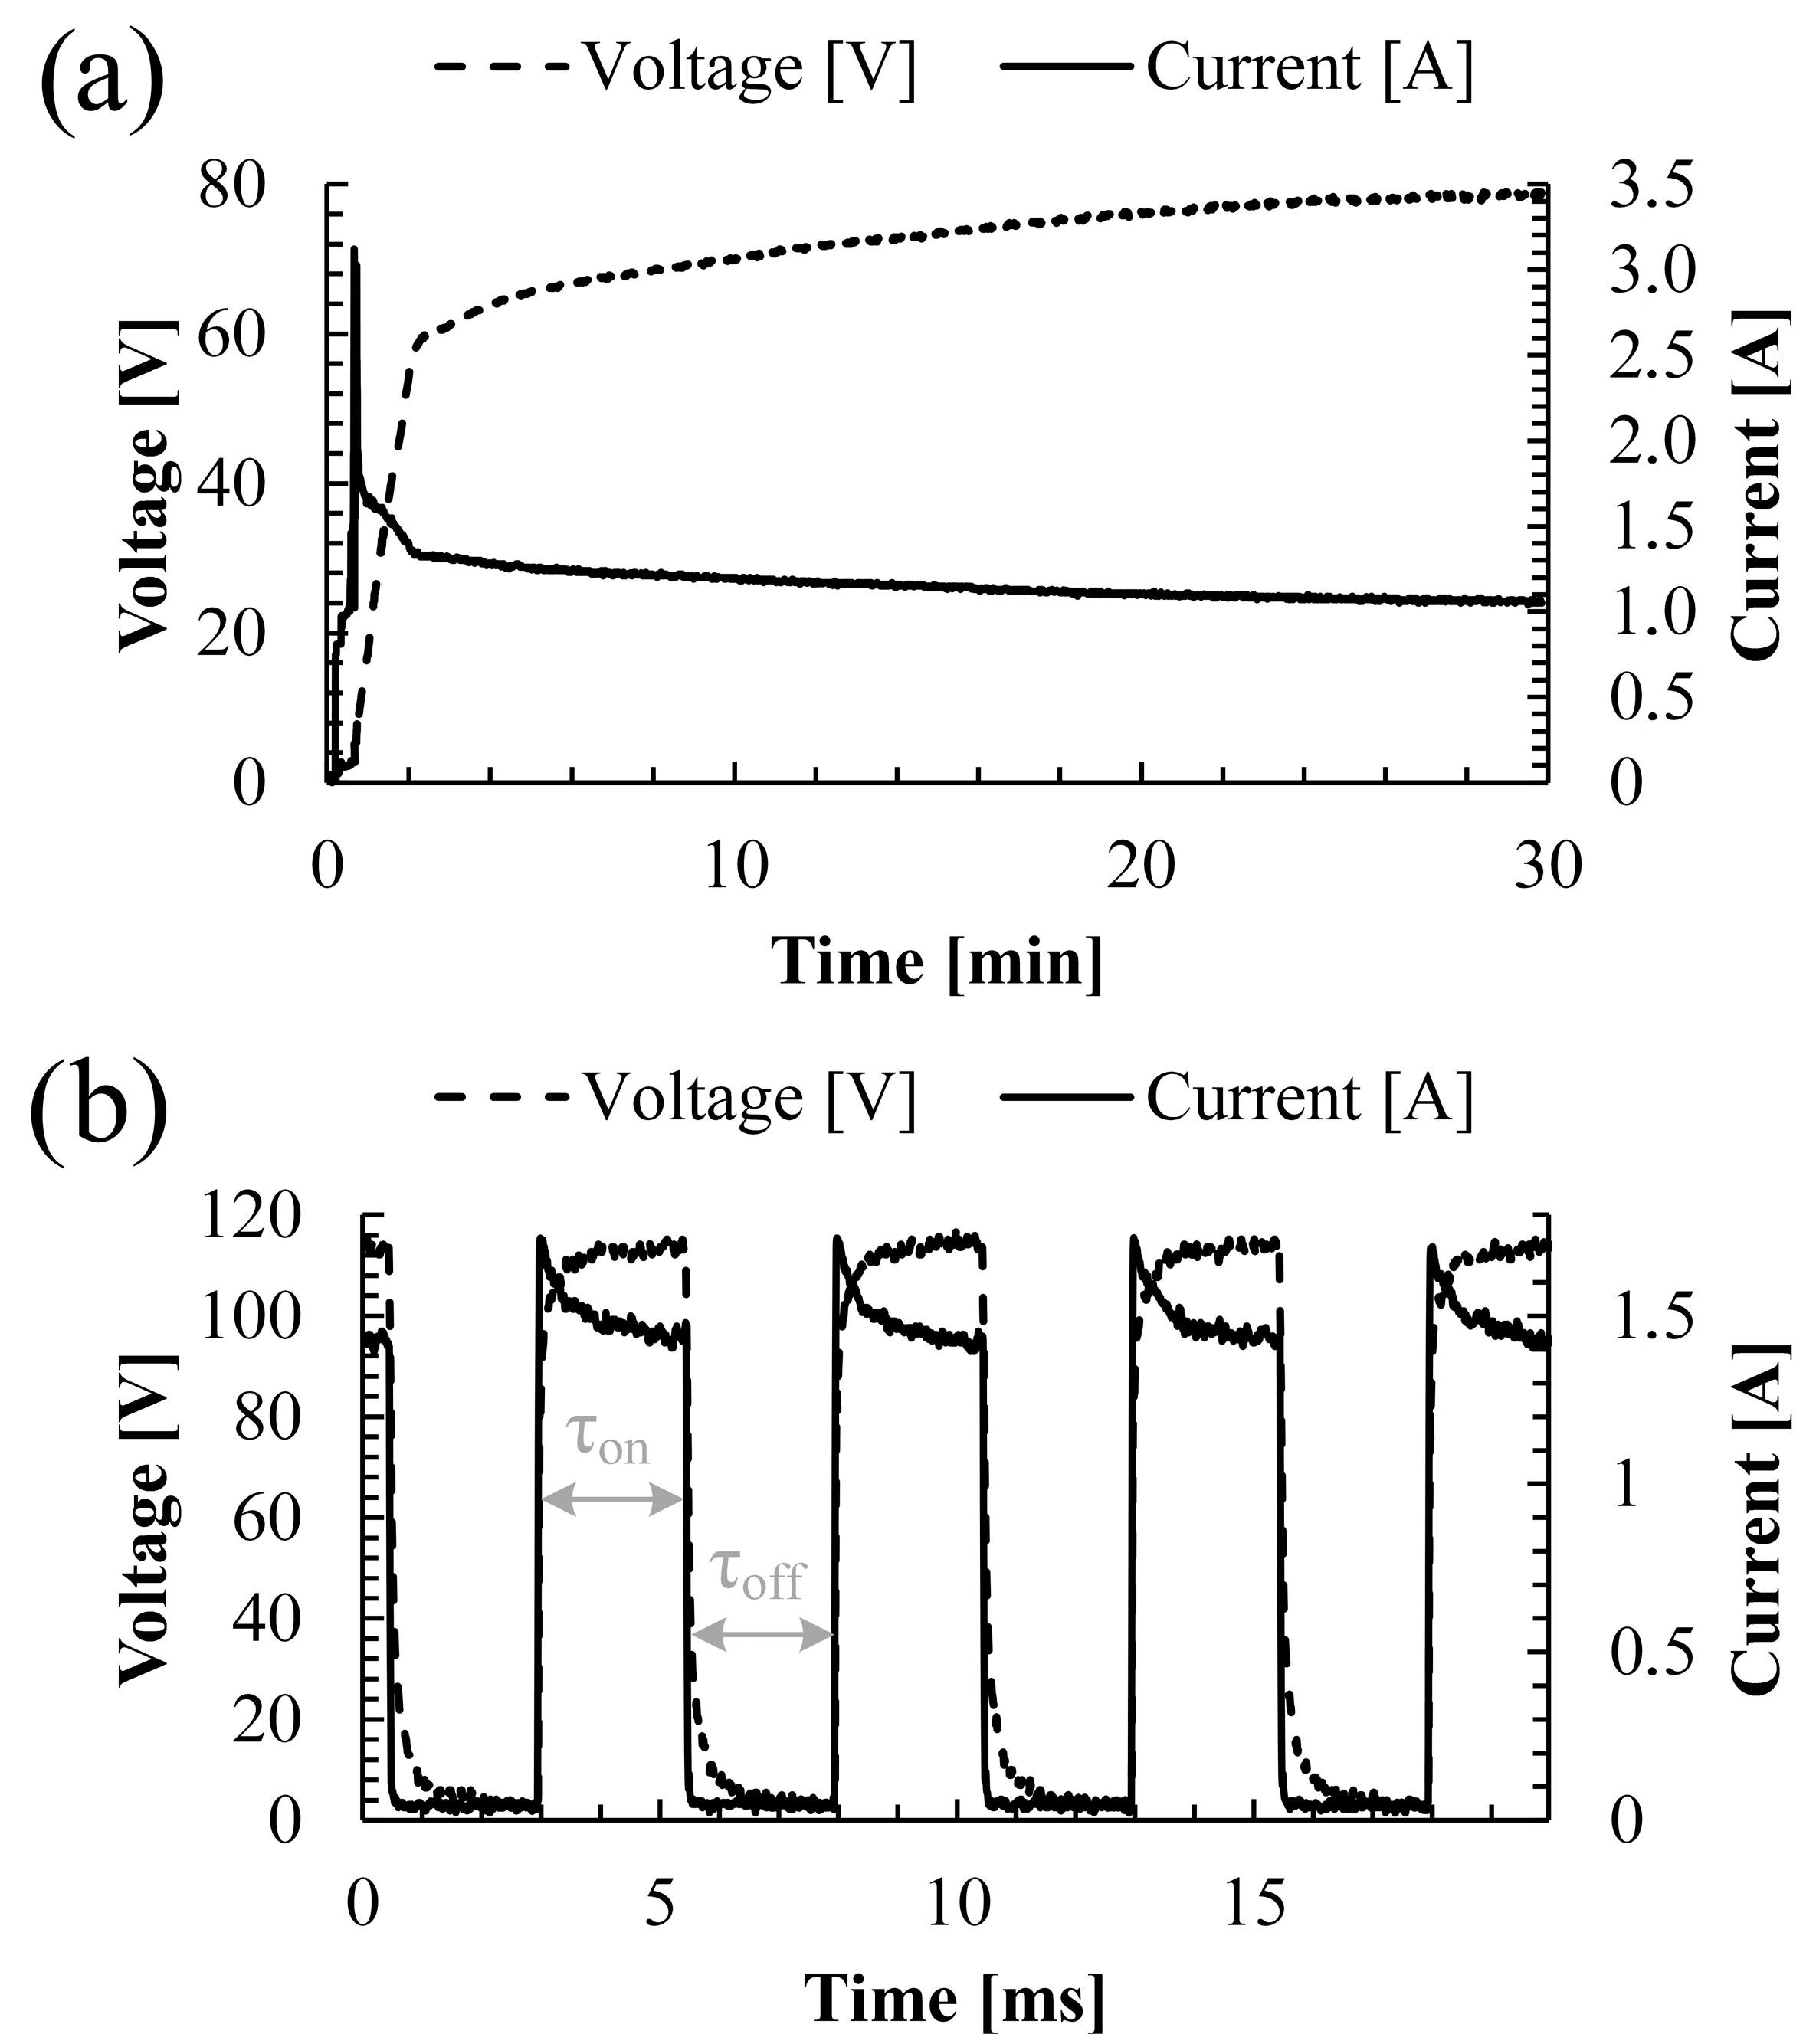
3.1. PEO Processing

The PEO treatment is an electrochemical process which electrical parameters are shown in Figure 1. The electrical behavior shown on plots are almost the same for all three examined current densities. The received voltage, and the current, time behavior plots are typical plots for the unipolar PEO process. During the initial stage, for the first 50 s, the amorphous aluminum oxide coating was formed as the result of Al oxidation. This is clearly expressed on the plot where the current grew extremely. A further increase in the oxide coating led to the growth of the resistance in the substrate/electrolyte interface that resulted in current drop, as seen in the plot for 50–150 s. In the same period, the voltage increased up to 62 V. From this point of time (150 s), the formed amorphous coating transformed to crystalline, as expressed by a low current decrease and low voltage increase. The waveform of the process is expressed by a typical unipolar behavior where τ off markup refers to the period when the current is not supplied and τ on markup refers to the period when the current is supplied.
Surface morphology of the fabricated coatings for Sam-200 Hz, Sam-300 Hz and Sam-400 Hz are illustrated in Figure 2. Sam-200 Hz has a random-porous microstructure with sub-micron and micron pores. With the increase in the current frequency of the PEO, the microstructure changes, it contains only micron pores, which are more equal, and their size is larger. These changes are observed in a comparison of Sam-200 Hz with Sam-400 Hz microstructures (Figure 2a,c).
Almost the same thickness of the coating, around 25 µm, was revealed in cross-section images in Figure 3. Evaluation of these images revealed a double-layered coating structure which consists of the internal dense layer and the external porous layer. These layers are attributed to two different phases of aluminum oxide, α-Al2O3 and γ-Al2O3 that to be discussed in Section 3.3. Observation of these images also revealed that the coating of the Sam-400 Hz is denser and less porous, which is correlated to the morphology observation discussed before. These structural changes may be attributed to the energy impact of PEO treatment. With the current frequency increase, the time duration of each single current pulse decreases that leads to the reduction in the transferred energy. Hence, the volume of the locally re-melted coating decreased, and thereby it became denser.

3.2. Phase and Chemical Composition Characterization

XRD analysis was performed to evaluate phase composition of the fabricated coatings; its patterns are shown in Figure 4. The following phases were detected in three examined coatings: α-Al2O3, γ-Al2O3, and metallic aluminum which also corresponds with [19,20]. Minor changes in peak intensities were observed due to the different absorbance of the X-ray radiation that may be attributed to a non-uniform fabricated surface. As expected, two phases of aluminum oxide were detected, and they are referred to as the internal and the external layers of the coating. Metallic aluminum phase was identified from the substrate due to the high penetration depth of the X-rays. Furthermore, no other phases were found, which points to the formation of a pure oxide coating with no impurities which usually originates from the electrolyte decomposition.
EDS analysis evaluated presence of mostly aluminum and oxygen elements and tiny amount of magnesium and zinc as shown in Figure 5. As expected, Al and O are the main components of the Al2O3 coating, Mg and Zn are components originated from the Al7075 alloy substrate. EDS mapping images pointed on the high O content which is favorably located in the coating (dark red color in the coating). Observation of a metallic substrate revealed presence of mostly Al, Zn, and Mg elements (darker colors for these three elements in the substrate). These observations are well correlated with the XRD patterns and point to the formation of the oxide coating free of any contaminates. These undesired components are usually originated in the decomposition of an aqueous electrolyte.

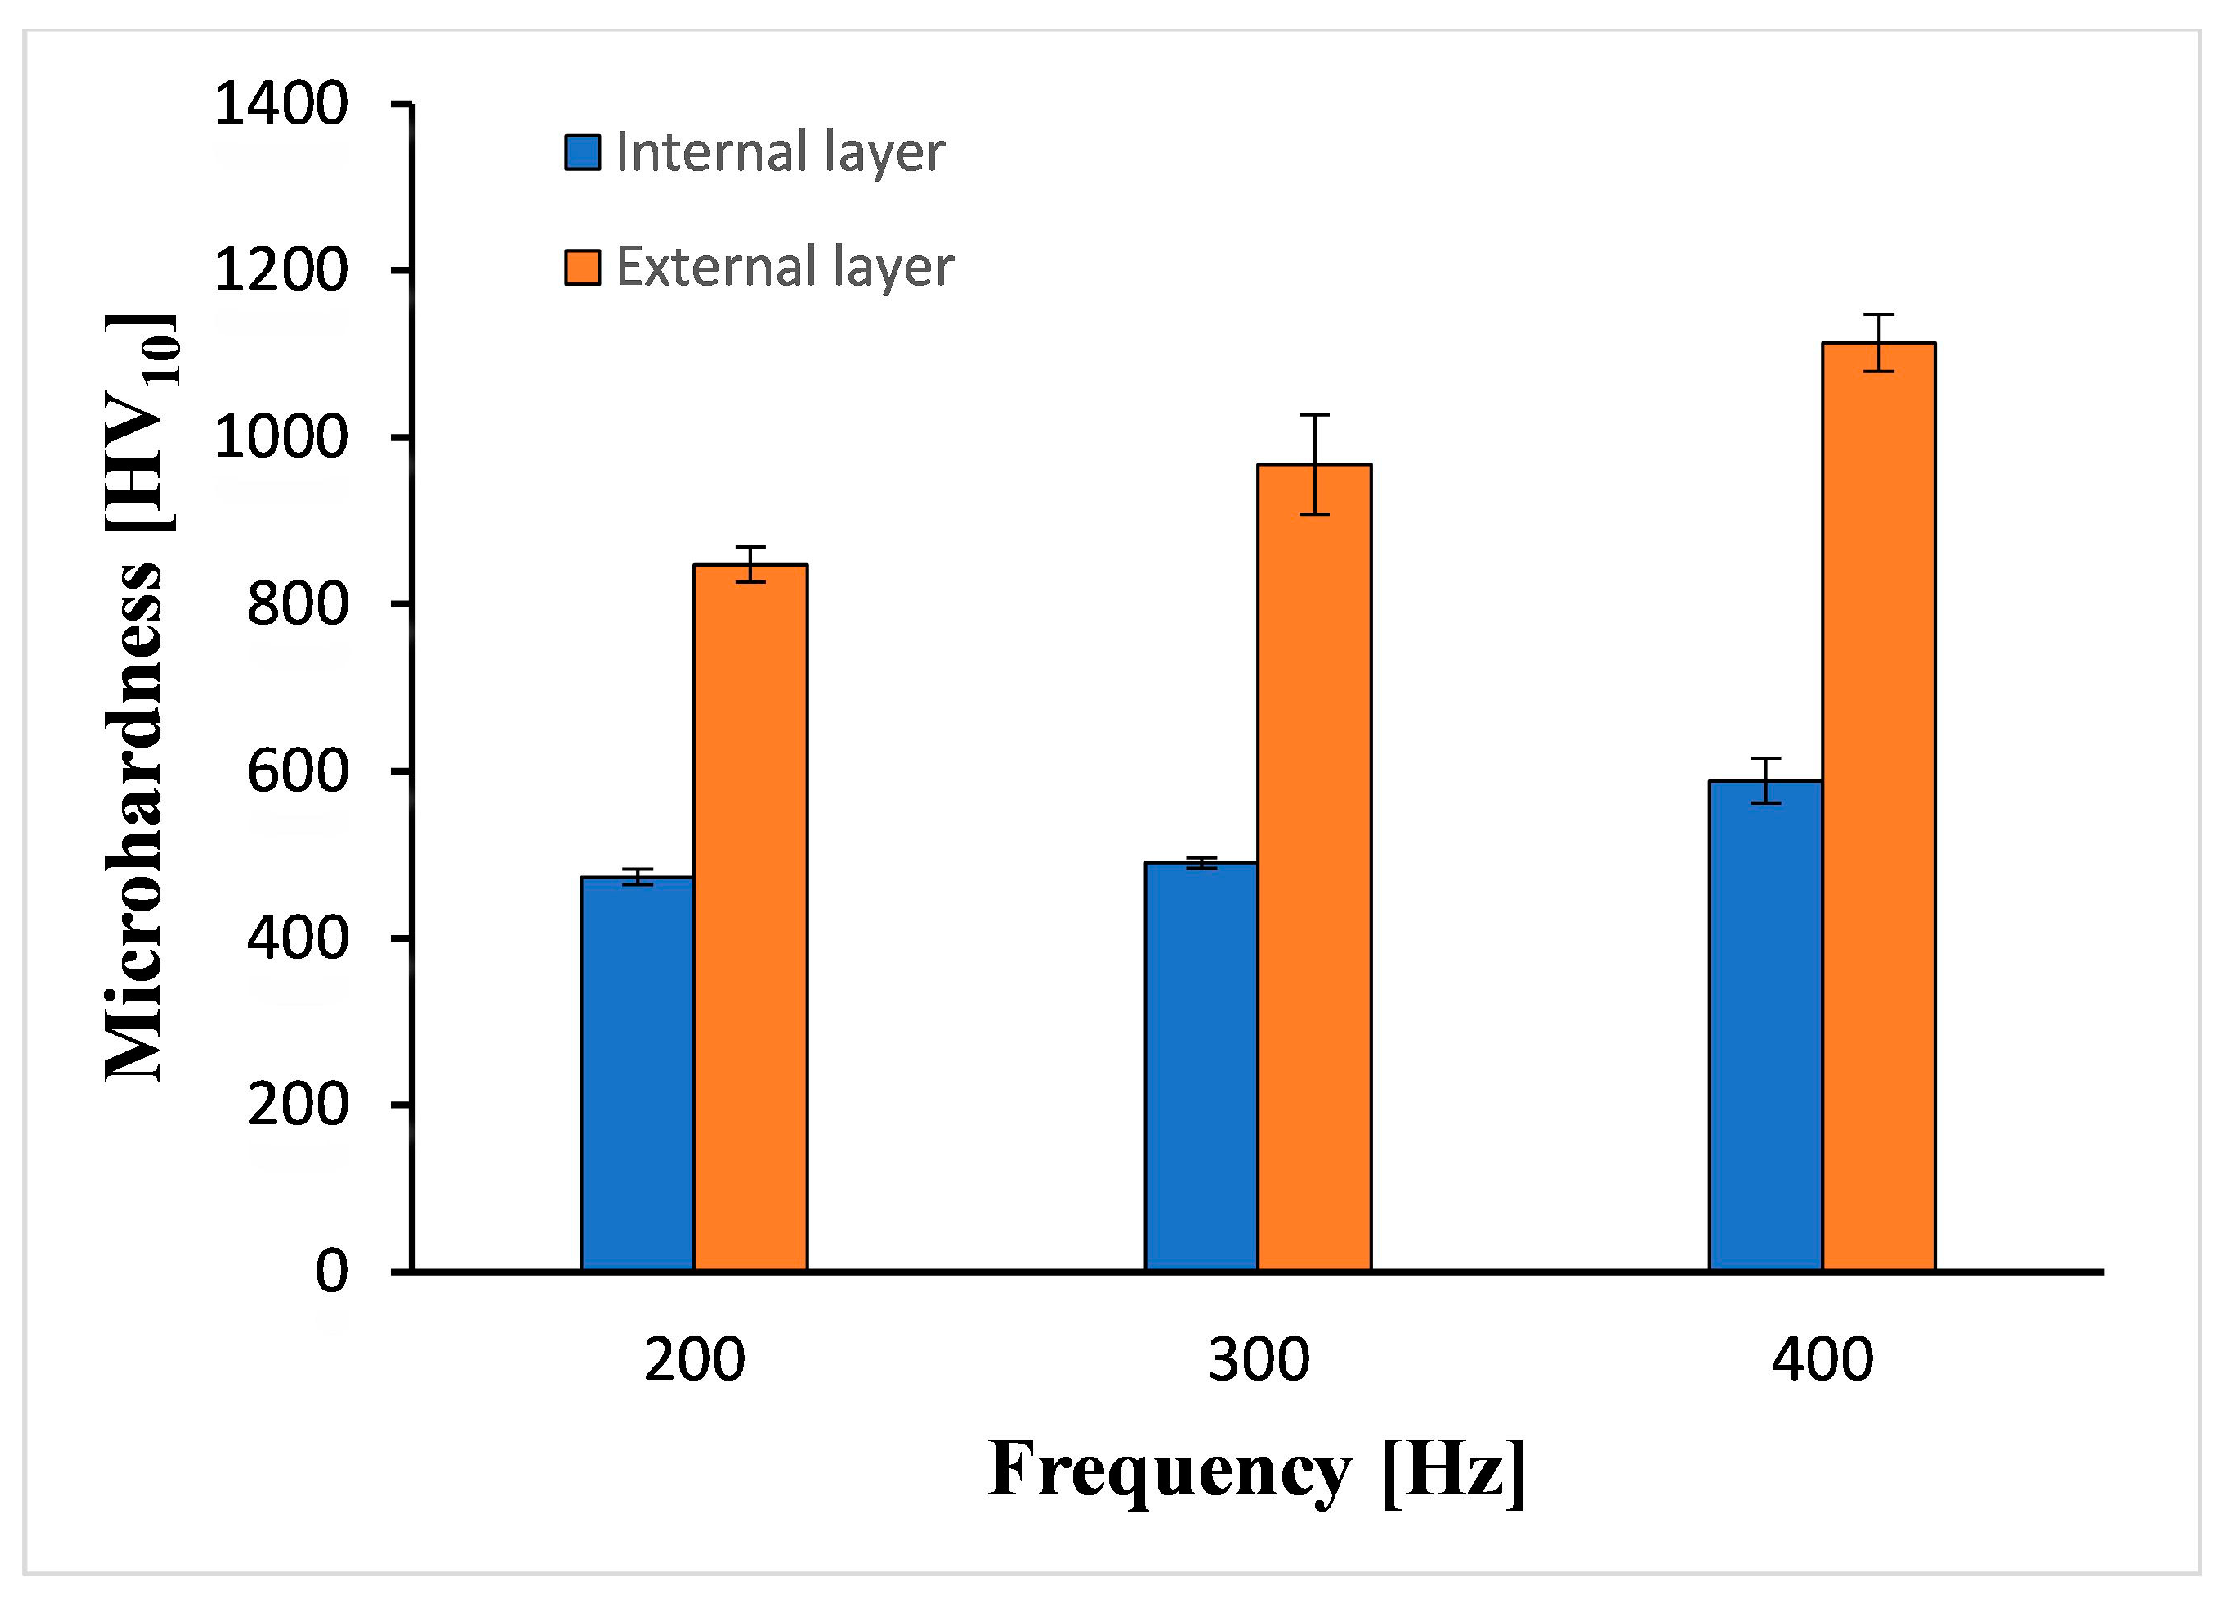
3.3. Coating Characterization

Microhardness measurements results are illustrated in Figure 6. These results exhibit increase of the coating microhardness with the current frequency increase. Additionally, the external layers show higher values in comparison with the internal. The measured values for the internal layer were 473.08, 490.30, and 588.67 HV for Sam-200 Hz, Sam-300 Hz, and Sam-400 Hz, respectively. The measured values for the external layer were 847.60, 967.77 and 1112.93 HV for Sam-200 Hz, Sam-300 Hz and Sam-400 Hz, respectively. The microhardness measurements jointly with the XRD results may indicate locations of the formed oxide layers. As reported by Brabec et al. and Sobolev et al. [15,21], the external layer is referred to as the α-Al2O3 since it is harder than the γ-Al2O3.
The fabricated oxide coating provides a high corrosion protection [22,23,24]. Two methods of corrosion resistance evaluation were conducted, the potentiodynamic polarization method and the EIS.
Potentiodynamic polarization curves for three coated samples and the original alloy are illustrated in Figure 7 and the obtained values are listed in Table 2 and Table 3.
Potentiodynamic results evaluated that all coated alloys exhibit greater corrosion resistance than the original alloy. Thus, the polarization curves were shifted to lower current densities as observed in Figure 7. Moreover, evaluation of the curves revealed that the current density shift was increased with the increase in current frequency of PEO process. In other words, the oxide surface can effectively prevent the penetration of corrosive solution. The obtained values for the corrosion potential (icorr) presented in Table 2 were determined from the Tafel plots in Figure 7, while other values in Table 3 were determined from the Stern–Geary equation:
R p =   β a ×   β c 2.3 × i corr ( β a + β c )
where Rp refers to the polarization resistance, βa and βc refer to the anodic and cathodic Tafel slopes, respectively, and icorr refers to the corrosion current density.
The corrosion rate (CR in mm/year) was calculated from the following equation:
C R = k r × i corr × E W ρ × A
where kr the corrosion rate constant (3272 mm/(A·cm·year)), icorr is the corrosion current in amperes, EW is the equivalent weight in g/equivalent, ρ is density in g/cm3, and A is the area of the sample in cm2.
The corrosion resistance values in Table 3 revealed the greater corrosion resistance for treated alloys using PEO in molten salt. Additionally, the effect of the PEO current frequency on the corrosion resistance was also revealed. It was determined that the increase in current frequency of the process caused to the increase in corrosion resistance; the current density reduced from 8.9 × 10⁷ A·cm2 for Sam-200 Hz to 2.3 × 10⁷ A·cm-2 for Sam-400 Hz. The same tendency was also found for the corrosion potential which was increased from −654.7 to –560.6 mV, while the original alloy corrosion potential was –701.2 mV. The calculated corrosion resistance rates of the coated alloys are higher than the rate of the original alloy. Hence, the calculated corrosion rate of the original alloy was 0.3192 mm/year while the coated alloys exhibited corrosion rates of 0.0092, 0.0083, and 0.0026 for Sam-200 Hz, Sam-300 Hz, and Sam-400 Hz, respectively. Experimental results of the present work have also revealed that the obtained corrosion resistance in PEO conducted in molten salt is much higher than the identical alloy treated using PEO in aqueous solution [25]. This behavior is attributed to the surface morphology where substrate/coating interface characterized by the electric double layer with a specific ion adsorption.
The corrosion process in a chloride-based solution was extensively shown elsewhere [26,27,28,29]. These works described the activation effect of ions of Cl- in the anodic dissolution of aluminum and aluminum oxide. Lv et al. [30] and Zhang et al. [31] reported the following corrosion reactions which can be also adopted to the present investigation:
The anodic reaction:
Al → Al3+ + 3e
with the possible subsequent reactions
Al3+ + 3H2O → Al(OH)3 + 3H+
Al(OH)3 + Cl → Al(OH)2Cl + OH
Al(OH)2Cl + Cl → Al (OH)Cl2 + OH
Al(OH)Cl2 + Cl → AlCl3 + OH
The cathodic oxygen depolarization reaction:
O2 + 4e + 2H2O → 4OH
It may be assumed that the cathodic slope of the Tafel plot indicates the diffusion control for the reaction of the oxygen reduction (reaction 8). Meanwhile, the anodic slope of the Tafel plot indicates the activation-controlled process of the charge transfer through the interphase. Based on the theory, a one-electron process is the most preferrable, as shown in reactions (5)–(7). It is worth to add that the anodic dissolution of the original alloy occurs uniformly, without pitting corrosion. However, dissolution of the coated alloys occurs with the local pitting corrosion. Different slopes of the βa for the coated alloys are attributed to the different overpotentials obtained at a certain current decade and they determine the corrosion rate of the process (Equation (2)).
EIS analysis revealed the effect of the PEO current frequency on the surface morphology formation. EIS presents Nyquist plots in Figure 8, Bode plots in Figure 9, and equivalent electrical circuits in Figure 10 and Table 4 which provide the fitting between the experimental and theoretical results.
The Nyquist plots illustrated in Figure 8 represent differences between behavior of the coated samples and the original alloy. The symbols in the plot are attributed to the experimental values while the solid lines are the fitted data presented in Table 4. The Nyquist plot for the original alloy has a one capacitive loop which is referred to as the natural aluminum oxide layer. However, treated alloys using PEO have two capacitive loops, the first one is located at the high-frequency range and referred to the external outer layer. The second capacitive loop is located at the medium and low-frequency ranges, and referred to as the internal oxide layer.
Fitting of the EIS spectra was made by equivalent electrical circuits given in Figure 10. Here, R is the charge transfer resistance and CPE is the constant phase element of the electric double-layer capacitance determined using the follows equation:
Z C P E = 1 ( Q j ω ) n
where ZCPE refers to the impedance of the CPE, Q refers to the proportional factor of the CPE, j is the imaginary unit, ω is the angular frequency, and n is a dimensionless parameter. When n = 0, the CPE acts as a resistor. When n = 1, the CPE acts as a capacitor.
The investigation of the natural aluminum oxide layer on the original alloy was performed by the equivalent circuit Rs + CPE2/R2 which is illustrated in Figure 10a. Rs is the resistance of the electrolyte, R2 is the charge transfer resistance, and CPE2 is the electric double-layer capacitance. The investigation of the treated alloys using PEO was performed by the equivalent circuit Rs + CPE1/(R1 + CPE2/R2) which illustrated in Figure 10b. R1 is the resistance to the charge transfer of the external porous layer, CPE1 is the electric double-layer capacitance of the porous external layer, R2 is the resistance to the charge transfer of the internal dense layer, and CPE2 is the electric double-layer capacitance of the internal dense layer.
An evaluation of Bode plots in Figure 9 revealed presence of two bends on the curves of the treated alloys that may be attributed to the internal- external- layered oxide structure. Similar to the description of capacitive loops in Nyquist plots, in Bode plots, the curve at the high- frequency range is referred to as the external outer layer and that at the medium- and low-frequency ranges are referred to as the internal layer.
An electrical parameters analysis in Table 4 revealed that values of R2 are much greater in comparison with the values of R1 that may be attributed to the greater corrosion resistance, preferable provide by the internal layer. For Sample-400 Hz, R2 reaches 107 kΩ·cm2 while the value of the R1 for the same sample is 256 Ω·cm2. The same trend was also observed for Sam-200 Hz and Sam-300 Hz. Thus, Sam-200 Hz exhibits values of 51.1 kΩ·cm2 and 121 Ω·cm2 for R2 and R1, respectively. Sam-300 Hz exhibits values of 53.0 kΩ·cm2 and 152 Ω·cm2 for R2 and R1, respectively. These results point to the high corrosion-resistance performance of the internal dense oxide layer which is located closer to the substrate and acts as a barrier for the electrolyte penetration towards the metallic substrate. Values for the external layer are referred to as the porous surface morphology and correspond with observations in Figure 3. Sam-200 Hz and Sam-300 Hz demonstrate almost the same porosity while Sam-400 Hz has lower porosity as determined in SEM images and fitted values of the electrical parameters.
The calculated values for n varied from 0.57 to 0.88 for the treated alloys due to the non-uniform coating structure. The value of n for the original alloy is 0.9, closer to the capacitor behavior.

4. Conclusions

This work focuses on an investigation of the PEO process carried out in molten salt. Here, the ceramic coating on Al7075 alloy was fabricated and characterized. SEM observation revealed a porous surface which changes from the random sub-micron and micron porosity to a more equal micron porosity with the increase in current frequency of the process. The thickness of the coatings was around 25 µm and it contained two oxide layers. Based on XRD and EDS analysis and microhardness measurements, the external layer was detected as α-Al2O3 and the internal as γ-Al2O3. The corrosion resistance of the original and coated alloys was examined by a potentiodynamic polarization approach and EIS. Both methods revealed the greater corrosion resistance for the coated alloy than the original one. Additionally, it was determined that the PEO current frequency affects morphology, and as a result, its corrosion resistance. Thus, the higher the current frequency of the PEO process, the greater the corrosion resistance of the alloy.

Author Contributions

Conceptualization, A.S. and K.B.; methodology, A.S. and K.B.; investigation, A.S. and T.P.; writing—original draft preparation, A.S., T.P., and K.B.; writing—revised draft preparation, A.S. and K.B.; supervision, K.B. All authors have read and agreed to the published version of the manuscript.

Funding

This research received no external funding.

Acknowledgments

Authors wish to express their gratitude to Alexey Kossenko and Natalia Litvak from the Engineering and Technology Unit at the Ariel University for their assistance in XRD and SEM investigations.

Conflicts of Interest

The authors declare no conflict of interest.

References

  1. Stojadinović, S.; Vasilić, R.; Petković, M.; Kasalica, B.; Belča, I.; Zekić, A.; Zeković, L. Characterization of the plasma electrolytic oxidation of titanium in sodium metasilicate. Appl. Surf. Sci. 2013, 265, 226–233. [Google Scholar] [CrossRef]
  2. Lu, X.; Blawert, C.; Kainer, K.U.; Zheludkevich, M.L. Investigation of the formation mechanisms of plasma electrolytic oxidation coatings on Mg alloy AM50 using particles. Elect. Acta 2016, 196, 680–691. [Google Scholar] [CrossRef]
  3. Dehnavi, V.; Liu, X.Y.; Luan, B.L.; Shoesmith, D.W.; Rohani, S. Phase transformation in plasma electrolytic oxidation coatings on 6061 aluminum alloy. Surf. Coat. Technol. 2014, 251, 106–114. [Google Scholar] [CrossRef]
  4. Rokosz, K.; Hryniewicz, T.; Matýsek, D.; Raaen, S.; Valíček, J.; Dudek, L.; Harničárová, M. SEM, EDS and XPS analysis of the coatings obtained on titanium after plasma electrolytic oxidation in electrolytes containing copper nitrate. Materials 2016, 9, 318. [Google Scholar] [CrossRef]
  5. Yerokhin, A.L.; Nie, X.; Leyland, A.; Matthews, A. Characterization of oxide films produced by plasma electrolytic oxidation of a Ti–6Al–4V alloy. Surf. Coat. Technol. 2000, 130, 195–206. [Google Scholar] [CrossRef]
  6. Park, S.Y.; Choe, H.C. Functional element coatings on Ti-alloys for biomaterials by plasma electrolytic oxidation. Thin Solid Films 2020, 699, 137896. [Google Scholar] [CrossRef]
  7. Gnedenkov, S.V.; Khrisanfova, O.A.; Zavidnaya, A.G.; Sinebrukhov, S.L.; Gordienko, P.S.; Iwatsubo, S.; Matsui, A. Composition and adhesion of protective coatings on aluminum. Surf. Coat. Technol. 2001, 145, 146–151. [Google Scholar] [CrossRef]
  8. Asquith, D.; Yerokhin, A.; James, N.; Yates, J.; Matthews, A. Evaluation of residual stress development at the interface of plasma electrolytically oxidized and cold-worked aluminum. Metall. Mater. Trans. A 2013, 44, 4461–4465. [Google Scholar] [CrossRef]
  9. Simchen, F.; Sieber, M.; Kopp, A.; Lampke, T. Introduction to plasma electrolytic oxidation—An overview of the process and applications. Coatings 2020, 10, 628. [Google Scholar] [CrossRef]
  10. Lou, H.-R.; Tsai, D.-S.; Chou, C.-C. Correlation between defect density and corrosion parameter of electrochemically oxidized aluminum. Coatings 2019, 10, 20. [Google Scholar] [CrossRef] [Green Version]
  11. Yang, K.; Zeng, J.; Huang, H.; Chen, J.; Cao, B. A Novel self-adaptive control method for plasma electrolytic oxidation processing of aluminum alloys. Materials 2019, 12, 2744. [Google Scholar] [CrossRef] [Green Version]
  12. Terleeva, O.P.; Slonova, A.I.; Rogov, A.B.; Matthews, A.; Yerokhin, A. Wear resistant coatings with a high friction coefficient produced by plasma electrolytic oxidation of al alloys in electrolytes with basalt mineral powder additions. Materials 2019, 12, 2738. [Google Scholar] [CrossRef] [Green Version]
  13. Sobolev, A.; Kossenko, A.; Borodianskiy, K. Study of the effect of current pulse frequency on Ti–6Al–4V alloy coating formation by micro arc oxidation. Materials 2019, 12, 3983. [Google Scholar] [CrossRef] [PubMed] [Green Version]
  14. Sobolev, A.; Kossenko, A.; Zinigrad, M.; Borodianskiy, K. Comparison of plasma electrolytic oxidation coatings on Al alloy created in aqueous solution and molten salt electrolytes. Surf. Coat. Technol. 2018, 344, 590–595. [Google Scholar] [CrossRef]
  15. Sobolev, A.; Kossenko, A.; Zinigrad, M.; Borodianskiy, K. An investigation of oxide coating synthesized on an aluminum alloy by plasma electrolytic oxidation in molten salt. Appl. Sci. 2017, 7, 889. [Google Scholar] [CrossRef] [Green Version]
  16. Wang, S.; Gu, Y.; Geng, Y.; Liang, J.; Zhao, J.; Kang, J. Investigating local corrosion behavior and mechanism of MAO coated 7075 aluminum alloy. J. Alloys Compd. 2020, 826, 153976. [Google Scholar] [CrossRef]
  17. Bahramian, A.; Raeissi, K.; Hakimizad, A. An investigation of the characteristics of Al2O3/TiO2 PEO nanocomposite coating. Appl. Surf. Sci. 2015, 351, 13–26. [Google Scholar] [CrossRef]
  18. Arunnellaiappan, T.; Arun, S.; Hariprasad, S.; Gowtham, S.; Ravisankar, B.; Rama Krishna, L.; Rameshbabu, N. Fabrication of corrosion resistant hydrophobic ceramic nanocomposite coatings on PEO treated AA7075. Ceram. Int. 2018, 44, 874–884. [Google Scholar] [CrossRef]
  19. Nie, X.; Meletis, E.; Jiang, J.; Leyland, A.; Yerokhin, A.; Matthews, A. Abrasive wear/corrosion properties and TEM analysis of Al2O3 coatings fabricated using plasma electrolysis. Surf. Coat. Technol. 2002, 149, 245–251. [Google Scholar] [CrossRef]
  20. Polat, A.; Makaraci, M.; Usta, M. Influence of sodium silicate concentration on structural and tribologicalproperties of microarc oxidation coatings on 2017A aluminum alloy substrate. J. Alloys Compd. 2010, 504, 519–526. [Google Scholar] [CrossRef]
  21. Brabec, L.; Bohac, P.; Stranyanek, M.; Ctvrtlik, R.; Kocirik, M. Hardness and elastic modulus of silicalite-1 crystal twins. Micropor. Mesopor. Mat. 2006, 94, 226–233. [Google Scholar] [CrossRef]
  22. Wen, L.; Wang, Y.; Zhou, Y.; Ouyang, J.-H.; Guo, L.; Jia, D. Corrosion evaluation of microarc oxidation coatings formed on 2024 aluminium alloy. Corros. Sci. 2010, 52, 2687–2696. [Google Scholar] [CrossRef]
  23. Shen, D.; Li, G.; Guo, C.; Zou, J.; Cai, J.; He, D.; Ma, H.; Liu, F. Microstructure and corrosion behavior of micro-arc oxidation coating on 6061 aluminum alloy pre-treated by high-temperature oxidation. Appl. Surf. Sci. 2013, 287, 451–456. [Google Scholar] [CrossRef]
  24. Venugopal, A.; Srinath, J.; Rama Krishna, L.; Ramesh Narayanan, P.; Sharma, S.C.; Venkitakrishnan, P.V. Corrosion and nanomechanical behaviors of plasma electrolytic oxidation coated AA7020-T6 aluminum alloy. Mater. Sci. Eng. A 2016, 660, 39–46. [Google Scholar] [CrossRef]
  25. Rao, Y.; Wang, Q.; Oka, D.; Ramachandran, C.S. On the PEO treatment of cold sprayed 7075 aluminum alloy and its effects on mechanical, corrosion and dry sliding wear performances thereof. Surf. Coat. Technol. 2020, 383, 125271. [Google Scholar] [CrossRef]
  26. Evans, U.R. CXL—The passivity of metals. Part, I. The isolation of the protective film. J. Chem. Soc. 1927, 1020–1040. [Google Scholar] [CrossRef]
  27. Rosenfeld, I.L.; Marshakov, I.K. Mechanism of crevice corrosion. Corrosion 1964, 20, 115t–125t. [Google Scholar] [CrossRef]
  28. Hoar, T.P.; Mears, D.C.; Rothwell, G.P. The relationships between anodic passivity, brightening and pitting. Corros. Sci. 1965, 5, 279–289. [Google Scholar] [CrossRef]
  29. McCafferty, E. General relations regarding graph theory and the passivity of binary alloys. J. Electrochem. 2003, 150, B238–B247. [Google Scholar] [CrossRef]
  30. Lv, D.; Ou, J.; Xue, M.; Wang, F. Stability and corrosion resistance of superhydrophobic surface onoxidized aluminum in NaCl aqueous solution. Appl. Surf. Sci. 2015, 333, 163–169. [Google Scholar] [CrossRef]
  31. Zhang, B.; Wang, J.; Wu, B.; Guo, X.W.; Wang, Y.J.; Chen, D.; Zhang, Y.C.; Du, K.; Oguzie, E.E.; Ma, X.L. Unmasking chloride attack on the passive film of metals. Nat. Commun. 2018, 9, 2559. [Google Scholar] [CrossRef] [PubMed]
Figure 1. Plots of the PEO treatment of Al7075 alloy in molten salt: (a) voltage–and current-time behaviors, (b) waveform.
Coatings 10 00993 g001
Figure 2. Surface morphologies of the Al7075 alloy after PEO treatment obtained by SEM: (a) Sam-200 Hz, (b) Sam-300 Hz, (c) Sam-400 Hz.
Coatings 10 00993 g002
Figure 3. Cross-section images of the Al7075 alloy after PEO treatment obtained by SEM: (a) Sam-200 Hz, (b) Sam-300 Hz, (c) Sam-400 Hz.
Coatings 10 00993 g003
Figure 4. XRD patterns of the Al7075 alloy surfaces after PEO treatment of Sam–200 Hz, Sam–300 Hz and Sam–400 Hz.
Coatings 10 00993 g004
Figure 5. SEM image of the Sam-400 Hz after PEO treatment: (a) cross-section and EDS elements mapping, (b) EDS analysis.
Coatings 10 00993 g005
Figure 6. Microhardness measurements of internal and external layers of the Al7075 alloy coatings after PEO treatment of Sam-200 Hz, Sam-300 Hz and Sam-400 Hz.
Coatings 10 00993 g006
Figure 7. Potentiodynamic polarization curves of Sam-200 Hz, Sam-300 Hz, Sam-400 Hz and an original Al7075 alloy. Examination was conducted in the 3.5 wt.% NaCl solution.
Coatings 10 00993 g007
Figure 8. Nyquist plots of Sam-00 Hz, Sam-300 Hz, Sam-400 Hz and an original Al7075 alloy: (a) curves for full impedance range, (b) enlarged area of the curves. The symbols represent experimental values and the solid lines represent fitted data. Examination was conducted in the 3.5 wt.% NaCl solution.
Coatings 10 00993 g008
Figure 9. Bode plots of Sam–200 Hz, Sam–300 Hz, Sam–400 Hz and an original Al7075 alloy: (a) impedance modulus, (b) phase angle. The symbols represent the experimental values and the solid lines represent fitted data. Examination was conducted in the 3.5 wt.% NaCl solution.
Coatings 10 00993 g009
Figure 10. Equivalent electrical circuits used for the EIS spectra fitting for: (a) original Al7075 alloy, (b) Al alloys treated by PEO in molten salt.
Coatings 10 00993 g010
Table 1. Chemical composition of the Al7075 alloy.
Chemical Element, wt.%
ZnCuMgCrSiMnTiAl
5.1–6.11.2–2.02.1–2.90.18–0.35<0.4<0.3<0.2balance
Table 2. Mean of electrochemical parameters obtained from the potentiodynamic polarization curves for the fabricated and original alloys.
Samplesicorr × 10−7 (A·cm−2)Ecorr vs. Ag/AgClsat (mV)βa (mV/dec)βc (mV/dec)
Original248.5−701.217−324
Sam-200 Hz8.9−654.7199−164
Sam-300 Hz7.6−605.9207−222
Sam-400 Hz2.3−560.676−457
Table 3. Calculated values of the resistance and the corrosion rate from the potentiodynamic polarization test for the fabricated and original alloys.
SamplesRp (kΩ cm2)CR (mm/Year)
Original1.50.3192
Sam-200 Hz43.70.0092
Sam-300 Hz61.40.0083
Sam-400 Hz122.90.0026
Table 4. Fitting values of electrical parameters obtained from the equivalent electrical circuits for the fabricated and original alloys.
SamplesOriginalSam-200 HzSam-300 HzSam-400 Hz
Rs (Ω·cm2)3.720.560.330.79
CPE1 (F·cm−2·sn−1)-1.35 × 1061.55 × 10-61.86 × 10⁶
n1-0.630.610.63
R1 (Ω·cm2)-1.21 × 1021.52 × 1022.56 × 102
CPE2 (F·cm−2·sn−1)4.27 × 1055.84 × 1071.05 × 1081.62 × 108
n20.900.880.610.57
R2 (Ω·cm2)1.75 × 1045.11 × 1045.30 × 1041.07 × 105
χ21.01 × 1031.12 × 1031.42 × 1031.25 × 103
Publisher’s Note: MDPI stays neutral with regard to jurisdictional claims in published maps and institutional affiliations.

