Article

Microstructure of High Temperature Oxidation Resistant Hf6B10Si31C2N50 and Hf7B10Si32C2N44 Films

1
Department of Materials Science and Engineering, The University of Texas at Arlington, Arlington, TX 76019, USA
2
Department of Physics and NTIS—European Centre of Excellence, University of West Bohemia, 30614 Plzen, Czech Republic
*
Author to whom correspondence should be addressed.
Coatings 2020, 10(12), 1170; https://doi.org/10.3390/coatings10121170
Submission received: 6 November 2020 / Revised: 22 November 2020 / Accepted: 27 November 2020 / Published: 29 November 2020
(This article belongs to the Special Issue Nanoscale Multilayer Thin Films/Foils)

Abstract

:
High-temperature oxidation resistant amorphous Hf6B10Si31C2N50 and Hf7B10Si32C2N44 films were deposited by reactive pulsed dc magnetron sputtering. To investigate the oxidation mechanism, the films were annealed up to 1500 °C in air. The evolved microstructures were studied by X-ray diffraction and transmission electron microscopy. A three-layered microstructure was developed upon exposure to high temperature. An oxidized layer formed at the top surface for both films consisting of monoclinic and/or orthorhombic m-/o-HfO2 nanoparticles embedded in an amorphous SiOx-based matrix. The as-deposited bottom layer of the films remained amorphous (Hf6B10Si31C2N50) or partially recrystallized (Hf7B10Si32C2N44) exhibiting a h-Si3N4 and HfCxN1−x distribution along with formation of t-HfO2 at its top section. The two layers were separated by a partially oxidized transition layer composed of nanocrystalline h-Si3N4 and tetragonal t-HfO2. The oxidation process initiates at the bottom/transition layer interface with oxidation of Hf-rich domains either in the amorphous structure or in HfCxN1−x nanoparticles resulting in t-HfO2 separated by Si3N4 domains. The second stage occurs at the oxidized/transition layer interface characterized by densely packed HfO2, Si3N4 and quartz SiO2 nanostructures that can act as a barrier for oxygen diffusion. The small t-HfO2 nanoparticles merge and transform into large m-/o-HfO2 while h-Si3N4 forms amorphous SiOx matrix. A similar oxidation mechanism was observed in both films despite the different microstructures developed.

1. Introduction

Ultra-high temperature ceramics (UHTCs) have been extensively studied in the recent years as they usually possess desirable properties such as high hardness, high melting point, superior oxidation and corrosion resistance at high temperatures and good thermal stability [1,2,3,4,5,6,7,8,9,10]. Among these materials, ZrB2–SiC and HfB2–SiC have demonstrated the most promising high temperature oxidation resistance because an oxide layer, consisting of a metal oxide skeleton and silicon oxide matrix form providing excellent protection against further oxygen permeation [5,7,11,12,13,14,15,16,17]. A wide range of potential applications including critical frame structure of hypersonic vehicles, high-speed cutting tools, refractory linings and high-temperature electrodes and microelectronics would benefit from the use of UHTCs [5,7]. In our recent studies, we have successfully deposited Hf–B–Si–C coatings that exhibit high hardness, high electrical conductivity and good oxidation resistance up to 800 °C [18,19]. Meanwhile, we found out that nitrogen can play an important role in thermal stability of Si–B–C–N films improving significantly the oxidation resistance [20,21,22,23,24]. Therefore, there was a clear advantage incorporating nitrogen into the Hf–B–Si–C system. In our most recently published works, several Hf–B–Si–C–N coatings had been deposited via reactive magnetron sputtering and demonstrated superior high-temperature stability and oxidation resistance at temperatures up to 1600 °C [25,26,27,28]. Comprehensive microstructure analysis utilizing high-resolution transmission electron microscopy (HRTEM) and selected-area electron diffraction (SAED) showed that the original amorphous coatings gradually evolved into a two-layer structure comprising a top oxide layer and an unreacted bottom layer. The top oxide layer is characterized by crystalline HfO2 particles surrounded by a SiOx-based amorphous matrix acting as a strong oxygen permeation barrier. In addition, a slightly varied nitrogen content in the film composition would introduce a significant microstructure difference after annealing. For example, Hf6B21Si19C4N47 and Hf7B23Si17C4N45 films had an amorphous as-deposited bottom layer after being exposed to 1500 °C in air [27,28]. However, Hf7B23Si22C6N40 film had its entire bottom layer partially recrystallized into nanocrystalline HfC0.5N0.5, HfB2, Si3N4 and BN grains under the same heat treatment [28]. However, the resulted microstructure difference could potentially lead to different oxidation kinetics and affect the oxidation resistance at higher temperatures. As a result, it is crucial to understand the relationship between film composition and microstructure evolution at high temperatures in order to optimize the oxidation resistance of HfBSiCN films.
In the presented study, Hf7B10Si32C2N44 and Hf6B10Si31C2N50 films were deposited on single crystalline SiC substrates via reactive magnetron sputtering. They were subjected to heat treatment up to 1500 °C in air followed by a comprehensive TEM microstructure analysis. One of the major differences between the present two films and the HfBSiCN films previously studied, i.e., Hf7B23Si22C6N40, Hf7B23Si17C4N45 and Hf6B21Si19C4N47, is the high Si:B ratio (increasing roughly from 1:1 to 3:1). The goal of this study is to understand the effect of higher Si:B ratio in view of their N content on the evolved microstructure and oxidation mechanism of Hf–B–Si–C–N films.

2. Materials and Methods

The Hf7B10Si32C2N44 and Hf6B10Si31C2N50 films were deposited utilizing a Balzers BAS 450 PM sputtering system (Balzers, Liechtenstein). The films were deposited on polished and ultrasonically pre-cleaned single-crystalline SiC substrates using reactive magnetron co-sputtering of Hf, B, Si and C from a single B4C–Hf–Si target in an Ar–N2 gas mixture. The single B4C–Hf–Si target (127 mm × 254 mm) was prepared using a B4C plate (6 mm thick) overlapped by p-type Si and Hf stripes with fixed 30% B4C + 50% Si + 20% Hf fractions in the target erosion area. The target was driven by a pulsed dc power supply (Rübig MP120, Wels, Austria) operating at a frequency of 10 kHz and average power of 500 W. During the reactive sputtering, the voltage pulse duration of 50 µs is sufficiently short to avoid micro-arcing at the non-conductive layer formed on the B4C–Hf–Si target (for further details see [18,19,25]). The base pressure before the deposition was 1 × 10⁻³ Pa. During the deposition, the total pressure of argon-nitrogen gas mixture was 0.5 Pa with a N2 fraction in the mixture of 25% for Hf7B10Si32C2N44 and 50% for Hf6B10Si31C2N50 film. The target to substrate distance was 100 mm and the substrate temperature was maintained at 450 °C. The substrates were held at a floating potential (i.e., the method to prepare well densified films without applying substrate bias) to reduce the ion-induced internal stresses in the film and improve their application potential. The film composition was determined by Rutherford backscattering spectrometry (RBS) and elastic recoil detection (ERD) methods using a Van de Graaf generator with a linear electrostatic accelerator. The annealing of the films was performed using a symmetrical high resolution Setaram TAG 2400 system (Caluire, France) in synthetic atmospheric air (flow rate of 1 L/h) from room temperature up to 1500 °C. The films were heated at a rate of 10 °C/min, and cooled down at a rate of 30 °C/min, respectively.
The crystallographic structure of the annealed films was first studied by X-ray diffraction (XRD) θ–2θ measurements in a Bruker D8 Advance Diffractometer (Billerica, MA, USA) using a Cu Kα radiation at voltage of 40 kV and current of 40 mA. The detailed microstructure of the annealed films was studied by TEM. Plan-view TEM samples were prepared by mechanical grinding and polishing, followed by dimpling using a Gatan Model 656 dimple grinder (Pleasanton, CA, USA) and Ar-ion milling in a Gatan Model 691 precision ion polishing system (PIPS). Cross-section TEM samples were prepared using focus-ion beam (FIB) in a FEI Strata 400 dual-beam system (Waltham, MA, USA) and further cleaned using PIPS. SAED, TEM and HRTEM images were recorded in a Hitachi H-9500 electron microscope (Tokyo, Japan) operated at 300 keV with a point resolution of 0.18 nm.

3. Results

3.1. XRD Analysis

The as-deposited and annealed films were first examined using θ–2θ XRD analysis. Both as-deposited Hf–B–Si–C–N films possess a pure amorphous structure (not shown here). XRD spectra of the annealed Hf6B10Si31C2N50 and Hf7B10Si32C2N44 films are presented in Figure 1. The spectra of both annealed films present a hexagonal Si3N4 (100) (h-Si3N4, PDF #:05-5074, a = 7.753 Å, c = 5.618 Å, P31c) [29] peak at 2θ angle of 13.23°, monoclinic HfO2 (001) (m-HfO2, PDF #:034-0104, a = 5.285 Å, b = 5.182 Å, c = 5.116 Å, β = 99.26°, P21/a) [29] peak at 2θ of 17.57°, Si3N4 (200) at 25.8°, m-HfO2 (002) at 35.61°, tetragonal HfO2 (211) (t-HfO2, PDF #:04-011-8820, a = 3.577 Å, c = 5.1996 Å, P42/nmc) [29] at 60.36°, m-HfO2 (401) at 71.77°, m-HfO2 (104) at 75.49° and orthorhombic HfO2 (311) (o-HfO2, PDF #:083-0808, a = 10.018 Å, b = 5.228 Å, c = 5.060 Å, Pbca) [29] and/or (102) at 36.58°.The peak located at 2θ angle of 30.29° can be identified as o-HfO2 (211) overlapped with t-HfO2 (101). The peak located at 2θ angle of 34.27° can be identified as m-HfO2 (200) overlapped with o-HfO2 (020) and the (111) of HfCxN1−x (which will be discussed in a later section). The peak at 34.66° corresponds to a superposition of Si3N4 (102) and m-HfO2 (020). The results indicate mainly formation of m-HfO2, o-HfO2, t-HfO2 along with h-Si3N4 in both annealed films. The XRD spectrum of the annealed Hf7B10Si32C2N44 film shows additional peaks at 39.55° and 57.18° closely corresponding to (200) and (220), respectively of face centered cubic (fcc) HfCN (PDF #: 2-2469, a = 4.586 Å, Fm-3m) [29].

3.2. TEM Studies

3.2.1. Microstructure of the Annealed Hf6B10Si31C2N50 Film

Overall Film Structure

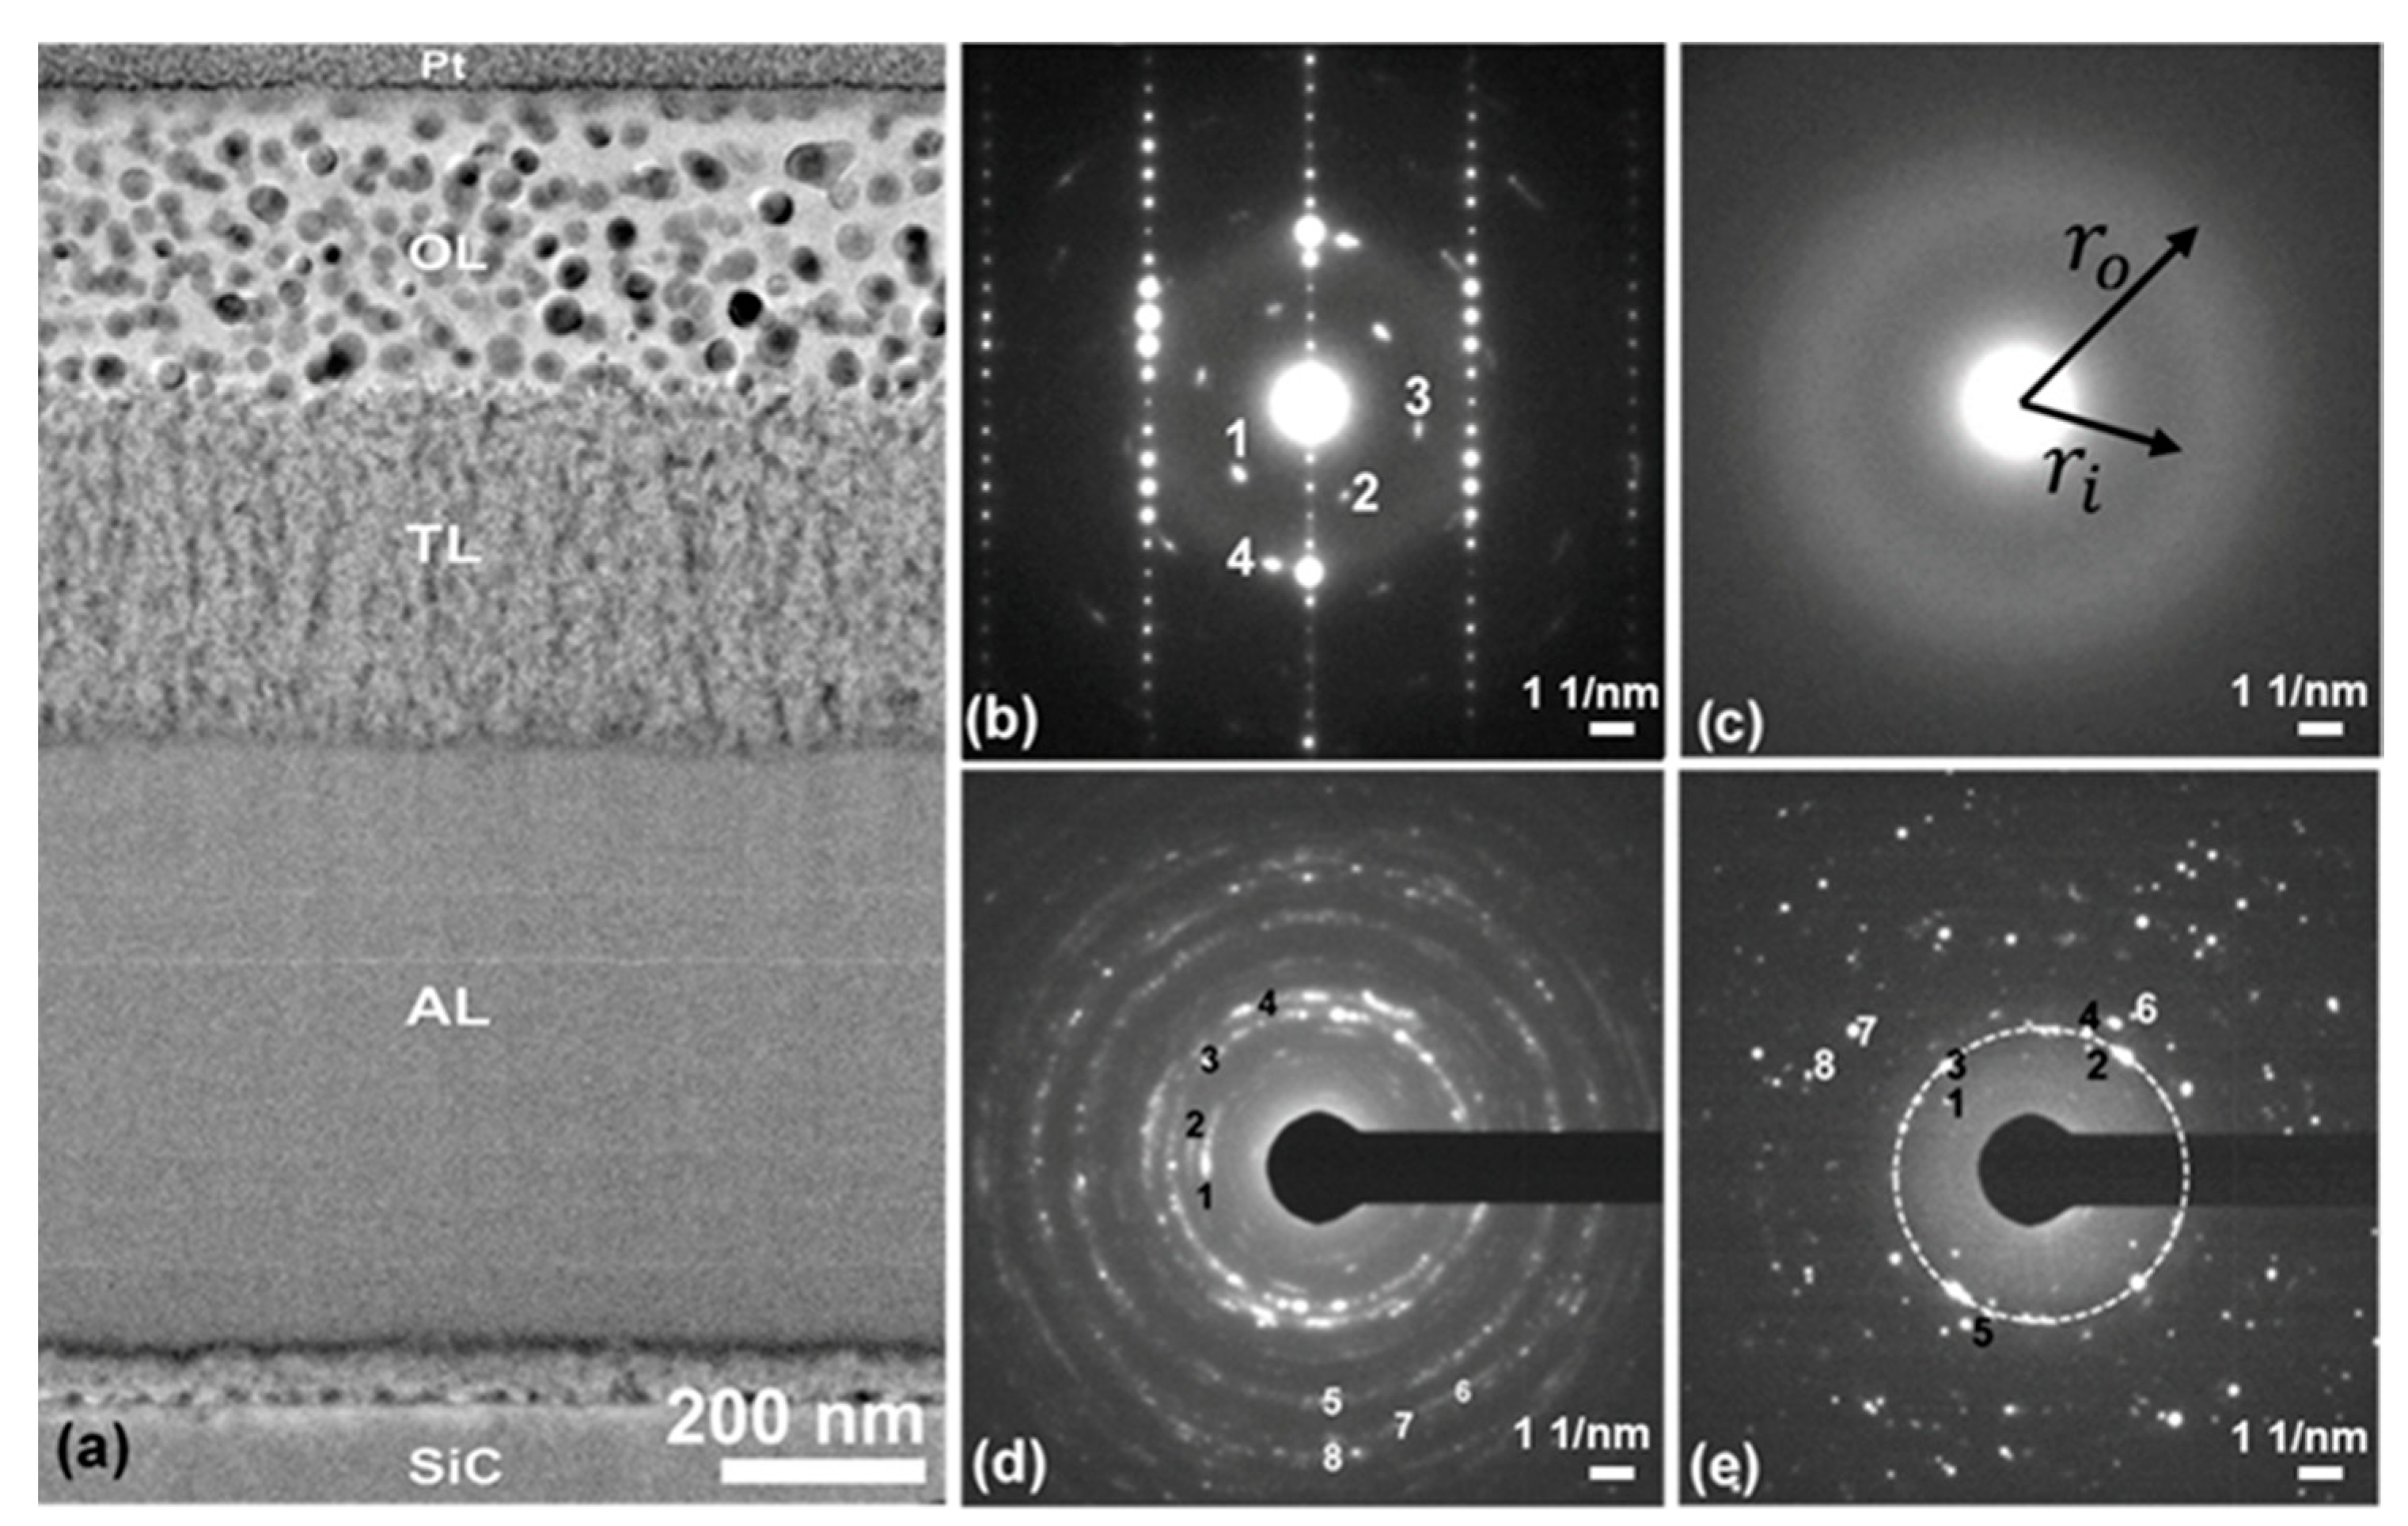
Figure 2a presents a cross-section TEM image of the annealed Hf6B10Si31C2N50 exhibiting a discrete three-layered structure: (i) a ~300 nm thick nanocomposite oxide layer (OL) with HfO2 nanoparticles dispersed in a rather amorphous (α) SiOx-based matrix on the top surface followed by (ii) a ~350 nm thick partially oxidized transition layer (TL) and (iii) a ~580 nm thick amorphous layer (AL). A thin (~50 nm in thickness) reaction zone (RZ) is also observed at the bottom resulting from the interaction of the film with the SiC substrate. Figure 2b is a SAED pattern taken from an area covering part of the SiC substrate, the RZ and a section of the AL. The SAED pattern presents a superposition of a single crystal diffraction pattern from the SiC substrate, the diffuse ring band from the amorphous layer and scattered diffraction spots 1, 2, 3 and 4 with lattice spacing of 4.30, 4.30, 3.87 and 2.60 Å, which can be indexed as the (101), (011), (110) and (112) of h-Si3N4, respectively. The four diffraction spots (1, 2, 3 and 4) construct to a single crystal diffraction pattern of the [111] zone of h-Si3N4 indicating formation of a large Si3N4 gain. Thus, during annealing some Si3N4 formation took place at the film/SiC interface.
The top oxide layer exhibits nearly the same microstructure as in the annealed Hf7B23Si17C4N45 [25,27], Hf6B21Si19C4N47 and Hf7B23Si22C6N40 films [26,28] studied previously, whereas the layers underneath present different structures. Figure 2c presents a SAED pattern taken from the amorphous-like layer in Figure 2a showing a circular diffraction band with the inner radius of ~3.4 Å and the outer radius of ~2.1 Å indicating formation of short range ordered sub nanometer scale clusters within the range from ~2.1 to 3.4 Å.
Figure 2d is a SAED pattern taken from the TL with a columnar structure appearance presenting diffraction rings 1, 2, 3, 4, 5, 6, 7 and 8 with a lattice spacing of 3.86, 3.32, 2.97, 2.58, 1.82, 1.60, 1.55 and 1.54 Å, respectively. The diffractions 1, 2, 6 and 8 were identified to be the (110), (200), (222) and (303) of h-Si3N4, respectively. The diffractions 3, 5 and 7 match the (101), (112) and (211) of t-HfO2, respectively. While the diffraction ring 4 possibly corresponds to (102) of h-Si3N4 or its superposition with the (110) of t-HfO2. It is noted that t-HfO2 can be stable not only at high temperatures but also at small particle sizes due to its low surface energy [25]. Figure 2d demonstrates the presence of h-Si3N4 and t-HfO2 phases in the TL in the annealed Hf6B10Si31C2N50 film.
Figure 2e is a SAED pattern from the top oxide layer presenting diffraction rings 1, 2, 3, 4, 5, 6, 7 and 8 with a lattice spacing of 3.66, 3.15, 2.97, 2.85, 2.56, 2.34, 1.83 and 1.68 Å, respectively. The diffractions 1, 2 and 4 can be identified as (011), (111) and (111) of m-HfO2, respectively. The diffractions 3, 5 and 6 match the (211), (002) and (021) of o-HfO2, respectively. While the diffraction rings 7 and 8 can correspond to superposition of the (022) m-HfO2 or (022) o-HfO2 and (202) m-HfO2 or (421) o-HfO2, respectively. Figure 2e shows the presence of both m-HfO2 and o-HfO2 in the top oxide layer.
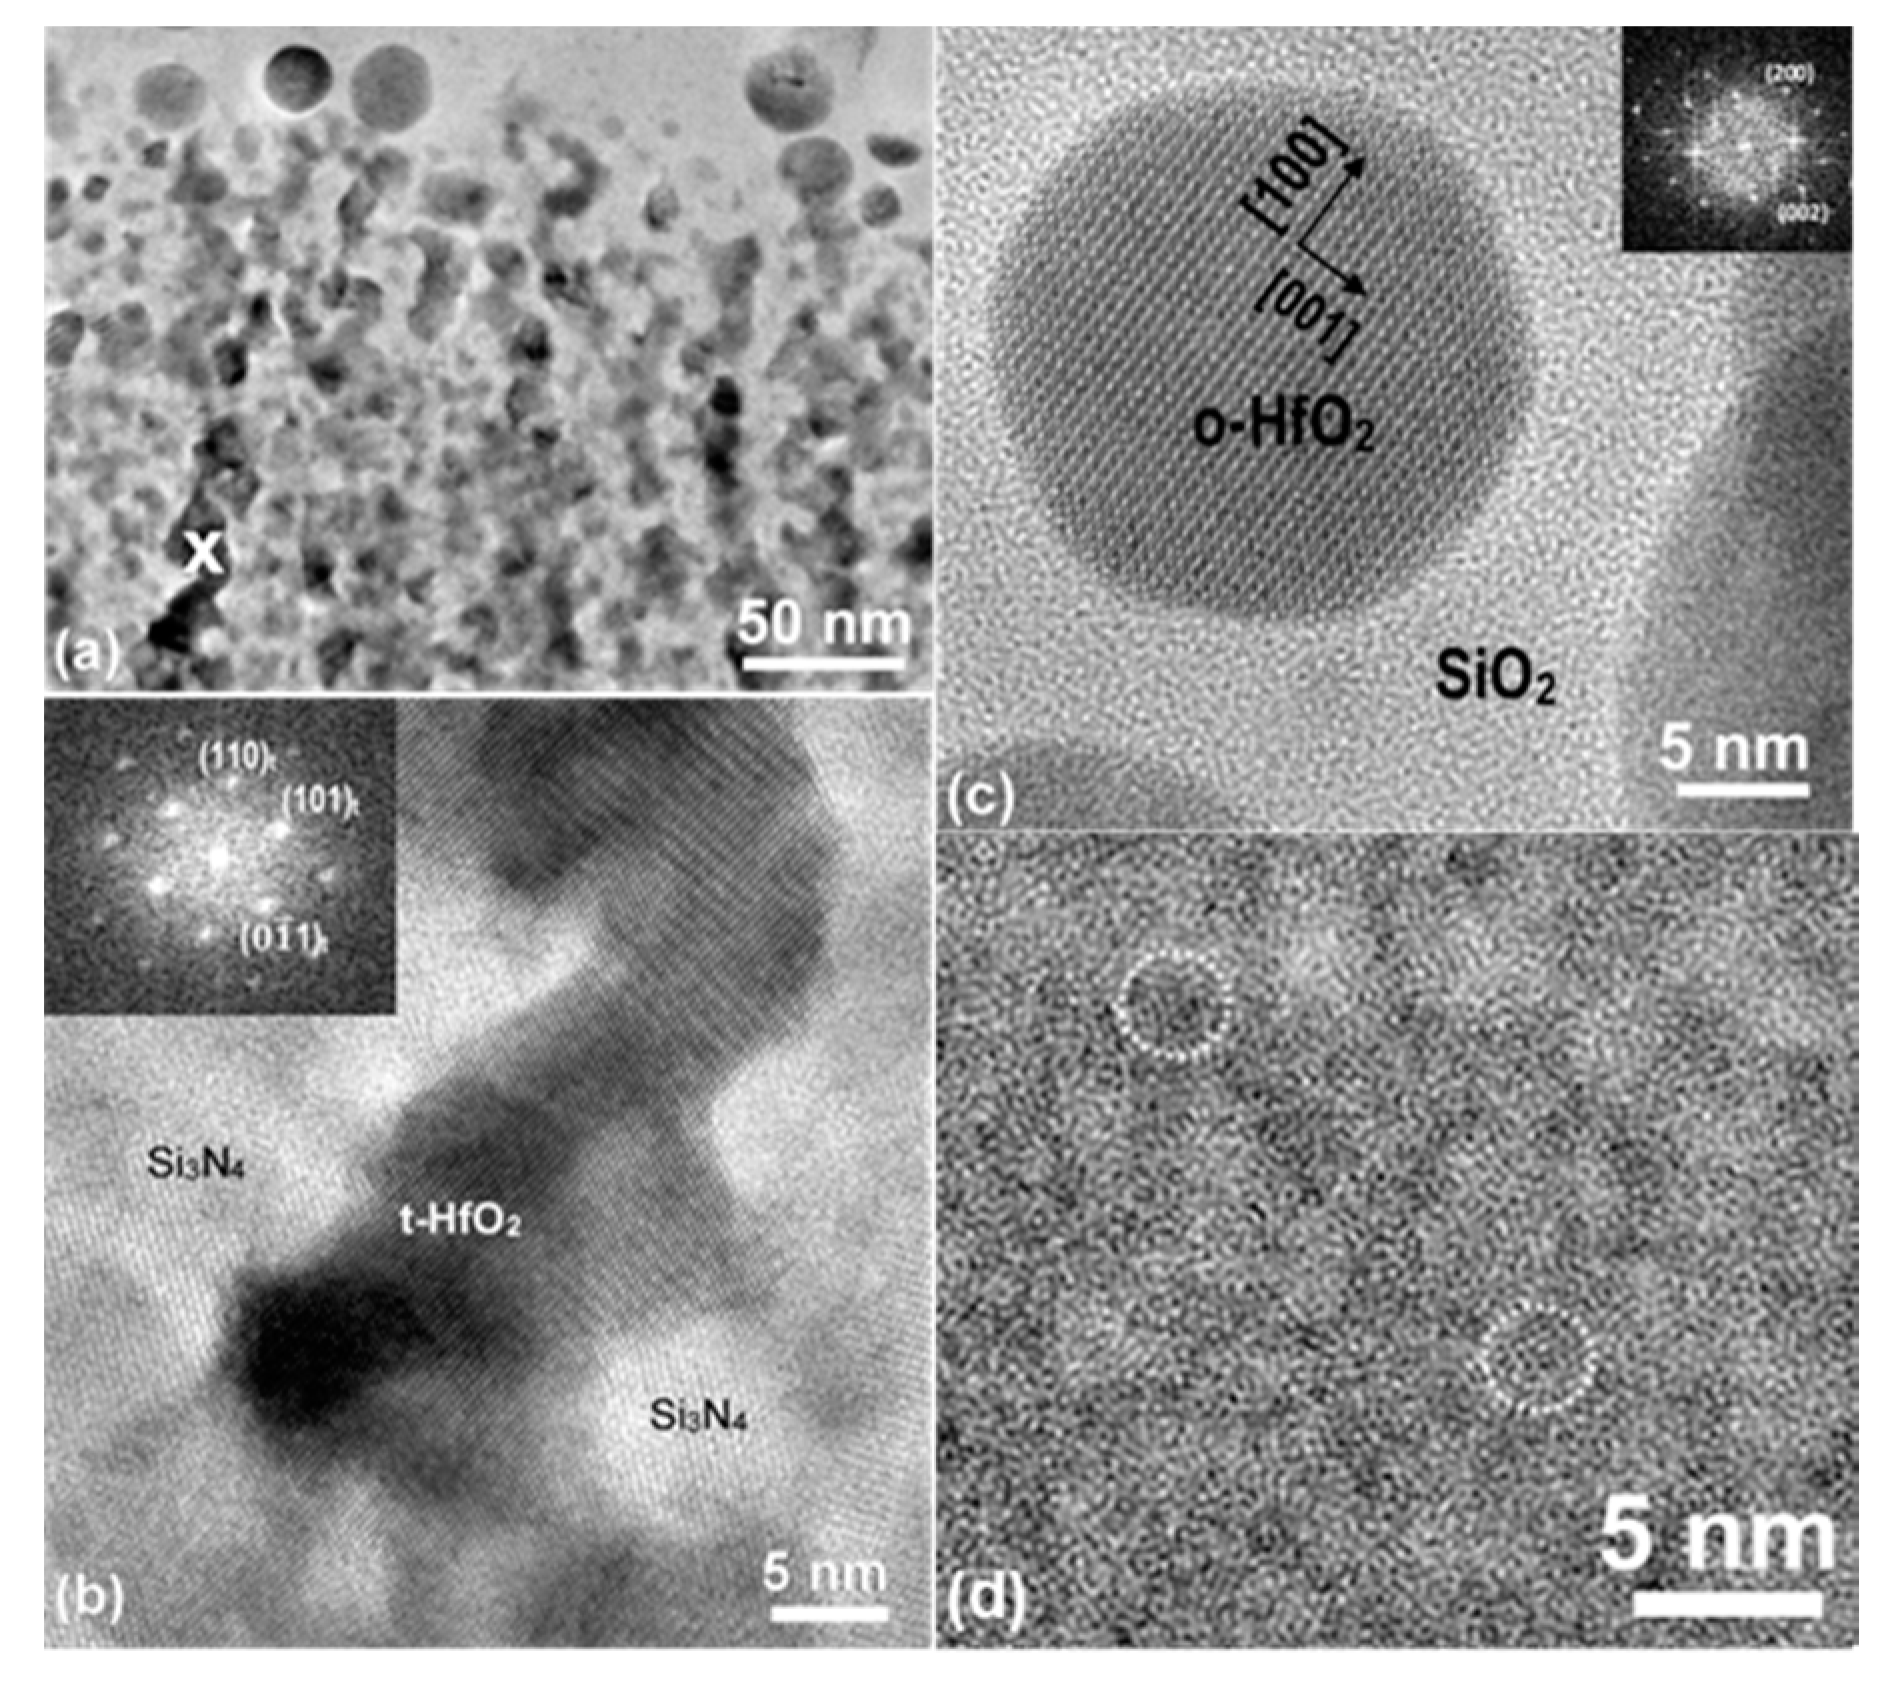
Figure 3a is a zoom-in cross-section TEM image of the TL in the annealed film presenting vertically oriented zig-zag dark columnar structures separated by bright structures with lateral dimensions of ~10–20 nm. X-ray energy-dispersive spectroscopy (EDS) analysis showed that the dark districts are Hf and O concentrated, whereas the bright regions Si and N concentrated. Thus, TL possesses a complex structure that was further analyzed.
Figure 3b is a HRTEM image taken from the area “x” in Figure 3a presenting a mixture of two phases. The dark grain possesses the same crystallographic orientation, and its fast Fourier transformation (FFT) presents a single crystal diffraction pattern of t-HfO2 along the (111) zone axis (inset in Figure 3b). The bright grains beside the dark t-HfO2 are Si3N4 grains as determined by HRTEM and FFT. The lattice fringes in the two Si3N4 grains with a spacing of 3.87 Å correspond to (110).
The top oxidized layer in the annealed Hf6B10Si31C2N50 film exhibited a similar microstructure to that reported previously [27,28]. The HfO2 nanoparticles are mostly spherical with their size varying from ~10 to ~35 nm and have a primary crystal structure of m-HfO2 and o-HfO2 regardless of the particle size. The spherical HfO2 nanoparticles are dispersed in amorphous α-SiO2. Figure 3c presents a typical HRTEM image of a [010] oriented o-HfO2 nanoparticle embedded in α-SiO2. Figure 3d is a HRTEM image from the amorphous layer in the annealed Hf6B10Si31C2N50 film presenting dark and bright contrast nano clusters of a size of a few nanometers. The darker regions likely correspond to Hf-rich areas, while the brighter ones to light element (Si, B, C, N) rich regions. Clusters of sub nanometer ordered structures were frequently observed in this layer.

Interface Structures

To understand the structure evolution in the different layers in the annealed Hf6B10Si31C2N50 film, we have studied the structure of the various interfaces using cross-section HRTEM.
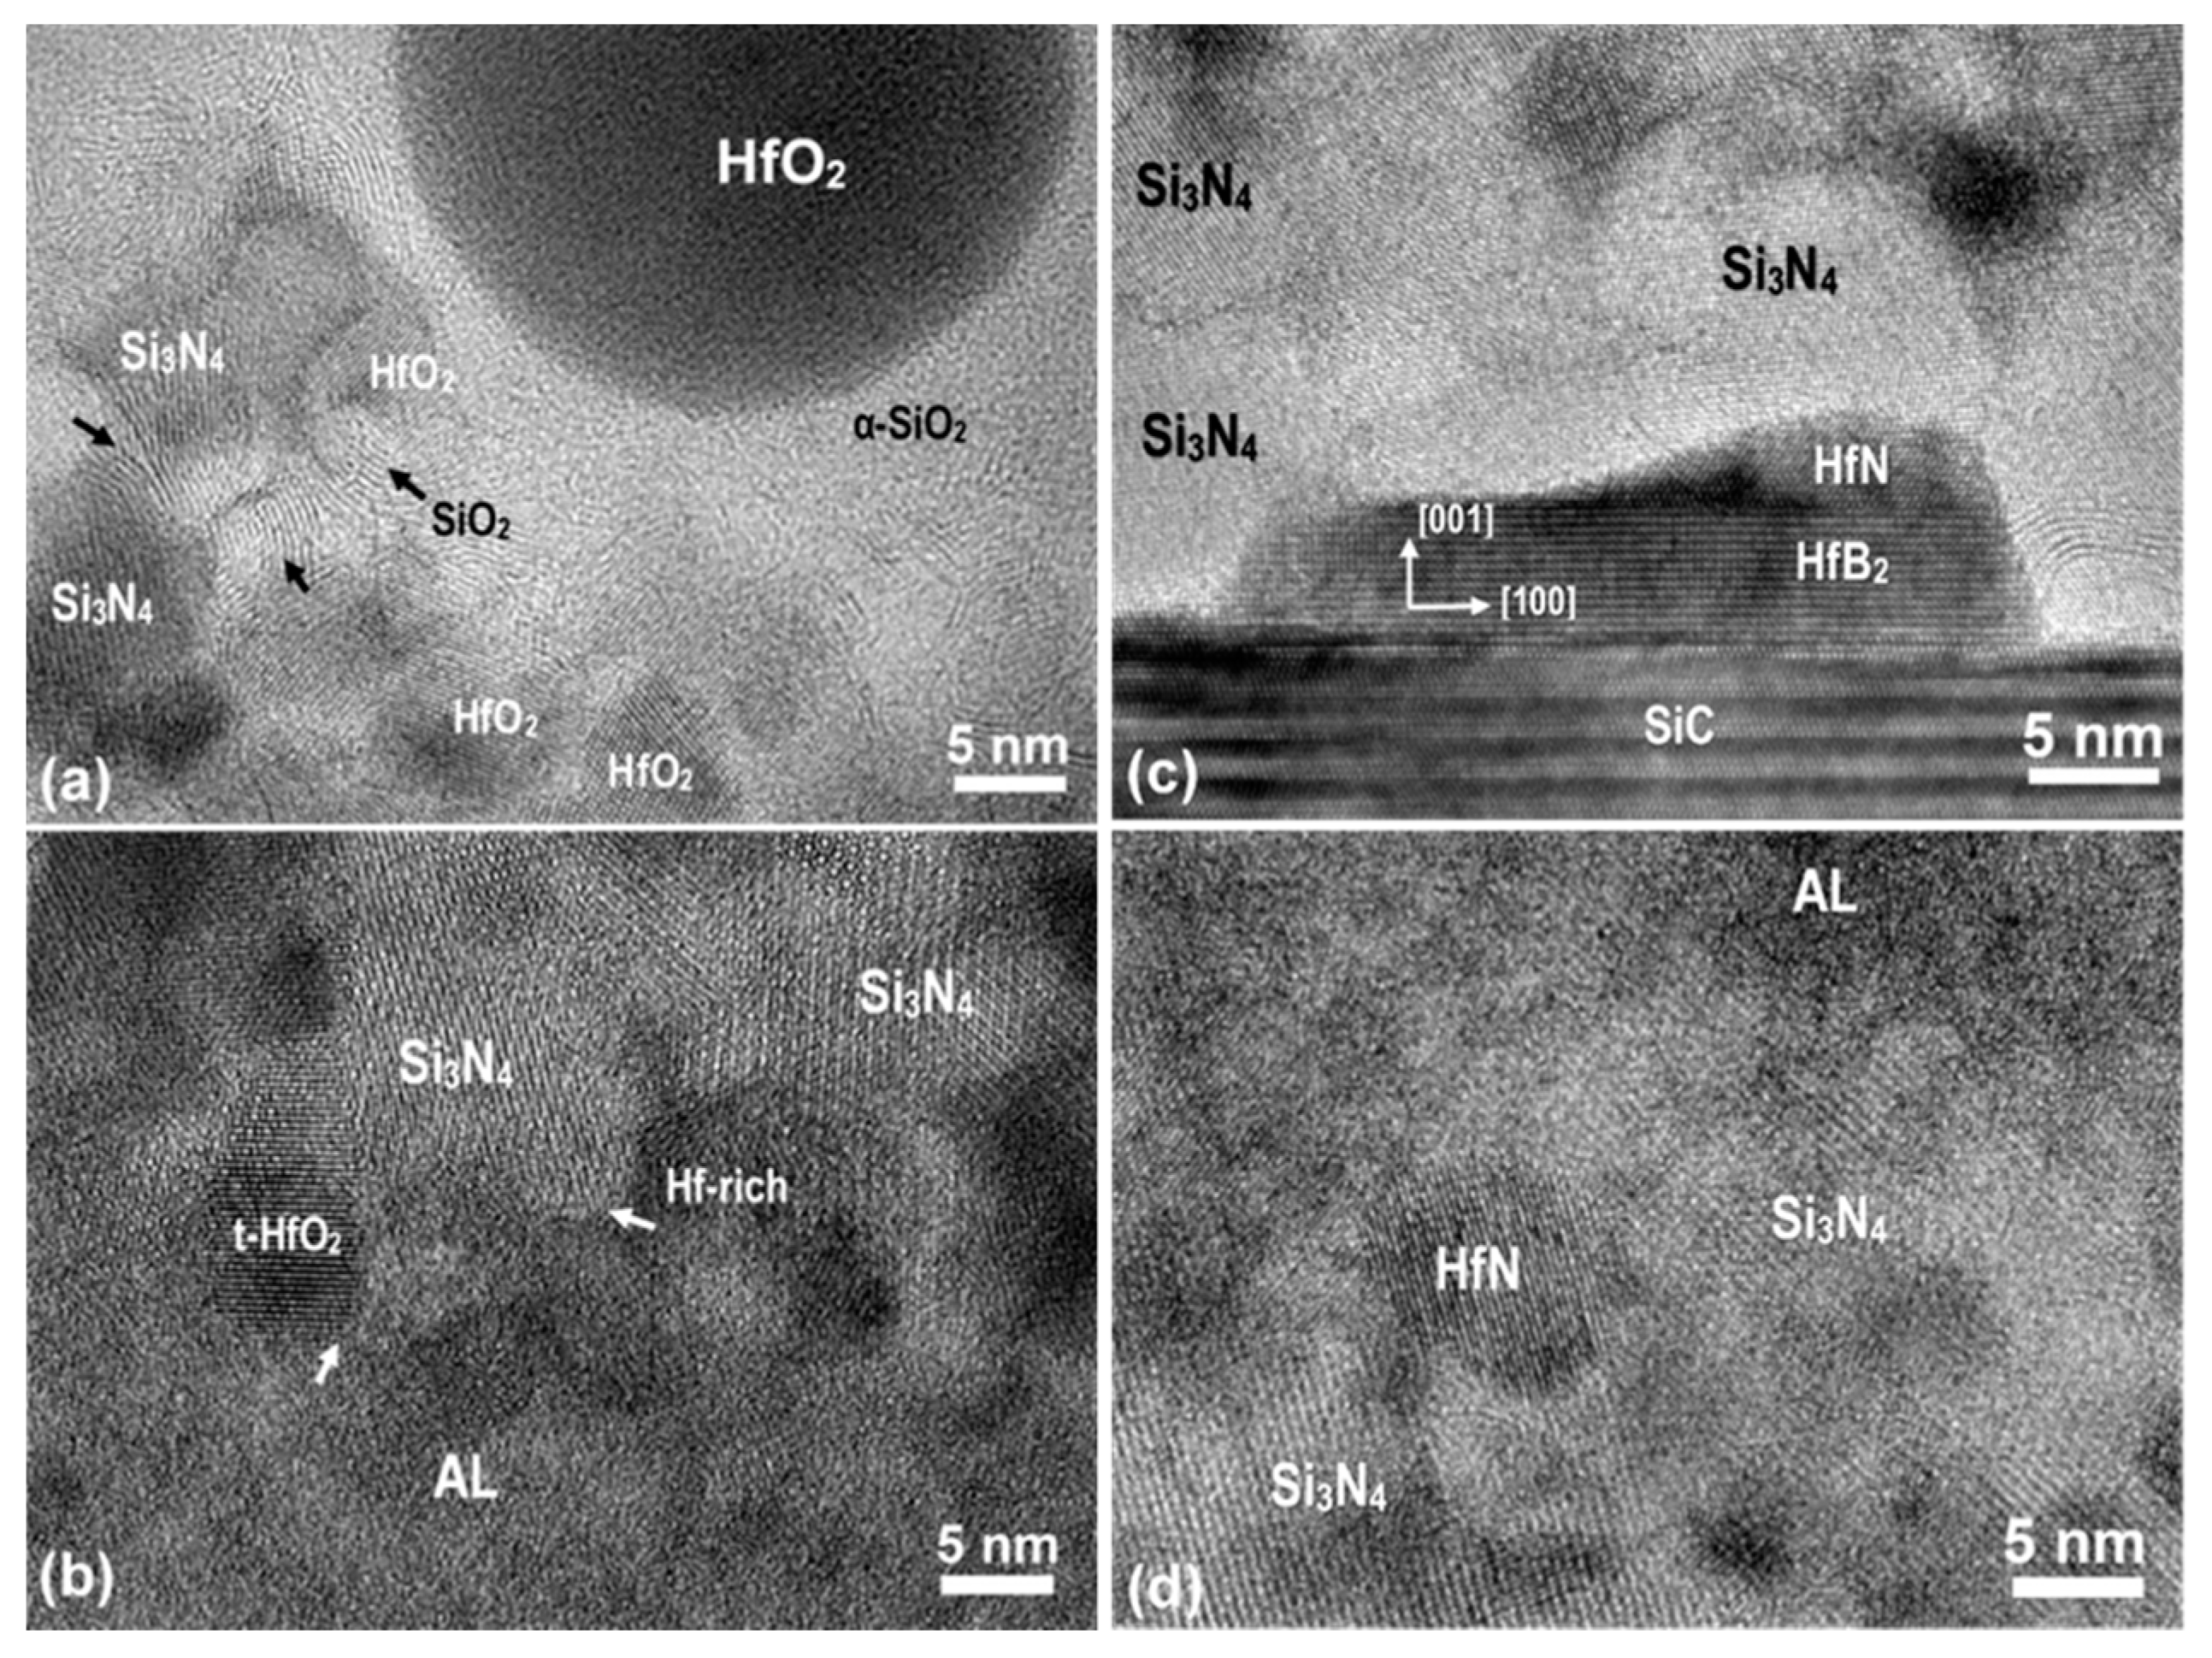
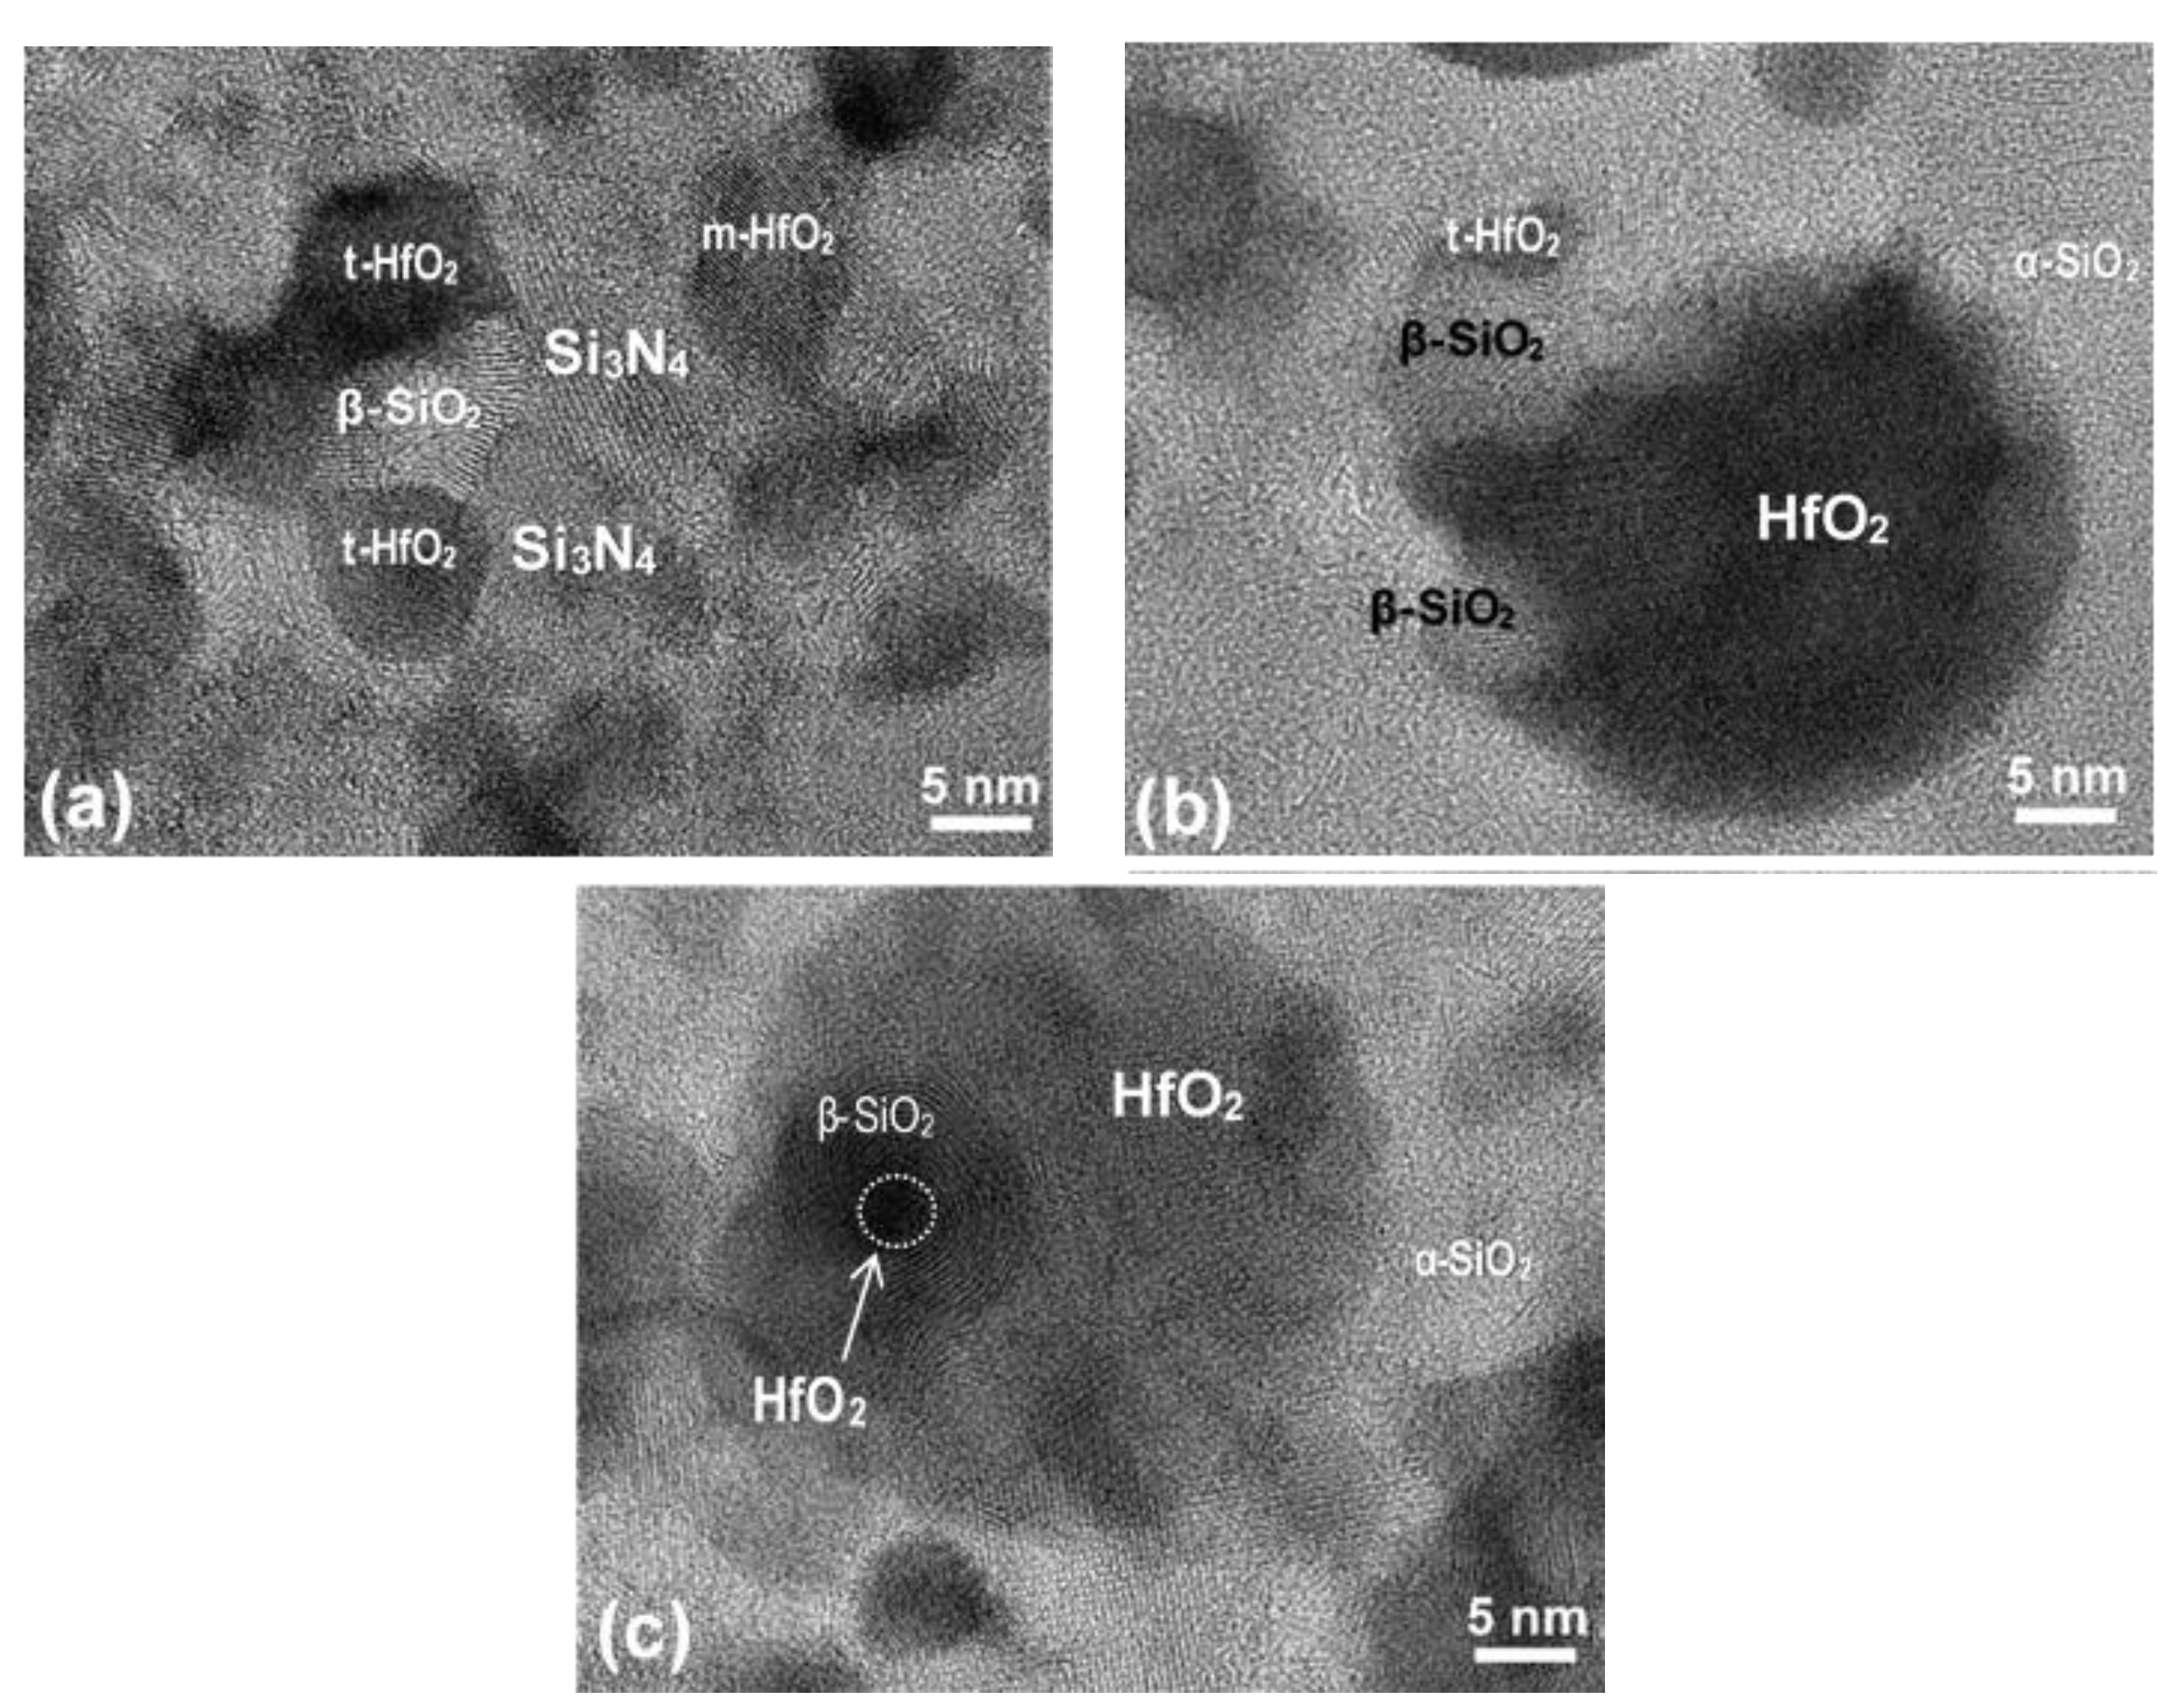
Interface between OL and TL. In the annealed Hf6B10Si31C2N50 film, the top OL consists of spherical m-HfO2 and o-HfO2 nanoparticles with a size of ~10–35 nm dispersed in α-SiO2 matrix. The TL is composed of irregular shaped t-HfO2 and Si3N4 nano structures indicating significant structure transformations occurred at the interface: (i) from the much smaller t-HfO2 nanoparticles in the TL to the large m-HfO2/o-HfO2 in the OL and (ii) from the crystalline Si3N4 into α-SiO2. Figure 4a is a HRTEM image of the interface between the OL and TL showing presence of a large HfO2 nanoparticle (~20 nm) and α-SiO2 on the top-right within the OL. Also, numerous small particles are present on the bottom-left within the TL, among which three irregular shaped small HfO2 particles with a size of ~5 nm and two small irregular shaped Si3N4 particles of ~6 nm, as determined by using the lattice spacing. It is noted that within the TL, the size of HfO2 and Si3N4 nano particles near the interface is smaller than those away from the interface. Furthermore remarkably, curved or onion-like lattice fringes with a spacing of ~3.4 Å (marked by arrow heads) were formed in the boundaries between Si3N4 and Si3N4, and Si3N4 and HfO2 nano grains. The curved or onion-like lattice fringes with a spacing of ~3.4 Å can be determined to be the (101) β-SiO2 [27,28]. Such evidence of β-SiO2 formation between Si3N4 nanoparticles shows initial oxidation of Si3N4 as a reaction of Si3N4 with O at the interface. The evidence also suggests that initially, the nucleation of β-SiO2 breaks a large Si3N4 nano grain into small irregular ones and simultaneously crashes down the large HfO2 grains within TL. Thus, it is likely that melting of β-SiO2 into α-SiO2 facilitated the merging of the small HfO2 nanoparticles forming large spherical HfO2 particles.
Interface between TL and AL. Within the TL in the annealed Hf6B10Si31C2N50 film, the lateral sizes of the dark HfO2 and bright Si3N4 structures remain uniform along the thickness of the layer. The interface between TL and the underneath AL shows a clear and discrete boundary as shown in Figure 2a. As oxygen diffuses through the TL to the TL/AL interface, oxidation of Hf-rich clusters and crystallization of Si3N4 crystalline take place. Figure 4b is a HRTEM image of the TL/AL interface presenting atomic structure of t-HfO2 and Si3N4 nano grains. Atomically sharp interfaces (marked by arrows) were formed between the t-HfO2 and/or Si3N4 grains and AL. This morphology clearly indicates the nucleation of these two phases at the interface. It should be noted that the dark and bright clusters in the AL are locally ordered metallic Hf-rich and light element rich (Si, B, C and N) structures, respectively. The former was oxidized forming t-HfO2, and the latter crystallized to Si3N4 structures indicating a rapid structural and composition transition by crossing the interface from AL to TL. Gradual Si3N4 and t-HfO2 phase separation, coalescence and alignment occurs resulting in the columnar appearance of the TL.
Interface between AL/SiC.Figure 4c is a HRTEM image taken from the interface between the AL and SiC substrate showing presence of a few large Si3N4 grains and a small HfB2 strip atomically attached to SiC substrate and to a small HfN grain on the top. HRTEM studies of numerous regions of the interlayer along the interface show that HfN and HfB2 phase are only minor structures in this zone and almost all of them are attached to the SiC substrate. The formation of the thin interlayer with primary Si3N4 and minor HfB2 and HfN phases close to the SiC substrate is most likely caused by a thermal transport effect [30] from the SiC substrate resulting in localized partial recrystallization.
Figure 4d is a HRTEM image taken from a region covering the bottom of the amorphous layer and the top of the recrystallized interlayer showing presence of Si3N4 and HfN. The lattice fringes in Si3N4 have a spacing of 4.3 Å corresponding to the (101) of h-Si3N4, while those in HfN have a spacing of 2.61 Å closely corresponding to the (111) of HfN. Thus, the thin recrystallized interlayer is mainly composed of h-Si3N4 and HfN.

Microstructure within the Film Plane

We have studied the multilayered complex structure in the annealed Hf6B10Si31C2N50 film over large areas in the film plane using plan-view TEM.
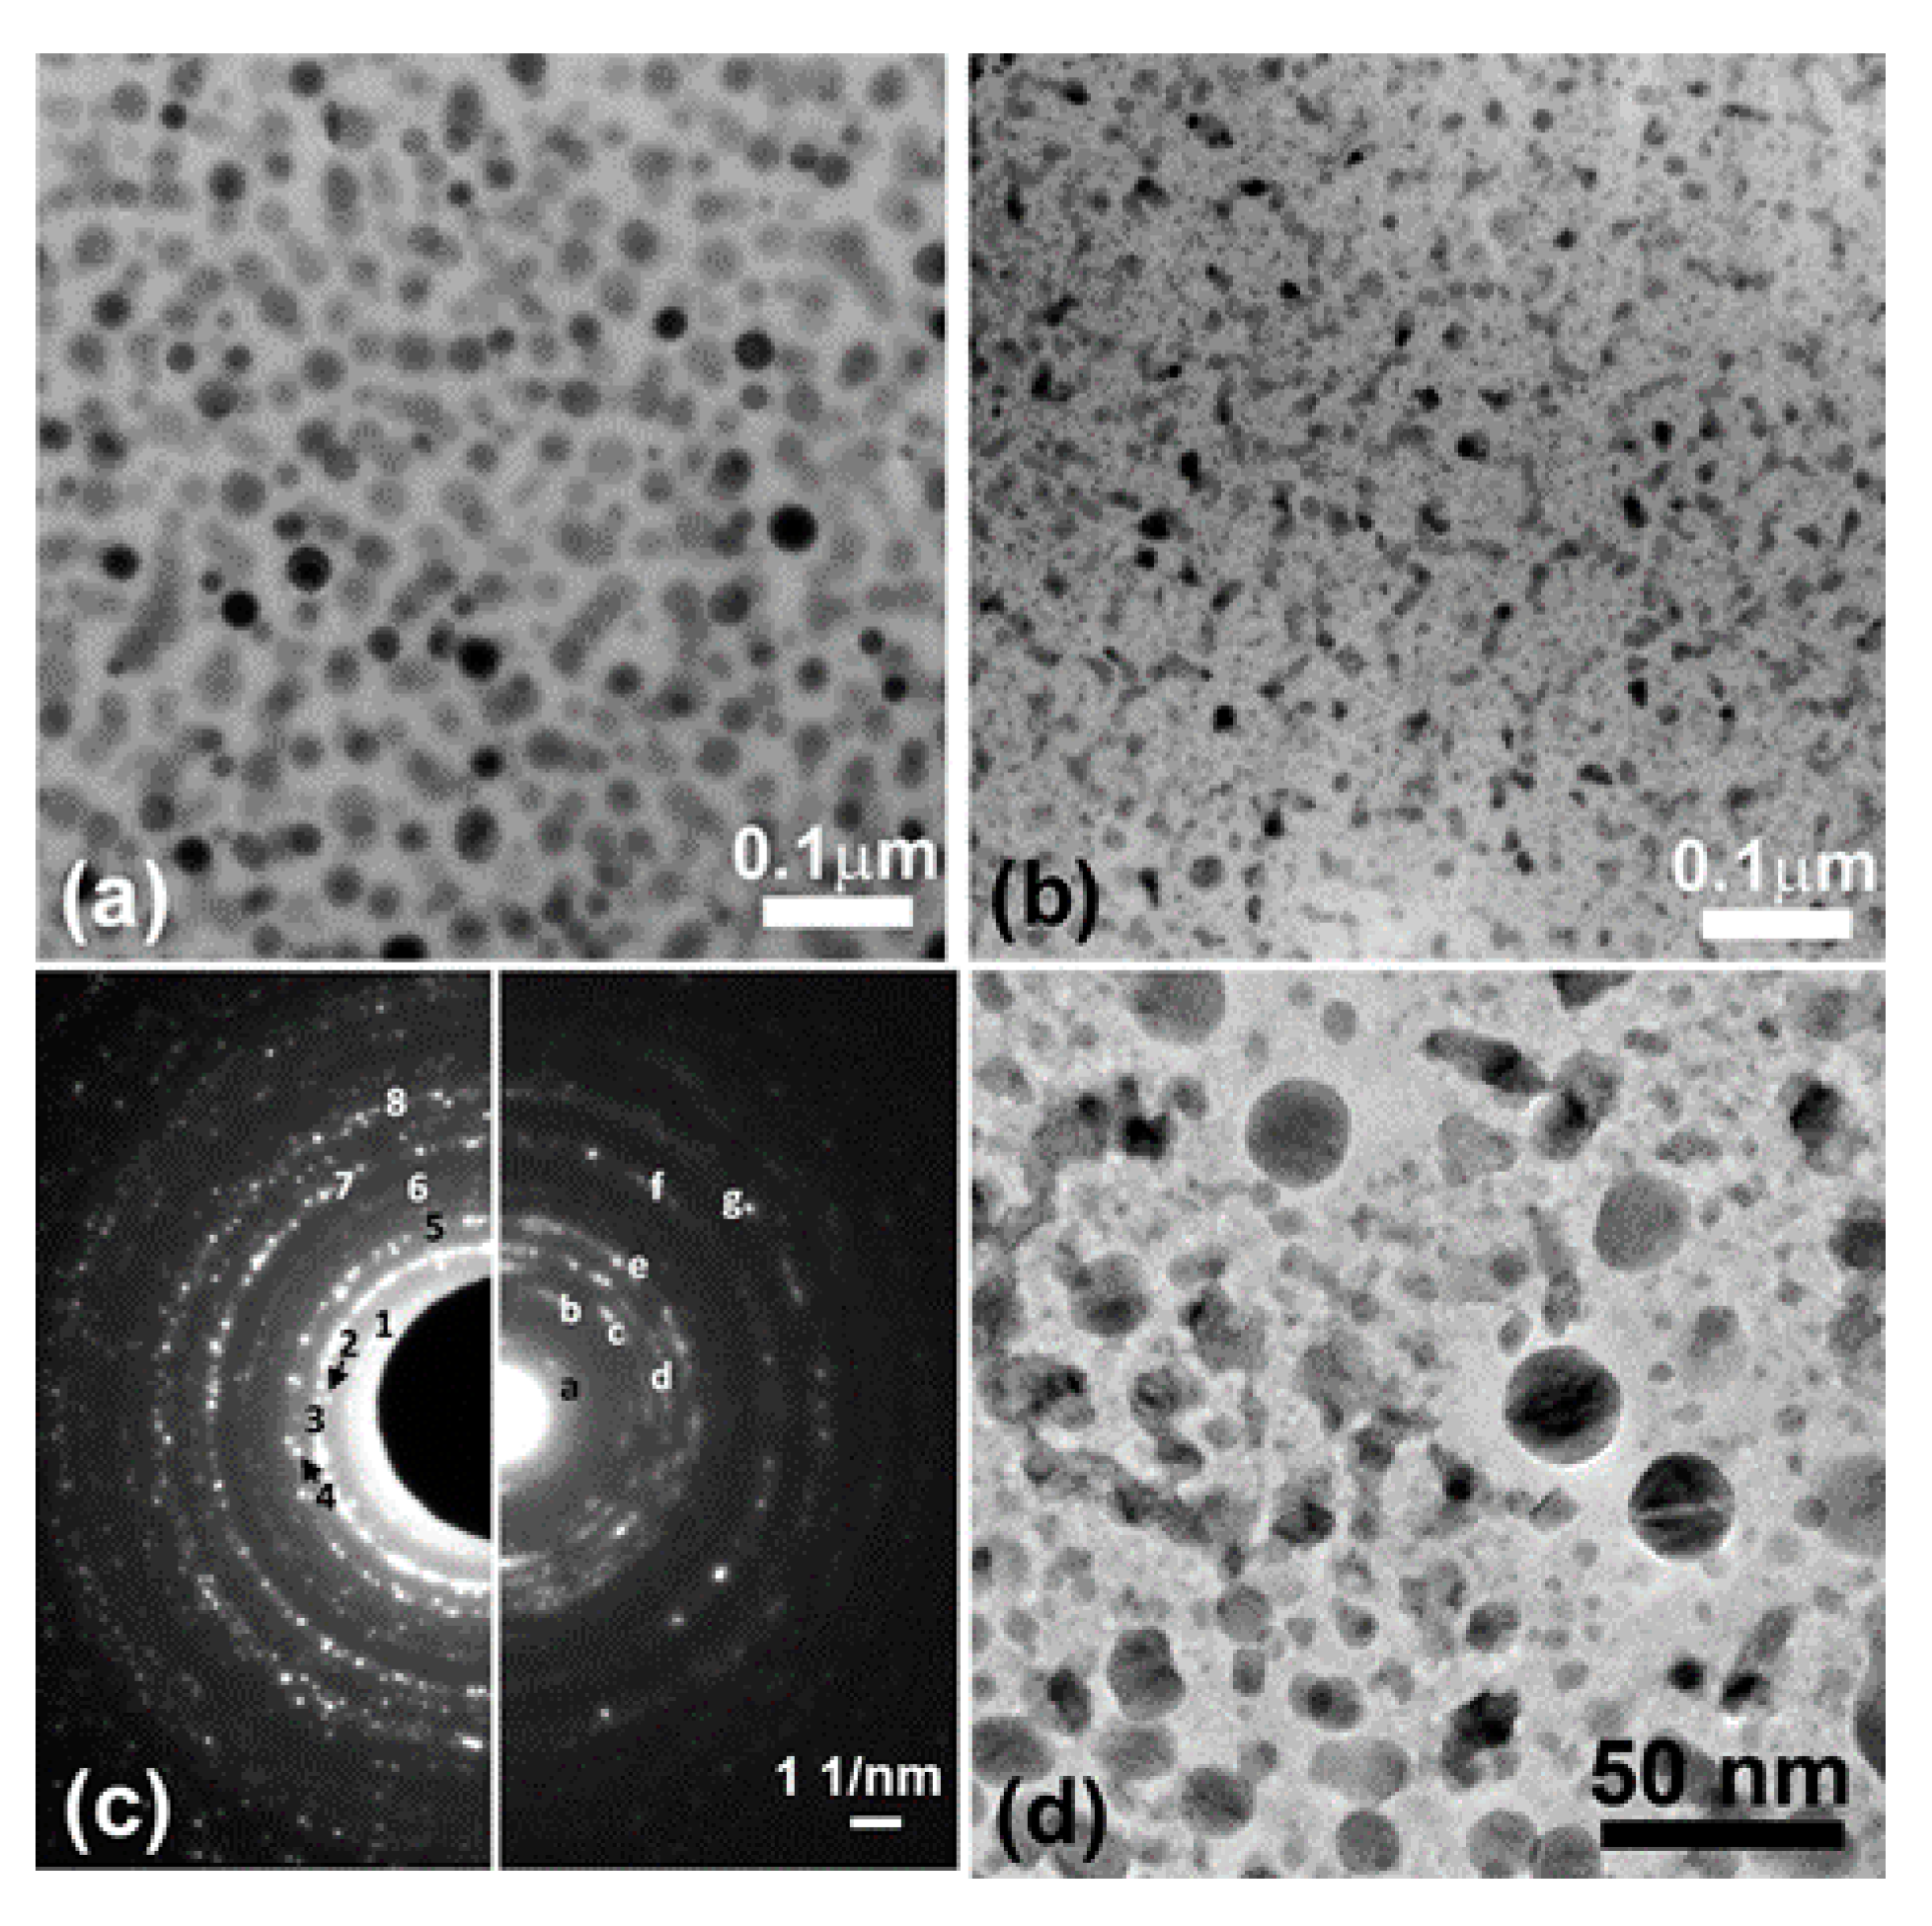
Overall structure.Figure 5a is a TEM image of the plan-view top oxide layer obtained by removing the underneath layers and substrate. It presents distribution of the spherical HfO2 nanoparticles (black dots) with a very narrow size range from ~10 to 35 nm. It is quite interesting to note that the HfO2 nanoparticles are not homogenously arranged within the film plane but densely packed along certain lines and loosely packed over the rest areas. The densely packed nanoparticles yield a trace pattern like the one exhibited by HfO2 in the TL.
Figure 5b shows a TEM image of the plan-view TL obtained by removing the top oxide layer and the bottom layers and substrate. The HfO2 structures (dark contrast) are linked together generating borders enclosing Si3N4 (bright contrast). The pattern constructed by the Si3N4 grains and HfO2 boundaries in Figure 5b exhibits a rough similarity to the trace pattern observed in Figure 5a. Figure 5b presents a cross-section of the columnar structure observed in Figure 2a and Figure 3a. Based on the cross-section and plan-view TEM images, the TL structure in a three-dimensional (3D) space can be restored. During annealing of the Hf6B10Si31C2N50 film, the vertical oriented columnar HfO2 nanostructures with a lateral size of a few nanometers were formed and the interval regions in between were filled with Si3N4 structures with lateral size from ~40 to ~80 nm which possibly consisting of numerous Si3N4 sub-grains with their boundaries occupied by HfO2 fine structures.
Figure 5c presents a comparison of SAED patterns taken from the top OL (left) and the TL (right). Major diffraction rings or spots 1, 2, 3, 4, 5, 6, 7 and 8 on the left have a lattice spacing of 3.67, 3.15, 2.96, 2.62, 2.54, 2.08, 1.82 and 1.52 Å, respectively. The diffractions 1 and 2 can be uniquely identified as (110) and (111) of m-HfO2, while 3, 4, 6, 7 and 8 correspond to (211), (020), (212), (022) and (213) of o-HfO2, respectively. The diffraction ring 5 can correspond to superposition of the (002) m-HfO2 and/or (002) o-HfO2. This diffraction pattern further confirms the presence of m-HfO2 and o-HfO2 in the top oxide layer. Major diffraction rings or spots a, b, c, d, e, f and g on the right side in Figure 5c have a lattice spacing of 6.67, 3.84, 3.35, 2.98, 2.54, 1.78 and 1.53 Å, respectively. The diffractions a, b, c, f and g can be identified to be the (100), (110), (200), (311) and (320) of h-Si3N4, d and e match the (101) and (110) t-HfO2, respectively. The comparison of the two SAED patterns provides additional evidence of formation of totally different phases in the top OL and the TL underneath.
Figure 5d shows a TEM image of the plan-view interface between the top OL and TL in which the spherical dark particles are from OL whereas the irregular shaped particles are from TL. The surrounding areas around the large spherical HfO2 particles show a very clean homogeneous bright contrast revealing the growth of the HfO2 is accomplished by consuming the surrounding HfO2 via attraction and migration leaving Hf free surroundings. Such a growth process is also accompanied by firstly oxidizing the Si3N4 to β-SiO2 followed by further transition to α-SiO2.
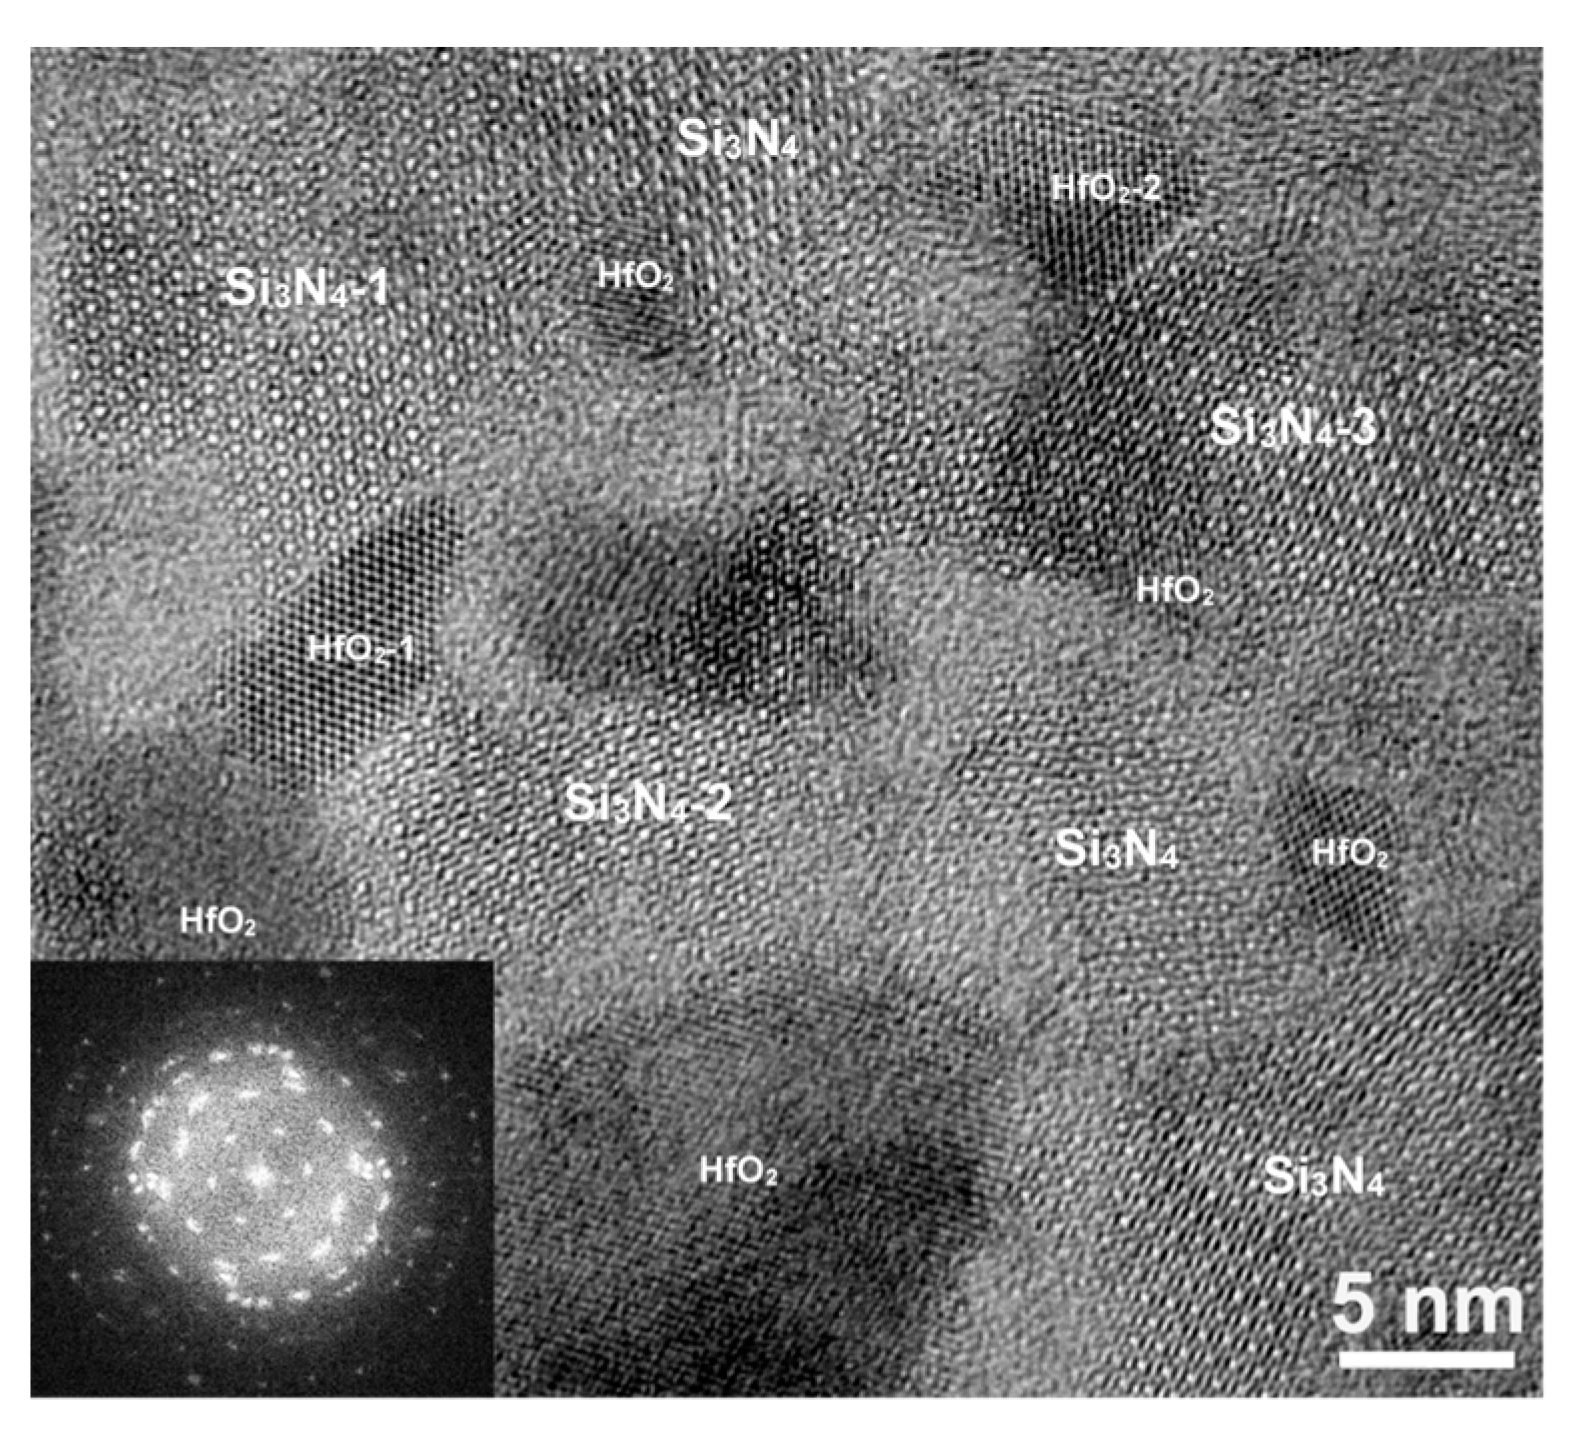
Figure 6 is a plan-view HRTEM image of an interval area of Si3N4 between columnar t-HfO2 in the TL. The inset FFT was calculated from the entire image. The inner spots present a nearly perfect hexagonal reciprocal pattern indicating the Si3N4 grains in the image possess nearly identical orientation with their (001) direction perpendicular to the image. The HfO2 nanoparticles are directly attached to the Si3N4 without any transition layers or material in between. For instance, grain HfO2-1 has an atomically sharp interface or boundary with respect to the Si3N4-1 and Si3N4-2 on both sides and grain HfO2-2 directly bonds to the Si3N4-3 with an abrupt atomically sharp interface. The results indicate that the Si3N4 phase within the interval area in TL could be either a single crystal grain or multi-grains possessing nearly the same orientation with the (001) parallel to the normal of the film plane and the boundaries were sealed with HfO2 nanoparticles.
Structure transformation at the OL/TL interface. As stated earlier, crossing the interface between TL and OL, Si3N4 structure was firstly transformed into β-SiO2 onion structure followed by a rapid transition into α-SiO2. In the meantime, the smaller t-HfO2 nano particles joined and coarsened the m-/o-HfO2 particles. To understand such structure transitions, we have focused on the TL/OL interface structure. Figure 7a is a HRTEM image taken from the interface in a plan-view TEM foil presenting a few Si3N4 and HfO2 grains. Formation of a β-SiO2 between two t-HfO2 grains was revealed. Within the TL, the t-HfO2 particles are separated by Si3N4. The observation of the β-SiO2 between two t-HfO2 particles indicates the transformation of Si3N4 to β-SiO2. Figure 7a also shows that the curved lattice fringes of β-SiO2 are directly attached to two Si3N4 grains on the right side providing strong evidence that oxidation of Si3N4 is linked to its transformation to β-SiO2.
Figure 7b is a HRTEM image presenting an incomplete/growing spherical o-HfO2 nanoparticle with attachments of β-SiO2 and t-HfO2 structures. The lattice fringes in the small t-HfO2 grain have a spacing of 2.95 Å, which is also close to the lattice space of (211) of o-HfO2. The attachment of the small t-HfO2 grain to the large o-HfO2 appears via a connection of a β-SiO2 structure in between. The evidence suggests that “melting” β-SiO2 to amorphous α-SiO2 facilitates the coalescence of the t-HfO2 grain with the large o-HfO2 progressing its growth process. Figure 7c is a HRTEM image showing a near perfect β-SiO2 onion structure overlaid on a large HfO2 spherical particle. The dark core of the onion structure presents lattice fringes with a spacing of 2.08 Å that can be identified as the (212) of o-HfO2 structure. This result suggests that the β-SiO2 onion structure plays an additional catalytic role in the growth of HfO2 particles in addition to the heat resistance role reported previously [27,28].

3.2.2. Microstructure of the Annealed Hf7B10Si32C2N44 Film

Overall Film Structure

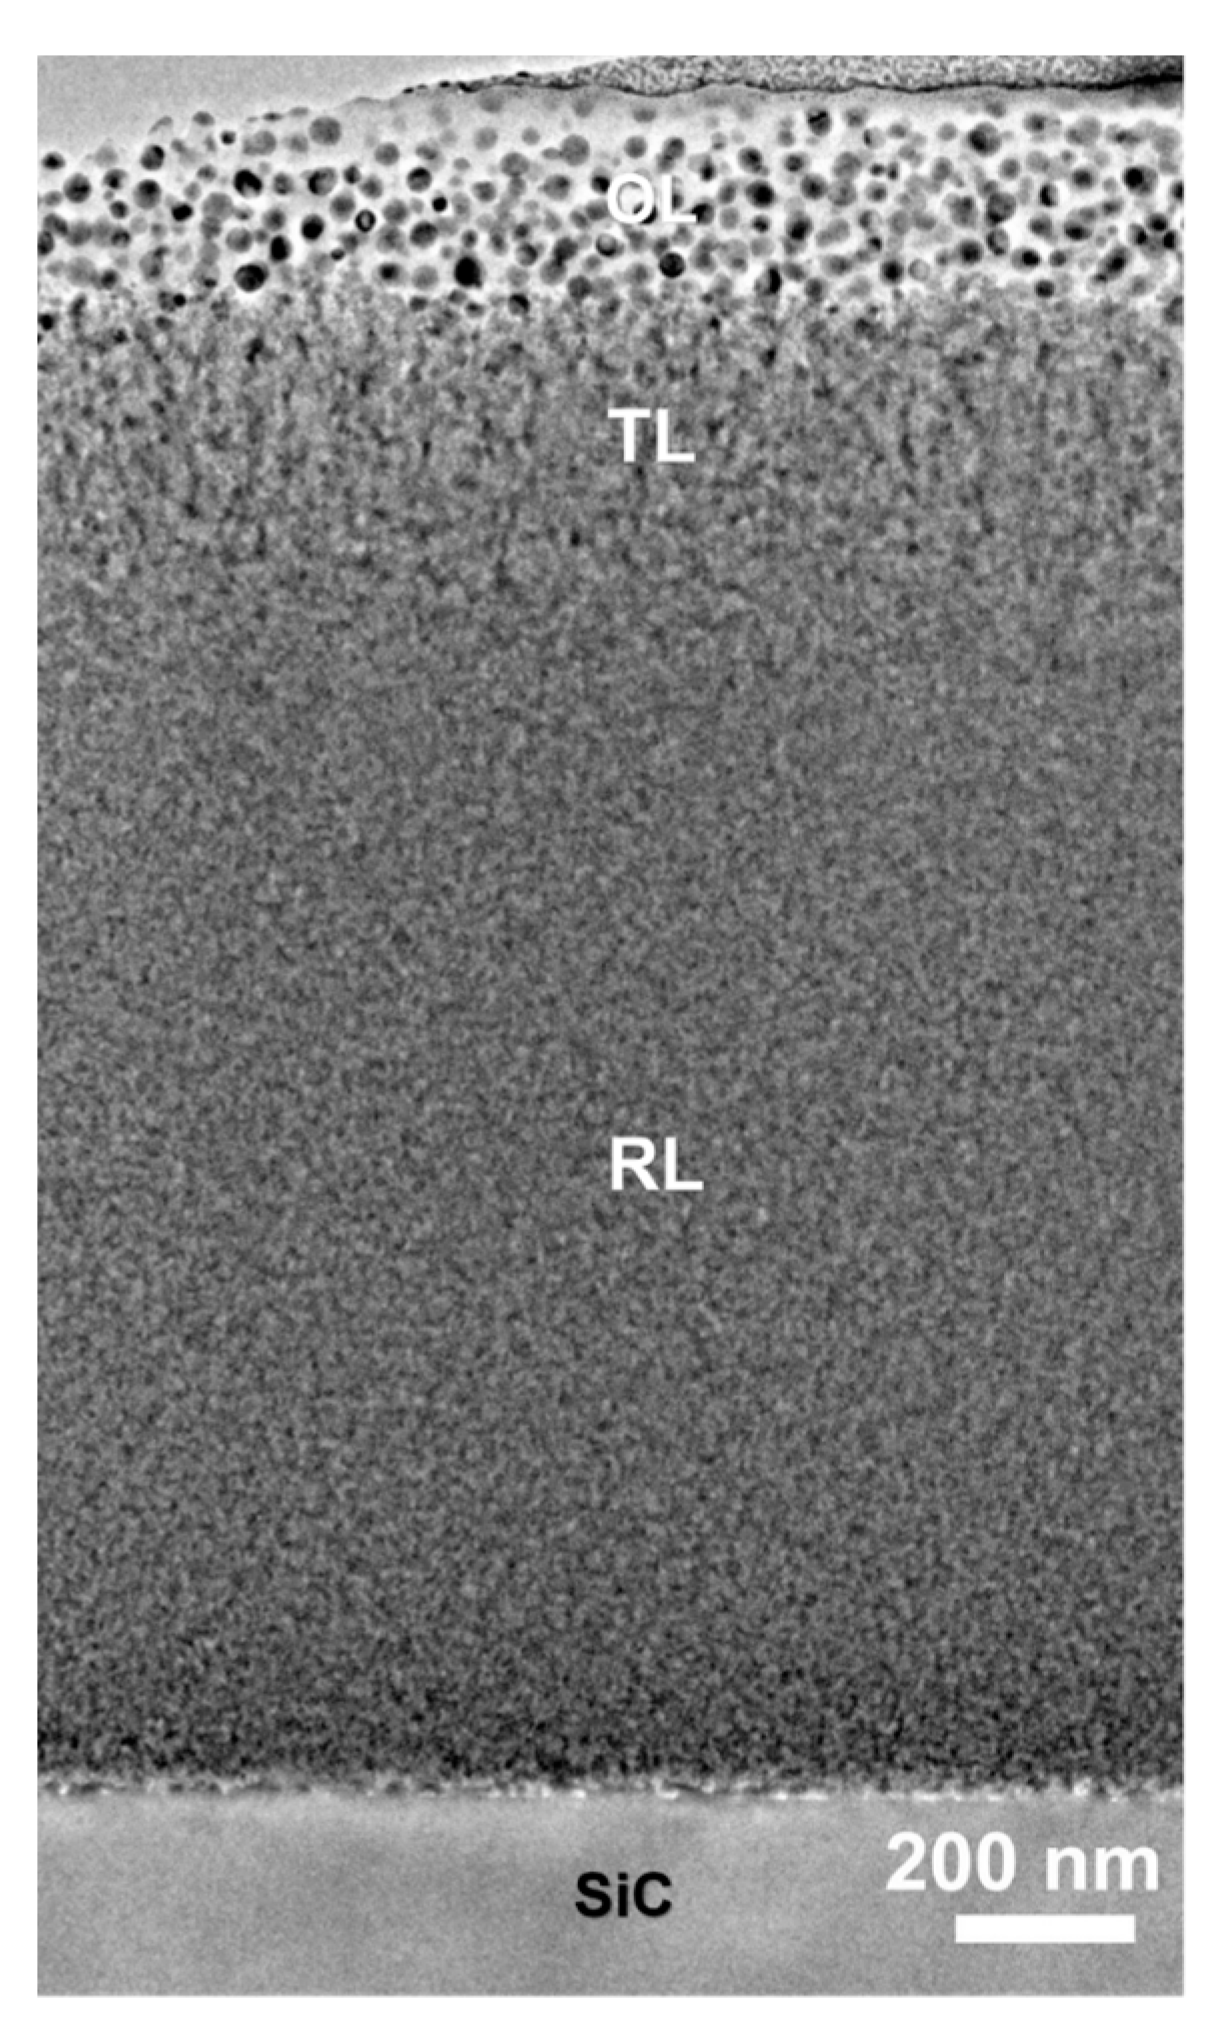
Figure 8 shows a cross-section TEM image of the annealed Hf7B10Si32C2N44 film presenting a nanocomposite oxide layer on the top (~300 nm thick) followed by a transition layer (~300 nm thick) and a partially recrystallized layer (RL). Figure 9 presents zoom-in TEM images taken from different regions in the annealed film. The top OL, Figure 9a, possesses similar microstructure characteristics to the annealed Hf6B10Si31C2N50 film in Figure 2a, the annealed Hf7B23Si17C4N45 [25,27], Hf6B21Si19C4N47 and Hf7B23Si22C6N40 films [26,28] studied previously. The TL has a similar appearance to that in the Hf6B10Si31C2N50 film, Figure 3a, but with more discontinuities in the dispersed HfO2 structures in the SiOx-based matrix, Figure 9b. The RL exhibits a uniform nanocomposite structure of dark and bright domains at its bottom, Figure 9c, and top, Figure 9d, sections. A similar, very thin interaction zone with the SiC substrate was also observed in this annealed film, Figure 8, containing Si3N4, small HfN phases and HfB2 strips atomically attached to the SiC substrate.
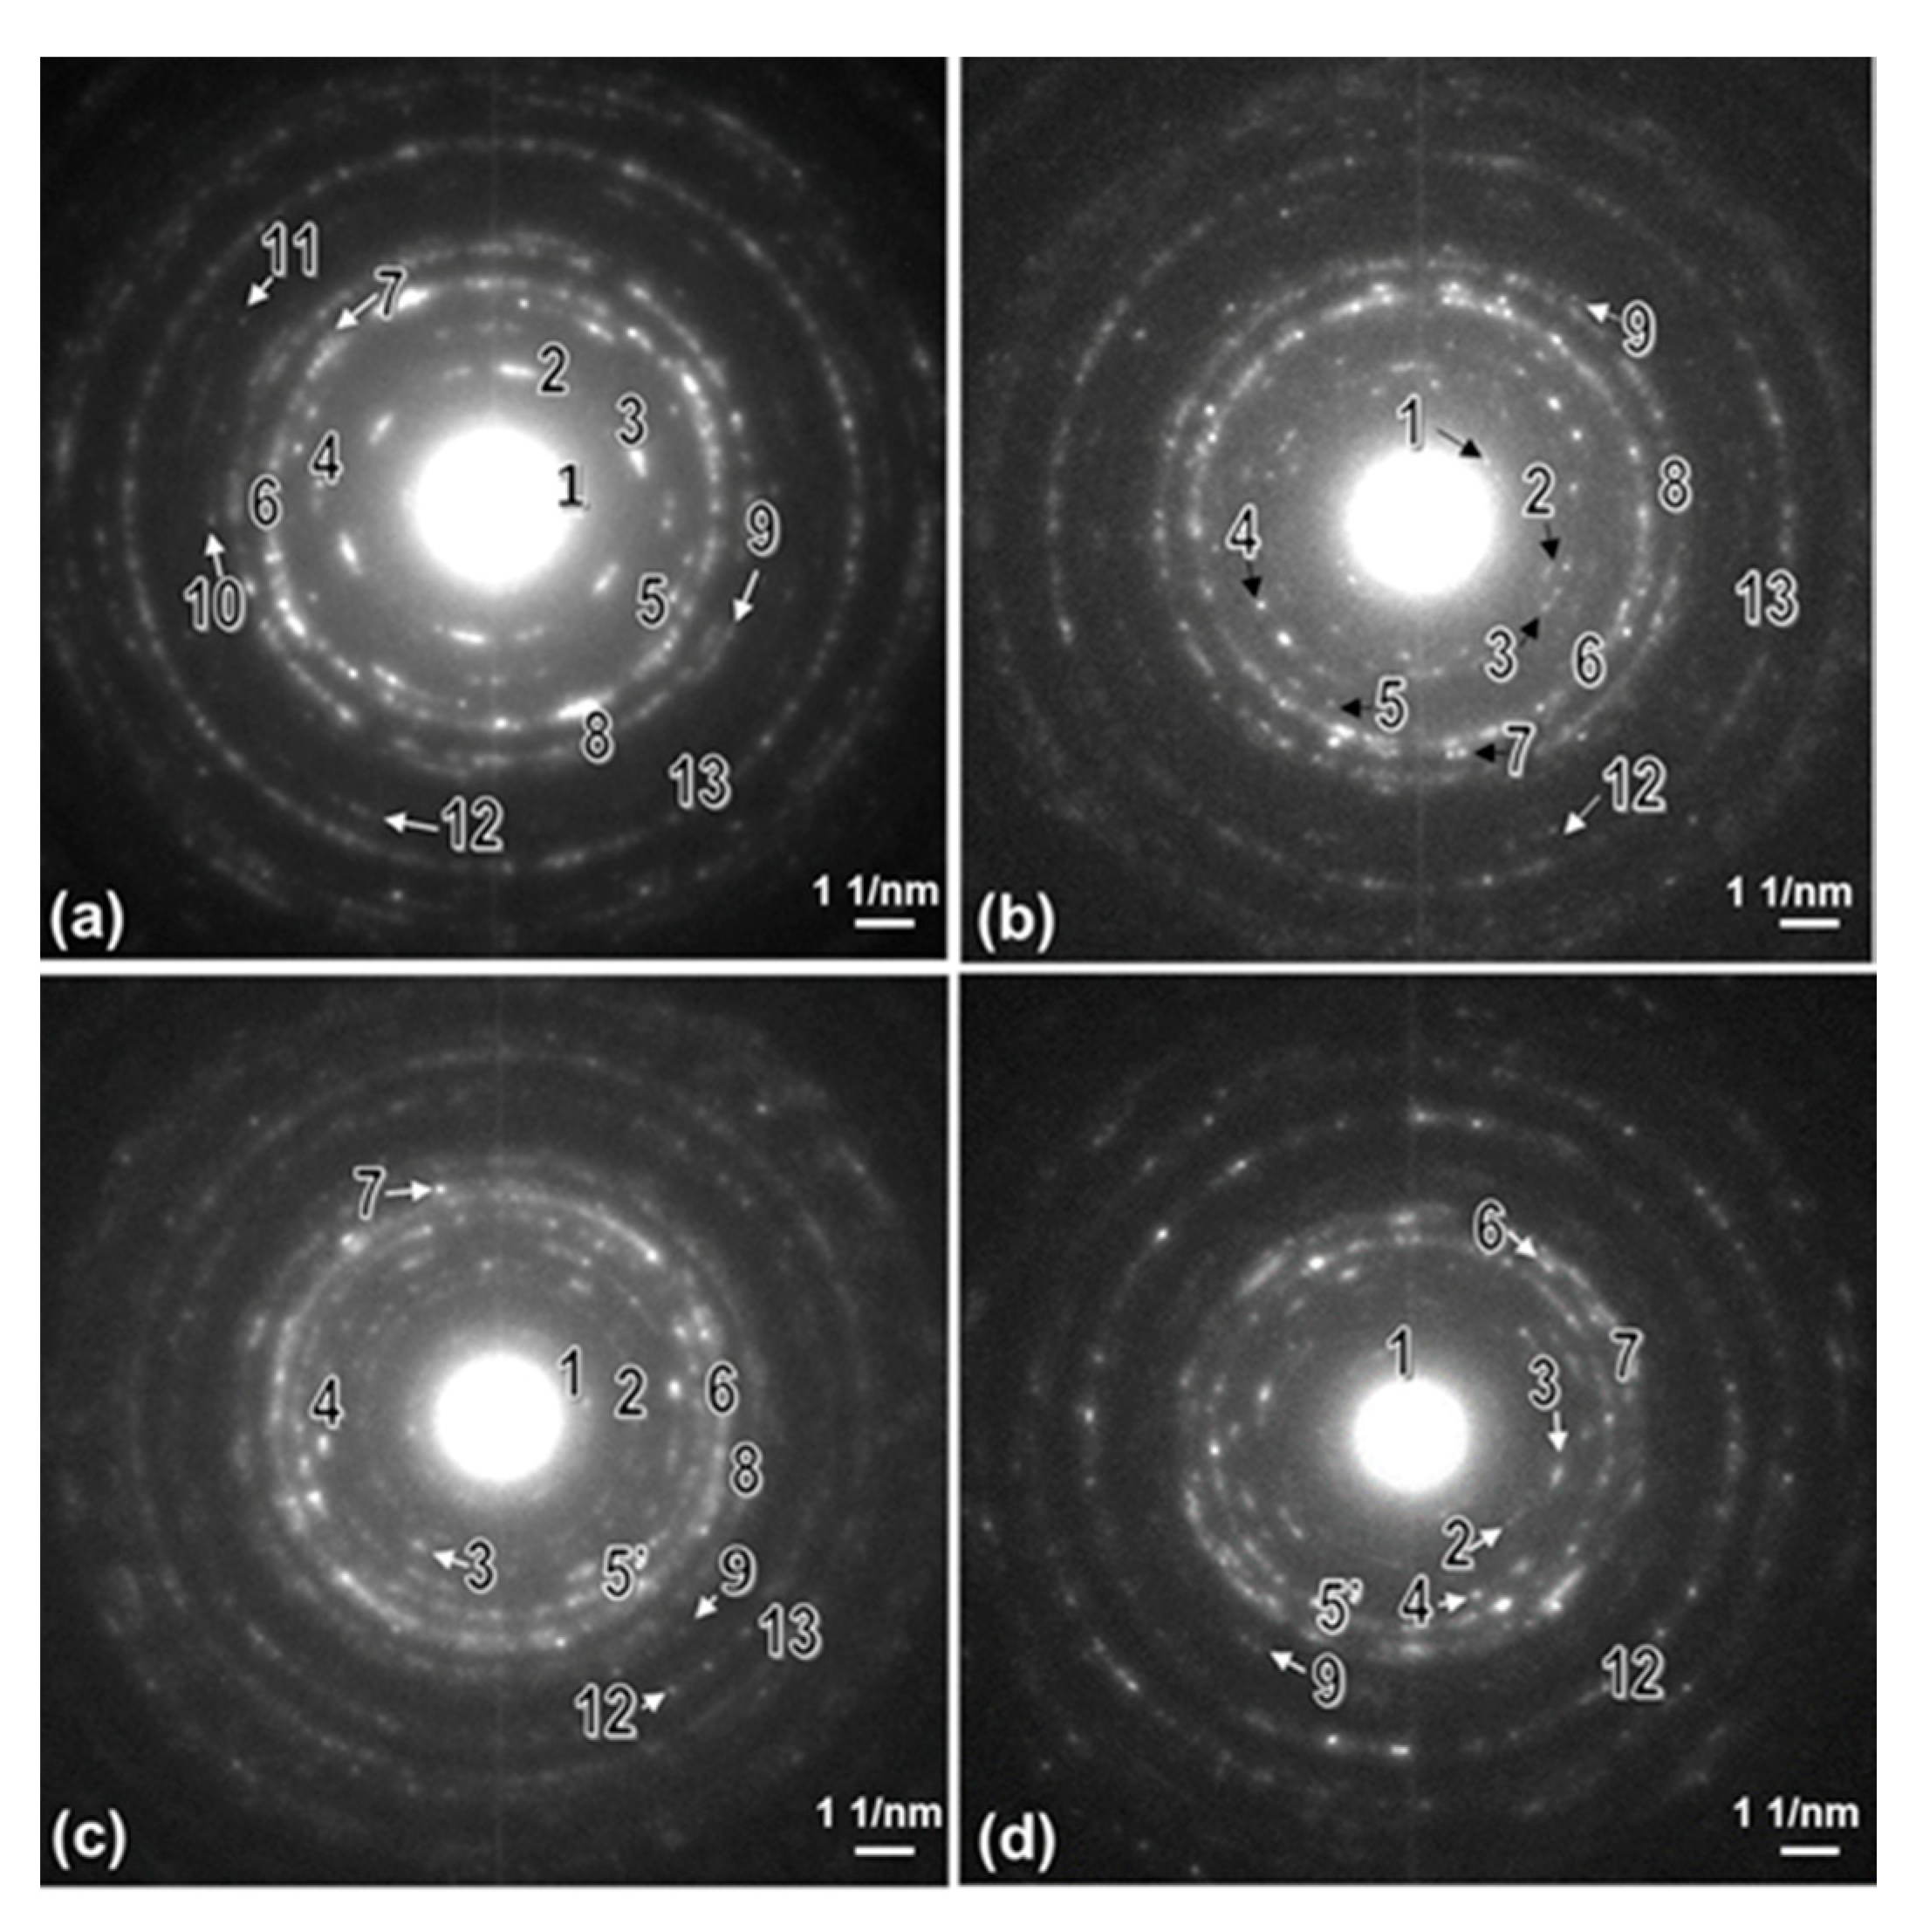
Figure 10a–d shows SAED patterns taken using a 300 nm diameter selected aperture from the bottom, middle and top sections of the RL, Figure 10a–c, and the TL, Figure 10d. The diffraction spots 1, 2, 3, 4, 5, 9, 10 and 11 in Figure 10a have a lattice spacing of 6.71, 4.35, 3.89, 3.35, 2.91, 2.21, 2.10 and 1.92 Å and can be identified as the (100), (101), (110), (200), (201), (301), (202) and (212) of h-Si3N4, respectively. The strong diffraction rings 6, 8 and 13 have a lattice spacing of 2.66, 2.31 and 1.63 Å and match respectively the (111), (200) and (220) of fcc HfCxN1−x (x = 0.7) which is a solid solution of HfC (PDF #:39-1491, a = 4.638 Å, Fm3m) and HfN (PDF #:33-0592, a = 4.525 Å, Fm3m) [29]. The lattice constant of HfCxN1−x can be obtained using aHf(CN) = (1 − x) · aHfN + x · aHfC, for example, the lattice constant of HfC0.5N0.5 calculated using this formula is 4.582 Å, almost identical to the value reported (PDF #:02-2469, a = 4.586 Å, Fm3m) [29]. The diffraction spots 7 and 12 have a lattice spacing of 2.52 and 1.79 Å and can match the (110) and (200) t-HfO2, respectively. The appearance of highly converged spots 1, 2, 3, 4 and 5, rather than diffraction rings indicate formation of a highly textured Si3N4 structure within the bottom part of the RL. The presence of dense diffraction rings 6, 8 and 13 indicates formation of significant HfCxN1−x structure. The diffraction that can correspond to (110) t-HfO2 occupied only a very limited fraction of the diffraction ring 7 indicating a negligible amount (if any) of HfO2 might have formed in this layer. Therefore, the microstructure of the bottom section of the RL (~300 nm thick layer above the substrate) involves a dominant orientation preferred h-Si3N4 phase with dispersion of HfCxN1−x nano phases.
The SAED patterns taken from the middle and top sections (300–600 nm and 600–900 nm sublayer above the substrate, respectively) of the RL are nearly identical as presented in Figure 10b. However, they show some differences compared to the pattern in Figure 10a as outlined in the following: (i) diffractions (100), (101), (110) and (200) of Si3N4 appear as weak diffraction rings 1–4 with many dots in Figure 10b rather than highly converged spots in Figure 10a, indicating disappearance of the Si3N4 texture structure or breakage of the larger Si3N4 grains into small grains in this area; (ii) the density and intensity of diffractions (111), (200) and (220) of HfCxN1−x on rings 6, 8 and 13 in Figure 10b is slightly decreased compared to those in Figure 10a indicating a slight reduction of the amount of HfCxN1−x phase within this sublayer compared to the region 0–300 nm above the substrate; (iii) more diffraction spots on ring 7 in Figure 10b compared to Figure 10a can indicate some formation of HfO2 within this area.
Figure 10c shows a SAED pattern taken from the top section of RL (900–1200 nm above the substrate). The diffractions (100), (101), (110) and (200) of Si3N4 are present as well-formed rings 1–4. The diffraction ring 5′ has a lattice spacing of ~2.95 Å which can be identified as the (101) t-HfO2. The diffractions (101), (110) and (200) of t-HfO2 in Figure 10c exhibit well developed ring patterns (5′, 7 and 12) with enhanced intensity compared to Figure 10b indicating formation of HfO2 within the top RL section. In the SAED pattern taken from the TL, Figure 10d, diffraction rings of Si3N4 show similar characteristics to those in Figure 10c, whereas the rings 6, 8 and 13 of HfCxN1−x structure are nearly absent except of very few leftovers and the rings 5, 7 and 12 are significantly enhanced. This result indicates that the majority of HfCxN1−x within the TL has transformed to HfO2.
Based on above studies, the microstructure within the RL and TL in the annealed Hf7B10Si32C2N44 film can be summarized as follows: (i) the RL bottom section (within 300 nm from the SiC substrate) consists of large Si3N4 grains with preferred orientation surrounding HfCxN1−x nanostructures of an average size ~10 nm. The ratio of Si/N in this film is 32/44 ≈ ¾, formation of Si3N4 could possibly completely consume all Si and N in the film, the remaining N together with C and Hf formed a solid solution of HfCxN1−x; (ii) the RL middle and top sections (from 300 to 1350 nm) possessed nearly uniformly distributed Si3N4 nanostructures and gradually decreased/increased amount of the HfCxN1−x/HfO2 phases especially in its top section; and (iii) the TL consists of Si3N4 structures encapsulating dominant HfO2 nanostructures (several nm lateral and tens nm vertical) and traces of residual HfCxN1−x.

Microstructure of the TL and RL Sections

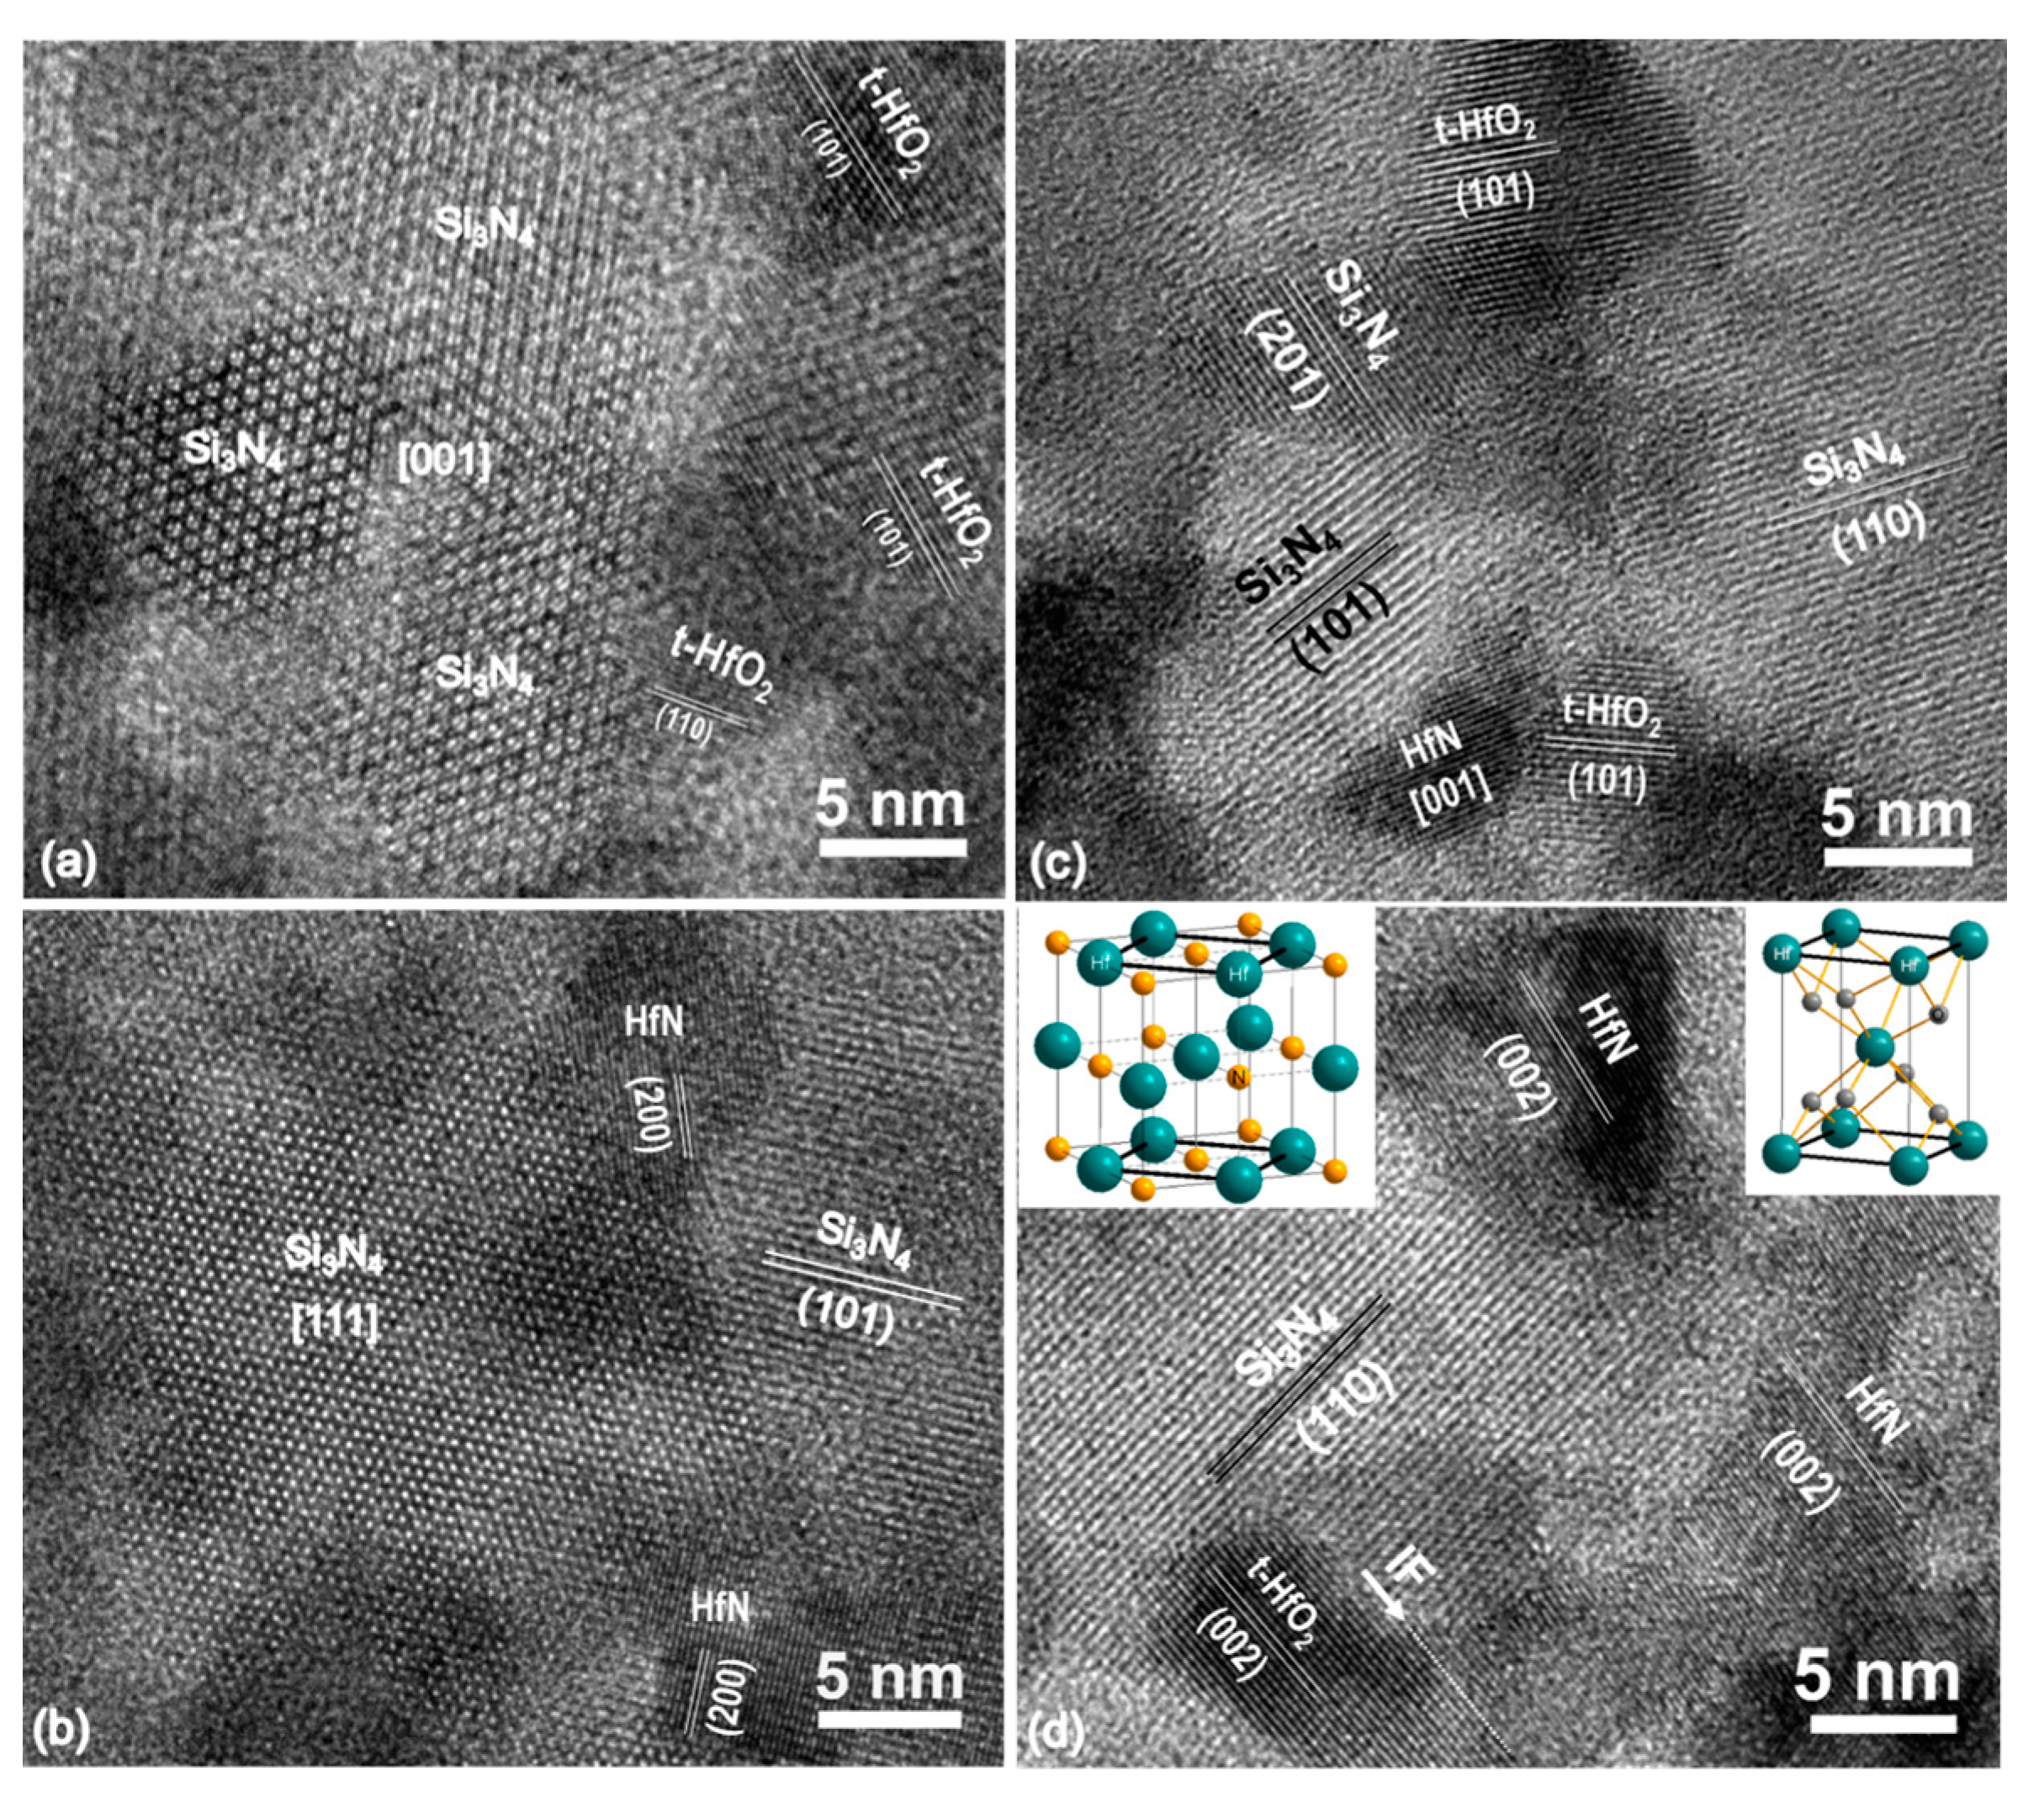
Figure 11a shows a typical HRTEM image of the primary structure within the TL presenting three Si3N4 grains and three t-HfO2 grains, corresponding respectively, to the bright and dark areas in Figure 9b. The three distinct Si3N4 grains with a size of ~10–15 nm possess nearly the same (001) crystallographic orientation, the two t-HfO2 particles present (101) lattice fringes with a spacing of 2.95 Å and the other one presents (110) t-HfO2 fringes with a spacing of 2.52 Å. We found that most of the dark districts in Figure 9b are t-HfO2, while HfCxN1−x type particles were rarely observed (not shown here).
Figure 11b shows a HRTEM image of a typical structure of the RL bottom section (~300 nm above the substrate) presenting a complete Si3N4 grain oriented along the (111) with a size of ~20 nm and a partial Si3N4 grain with (101) lattice fringes along with two small HfCxN1−x grains of a size of ~7–8 nm with presence of (200) lattice fringes with a spacing of 2.26 Å. Note that this (200) lattice spacing is smaller from previous detected HfCxN1−x (2.31 Å for x = 0.7) phase approaching that of a binary HfN phase structure suggesting the stoichiometry of the HfCxN1−x varies across the thickness of the coating. The Si3N4 and HfCxN1−x grains correspond to the bright and dark districts in Figure 9d, respectively. Intensive HRTEM studies showed that the dark districts in Figure 9d correspond to HfCxN1−x type structure.
Figure 11c shows a representative HRTEM image of the structure of the top RL section (~1200 nm above the substrate) presenting coexistence of one HfCxN1−x, two t-HfO2 and three Si3N4 grains. The HfCxN1−x grain has a size of ~5–7 nm presenting a 2D atomic image of the (001) zone. The two t-HfO2 particles have a size of a few nanometers with presence of (101) lattice fringes. Among the three Si3N4 grains, the one presenting (110) lattice fringes with a spacing of 3.87 Å is significantly larger than the other two with presence of (201) fringes of a spacing 2.88 Å and of (101) which have a size of ~5–7 nm. This indicates that in this section, some of large Si3N4 grains broke into smaller ones. The coexistence of HfCxN1−x, t-HfO2 and Si3N4 structure was frequently observed in the top RL section in agreement with the electron diffraction analysis in Figure 10c.
Figure 11d presents a HRTEM image of an area in the RL middle section presenting one Si3N4 grain with (110) lattice fringes, one t-HfO2 and two HfCxN1−x grains. The (002) lattice fringes of t-HfO2 have a spacing of 2.60 Å and those of HfCxN1−x of 2.28 Å. The (002) of the t-HfO2 and that of the HfCxN1−x grain at the bottom of the image were parallel to each other and coherently joined together by sharing an atomic plane at the interface (IF) as marked by a dashed line and an arrow. The observation of coexistence of t-HfO2 and HfCxN1−x phases which is an intermediate stage provides a noteworthy evidence of direct transformation of HfCxN1−x to t-HfO2. As seen from the crystal structures which are schematically illustrated in the Figure 11d insets, the Hf atoms in both HfCN (left inset) and t-HfO2 (right inset) construct similar 2D square lattices on the (001) planes with a unit cell dimension of ~3.25 and 3.58 Å, respectively. Furthermore, the Hf atoms in both phases possess a similar 3D body centered tetragonal structure with a = 3.25 Å and c = 4.58 Å for HfCN and a = 3.58 Å and c = 5.19 Å for t-HfO2. Transformation from HfCN to t-HfO2 is feasible by primarily replacing C and N atoms with O without dramatically changing the Hf lattice.

Structure Transformations at TL/OL Interface

Figure 12 is a HRTEM image taken from the interface between the oxide and the transition layer presenting a large HfO2 at the interface. It is interesting to note that the upper half of the large HfO2 particle in the OL side appears as a fully grown spherical structure covered by α-SiO2. However, the bottom half of the particle in the TL side was captured to be still in the coarsening stage. It is more interesting to note that a mixture of much smaller phases of Si3N4, β-SiO2, and HfO2 are attached or being in the immediate vicinity of the growing side. The coalescence/attachment of the smaller HfO2 grains from the TL to the large HfO2 seems to be directly accommodated via the Si3N4 and β-SiO2 phases. Transformation from Si3N4 to β-SiO2 and to amorphous α-SiO2 facilitates the approach and eventual consolidation of the smaller HfO2 grains to the large growing HfO2 to complete its growth. This transformation at the RL/OL interface is very similar to the one observed for the Hf6B10Si31C2N50 film, Figure 7b. Thus, besides the different microstructures evolved in the bottom layer (amorphous vs. partially recrystallized) in the two films, the oxidation mechanism is very similar.

3.3. Microstructure Evolution and Oxidation Mechanism

The present Hf6B10Si31C2N50 and Hf7B10Si32C2N44 and previously studied Hf7B23Si17C4N45, Hf6B21Si19C4N47 and Hf7B23Si22C6N40 films exhibit high oxidation resistance even up to 1500 °C in air [27,28]. All five HfBSiCN films annealed up to 1500 °C in air exhibit a very similar fully oxidized top layer with HfO2 nanoparticles dispersed in a dense amorphous SiOx matrix. However, the original as-deposited bottom layer of the annealed HfBSiCN films exhibits a structure that depends on film composition. The bottom layer in high N and low Si:B ratio (~1:1) films such as Hf7B23Si17C4N45 [27] and Hf6B21Si19C4N47 [28] remains amorphous. However, in low N (Hf7B23Si22C6N40) or high Si:B (~3:1) ratio (Hf7B10Si32C2N44) films, the bottom layer is partially recrystallized forming HfB2, HfN and Si3N4. Film Hf6B10Si31C2N50 falls in between the above two types of films since it has high N content and high Si:B ratio. Indeed, the bottom layer in this film is mainly amorphous (high N effect) but with presence of short range ordered structures, Figure 2c, composed of sub nanometer ordered structures, Figure 3d (high Si:B ratio effect).
Thus, our results suggest that the high N content and Si:B ratio exercise opposite effects on the stability of the original as-deposited amorphous bottom layer. This effect is demonstrated in the present two new films that both contain a high Si:B ratio (~3:1) but present an entirely different bottom layer structure. A high N content in SiBCN films has been shown to promote amorphization by suppressing Si–Si bonds in the film structure [20,22,23]. This is especially evident in low Si containing films where the excess N is enough to maintain an amorphous structure. However, in high Si:B ratio films, the bottom layer structure is determined by the relative balance between these two effects. For example, in the Hf7B10Si32C2N44 film, the Si:N ratio is very close to 3:4 required for Si3N4 formation and as such there is no additional N to maintain the amorphous structure in the remaining of the film. Thus, this film is partially recrystallized. On the other hand, the Hf6B10Si31C2N50 film has excess N (beyond Si3N4 formation) thus, resisting recrystallization. However, it develops bright and dark contrast of atomic low ordered clusters indicative of the very early stage of recrystallization, Figure 3d. Thus, while the two bottom layer structures are different, they are also similar since they both show atomic rearrangements that are extensive in the partially recrystallized Hf7B10Si32C2N44 film and in the first stage of nucleation in the high N content Hf6B10Si31C2N50 film.
The above atomic structure of the bottom layer in the present two new films has a consequence in their oxidation behavior. They both show a TL that was absent in the oxidized microstructure of the previously studied low Si content films. The presence of the TL is due to their high Si content resulting in the observed extensive (recrystallization) or limited (small ordered atomic clustering) atomic scale separation. The presence of high Si in these two films ties up most (or all) of the N leaving Hf rich clusters that can be easily oxidized producing the TL. The Hf6B10Si31C2N50 film exhibits a distinct AL/TL interface, Figure 2a, since both Si3N4 nucleation and HfO2 formation (oxidation) occur at the interface. The TEM observations show that the Hf7B10Si32C2N44 film does not exhibit a clear RL/TL interface. The bottom layer in this film has been partially recrystallized into phases Si3N4 and HfCxN1−x at its bottom section with increasing amount of HfO2 as its upper section is approached. Since the oxidation of HfCxN1−x to HfO2 occurs gradually no clear interface is produced. The TL is the section where all (or the majority) of the HfCxN1−x phase has been oxidized to form HfO2. Thus, the TL in this film is also composed of Si3N4 and HfO2 nanostructures like those in the Hf6B10Si31C2N50 film. It should be noted that a TL was not present in previously studied HfBSiCN films since they were either amorphous (high N, low Si) or partially recrystallized with presence of N containing phases BN, HfN, Si3N4. Oxidation of these phases occurred almost simultaneously at the same film depth resulting in the common to all top OL morphology involving HfO2 nanoparticles dispersed in a SiOx-based matrix.
Thus, the oxidation mechanism in the present two films is composed of two stages. The first stage in the Hf6B10Si31C2N50 film involves oxidation at the AL/TL interface of individual elements out of the Hf-rich short range ordered clusters forming small t-HfO2 structures simultaneously with the formation of Si3N4 nanocrystalline structures out of light elements motifs, Figure 4b. In the Hf7B10Si32C2N44 film, the RL is composed of HfCxN1−x and Si3N4 nanocrystalline phases and oxidation of HfCxN1−x to HfO2 takes place gradually as the top RL section is approached. This gradual oxidation of the HfN phase produces a gradient microstructure in terms of HfO2 content and as a result a distinct RL/TL interface is not observed, Figure 8. The onset of the TL can be considered at the point when most of the HfN phase has been oxidized and the resulting microstructure is composed of Si3N4 and t-HfO2 nanostructure network, Figure 11a, as the one in the TL of the Hf6B10Si31C2N50 film, Figure 6.
The second stage of oxidation has a common mechanism in both films and occurs at the TL/OL interface. Oxidation of crystalline Si3N4 to β-SiO2 followed by its transformation to amorphous SiO2 takes place in parallel with the coalescence of small t-HfO2 and growth to large spherical m-/o-HfO2 nano particles. We were able to capture the details of this second oxidation process while in progress for both films as shown in Figure 4a and Figure 12. The high oxidation resistance of both Hf6B10Si31C2N50 and Hf7B10Si32C2N44 films is attributed to a similar microstructure that develops at the interfaces regardless of the different microstructures in the bottom layer.
Besides the above two oxidation stages, high density of low thermal conductivity (0.49–0.95 W·m−1·K−1) HfO2 nanoparticles surrounded by high density SiO2 quartz boundaries in OL form also an effective oxygen and thermal diffusion barrier at the interface resulting in high temperature oxidation resistance [27].

4. Conclusions

The Hf6B10Si31C2N50 and Hf7B10Si32C2N44 films annealed up to 1500 °C in air developed a three-layered microstructure. Both Hf–B–Si–C–N films formed a fully oxidized layer at the top surface with a nanocomposite structure of m-HfO2 and/or o-HfO2 embedded in an amorphous SiOx-based matrix. The bottom layer remained amorphous in the Hf6B10Si31C2N50 film and it was partially recrystallized in the Hf7B10Si32C2N44 film. The latter recrystallized layer was composed of a uniformly distributed h-Si3N4 major phase along with HfCxN1−x. Some t-HfO2 appeared in the top section of this layer resulting from the oxidation of the HfCxN1−x phase. This process has taking place gradually along the thickness of the layer with the amount of t-HfO2 increasing as the top layer section was approached. Between the above two layers, both films exhibited a transition layer composed of a t-HfO2 nanostructure network surrounded by Si3N4.
The fully oxidized/transition layer interface of both annealed Hf6B10Si31C2N50 and Hf7B10Si32C2N44 films was characterized by densely packed small HfO2, Si3N4 and quartz SiO2 nanostructures that can act as a major barrier for oxygen and thermal diffusion. The growth of HfO2 nanoparticles at the interface of the oxide/transition layer is accomplished by merging the small HfO2 grains into large HfO2 particles via the oxidation of Si3N4 to quartz SiO2 and its transformation to amorphous α-SiO2. In addition, the transition layer composed of Si3N4 and HfO2 nanostructures could provide a second barrier for oxygen and thermal diffusion.

Author Contributions

Conceptualization, J.J., P.Z., and E.I.M.; methodology, Y.S., J.J., and E.I.M.; validation, Y.S., J.J., P.Z., and E.I.M.; formal analysis, Y.S. and J.J.; investigation, Y.S., M.K., V.Š., and J.J.; resources, J.J. and E.I.M.; data curation, Y.S. and J.J.; writing—Original draft preparation, J.J. and E.I.M.; writing—Review and editing, J.J., P.Z., and E.I.M.; visualization, J.J., supervision, J.J., J.V., and E.I.M.; project administration, J.V. and E.I.M.; funding acquisition, J.J., J.V., and E.I.M. All authors have read and agreed to the published version of the manuscript.

Funding

This research was funded by the U.S. National Science Foundation under Award No. NSF/CMMI DMREF-1335502 and by the European Structural and Investment Funds under Project No. CZ.02.1.01/0.0/0.0/17_048/0007267.

Conflicts of Interest

The authors declare no conflict of interest.

References

  1. Mitterer, C. Borides in thin film technology. J. Solid State Chem. 1997, 133, 279–291. [Google Scholar] [CrossRef]
  2. Opeka, M.M.; Talmy, I.G.; Wuchina, E.J.; Zaykoski, J.A.; Causey, S.J. Mechanical, thermal, and oxidation properties of refractory hafnium and zirconium compounds. J. Eur. Ceram. Soc. 1999, 19, 2405–2414. [Google Scholar] [CrossRef] [Green Version]
  3. Levine, S.R.; Opila, E.J.; Halbig, M.C.; Kiser, J.D.; Singh, M.; Salem, J.A. Evaluation of ultra-high temperature ceramics for aeropropulsion use. J. Eur. Ceram. Soc. 2002, 22, 2752–2756. [Google Scholar] [CrossRef]
  4. Opeka, M.M.; Talmy, I.G.; Zaykoski, J.A. Oxidation-based materials selection for 2000 °C + hypersonic aerosurfaces: Theoretical considerations and historical experience. J. Mater. Sci. 2004, 9, 5887–5904. [Google Scholar] [CrossRef]
  5. Fahrenholtz, W.G.; Hilmas, G.E.; Talmy, I.G.; Zaykoski, J.A. Refractory diborides of zirconium and hafnium. J. Am. Ceram. Soc. 2007, 90, 1347–1364. [Google Scholar] [CrossRef]
  6. Wuchina, E.; Opila, E.; Opeka, M.; Fahrenholtz, W.; Talmy, I. UHTCs: Ultra-high temperature ceramic materials for extreme environment applications. Electrochem. Soc. Interface 2007, 16, 30–36. [Google Scholar]
  7. Monteverde, F.; Bellosi, A.; Scatteia, L. Processing and properties of ultra-high temperature ceramics for space applications. Mater. Sci. Eng. A 2008, 485, 415–421. [Google Scholar] [CrossRef]
  8. Ghosh, D.; Subhash, G. Recent Progress in Zr(Hf)B2 Based Ultrahigh Temperature Ceramics in Handbook of Advanced Ceramics, 2nd ed.; Materials, Applications, Processing, and Properties; Elsevier: Amsterdam, The Netherlands, 2013; pp. 267–269. [Google Scholar]
  9. Zapata-Solvas, E.; Jayaseelan, D.D.; Lin, H.T.; Brown, P.; Lee, W.E. Mechanical properties of ZrB2- and HfB2- based ultra-high temperature ceramics fabricated by spark plasma sintering. J. Eur. Ceram. Soc. 2013, 33, 1373–1386. [Google Scholar] [CrossRef]
  10. Fahrenholtz, W.G.; Hilmas, G.E. Ultra-high temperature ceramics: Materials for extreme environment. Scr. Mater. 2017, 129, 94–99. [Google Scholar] [CrossRef] [Green Version]
  11. Menteverde, F. Progress in fabrication of ultra-high temperature ceramics: “In situ” synthesis, microstructure and properties of a reactive hot-pressed HfB2-SiC composite. Compos. Sci. Technol. 2005, 65, 1869–1879. [Google Scholar] [CrossRef]
  12. Monteverde, F. The thermal stability in air of hot-pressed diboride matrix composites for uses at ultra-high temperatures. Cor. Sci. 2005, 47, 2020–2033. [Google Scholar] [CrossRef]
  13. Rezaie, A.; Fahrenholtz, W.G.; Hilmas, G.E. Evaluation of structure during oxidation of zirconium diboride-silicon carbide in air up to 1500 °C. J. Eur. Ceram. Soc. 2007, 27, 2495–2501. [Google Scholar] [CrossRef]
  14. Menteverde, F.; Bellosi, A. The resistance to oxidation of an HfB2-SiC composite. J. Eur. Ceram. Soc. 2008, 25, 1025–1031. [Google Scholar] [CrossRef]
  15. Carney, C.M. Oxidation resistance of hafnium diboride-silicon carbide from 1400 to 2000 °C. J. Mater. Sci. 2009, 44, 5673–5681. [Google Scholar] [CrossRef]
  16. Carney, C.M.; Mogilvesky, P.; Parthasarathy, T.A. Oxidation behavior of zirconium diboride silicon carbide produced by the spark plasma sintering method. J. Am. Ceram. Soc. 2009, 92, 2046–2052. [Google Scholar] [CrossRef]
  17. Mallik, M.; Ray, K.K.; Mitra, R. Oxidation behavior of hot pressed ZrB2-SiC and HfB2-SiC composites. J. Eur. Ceram. Soc. 2011, 31, 199–215. [Google Scholar] [CrossRef]
  18. Kohout, J.; Vlček, J.; Houška, J.; Mareš, P.; Čerstvý, R.; Zeman, P.; Zhang, M.H.; Jiang, J.C.; Meletis, E.I.; Zuzjaková, Š. Hard multifunctional Hf–B–Si–C films prepared by pulsed magnetron sputtering. Surf. Coat. Technol. 2014, 257, 301–307. [Google Scholar] [CrossRef]
  19. Zhang, M.H.; Jiang, J.C.; Meletis, E.I.; Mares, P.; Houška, J.; Vlček, J. Effect of the Si content on the microstructure of hard, multifunctional Hf-B-Si-C films prepared by pulsed magnetron sputtering. Appl. Surf. Sci. 2015, 357, 1343–1354. [Google Scholar] [CrossRef]
  20. Čapek, J.; Hřeben, S.; Zeman, P.; Vlček, J.; Čerstvý, R.; Houška, J. Effect of the gas mixture composition on high-temperature behavior of magnetron sputtered Si-B-CN coatings. Surf. Coat. Technol. 2008, 203, 466–469. [Google Scholar] [CrossRef]
  21. Kalaš, J.; Vernhes, R.; Hřeben, S.; Vlček, J.; Klemberg-Sapieha, J.E.; Martinu, L. High temperature stability of the mechanical and optical properties of Si–B–C–N films prepared by magnetron sputtering. Thin Solid Films 2009, 518, 174–179. [Google Scholar] [CrossRef]
  22. Zeman, P.; Čapek, J.; Čerstvý, R.; Vlček, J. Thermal stability of magnetron sputtered Si–B–C–N materials at temperatures up to 1700 °C. Thin Solid Films 2010, 519, 306–311. [Google Scholar] [CrossRef]
  23. He, J.; Zhang, M.H.; Jiang, J.C.; Vlček, J.; Zeman, P.; Steidl, P.; Meletis, E.I. Microstructure characterization of high-temperature, oxidation-resistant Si–B–C–N films. Thin Solid Films 2013, 542, 167–173. [Google Scholar] [CrossRef]
  24. Vlček, J.; Calta, P.; Steidl, P.; Zeman, P.; Čerstvý, R.; Houška, J.; Kohout, J. Pulsed reactive magnetron sputtering of high-temperature Si–B–C–N films with high optical transparency. Surf. Coat. Technol. 2013, 226, 34–39. [Google Scholar] [CrossRef]
  25. Zeman, P.; Zuzjaková, Š.; Mareš, P.; Čerstvý, R.; Zhang, M.H.; Jiang, J.C.; Meletis, E.I.; Vlček, J. Superior high-temperature oxidation resistance of magnetron sputtered Hf–B–Si–C–N film. Ceram. Int. 2016, 42, 4853–4859. [Google Scholar] [CrossRef] [Green Version]
  26. Šímová, V.; Vlček, J.; Zuzjaková, S.; Houška, J.; Shen, Y.; Jiang, J.C.; Meletis, E.I.; Peřina, V. Magnetron sputtered Hf–B–Si–C–N films with controlled electrical conductivity and optical transparency, and with ultrahigh oxidation resistance. Thin Solid Film. 2018, 653, 333–340. [Google Scholar] [CrossRef]
  27. Zhang, M.H.; Jiang, J.C.; Zeman, P.; Zuzjaková, Š.; Vlček, J.; Meletis, E.I. Study of the High-temperature oxidation resistance mechanism of magnetron sputtered Hf7B23Si17C4N45 film. J. Vac. Sci. Technol. A 2018, 36, 021505. [Google Scholar] [CrossRef]
  28. Shen, Y.; Jiang, J.C.; Zeman, P.; Šímová, V.; Vlček, J.; Meletis, E.I. Microstructure evolution in amorphous Hf–B–Si–C–N high temperature resistant coatings after annealing to 1500 °C in air. Sci. Rep. 2019, 9, 3603. [Google Scholar] [CrossRef] [Green Version]
  29. International Centre for Diffraction Data. PDF-4 Database Sets; International Centre for Diffraction Data: Newtown Square, PA, USA, 2020. [Google Scholar]
  30. Zeman, P.; Zuzjaková, Š.; Čerstvý, R.; Houška, J.; Shen, Y.; Todt, J.; Jiang, J.; Daniel, R.; Keckes, J.; Meletis, E.I.; et al. Extraordinary high-temperature behavior of electrically conductive Hf7B23Si22C6N40 ceramic film. Surf. Coat. Technol. 2020, 391, 125686. [Google Scholar] [CrossRef]
Figure 1. θ–2θ XRD spectra of the annealed Hf7B10Si32C2N44 and Hf6B10Si31C2N50 films.
Coatings 10 01170 g001
Figure 2. (a) Cross-section TEM image of the annealed Hf6B10Si31C2N50 film. SAED pattern taken from (b) substrate, (c) amorphous layer, (d) transition layer and (e) top oxide layer shown in (a).
Coatings 10 01170 g002
Figure 3. (a) Zoom-in cross-section TEM of the transition layer of the annealed Hf6B10Si31C2N50 film. HRTEM taken from the (b) transition layer shown in (a), (c) top oxide layer and (d) amorphous layer shown in Figure 2a. The circles indicate sub nanometer ordered structures.
Coatings 10 01170 g003
Figure 4. HRTEM image of the interface between the (a) oxide and transition layer, (b) amorphous and transition layer, (c) interlayer and SiC substrate and (d) interlayer and amorphous layer in the annealed Hf6 B10Si31C2N50 film.
Coatings 10 01170 g004
Figure 5. Plan-view TEM of the (a) top oxide layer, (b) transition layer and (c) Comparison of SAED pattern taken from the top oxide layer (left) and transition layer (right). (d) Plan-view TEM of the oxide/transition layer interface in the annealed Hf6 B10Si31C2N50 film.
Coatings 10 01170 g005
Figure 6. Plan-view HRTEM image (with inset FFT) of local structure between Si3N4 and HfO2 nano grains in the transition layer in the Hf6B10Si31C2N50 film.
Coatings 10 01170 g006
Figure 7. Plan-view HRTEM images taken from the oxide/transition layer interface in the annealed Hf6B10Si31C2N50 film (ac).
Coatings 10 01170 g007
Figure 8. Cross-section TEM image of the Hf7B10Si32C2N44 film annealed up to 1500 °C in air.
Coatings 10 01170 g008
Figure 9. Zoom-in cross-section TEM of the annealed Hf7B10Si32C2N44 film taken from (a) the top oxide layer, (b) transition layer and (c) top and (d) bottom section of the recrystallized layer.
Coatings 10 01170 g009
Figure 10. SAED pattern taken from the (a) bottom, (b) middle, and (c) top section of the recrystallized layer and (d) transition layer in the annealed Hf7B10Si32C2N44 film.
Coatings 10 01170 g010
Figure 11. HRXTEM images taken from (a) the transition layer and (b) bottom, (c) top, and (d) middle section of the recrystallized layer in the annealed Hf7B10Si32C2N44 film.
Coatings 10 01170 g011
Figure 12. HRXTEM image of the oxide/transition layer interface in the annealed Hf7B10Si32C2N44 film.
Coatings 10 01170 g012
Publisher’s Note: MDPI stays neutral with regard to jurisdictional claims in published maps and institutional affiliations.