Article

Interfacial Microstructure of FeCoNiCrAl0.1 High Entropy Alloy and Pure Copper Prepared by Explosive Welding

1
CAS Key Laboratory of Mechanical Behavior and Design of Materials, Department of Modern Mechanics, University of Science and Technology of China, Hefei 230027, China
2
State Key Laboratory for Geomechanics and Deep Underground Engineering, China University of Mining and Technology, Xuzhou 221116, China
3
National Key Laboratory for Remanufacturing, Army Academy of Armored Forces, Beijing 100072, China
4
State Key Laboratory of Fire Science, University of Science and Technology of China, Hefei 230027, China
5
High Overloaded Ammunition Guidance Control and Information Perception Laboratory, PLA Army Academy of Artillery and Air Defense, Hefei 230031, China
*
Author to whom correspondence should be addressed.
Coatings 2020, 10(12), 1197; https://doi.org/10.3390/coatings10121197
Submission received: 9 November 2020 / Revised: 2 December 2020 / Accepted: 4 December 2020 / Published: 9 December 2020

Abstract

:
The FeCoNiCrAl0.1 high entropy alloys (HEAs) and pure copper (Cu) composite plates were successfully fabricated by the explosive welding technique using two different gap distances. The interfacial microstructure, elemental distribution, grain structure of vortex zone and hardness were characterized using optical microscopy (OM), scanning electron microscopy (SEM), electron backscattered diffraction (EBSD), nanoindentation and micro-hardness tester. The explosive weldability window was calculated to verify the weldability of HEAs and Cu. The results indicated that the Cu/HEA composites presented typical wavy structures without visible defects and have an excellent bonding quality. The elements mixed and formed intermetallic compounds at the vortex zones. The grains near the vortex zones showed strong deformation, and phase transformation occurred. Compared with the matrix metals, the hardness of Cu and HEAs increased near the welding interface and sharply increased to 375 HV near the vortex zone.

1. Introduction

High entropy alloys (HEAs) are novel metals with high mixing entropy, which are broadly defined as a solid solution alloy containing more than five main elements equal to or near equal to the atomic percentage (at.%) [1]. In recent years, HEAs have attracted increasing attention regarding their special composition and excellent mechanical properties, such as high fracture toughness, combined strength-ductility performance, significant fatigue resistance, excellent radiation resistance [2]. Moreover, due to its slow defect formation kinetics under heavy radiation doses, HEAs can possibly replace the structural materials currently available in nuclear power and high-efficiency thermal power plants in the future [3,4]. Due to the differences in the physical and chemical properties of dissimilar metals, there are many technical problems in the welding process. First, the huge difference in the coefficient of linear expansion leads to different deformation capabilities during welding heating and cooling. Therefore, tensile residual stress that is difficult to remove may be generated in the welded joint [5]. Secondly, during the welding process, the atoms of dissimilar metals will undergo strong mutual diffusion under the action of high temperature. Therefore, during the cooling process, a large amount of brittle and hard intermetallic compounds may be formed in the welded joint [6]. Finally, the heat introduced during the welding process makes the material being welded more sensitive to intergranular corrosion and solidification cracks [7]. Therefore, in order to obtain a welded joint of dissimilar metals with excellent properties, a proper welding process must be adopted. To extend the industrial applications of HEAs, various welding techniques have been developed to explore the weldability of HEAs and common metal materials, including explosive welding (EXW) [8], electron beam welding [9], friction stir welding [10], and laser beam welding [11]. Among these welding techniques, as a solid-state welding technique, EXW has been a potential technique in the cladding field for its good capability of large deformation and high strain energy. In addition, as compared to other welding techniques, EXW can manufacture large-scale composite plates and weld two or more different metals in one step [12].
Although the EXW process generates a lot of heat at the interface, there is no time to transfer heat to the matrix. Therefore, EXW is always considered a solid welding process [13]. As shown in Figure 1b, due to the acceleration effect of explosives energy, the base plate is impacted by the flyer plate with a very high velocity (Vp). During explosive process, high pressure occurs at the deformation zone, resulting in jetting of the molten metal. The surface is cleaned by jet and a high strength bond between the materials is achieved under extreme pressure [13]. In addition to plastic deformation and grain refinement near the interface, it is possible to form local melting zones between the base and the flyer plate, which usually has a nonstoichiometric composition and has unique properties [14].
Composites of HEAs and commercial metals can combine the advantages of both materials to achieve a combination of high strength, specific function, and low cost [15]. Up until now, research on HEAs welding has still focused on weldability between the same compositions, while the weldability of HEAs and dissimilar metals has not been well explored [3]. Compared with the existing HEAs welding research [9,16], welding dissimilar metal interfaces is more complicated, mainly because the mixing of different metals usually involves complex microstructure and metallurgical transformation, which may form a new mixture [17].
In this paper, the composite plate of HEAs and pure copper was obtained using an explosive welding technique with two different gap distances. After welding, the interfacial microstructure characterization, elemental distribution and phase transformation of materials were investigated using optical microscopy (OM), scanning electron microscopy (SEM) and electron backscatter diffraction (EBSD). Moreover, nanoindentation testing and micro-hardness testing is employed to investigate the micromechanical properties near the interface.

2. Materials and Method

The nominal composition of the HEAs used in this paper is FeCoNiCrAl0.1. Ingots with a composition of FeCoNiCrAl0.1 (at.%) were prepared by induction melting elemental metals in an argon atmosphere. The as-received materials were prepared for sheets using an electro-discharge cutting machine. As shown in Figure 1, a parallel configuration between a commercial pure copper plate (T2 copper) and FeCoNiCrAl0.1 HEAs plate was used in this study. The size of the copper plate is 150 mm × 100 mm × 1 mm as a flyer plate, and the size of the FeCoNiCrAl0.1 HEAs plate is 50 mm × 16 mm × 2 mm as a base plate. The emulsion explosive was composed of 25% hollow glass microspheres and a 75% emulsified matrix to reduce the detonation velocity [18]. The density was about 0.8 g/cm3 and the detonation velocity was about 2500 m/s. The emulsion matrix was produced by Huainan Shun Tai Chemical Co., Ltd. (Huainan, China), and its density is 1.31 g/cm3. The chemical composition of the emulsion matrix is shown in Table 1. Hollow glass microsphere (HGM) was purchased from the Minnesota Mining and Manufacturing Company (Saint Paul, MN, USA), and its effective density was 0.25 g/cm3 and the average particle size was 55 μm. To achieve stable detonation in the welding process, the emulsion explosive was filled into the cavity of the aluminum honeycomb, which had a cell length of 6 mm and a wall thickness of 60 μm [19]. The detonator is placed in the middle of the short side of the aluminum honeycomb explosive. Moreover, a piece of cardboard was used as a buffer and placed between the flyer plate and the explosive. The cardboard is commercially available, with a thickness of 2 mm. The entire structure was located on the sand in the explosion chamber. In this paper, two different gap distances, 2 and 5 mm, are investigated, which are defined as WCH2 and WCH5.
The weldability between dissimilar metals also has an important relationship with the properties. The material properties for each welding calculation are provided in the relevant literature [20,21]. In this experiment, the equations for the corresponding limits are from Deribas and Zakharenko (lower limit) [22], Wittman (upper limit) [23], Cowan (left limit) [24] and Abrahamson (right limit) [25]. Cooper’s [26] method is used to correlate the Gurney energy and the detonation velocity, 2 E   = V d   /   2.97 . The formula obtained by Flis et al. [27] is employed and the influence of the gap distance on the V p Was considered by the Lagrangian method. Moreover, there is a geometric relationship between the V p (impact velocity), V c (collision point velocity) and the β (collision angle). In this paper, the V c and the β are selected to calculate the weldability window (Figure 2).
The samples for microstructure analysis were drawn from the central region of the weld. The samples were ground up to P3000 sandpaper and polished with diamond abrasive with a 0.5 μm diameter in a plane parallel to the detonation wave direction. For EBSD and nanoindentation testing, an argon ion polishing instrument (Leica 102, Leica, Germany) was used to eliminate residual stresses. After a voltage of 4.5 kV for 20 min, a voltage of 2.5 kV for 30 min was employed at a particle gun angle of 15°. EBSD was performed employing an accelerating voltage of 20 kV and a step size of 0.2 μm. A SEM (ZEISS Gemini SEM 500, Oberkochen, Germany) with EDS was employed to investigate the microstructure near the interface. To evaluate these compounds, point, line and mapping, EDS analyses were used to examine the element distribution. Vickers indentation hardness tests were carried out on the longitudinal section of the samples at a load of 200 gf for 15 s with a spacing of 100 μm on a microhardness machine (HVS-1000 M, Shanghai Yanrun Guangji Technology Co., Ltd, Shanghai, China). To investigate the properties of the mixture, a Nano Indenter G200 Tester (KLA-Tencor, Milpitas, CA, USA) was employed, which was equipped with a maximum load of 15 mN and a stable load speed of 500 μN/s.

3. Results and Discussion

3.1. Interface Morphology

Using the EXW technique, the Cu and HEAs were successfully welded together. As shown in Figure 3, the Cu/HEAs welded interface with different gap distances show different wave characteristics. The wavelength and amplitude of WCH2 are approximately 123 and 47 μm, respectively. For WCH5, the wavelength and amplitude of the wave increase to 209 and 89 μm, respectively. The higher magnification SEM figures of the typical wave structures are shown in Figure 3b,d. To investigate the elemental composition of the wave structures, the point elemental analysis was carried on and the tested results were shown in Table 2 and Table 3. The increase of the gap distance leads to the increase of wavelength and amplitude. During the EXW processes, the kinetic energy of the Cu plate was converted into potential energy by colliding with the HEAs plate. The Cu plate is accelerated higher speeds due to a larger gap distance. Owing to the higher impact velocity, large waves are generated [28]. The formation of the wavy structure is a consequence of variations in the pressure distribution at the collision point caused by self-induced oscillation near the joining interface. The wavy interface is the main characteristic of explosive welded plates, which represents more welding are and higher bonding strength [29].
EDS analysis was applied as mapping and points at the Cu/HEAs interface at different locations. The results, as shown in Figure 4, Table 2 and Table 3, show an obvious concentration transition between the two metallic matrix, which dominates the entire interface. In addition, vortex zones near the valleys and crests are often formed with the formation of interface [30,31]. The deformed metal is heated here and the heat in the vortex zone is enough to melt metal [30]. The jet causes the Cu to penetrate into the HEAs, and the Cu content is highest among the elements. Moreover, under the condition of a 5 mm gap distance, the mixing zone exists on the Cu side and is separated from the interface since its collision angle was higher than that of the WCH2 welds. As shown in Figure 3d, peninsular HEA particles are dispersed in the mixed zone due to the detonation wave and the metal jet. Due to the higher impact velocity, the WCH5 weld exhibits an irregular wavy interface along with vortices and the molten metal jets could escape from the interface during EXW. The jet ejects the surface of the metal to turn into broken particles, and the rupture of the crest is embedded to other portions of the vortex. Upon rapid solidification, the molten metal solidifies in the vortex region where the broken particles are distributed. This result is similar to those of a recent copper/stainless steel EXW study [31].

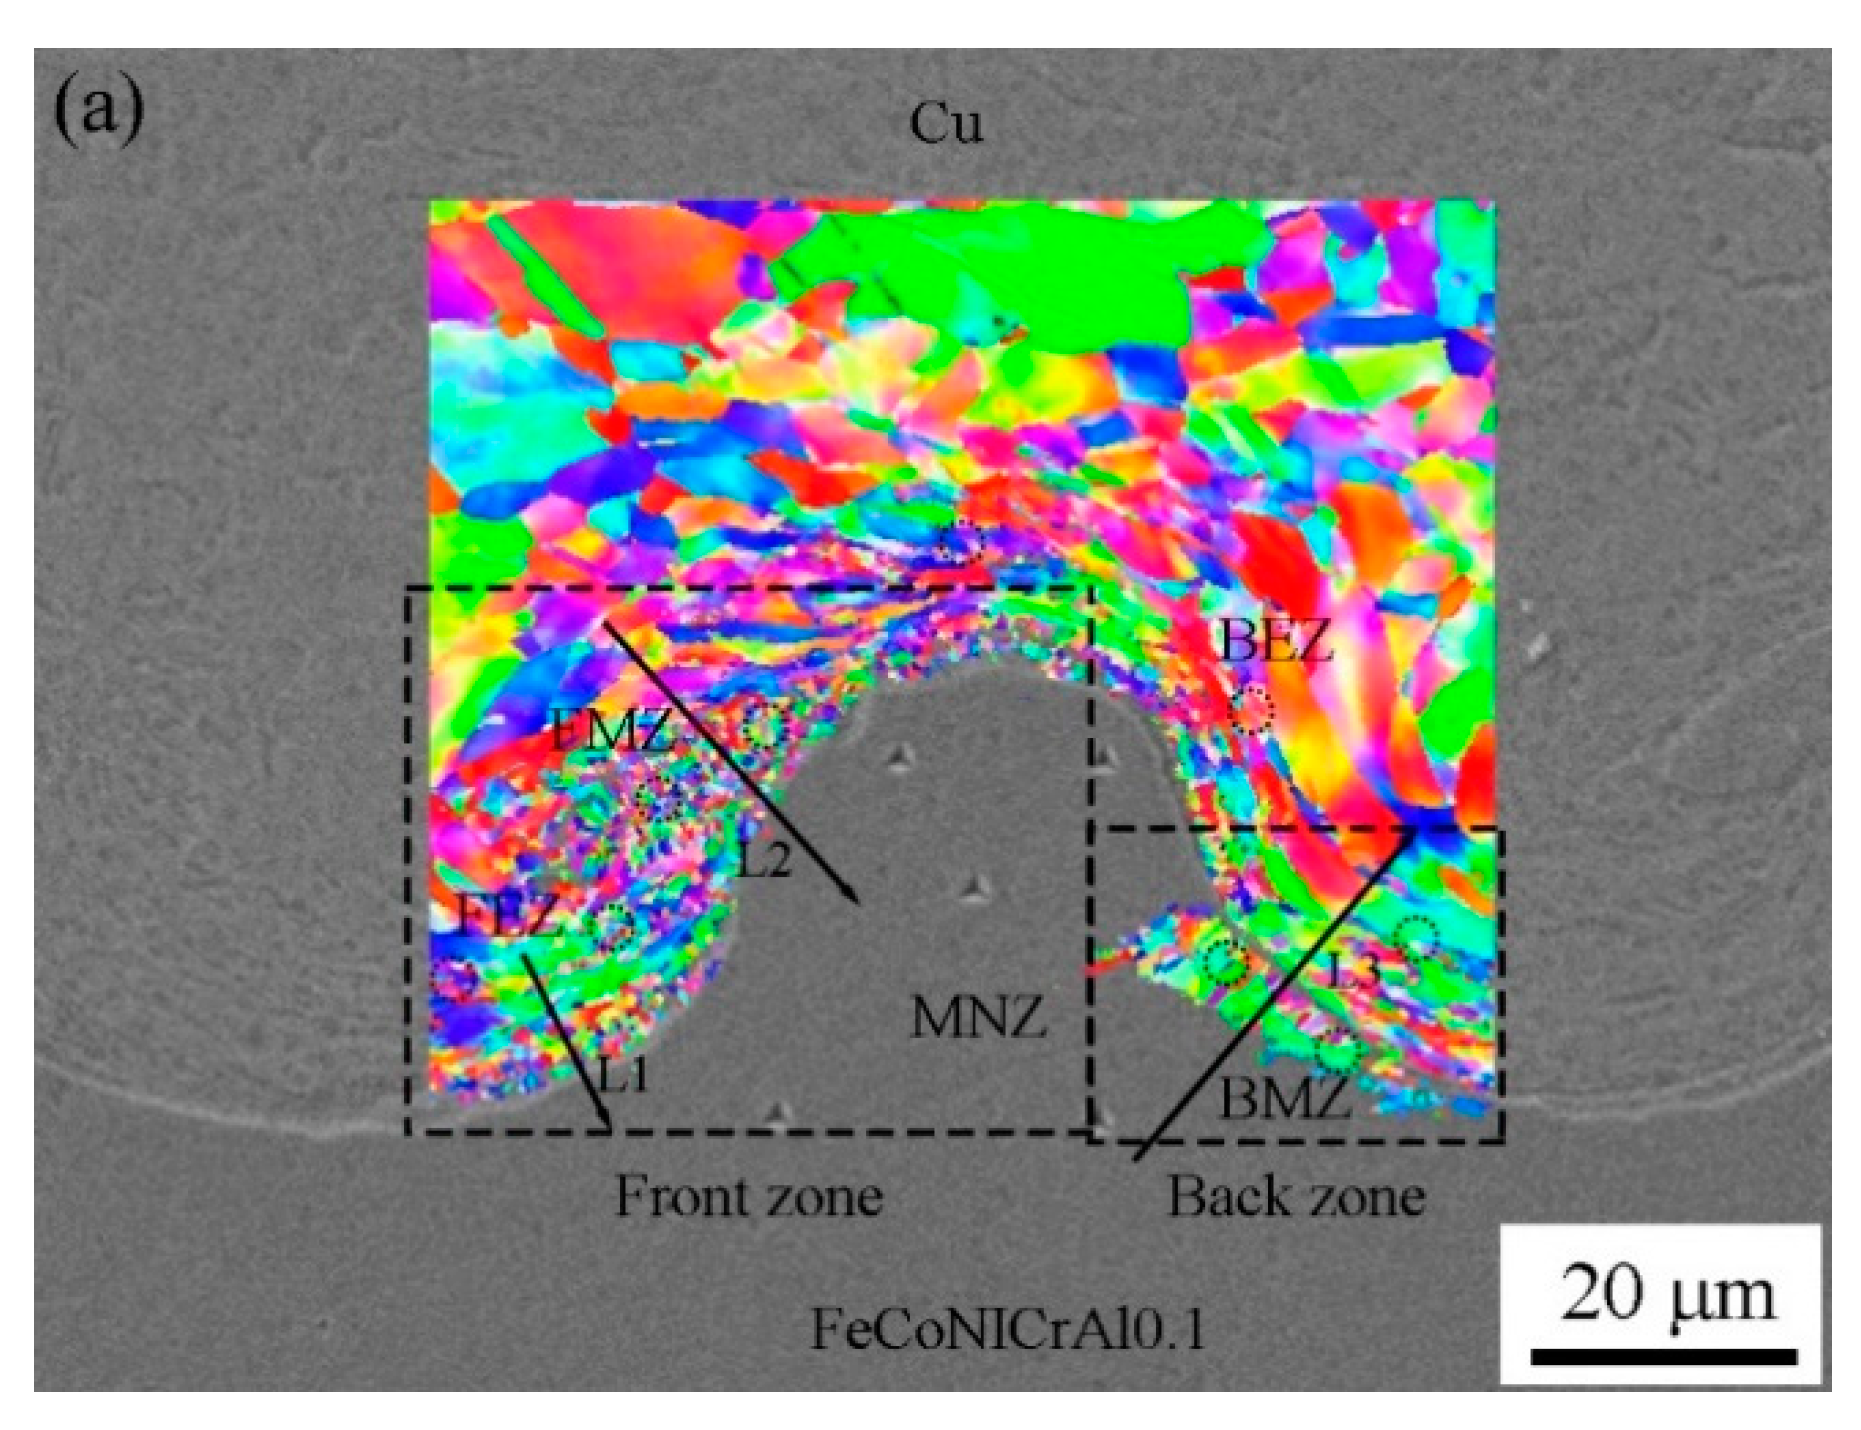
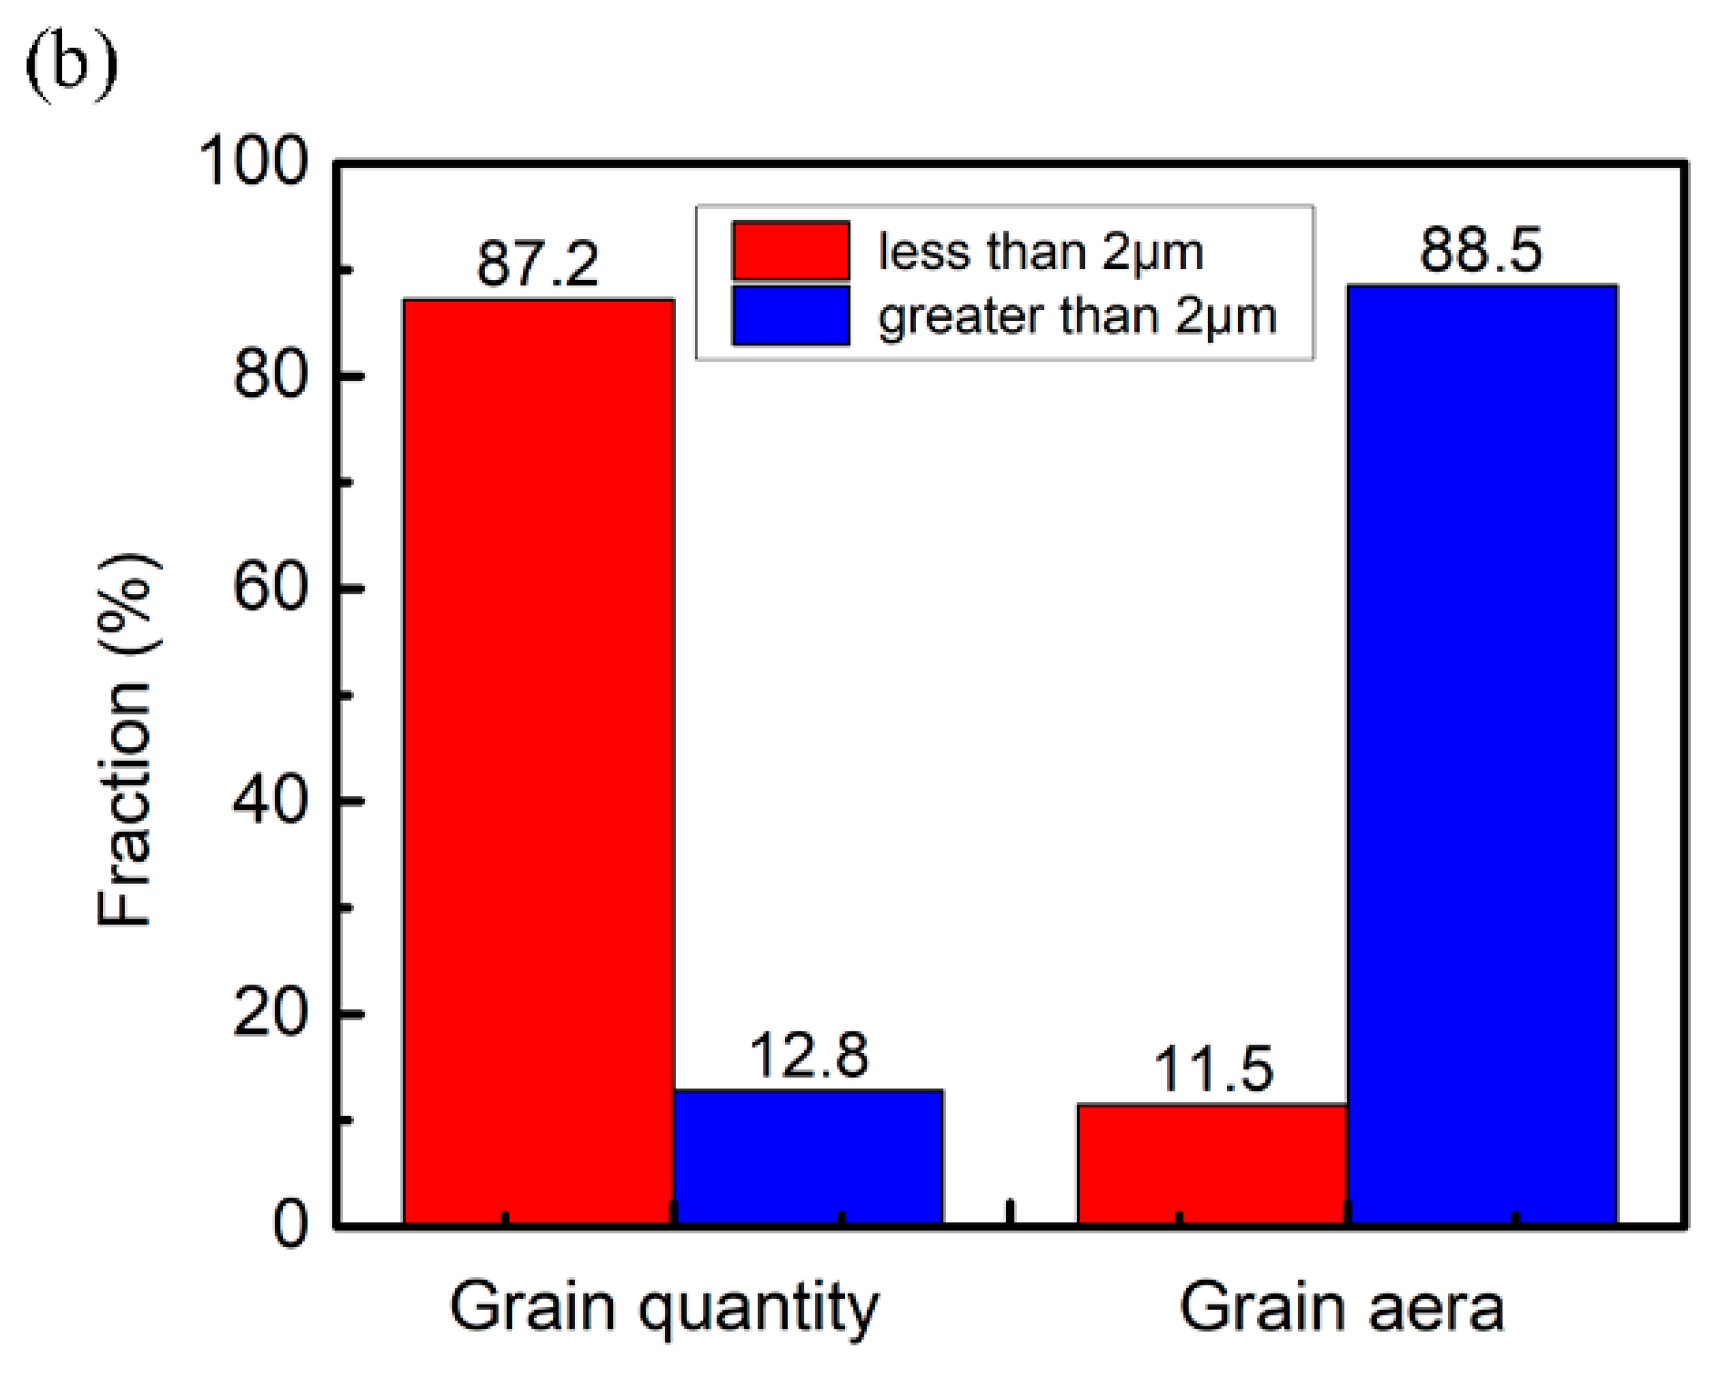
3.2. Microstructure Evolution

To investigate the phase constitution of materials under explosive impact loading at the welded interfaces, EBSD analysis of the WCH2 weld was conducted. A EBSD map with grain boundary (black lines) was obtained as shown in Figure 5. The HEAs side is partially unrecognizable using EBSD due to the severe deformation, which can be observed from the obvious orientation change in the inverse pole figure (IPF). A SEM photomicrograph of the test region at the interface is observed as shown in Figure 5a. The orientation map of IPF with a crystal orientation-color relationship diagram is shown in Figure 5b. The grain size of the as-cast HEAs is large, and only severe deformation occurs locally after the EXW, and no new recrystallized grains are produced. The grain size of the multi-element mixture in the vortex region is small compared to the grain size at the Cu side, as shown in Figure 5b. Since the EXW is a very rapid process, there is a very rapid thermal cycle for the grains, which prevents their growth [16]. Moreover, the vortex regions at the crests are mainly equiaxed fine grains and the vortex regions at the troughs are mainly smaller columnar crystals.
High strain accumulation occurred on both sides of the Cu and HEAs plates adjacent to the interface (Figure 5d). However, there was almost no strain accumulation in the vortex region and the Cu side, which indicated that recrystallization existed due to high temperature during the EXW processes. Meanwhile, the grain morphology of the vortex region showed different characteristics. Coarse columnar grains and uniform fine grains occurred along the direction perpendicular to the interface, instead of equiaxed grains in Cu matrix and as-cast grains in HEAs, in the mixture of the front-vortex zone and the post-vortex zone. In addition, the fine grains of the post-vortex region, that is, the recrystallized structure, grow and become larger than the grains in the front-vortex region. The high entropy mixture in the front-vortex region is almost surrounded by copper and is more likely to emanate heat than the post-vortex region, resulting in rapid cooling and finer grain formation. On the other hand, in the post-vortex region, an elongated flat shape is observed, and coarser columnar crystal grains are observed as compared with the front-vortex region. Different thermal conductivity of materials leads to different solidification times at different positions.
Figure 5c displays the phase distribution of the corresponding area in Figure 5b, and the FCC (face center cubic) phase is marked in red (the BCC (body centred cube) phase is marked in blue, which may be an inclusion). In copper-steel EXW, the dispersion of the iron phase is dotted around the grain boundaries [31]. However, in the EXW of the Cu and HEAs, the vortex region is still a single FCC phase. As shown in Table 4, the mixed region is still a homogeneous mixture of various elements, which is the same as the welds mentioned above. Bataev et al. studied the formation of metastable phases with regard to the composition of the welding metals [32]. It is considered that the solidification conditions of the EXW material are similar to the rapid solidification process conditions. Since the high cooling rate at the interface, the liquid state in the vortex region is reflected by the distribution of the solid phase under these conditions [16]. After stirring, the HEAs are uniformly distributed in the copper solution and a single FCC phase is formed in the melting zone (Figure 5).
Figure 5e is a recrystallization diagram for the corresponding region in Figure 5b. Blue, yellow and red indicate the recrystallized, substructure, and deformed material, respectively. It can be seen that blue is absolutely dominant in the front vortex region, indicating that most of the grains have completed the recrystallization. However, there are still partially deformed grains in the post-vortex region due to the welding stress.
In order to study the micromechanical properties of the interface, a nanoindentation test was performed near the interface, and the corresponding hardness value was marked at the position corresponding to the indentation in Figure 6a. As shown in Figure 6b, there is no significant difference between the hardness of the front grain elongation zone (FEZ) and the hardness of the back grain elongation zone (BEZ). In addition, the hardness of the front melting zone (FMZ) and the back melting zone (BMZ) is not significantly different. Because brittle intermetallic compounds may reduce strength, vortices are usually the easiest to break in the material. As shown in Figure 6b, the hardness of FMZ and BMZ is higher than FEZ and BEZ, but lower than the hardness of matrix near interface (MNI) of the HEA after explosive welding, thus avoiding excessive stress concentration [33]. The mixed region of copper and FeCoNiCrAl0.1 maintains a crystalline state in which various elements are mixed. This is consistent with the observation from the microstructural analysis of the previous EDS and the phase composition of the vortex region in the EBSD diagram. The smaller grain size of mixture in the vortex region and the relatively high hardness of the CuCoNiCrAlFe system cause the higher hardness value of the mixture [1]. According to the Hall–Petch effect of the HEAs, the grain refinement of the vortex region improves the microscopic properties of the welded joint. As shown in Figure 6, the nanohardness with a maximum of 15.75 GPa is observed in the elongation zone. However, there is no obvious grain size change in elongation zone and the hardness distribution in elongation zone is more uniform. In addition, the hardness in this region is greater than the hardness (2.84 GPa) of the copper matrix, mainly due to fine grain strengthening and work hardening. It is worth noting that, as shown in Figure 7a, after explosive welding, a large number of crystal grains smaller than 2 μm were produced. However, as shown in Figure 7b, although the number of crystal grains smaller than 2 μm accounted for 86.7% of the total number, the area ratio is only 13.3%. These small grains are mainly concentrated near the interface, which enhances the interface strength of explosive welding.
The transition layer between HEAs and copper alternates between the mixed region and the solid-solid bonding region, resulting in a non-uniform microstructure in the interface, as shown in Figure 5 and Figure 7. During EXW, the severe deformation at the impact point causes the metal to melt and vortex regions after the crests or troughs occur. Figure 8 and Figure 9 show the chemical distribution in the vortex. The results of EDS indicate that Cu, Fe, Co, Ni, Cr and Al are simultaneously present in the localized melting zone, and the mixture is present at a ratio of Cu to FeCoNiCrAl0.1 HEAs. In the mixed region, the distribution of the Cu, Fe, Co, Ni, Cr and Al elements presents a platform. However, the elements in the solid-solid binding region are atomically diffused, and the element distribution has a large gradient. Although copper possess the high thermal conductivity, there is not enough time to spread the heat generated by the severe deformation during EXW. The accumulated energy causes a portion of the copper and HEAs in the interface to melt. The melting point of copper is 1083 °C, and the melting point of the FeCoNiCrAl0.1 HEAs is about 1500 °C. Therefore, copper melts before HEAs, and then more liquid copper is mixed with molten HEA, which explains the dominant position of Cu element in the mixed region. Moreover, Yeh et al. [34] concluded that compound formation is suppressed and random solid solutions are more easily yielded during solidification in alloys with a high number of principal elements. The entropic contribution to the free energy at the melting temperature is comparable to the formation enthalpies of strong intermetallic compounds. In addition, Figure 10 and Table 4 show that all mixing zones exhibit a mixed multi-element composition, which is inferred that confirming that it may not be an intermetallic compound that affects the bonding quality. Therefore, by analyzing various combinations of interfaces, it is reasonable to believe that the mixture at the interface of the HEAs and dissimilar metal is composed of a multi-element crystalline mixture in which two materials are mixed, rather than an intermetallic compound. In addition, fine crystals can be formed at the bonding interface, and a high-strength bonding can be produced without affecting the properties of the base material.

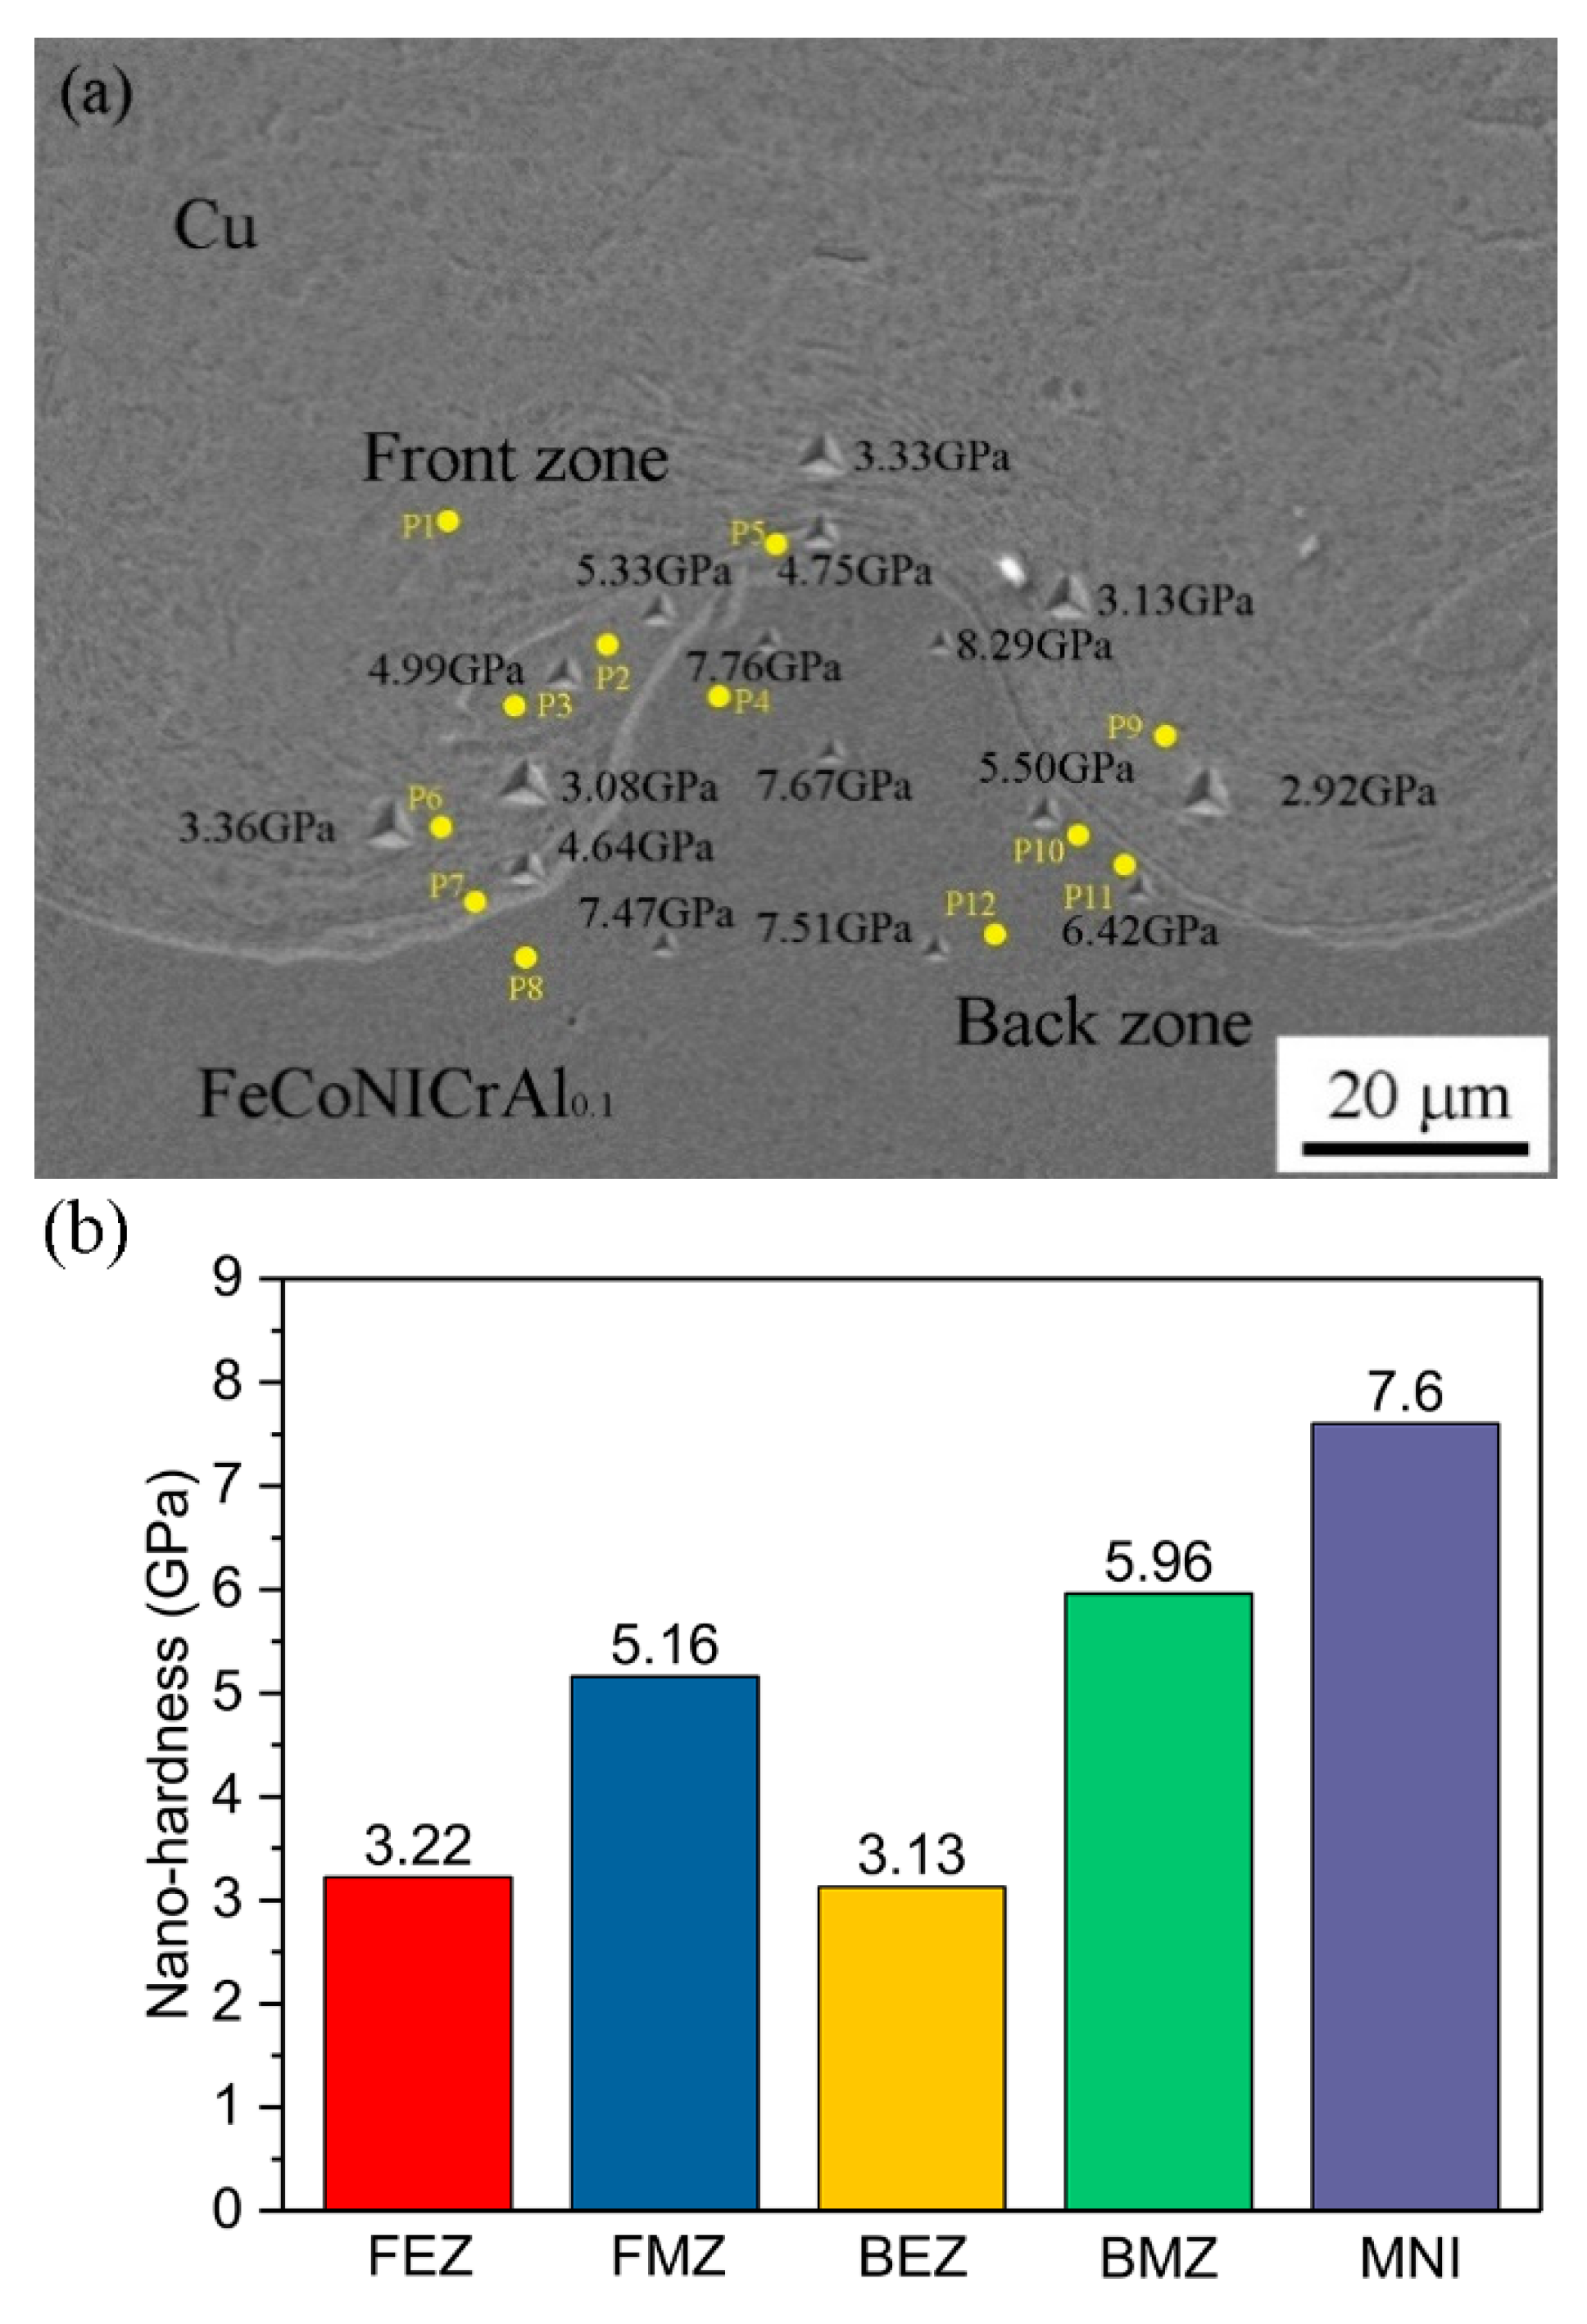
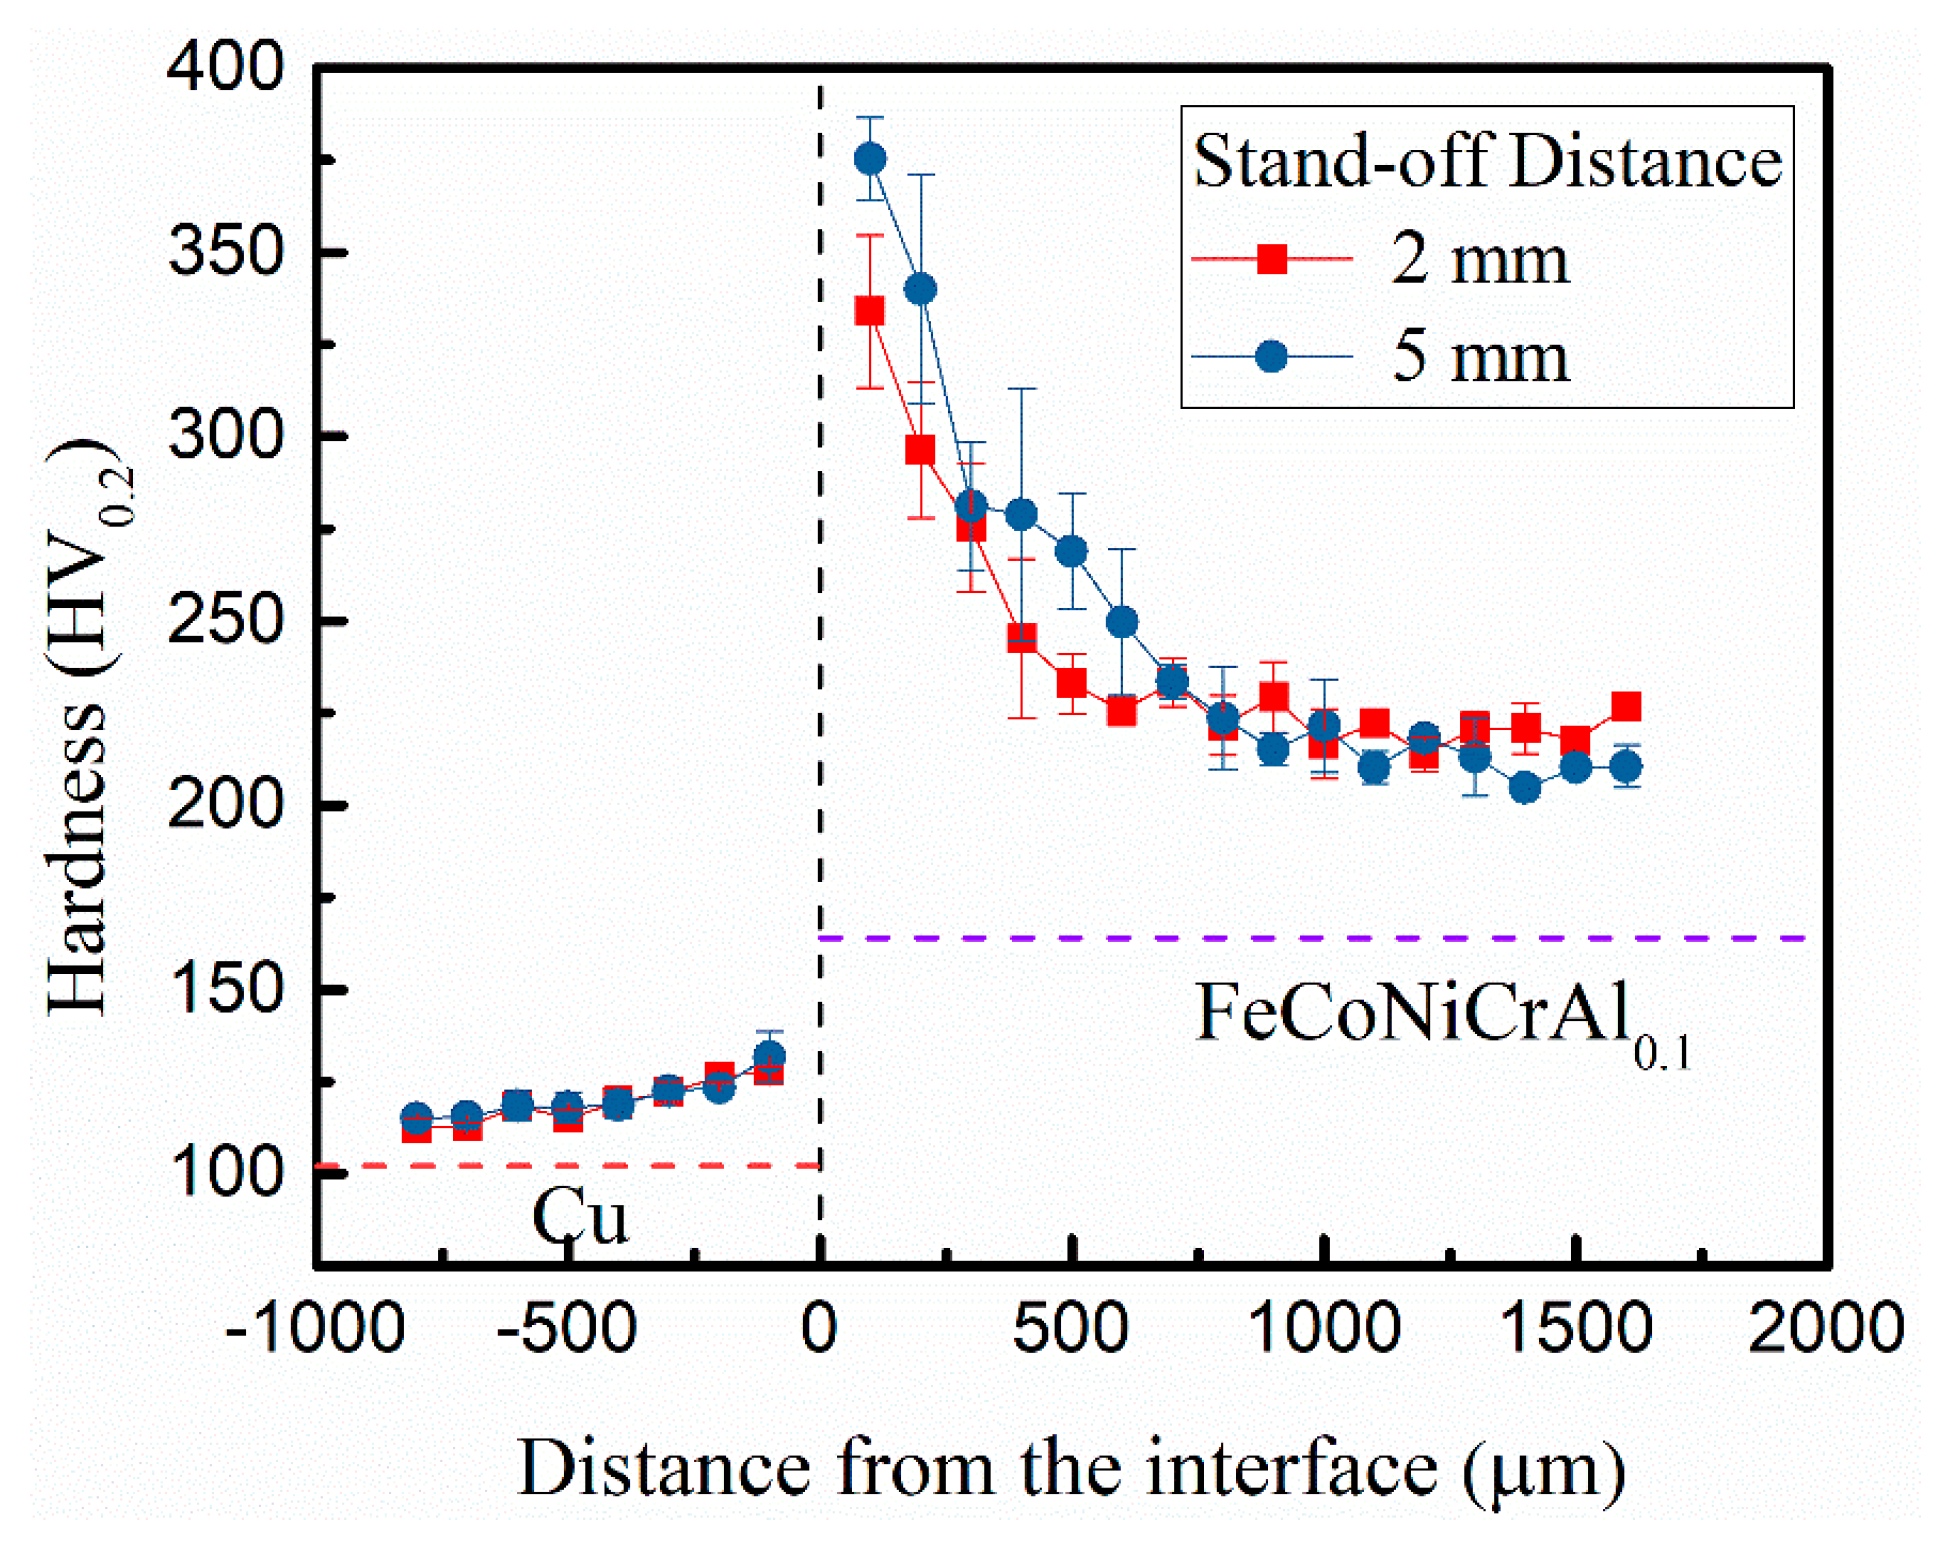
3.3. Hardness Distribution

As shown in Figure 11, micro-hardness values of all the samples are higher near the welding interface. Moreover, the hardness away from the interface is gradually lowered. The average hardness of the HEAs plates (purple line) and Cu plates (orange line) is shown in Figure 11. The micro-hardness of the pure copper region and the FeCoNiCrAl0.1 HEAs region at locations away from the interface are 102 and 164 HV, respectively. The micro-hardness value of the deformation region of the HEAs material is significantly increased, and the hardness of the matrix is significantly lower than that near the interface. The micro-hardness of Cu gradually increased from 115 to 135 HV, and sharply increased to 375 HV near the melted zone of the Cu/HEAs joining interface, which may be related to the formation of intermetallic compounds in the vortex zone. As the distance from the HEAs interface increases, the micro-hardness of HEAs gradually decreases, and a stable value at a position far from the interface is about 215 HV. However, the increase in hardness of the HEAs side is more pronounced, which indicates that the plastic deformation on the HEAs side is more severe due to the compaction on the as-cast microstructure from impact. There exists an increased hardness when the welding is used at a higher gap distance, which is consistent with the higher impact velocity parameters, as shown in Figure 2. Owing to work, hardening occurs near the EXW interface. As the distance from the interface increases, the effect of work hardening gradually decreases.

4. Conclusions

This study has investigated the formation of weld interfaces between flying plates and base plates composed of various commercial materials and high-entropy alloys (HEAs), respectively, and their effects on the weldability of materials. The following conclusions can be drawn:
  • EXW was successfully employed to produce bimetallic composites containing HEAs and commercial copper alloy. Different wavy bonding interfaces could be obtained by EXW controlling the welding parameters. In addition, a defect-free explosive welding joint could be obtained with suitable welding parameters.
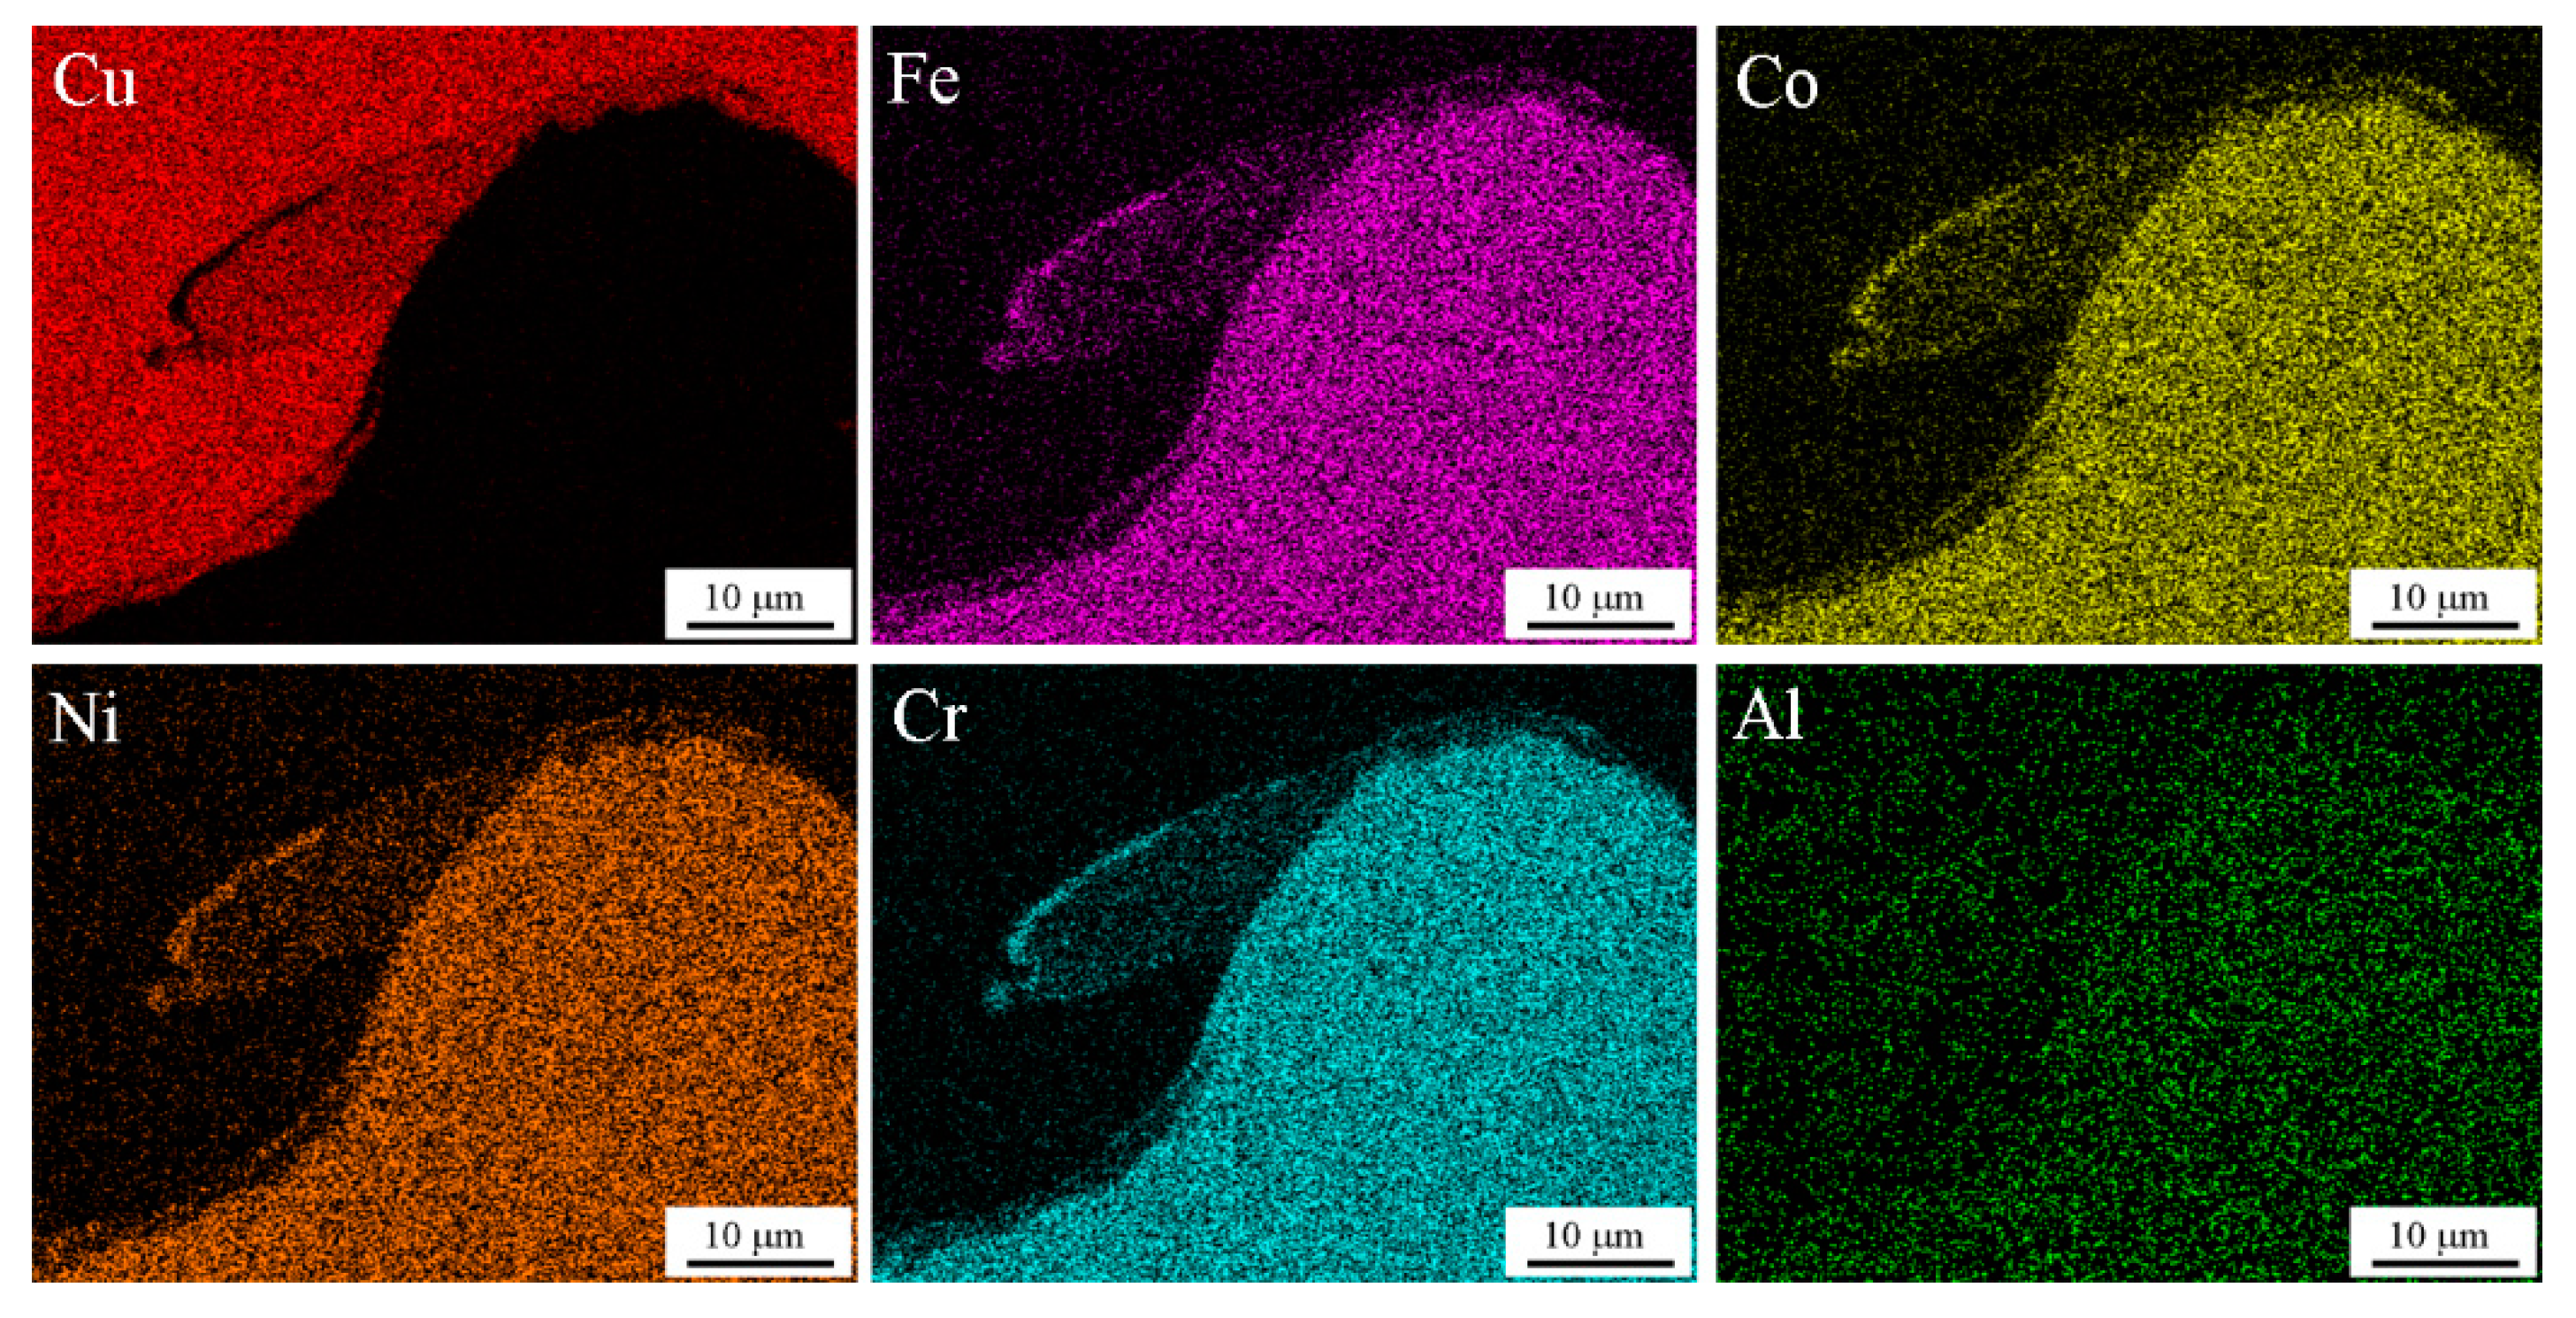
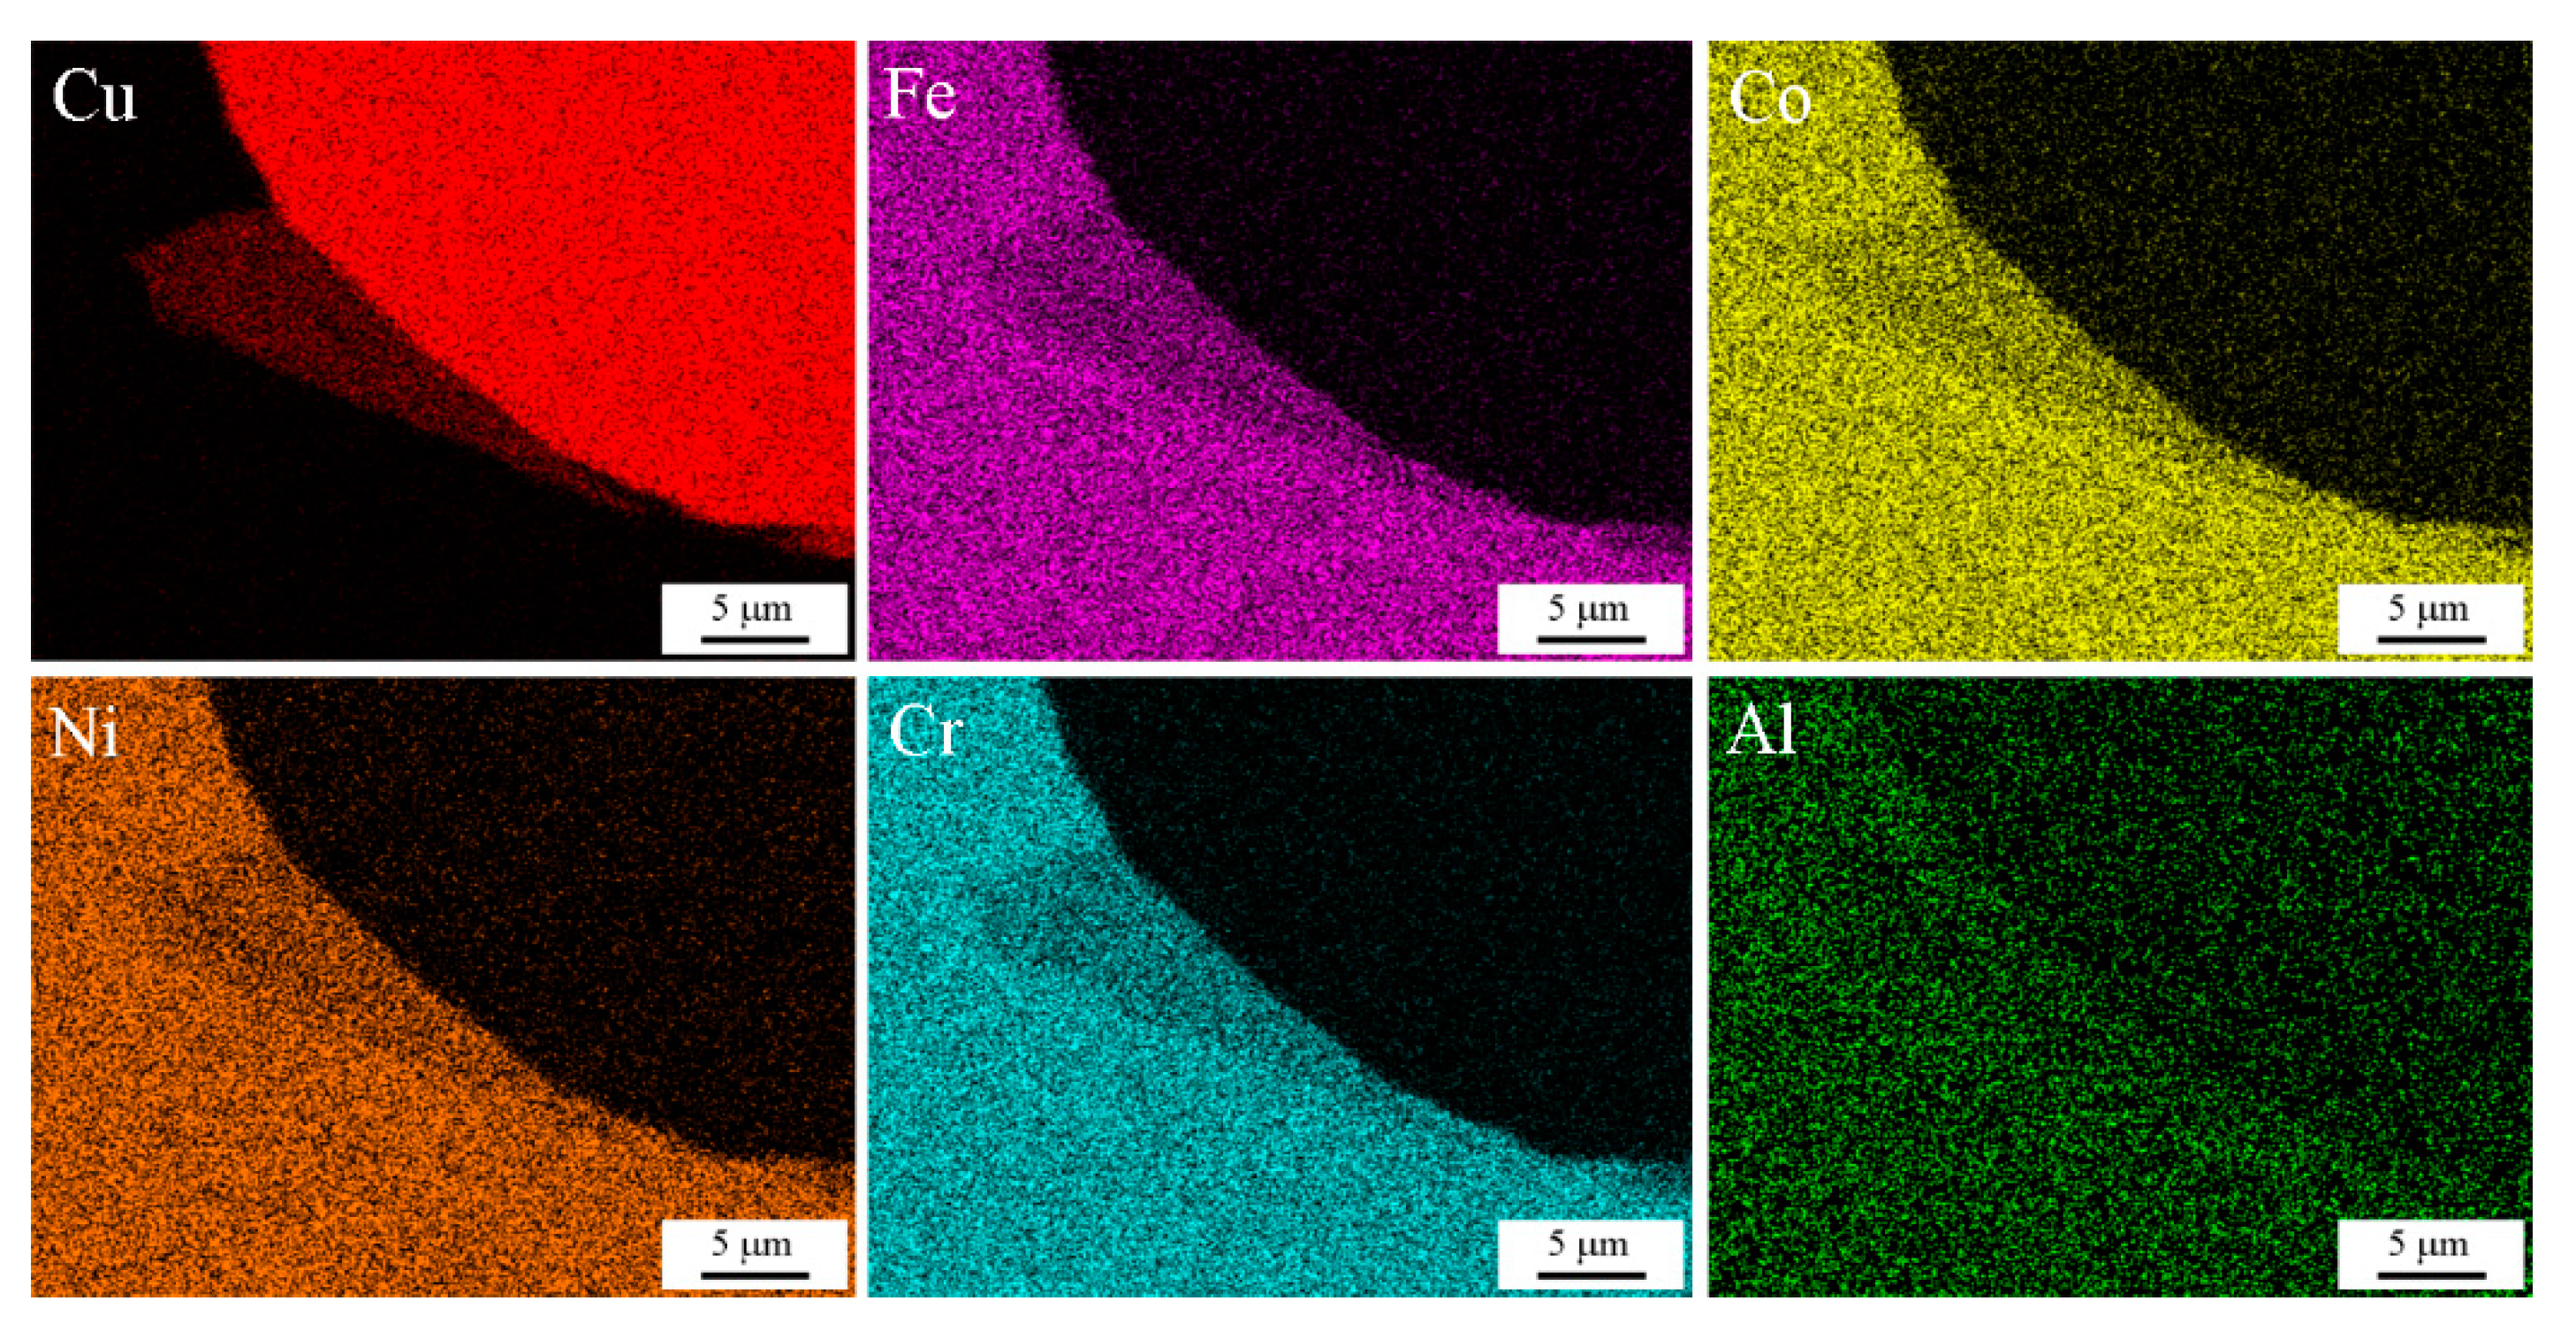
  • The mixed region formed at the interface had a chemical composition in which the compositions of the two plates were mixed. At lower impact velocity, the vortex zone exhibited a uniform composition, with a particular mixing ratio depending on the location at the interface. However, the mixed region of HEA and dissimilar metals still exhibited a multi-element mixture and maintained crystal structure.
  • Due to the action of the jet, the microstructure adjacent to the interface exhibited considerable grain deformation, which was elongated in the detonation direction. Due to the excellent heat-conducting property of copper, the cooling rates in the vortex regions at the front and rear of the waves were different, and fine and columnar grains are formed, respectively.
  • The hardness was lower away from the interface and gradually increased near the interface due to microstructural evolution and plastic deformation. As the gap distance increased, the collision speed increased, causing the wavy interface to be increased and the hardness to also be increased due to more energy to be consumed at the interface after the collision between plates.

Author Contributions

Conceptualization, Q.T.; Formal analysis, Z.S. and Y.Z.; Funding acquisition, Y.Z. and H.M.; Methodology, H.M.; Resources, Z.S. and Y.S.; Software, M.Y.; Writing—original draft, Q.T.; Writing—review & editing, H.L. All authors have read and agreed to the published version of the manuscript.

Funding

The reported research is supported by the China National Natural Science (Nos. 51674229 and 51874267)

Conflicts of Interest

The authors declare no conflict of interest.

References

  1. Zhang, Y.; Zuo, T.T.; Tang, Z.; Gao, M.C.; Dahmen, K.A.; Liaw, P.K.; Lu, Z.P. Microstructures and properties of high-entropy alloys. Prog. Mater. Sci. 2014, 61, 1–93. [Google Scholar] [CrossRef]
  2. George, E.P.; Raabe, D.; Ritchie, R.O. High-entropy alloys. Nat. Rev. Mater. 2019, 4, 515–534. [Google Scholar] [CrossRef]
  3. Guo, J.; Tang, C.; Rothwell, G.; Li, L.; Wang, Y.-C.; Yang, Q.; Ren, X. Welding of High Entropy Alloys—A Review. Entropy 2019, 21, 431. [Google Scholar] [CrossRef] [PubMed] [Green Version]
  4. Hemphill, M.A.; Yuan, T.; Wang, G.Y.; Yeh, J.W.; Tsai, C.W.; Chuang, A.; Liaw, P.K. Fatigue behavior of Al0.5CoCrCuFeNi high entropy alloys. Acta Mater. 2012, 60, 5723–5734. [Google Scholar] [CrossRef]
  5. Pancikiewicz, K.; Swierczynska, A.; Hucko, P.; Tumidajewicz, M. Laser Dissimilar Welding of AISI 430F and AISI 304 Stainless Steels. Materials 2020, 13, 4540. [Google Scholar] [CrossRef] [PubMed]
  6. Zhao, X.H.; Shi, Z.F.; Deng, C.; Liu, Y.; Li, X. The Effect of Laser Offset Welding on Microstructure and Mechanical Properties of 301L to TA2 with and without Cu Intermediate Layer. Metals 2020, 10, 1138. [Google Scholar] [CrossRef]
  7. Cui, Y.; Liu, D.; Zhang, Y.; Deng, G.P.; Fan, M.Y.; Chen, D.; Sun, L.X.; Zhang, Z.W. The Microstructure and Mechanical Properties of TA1-Low Alloy Steel Composite Plate Manufactured by Explosive Welding. Metals 2020, 10, 663. [Google Scholar] [CrossRef]
  8. Arab, A.; Guo, Y.S.; Zhou, Q.; Chen, P.W. Joining AlCoCrFeNi high entropy alloys and Al-6061 by explosive welding method. Vacuum 2020, 174, 109221. [Google Scholar] [CrossRef]
  9. Wu, Z.; David, S.A.; Feng, Z.; Bei, H. Weldability of a high entropy CrMnFeCoNi alloy. Scr. Mater. 2016, 124, 81–85. [Google Scholar] [CrossRef] [Green Version]
  10. Zhu, Z.; Sun, Y.; Ng, F.; Goh, M.; Liaw, P.; Fujii, H.; Nguyen, Q.; Xu, Y.; Shek, C.; Nai, S. Friction-stir welding of a ductile high entropy alloy: Microstructural evolution and weld strength. Mater. Sci. Eng. A 2018, 711, 524–532. [Google Scholar] [CrossRef]
  11. Nam, H.; Park, C.; Moon, J.; Na, Y.; Kim, H.; Kang, N. Laser weldability of cast and rolled high-entropy alloys for cryogenic applications. Mater. Sci. Eng. A 2019, 742, 224–230. [Google Scholar] [CrossRef]
  12. Sokkalingam, R.; Mishra, S.; Cheethirala, S.R.; Muthupandi, V.; Sivaprasad, K. Enhanced Relative Slip Distance in Gas-Tungsten-Arc-Welded Al 0.5 CoCrFeNi High-Entropy Alloy. Metall. Mater. Trans. A 2017, 48, 3630–3634. [Google Scholar] [CrossRef]
  13. Chu, Q.; Zhang, M.; Li, J.; Yan, C. Experimental and numerical investigation of microstructure and mechanical behavior of titanium/steel interfaces prepared by explosive welding. Mater. Sci. Eng. A 2017, 689, 323–331. [Google Scholar] [CrossRef]
  14. Paul, H.; Miszczyk, M.; Chulist, R.; Prażmowski, M.; Morgiel, J.; Gałka, A.; Faryna, M.; Brisset, F. Microstructure and phase constitution in the bonding zone of explosively welded tantalum and stainless steel sheets. Mater. Des. 2018, 153, 177–189. [Google Scholar] [CrossRef]
  15. Findik, F. Recent developments in explosive welding. Mater. Des. 2011, 32, 1081–1093. [Google Scholar] [CrossRef]
  16. Zhu, Z.; Ng, F.L.; Qiao, J.; Liaw, P.K.; Chen, H.-C.; Nai, S.M.L.; Wei, J.; Bi, G.J. Interplay between microstructure and deformation behavior of a laser-welded CoCrFeNi high entropy alloy. Mater. Res. Express. 2019, 6, 046514V. [Google Scholar] [CrossRef]
  17. Zhang, T.; Wang, W.; Zhang, W.; Wei, Y.; Cao, X.; Yan, Z.; Zhou, J. Microstructure evolution and mechanical properties of an AA6061/AZ31B alloy plate fabricated by explosive welding. J. Alloy. Compd. 2018, 735, 1759–1768. [Google Scholar] [CrossRef]
  18. Mendes, R.; Ribeiro, J.; Plaksin, I.; Campos, J.; Tavares, B. Differences between the detonation behavior of emulsion explosives sensitized with glass or with polymeric micro-balloons. J. Phys. Conf. Ser. 2014, 500, 052030. [Google Scholar] [CrossRef]
  19. Li, X.; Ma, H.; Shen, Z. Research on explosive welding of aluminum alloy to steel with dovetail grooves. Mater. Des. 2015, 87, 815–824. [Google Scholar] [CrossRef]
  20. Athar, M.H.; Tolaminejad, B. Weldability window and the effect of interface morphology on the properties of Al/Cu/Al laminated composites fabricated by explosive welding. Mater. Des. 2015, 86, 516–525. [Google Scholar] [CrossRef]
  21. Yang, M.; Ma, H.; Shen, Z. Study on self-restrained explosive welding with high energy efficiency. Int. J. Adv. Manuf. Technol. 2018, 99, 3123–3132. [Google Scholar] [CrossRef]
  22. Deribas, A.; Zakharenko, I. Surface effects with oblique collisions between metallic plates. Combust. Explos. Shock Waves 1974, 10, 358–367. [Google Scholar] [CrossRef]
  23. Carpenter, S.; Wittman, R. Explosion welding. Annu. Rev. Mater. Sci. 1975, 5, 177–199. [Google Scholar] [CrossRef]
  24. Cowan, G.; Bergmann, O.; Holtzman, A. Mechanism of bond zone wave formation in explosion-clad metals. Metall. Mater. Trans. B 1971, 2, 3145–3155. [Google Scholar] [CrossRef]
  25. Abrahamson, G.R. Permanent periodic surface deformations due to a traveling jet. J. Appl. Mech. 1961, 28, 519–528. [Google Scholar] [CrossRef]
  26. Cooper, P.W. Explosives Engineering; John Wiley & Sons: Hoboken, NJ, USA, 2018. [Google Scholar]
  27. Flis, W.J. A Lagrangian approach to modeling the acceleration of metal by explosives. In Proceedings of the 17th Southeastern Conference on Theoretical and Applied Mechanics, Hot Springs National Park, AR, USA, 10–12 April 1994. [Google Scholar]
  28. Skuza, W.; Paul, H.; Berent, K.; Prazmowski, M.; Bobrowski, P. In Microstructure and Mechanical Properties of Ti/Cu Clads Manufactured by Explosive Bonding at Different Stand-Off Distances. Key Eng. Mater. 2016, 716, 464–471. [Google Scholar] [CrossRef]
  29. Liang, H.L.; Luo, N.; Shen, T.; Sun, X.; Fan, X.R.; Cao, Y. Experimental and numerical simulation study of Zr-based BMG/Al composites manufactured by underwater explosive welding. J. Mater. Res. Technol. 2020, 9, 1539–1548. [Google Scholar] [CrossRef]
  30. Bataev, I.; Tanaka, S.; Zhou, Q.; Lazurenko, D.; Junior, A.J.; Bataev, A.; Hokamoto, K.; Mori, A.; Chen, P. Towards better understanding of explosive welding by combination of numerical simulation and experimental study. Mater. Des. 2019, 169, 107649. [Google Scholar] [CrossRef]
  31. Zhang, H.; Jiao, K.X.; Zhang, J.L.; Liu, J. Comparisons of the microstructures and micro-mechanical properties of copper/steel explosive-bonded wave interfaces. Mater. Sci. Eng. A 2019, 756, 430–441. [Google Scholar] [CrossRef]
  32. Bataev, I.; Lazurenko, D.; Tanaka, S.; Hokamoto, K.; Bataev, A.; Guo, Y.; Jorge, A., Jr. High cooling rates and metastable phases at the interfaces of explosively welded materials. Acta Mater. 2017, 135, 277–289. [Google Scholar] [CrossRef]
  33. Ning, J.; Zhang, L.-J.; Xie, M.-X.; Yang, H.-X.; Yin, X.-Q.; Zhang, J.-X. Microstructure and property inhomogeneity investigations of bonded Zr/Ti/steel trimetallic sheet fabricated by explosive welding. J. Alloy. Compd. 2017, 698, 835–851. [Google Scholar] [CrossRef]
  34. Yeh, J.W.; Chen, S.K.; Lin, S.J.; Gan, J.Y.; Chin, T.S.; Shun, T.T.; Tsau, C.H.; Chang, S.Y. Nanostructured high-entropy alloys with multiple principal elements: Novel alloy design concepts and outcomes. Adv. Eng. Mater. 2004, 6, 299–303. [Google Scholar] [CrossRef]
Figure 1. (a) EXW configuration using a honeycomb explosive, (b) Schematic diagram of the EXW process, (c) Schematic diagram of honeycomb explosive.
Coatings 10 01197 g001
Figure 2. The explosive weldability window of HEAs and Cu.
Coatings 10 01197 g002
Figure 3. Morphology of the welding interface and a larger view of the corresponding area: (a,b) WCH2; (c,d) WCH5.
Coatings 10 01197 g003
Figure 4. The element mapping of Cu, Fe, Co, Ni Cr and Al on the WCH2 (a,c,e,g,i,k) and WCH5 (b,d,f,h,j,l) interface.
Coatings 10 01197 g004
Figure 5. EBSD analysis results of WCH2 at the interface. (a) SEM micrograph selected for EBSD testing. (b) EBSD inverse pole figure (IPF). (c) Phase map of the FCC (red), and BCC (blue). (d) Kernel average misorientation image. (e) Recrystallization distribution diagram.
Coatings 10 01197 g005
Figure 6. (a) Nanometer indentation test results of welded joints; (b) nanometer indentation data for selected areas.
Coatings 10 01197 g006
Figure 7. (a) The EBSD image of the element test area; (b) Grain size statistics.
Coatings 10 01197 g007aCoatings 10 01197 g007b
Figure 8. The element distribution corresponding to the front zone in Figure 7.
Coatings 10 01197 g008
Figure 9. The element distribution corresponding to the back zone in Figure 7.
Coatings 10 01197 g009
Figure 10. The distribution of the elements on the line L1, L2, and L3 in Figure 7.
Coatings 10 01197 g010
Figure 11. Hardness distribution at the interface of WCH2 and WCH5.
Coatings 10 01197 g011
Table 1. Components of the emulsion matrix.
ComponentNH4NO3NaNO3H2OC18H38C24H44O6C12H26
Mass fraction75%10%8%4%2%1%
Table 2. Chemical composition of corresponding points in Figure 3b (at.%).
Point Number/
Chemical Element
CuFeCoNiCrAl
1100
288.23.03.02.62.70.5
381.74.74.64.54.40.2
4100
523.723.224.325.92.9
Table 3. Chemical composition of corresponding points in Figure 3d (at.%).
Point Number/
Chemical Element
CuFeCoNiCrAl
1100
279.94.74.95.14.80.6
370.57.16.87.57.40.7
424.124.224.425.12.2
544.613.613.613.613.21.4
670.66.97.57.07.40.6
725.224.923.723.72.5
Table 4. Chemical composition of corresponding points for nanoindentation image (Figure 11) (at.%).
Point Number/
Chemical Element
CuFeCoNiCrAl
1100
276.795.485.445.675.730.88
376.495.615.545.636.080.66
424.6323.8423.3825.502.65
576.495.615.545.636.080.66
6100
711.2221.3721.2021.3722.642.20
824.4924.3923.2925.172.66
9100
1025.1418.2117.9618.1518.562.07
1127.8217.4417.3417.4018.061.94
1225.3725.4723.3523.762.05
Publisher’s Note: MDPI stays neutral with regard to jurisdictional claims in published maps and institutional affiliations.

