Article

Characterization of Thermochemical and Thermomechanical Properties of Eyjafjallajökull Volcanic Ash Glass

by
Rebekah I. Webster
1,
Narottam P. Bansal
2,
Jonathan A. Salem
2,
Elizabeth J. Opila
1 and
Valerie L. Wiesner
3,*
1
Materials Science and Engineering Department, University of Virginia, Charlottesville, VA 22903, USA
2
Materials and Structures Division, NASA Glenn Research Center, Cleveland, OH 44135, USA
3
Advanced Materials and Processing Branch, NASA Langley Research Center, Hampton, VA 23681, USA
*
Author to whom correspondence should be addressed.
Coatings 2020, 10(2), 100; https://doi.org/10.3390/coatings10020100
Submission received: 23 December 2019 / Revised: 16 January 2020 / Accepted: 19 January 2020 / Published: 23 January 2020
(This article belongs to the Special Issue Environmental Barrier Coatings)

Abstract

:
The properties of a volcanic ash glass obtained from the Eyjafjallajökull eruption of 2010 were studied. Crystallization experiments were carried out on bulk and powdered glass samples at temperatures between 900 and 1300 °C. Iron oxides, Fe3O4 and Fe2O3, and a silicate plagioclase, (Na,Ca)(Si,Al)4O8, were observed. Bulk samples remained mostly amorphous after up to 40 h at temperature. Powdered glass samples showed increased crystallinity after heat treatment compared to bulk samples. The average coefficient of thermal expansion of the glass was 7.00 × 10⁻⁶ K−1 over 25–720 °C. The Vickers hardness of the glass was 6–7 GPa and the indentation fracture toughness, 1–2 MPa √m Values for density, elastic modulus, and Poisson’s ratio were 2.52 g/cm3, 75 GPa, and 0.24, respectively. The viscosity of the glass was determined experimentally and compared to three common models from the literature. The implications for the deposition of volcanic ash on hot section components of aircraft turbine engines are discussed.

1. Introduction

Particulates comprised of mainly calcium, magnesium, aluminum, and silicon oxides (CaO–MgO–Al2O3–SiO2 or CMAS) stand as a challenge in the development of coating systems for next-generation aircraft turbine engines. CMAS originates as siliceous debris, such as sand, volcanic ash, or runway dust, which can be ingested into the turbine on takeoff, landing, or during flight and deposit on hot-section components [1,2]. CMAS melts at ~1200 °C and can infiltrate the protective barrier coatings (thermal and environmental barrier coatings, T/EBCs) needed for engine components.
Currently, superalloy components can reach a maximum temperature of ~1200–1300 °C due to the presence of a thermal barrier coating (TBC) which acts as a thermally protective topcoat [3]. Silicon carbide (SiC)-based ceramic matrix composites (CMCs) are proposed to replace some conventional Ni-base superalloys as turbine engine materials due to their higher operating temperatures and lighter weight, resulting in increased efficiency [4]. EBCs are required as a topcoat for CMCs to prevent thermally grown silicon oxide (SiO2) from volatilizing in water vapor, a species resulting from the combustion of jet fuel in the engine. In addition to stability in water vapor and high-temperature environments, among other requirements [5], EBCs must be resistant to CMAS attack. The target operating temperature for CMCs approaches 1500 °C [6]. The temperatures experienced by both T/EBC systems are typically above CMAS melting temperatures [7].
It has been proposed in the literature that inducing crystallization of CMAS at the T/EBC-melt interface is a viable strategy in mitigating CMAS attack by limiting the extent of glass ingress [8,9]. Many studies have been conducted on different coating materials wherein the ability of the T/EBC to promote crystallization of CMAS was probed and the evolution of coating/glass phases was monitored as a function of temperature and/or time [8,10,11,12,13]. Conversely, few reports have isolated the crystallization behavior of CMAS alone. CMAS composition can vary widely, depending on its source and location [14]. As such, the intrinsic properties of these glasses may also be expected to differ. In addition to crystallization behavior, CMAS composition influences its melting temperature and viscosity, both important parameters when considering coating infiltration. Mechanical properties (i.e., coefficient of thermal expansion, hardness, toughness) of CMAS can also vary and are required to fully describe coating degradation.
Zaleski et al. used differential scanning calorimetry (DSC) to probe the melting and crystallization behavior of ternary CAS, CMAS, and Fe-containing CFAS and CMFAS synthetic deposits [15]. In general, it appeared that most of the melts under study were resistant to crystallization upon cooling at 10 °C/min. This behavior was most prominent in CAS compositions. The addition of Fe, however, promoted the crystallization of phases including hematite (Fe2O3), esseneite (CaFeAlSiO6), and Ca-ferrite (CaFe2O4), as indicated by x-ray diffraction (XRD). Isothermal DSC measurements on a Ca13Fe10Al18Si59 (mol %) glass showed significantly increased crystallization kinetics compared to the ternary Ca15Al20Si65 having a similar Ca:Si ratio and Al content. The presence of Fe is likely important when considering volcanic ash glasses, as bulk compositions have been previously reported with up to 16 at % Fe [16].
The objective of the current work was to characterize the intrinsic properties of a volcanic ash glass containing CMAS and Fe2O3, TiO2, Na2O, and K2O. The crystallization behavior of the volcanic ash glass was determined in bulk and powdered form. Thermal and mechanical properties including melting (Tm) and glass transition (Tg) temperature, coefficient of thermal expansion (CTE), hardness, indentation fracture toughness, elastic modulus (E), and Poisson’s ratio (ν) were also measured. Glass viscosity was determined experimentally and compared to calculated values based on composition using several viscosity models described in the literature. The intrinsic properties of the volcanic ash glass were compared to those of previously investigated synthetic sand and desert sand CMAS glasses [17,18,19]. The significance of results with respect to T/EBC design are discussed.

2. Experimental Procedure

Ash obtained from the 2010 eruption of Iceland’s Eyjafjallajökull volcano was melted at 1500 °C for 1 h in a platinum crucible followed by quenching in water. The composition of the resulting glass was determined by inductively coupled plasma atomic emission spectroscopy (ICP-AES) performed by a commercial test laboratory and can be found in Table 1. Table 1 also includes the composition of a synthetic sand glass [17,18] and a desert sand glass [19] for comparison.
Differential thermal analysis (DTA) was carried out using a Netzsch STA 409 (Burlington, MA, USA) on bulk and powder glass samples to determine melting and crystallization behavior. Scans were performed in flowing air from room temperature to 1500 °C at a ramp rate of 10 °C/min. A platinum pan was used to contain each sample. Prior to each run, a background scan was performed under identical conditions and was subsequently subtracted from the sample scan.
Isothermal heat treatments were carried out in a stagnant air box furnace on bulk glass pieces weighing approximately 250–350 mg. Samples were placed on a platinum foil and were either exposed for 1, 10, or 20 h at 900 and 1000 °C (low-temperature furnace; Neytech Vulcan 3-550; Bloomfield, NJ, USA) or for 1, 10, 20, or 40 h at 1100, 1150, 1200, and 1300 °C (high-temperature furnace; Carbolite HTF 18/27; Hope Valley, UK). Samples were cooled at either 10 °C/min or quenched in air. Some experiments were carried out using glass powder instead of bulk specimens; in these cases, bulk pieces weighing 250–350 mg were ground with mortar and pestle to a fine grit prior to exposure. After heat treatment, samples were either crushed for x-ray diffraction (XRD) phase analysis (Bruker D8 Advance; Billerica, MA, USA) or mounted and polished in cross-section for imaging by scanning electron microscopy (SEM—Phenom-World Phenom Pro; Eindhoven, The Netherlands). Mounted and polished specimens were coated with a thin layer of platinum prior to imaging. Quantitative XRD was performed by mixing 20–25 wt % α-Al2O3 (corundum) with the powdered samples after heat treatment. Powders were mixed thoroughly by grinding with a mortar and pestle. Quantitative XRD scans were run from a 2θ of 10° to 120° with a step size of 0.02° and a step time of 2.5 s/step. Sample peaks were referenced to the Al2O3 standard in the Whole Pattern Fitting (WPF) module of Jade 2010 software from Materials Data Inc. (MDI; Livermore, CA, USA).
Sample discs were prepared for mechanical testing and dilatometry using a Centorr mini hot press (Nashua, NH, USA). Glass powder was loaded into a graphite die and treated at 600 °C and 2 ksi (13.8 MPa) for 10 min under vacuum. Specimens were cooled to room temperature at a rate of 10 °C/min after the applied pressure was removed. Graphite foil was used to cover the die pieces in contact with the glass during pressing, and any residual foil was removed from sample surfaces by polishing.
Glass density was calculated from the measured mass and volume of the hot-pressed glass disc. The impulse excitation method described in ASTM C1259 [20] was used to determine the elastic modulus and Poisson’s ratio of the glass at room temperature. An Audio Technica ATM350 condenser microphone with an M-Audio DMP preamplifier was used to acoustically measure and amplify the natural frequency of the glass disc upon mechanical excitation in the desired mode. The acoustic signal acquisition hardware and Sound & Vibration Toolset software from National Instruments (Austin, TX, USA) were used to determine the disc’s frequency, which was used to calculate the elastic modulus and Poisson’s ratio.
A Struer’s DuraScan (Cleveland, OH, USA) was used to apply a Vickers diamond indent onto the glass disc surface, which was polished according to ASTM C1327-08 [21]. Three indentations were made on the polished disc at each individual load of 1.96, 2.94, 4.9, and 9.8 N applied for 15 s. The diagonal (2a) and crack (2c) lengths of each indentation were measured.
A glass bar with length of 2.5 cm was evaluated using a Netzsch differential dilatometer model 402 C (Burlington, MA, USA) interfaced with a computerized data acquisition and analysis system to measure the glass transition temperature (Tg), softening point (Td), and linear coefficient of thermal expansion (CTE; α). The glass bar was heated at a rate of 5 °C/min in the air from room temperature to 1000 °C.
Viscosity measurements were performed using an Orton RSV-1600 viscometer furnace setup (Westerville, OH, USA) equipped with a Brookfield (Middleboro, MA, USA) HA-DV2T viscosity measuring unit and platinum spindle. A 50 mL platinum crucible was filled with approximately 80 g of volcanic ash glass for a molten glass volume of approximately 30 mL. Viscosity measurements were performed between about 1300 and 1500 °C. The viscometer furnace was held at 1500 °C for at least 20 min to equilibrate the melt. Two methods were utilized for collecting data. In the first, the spindle was lowered into the melt and allowed to rotate continuously as the furnace cooled at 2 °C/min. Viscosity data was collected during cooling. In the second, the spindle was lowered into the melt and allowed to rotate. The furnace was cooled at 50 °C intervals and held at each temperature for 20 min. The viscosity of the glass was determined at each temperature after a stable reading was obtained.
The viscosity of the glass melt was determined by measuring the percent spindle torque required to maintain the spindle rotation at the desired speed. The viscosity of the melt (η; in centipoise) is related to the spindle torque (τ) and rotational speed (RPM) by the following equation, found in the Orton RSV-1600 instrument manual:
η = 100 RPM × TK × SMC × τ
where TK and SMC are the viscometer torque constant and the spindle multiplier constant, respectively. These values were provided in the viscometer software. The viscosity of a borosilicate glass standard (NIST SRM 717a, Sigma Aldrich; St. Louis, MO, USA) was determined experimentally between 1000–1325 °C, confirming that the supplied constants gave accurate data in the temperature region of interest (Figure 1). The borosilicate glass standard was not run above 1325 °C due to volatility concerns. The calculated viscosity curve (Figure 1) was determined using viscosity constants provided by NIST.

3. Results

3.1. Crystallization Behavior—DTA

DTA heating and cooling curves at a ramp rate of 10 °C/min are given in Figure 2 for the bulk and powdered glass. A list of observed DTA thermal events, described for bulk and powdered glasses, is given in Table 2. On heating, the bulk glass exhibited exothermic peaks at approximately 900 (Figure 2—1B) and 1100 °C (2B), which corresponded to crystallization. Each peak is likely attributed to the crystallization of a distinct phase. There appeared to be a melt endotherm with a peak temperature of approximately 1350 °C; however, the peak itself was very broad. A dip in the baseline was evident at about 1050 °C (3B), suggesting that this glass started to melt around 1050 °C and might not have a distinct melting temperature. Indeed, in separate box furnace experiments glass specimens were observed to bead by 1100 °C and wet the platinum holder substrate by 1150 °C. Bulk glass specimens after heat treatment at 1100 and 1150 °C are shown in Figure 3. Bulk glass heat treated at 1300 °C for 1 h and air quenched was almost entirely amorphous by XRD analysis, suggesting that by this temperature, the glass was nearly completely molten. On cooling, an exothermic peak was also observed around 900 °C (4B) suggesting that a similar phase that crystallized around 900 °C on heating (1B) might have also evolved upon cooling at 10 °C/min.
The heating curve for powdered glass was quite different from that seen for the bulk, as shown in Figure 2. There was a broad exothermic hump that centered around 900 °C. This peak was not as distinct as for the bulk glass and had a comparatively lower onset temperature (1P). In addition, instead of having a second exothermic peak around 1100 °C, there were two very large peaks at approximately 1225 (2P) and 1275 °C (3P). It is somewhat difficult to distinguish background information from actual thermal events for this curve, however, the melting behavior appeared similar to that for the bulk—the onset (4P) and peak melting temperatures being shifted to slightly lower values. On cooling, there was an exothermic peak at approximately 900 °C (5P), echoing that observed for the bulk sample.

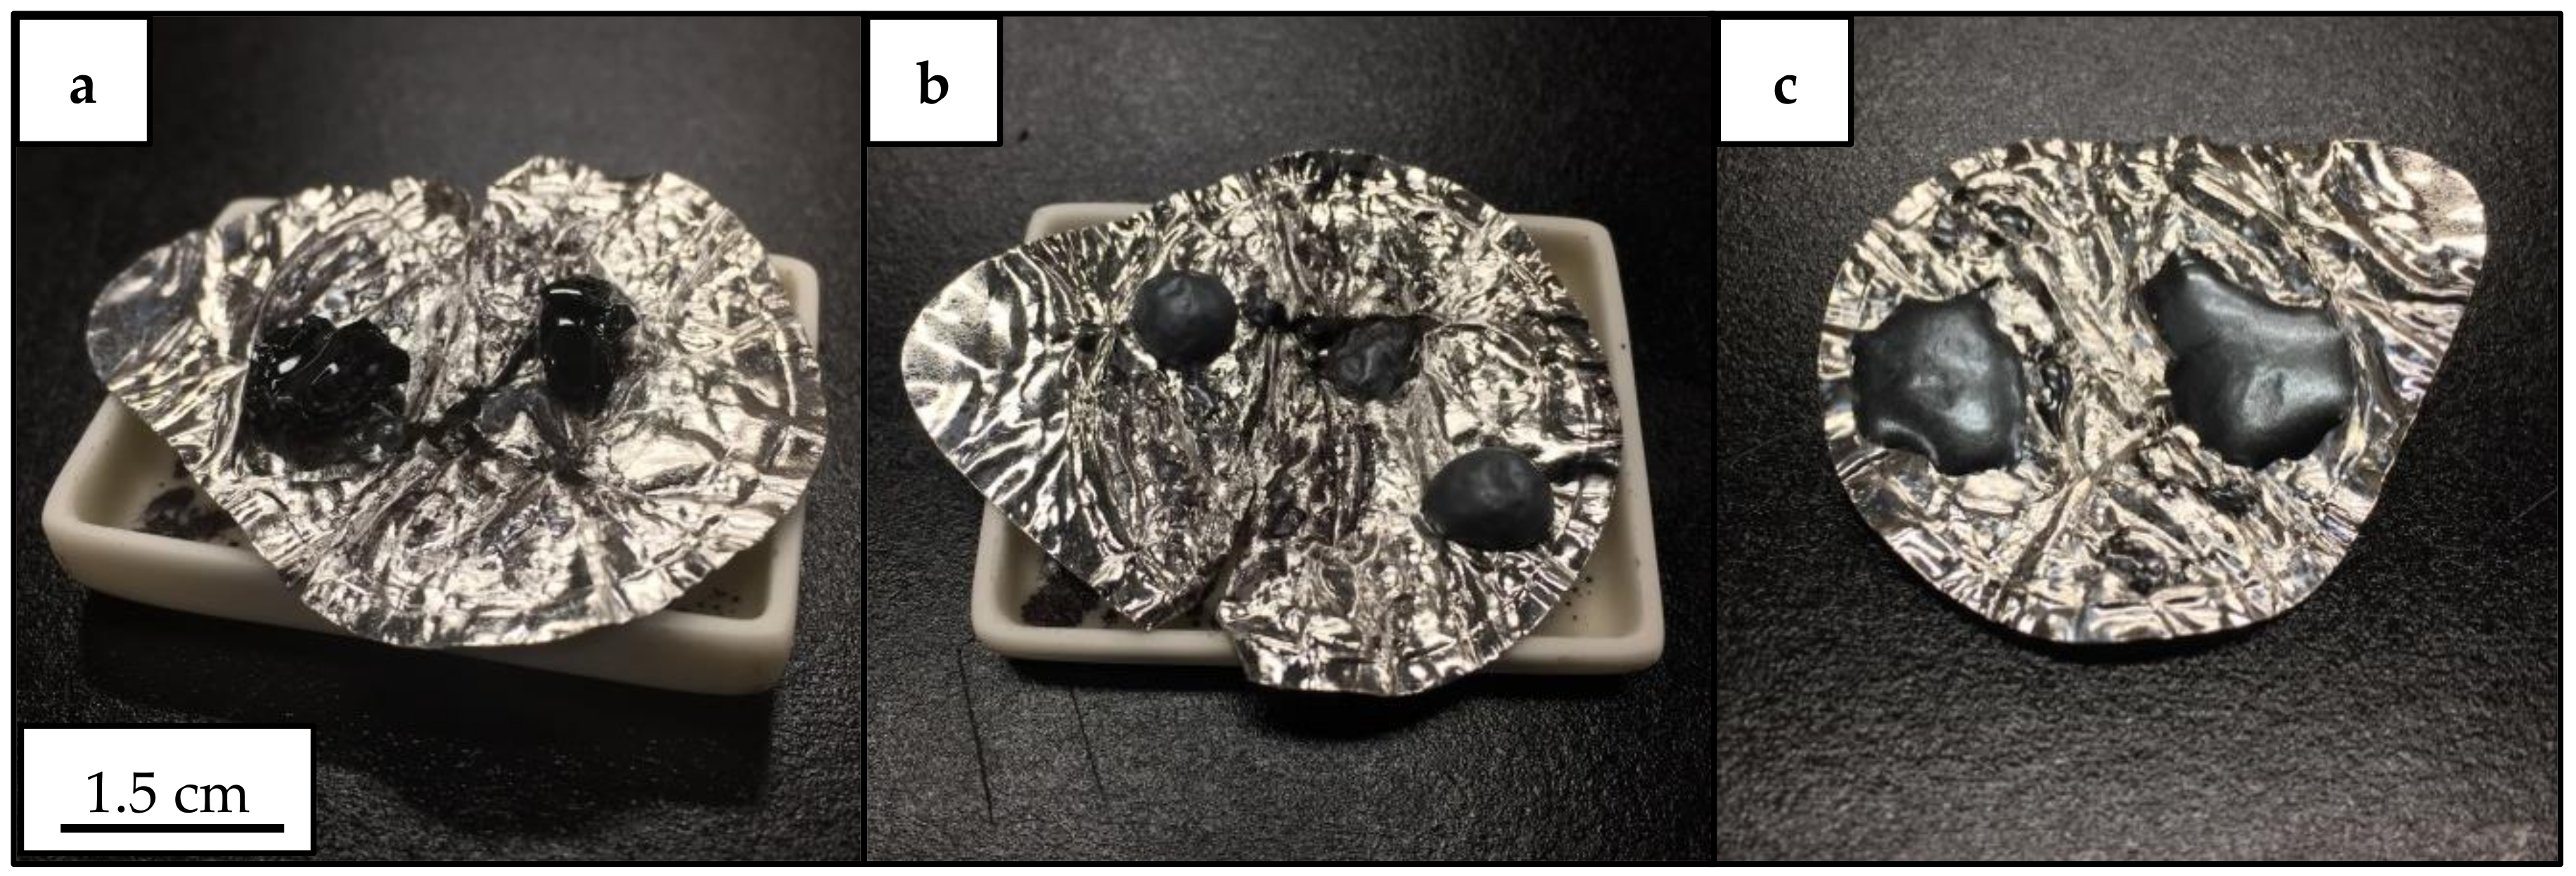
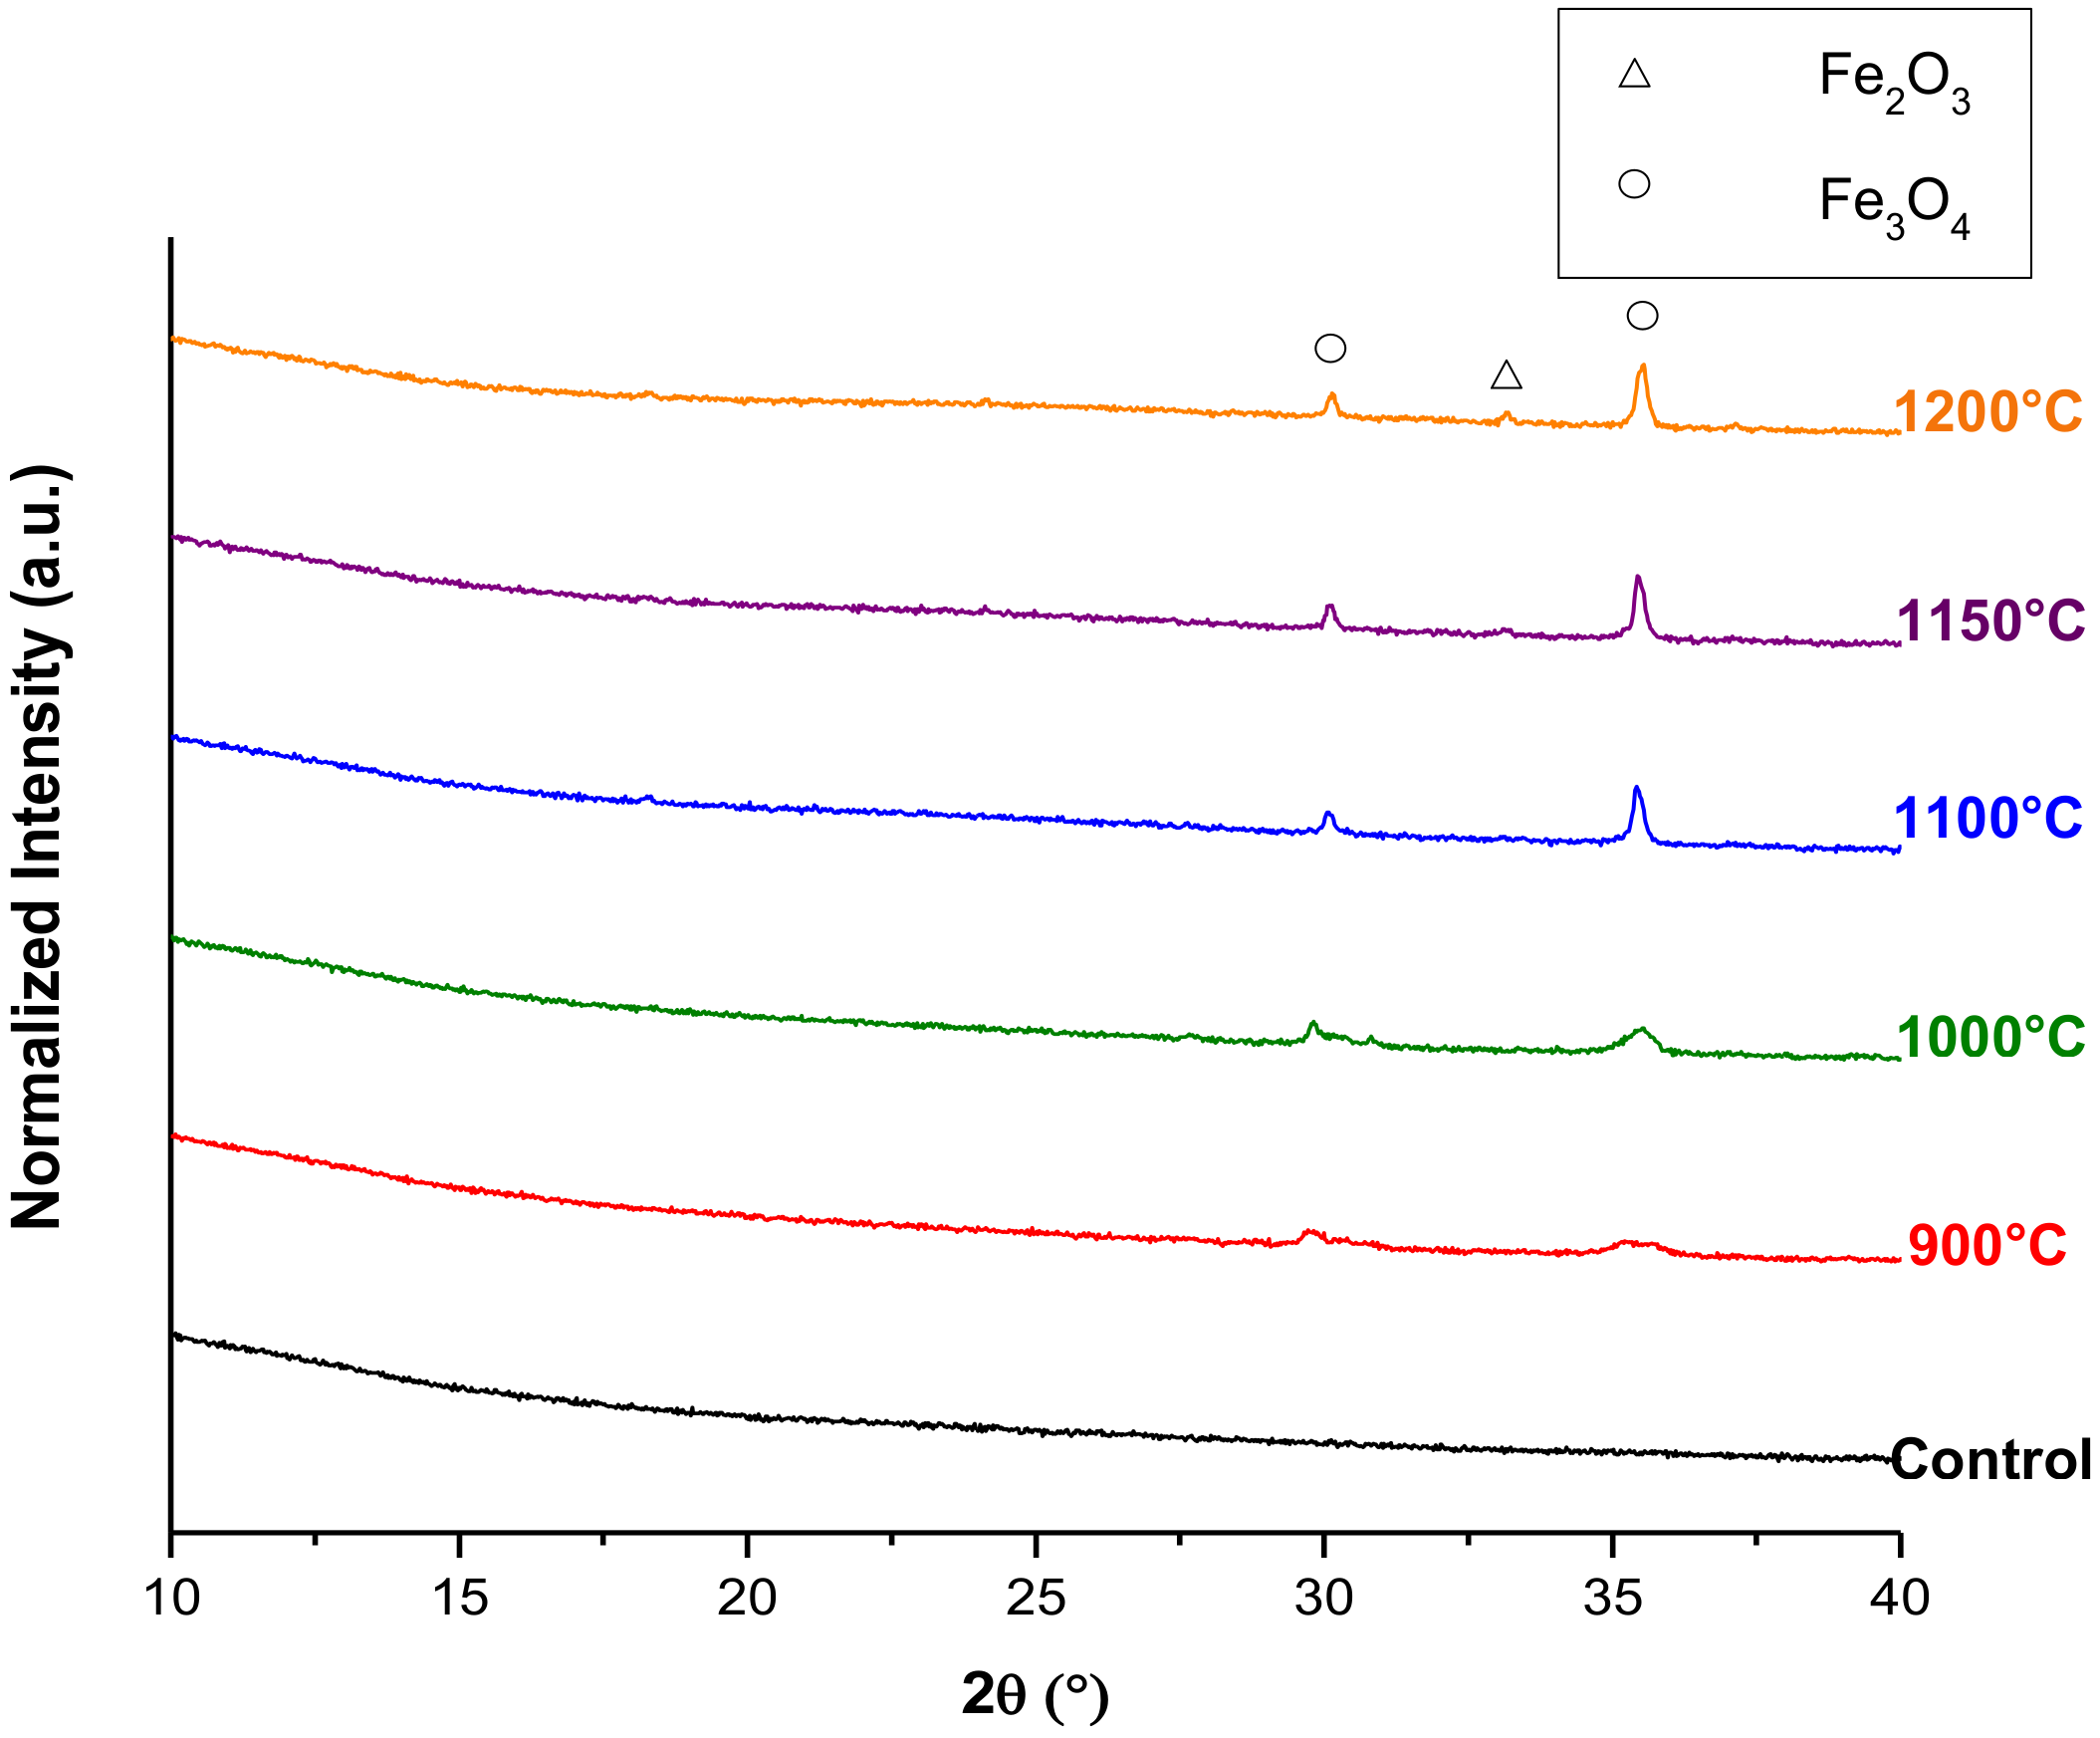
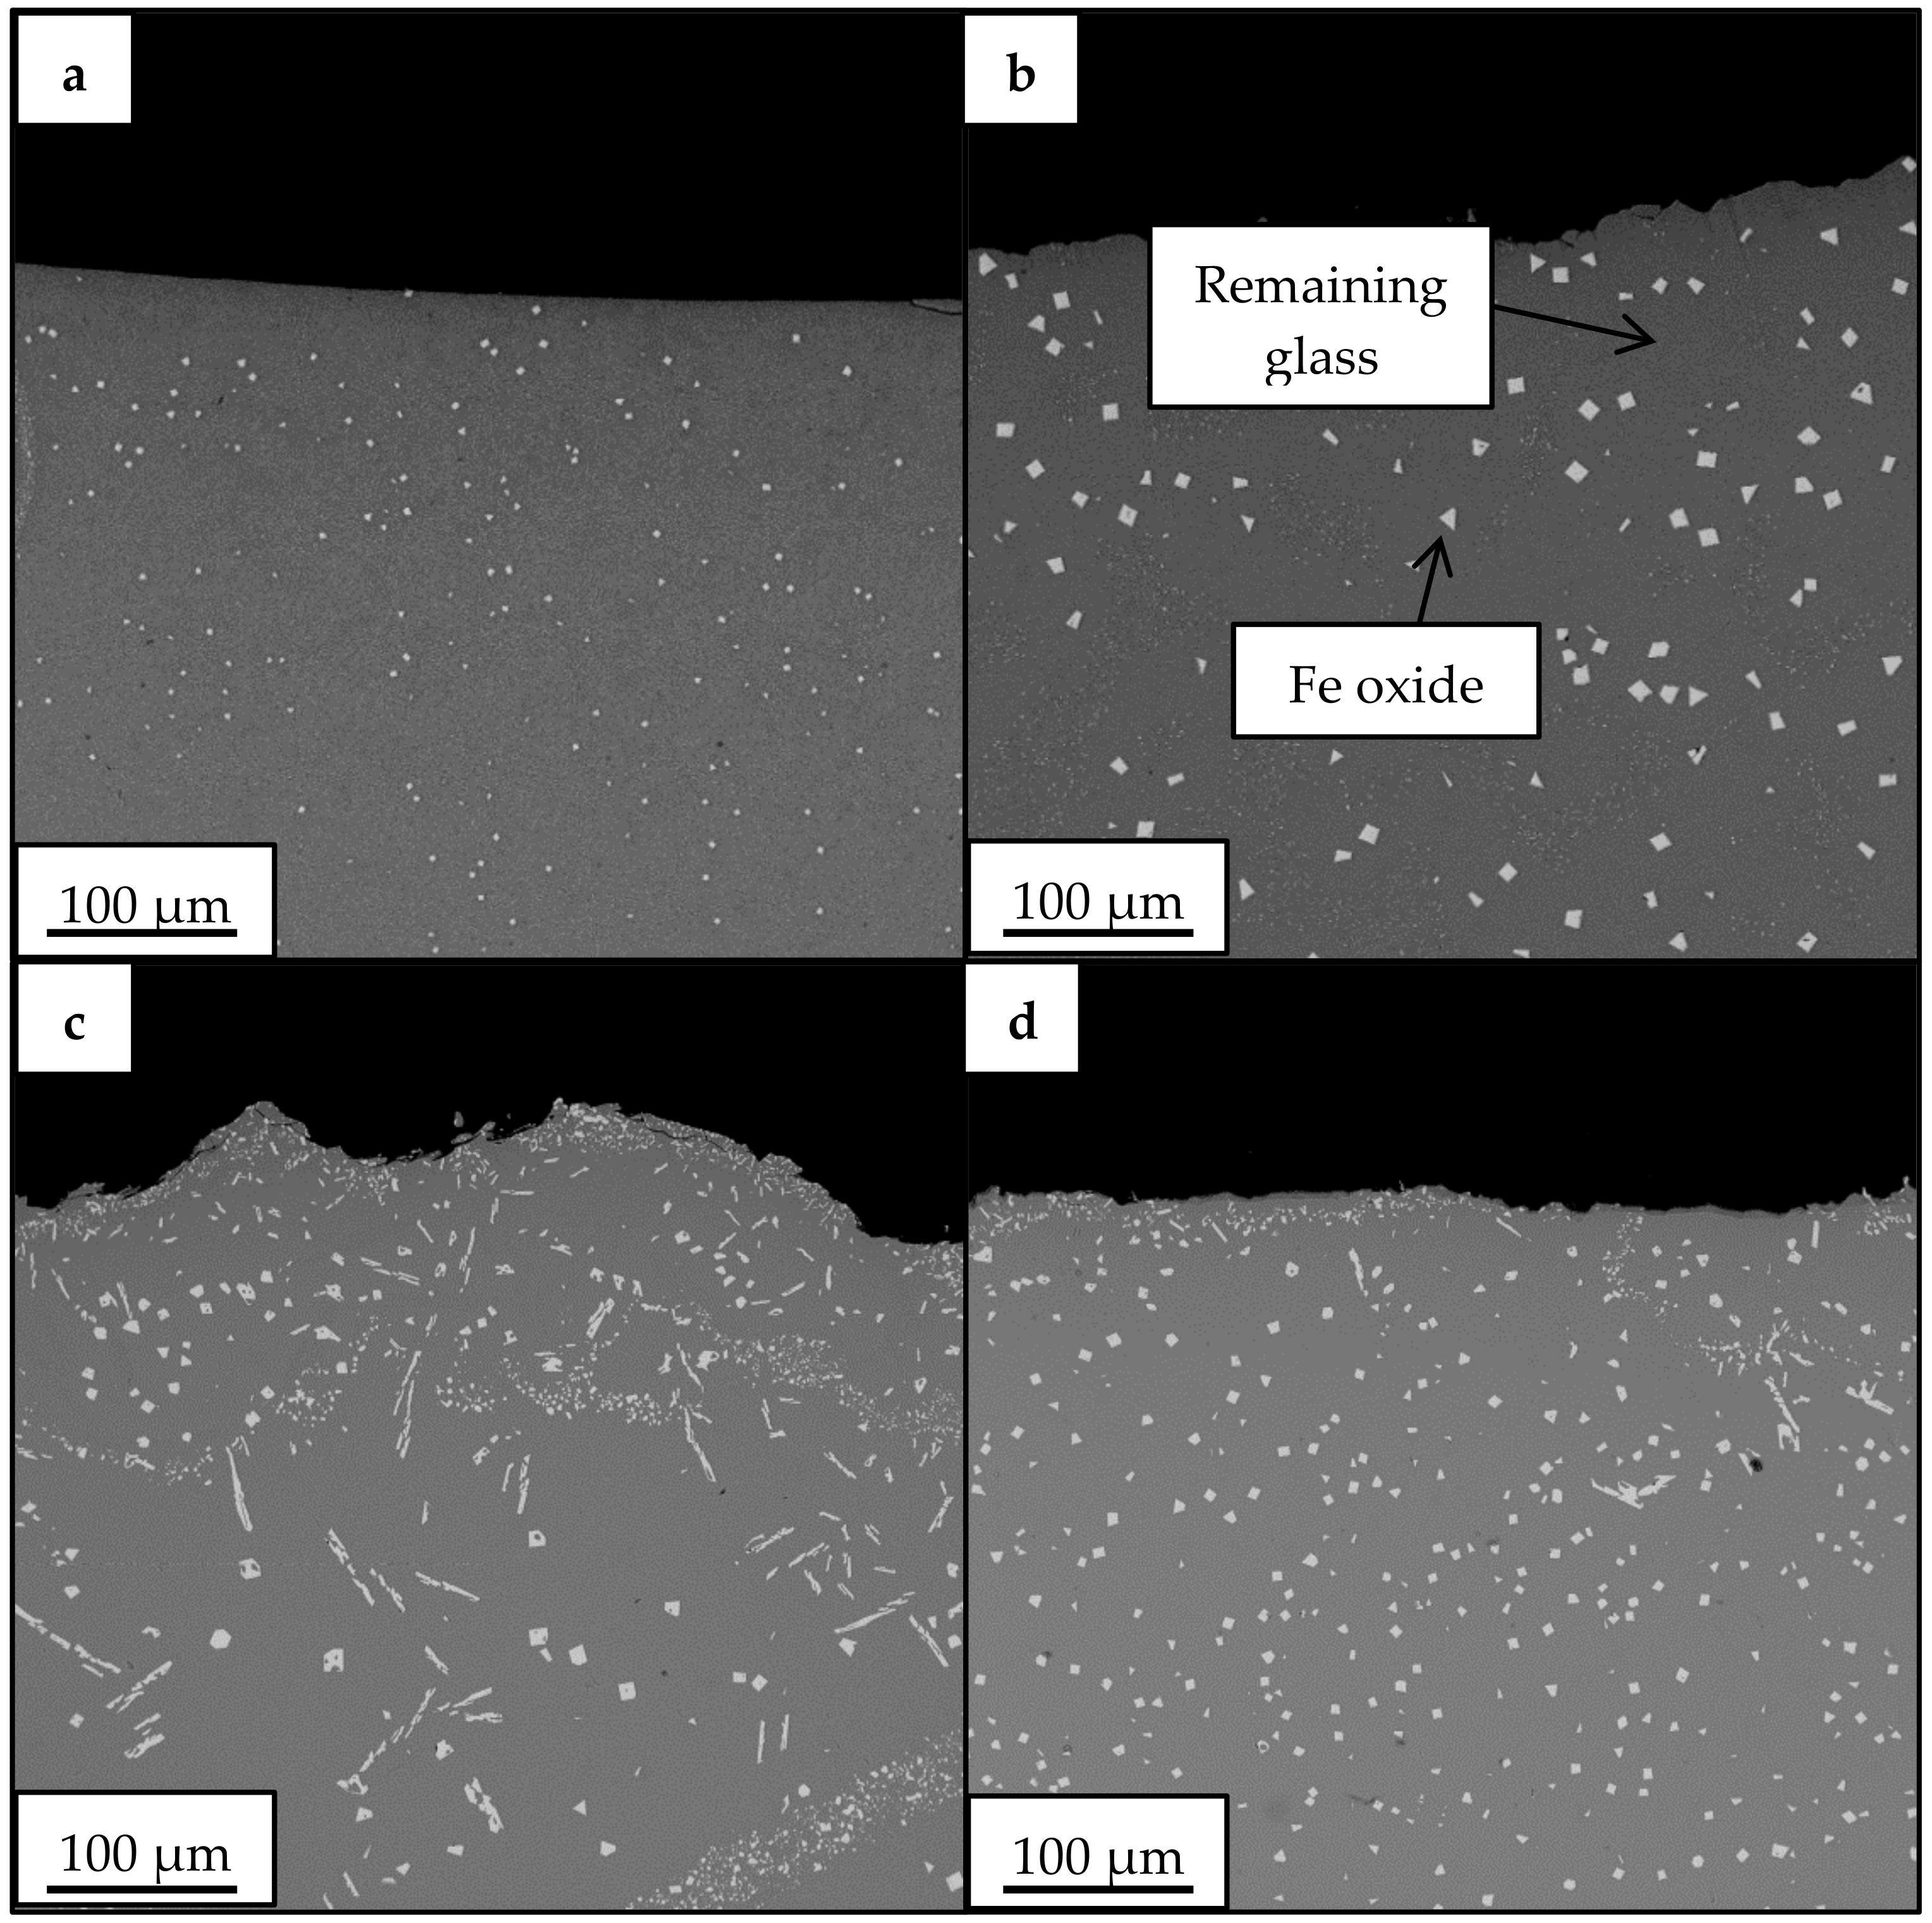
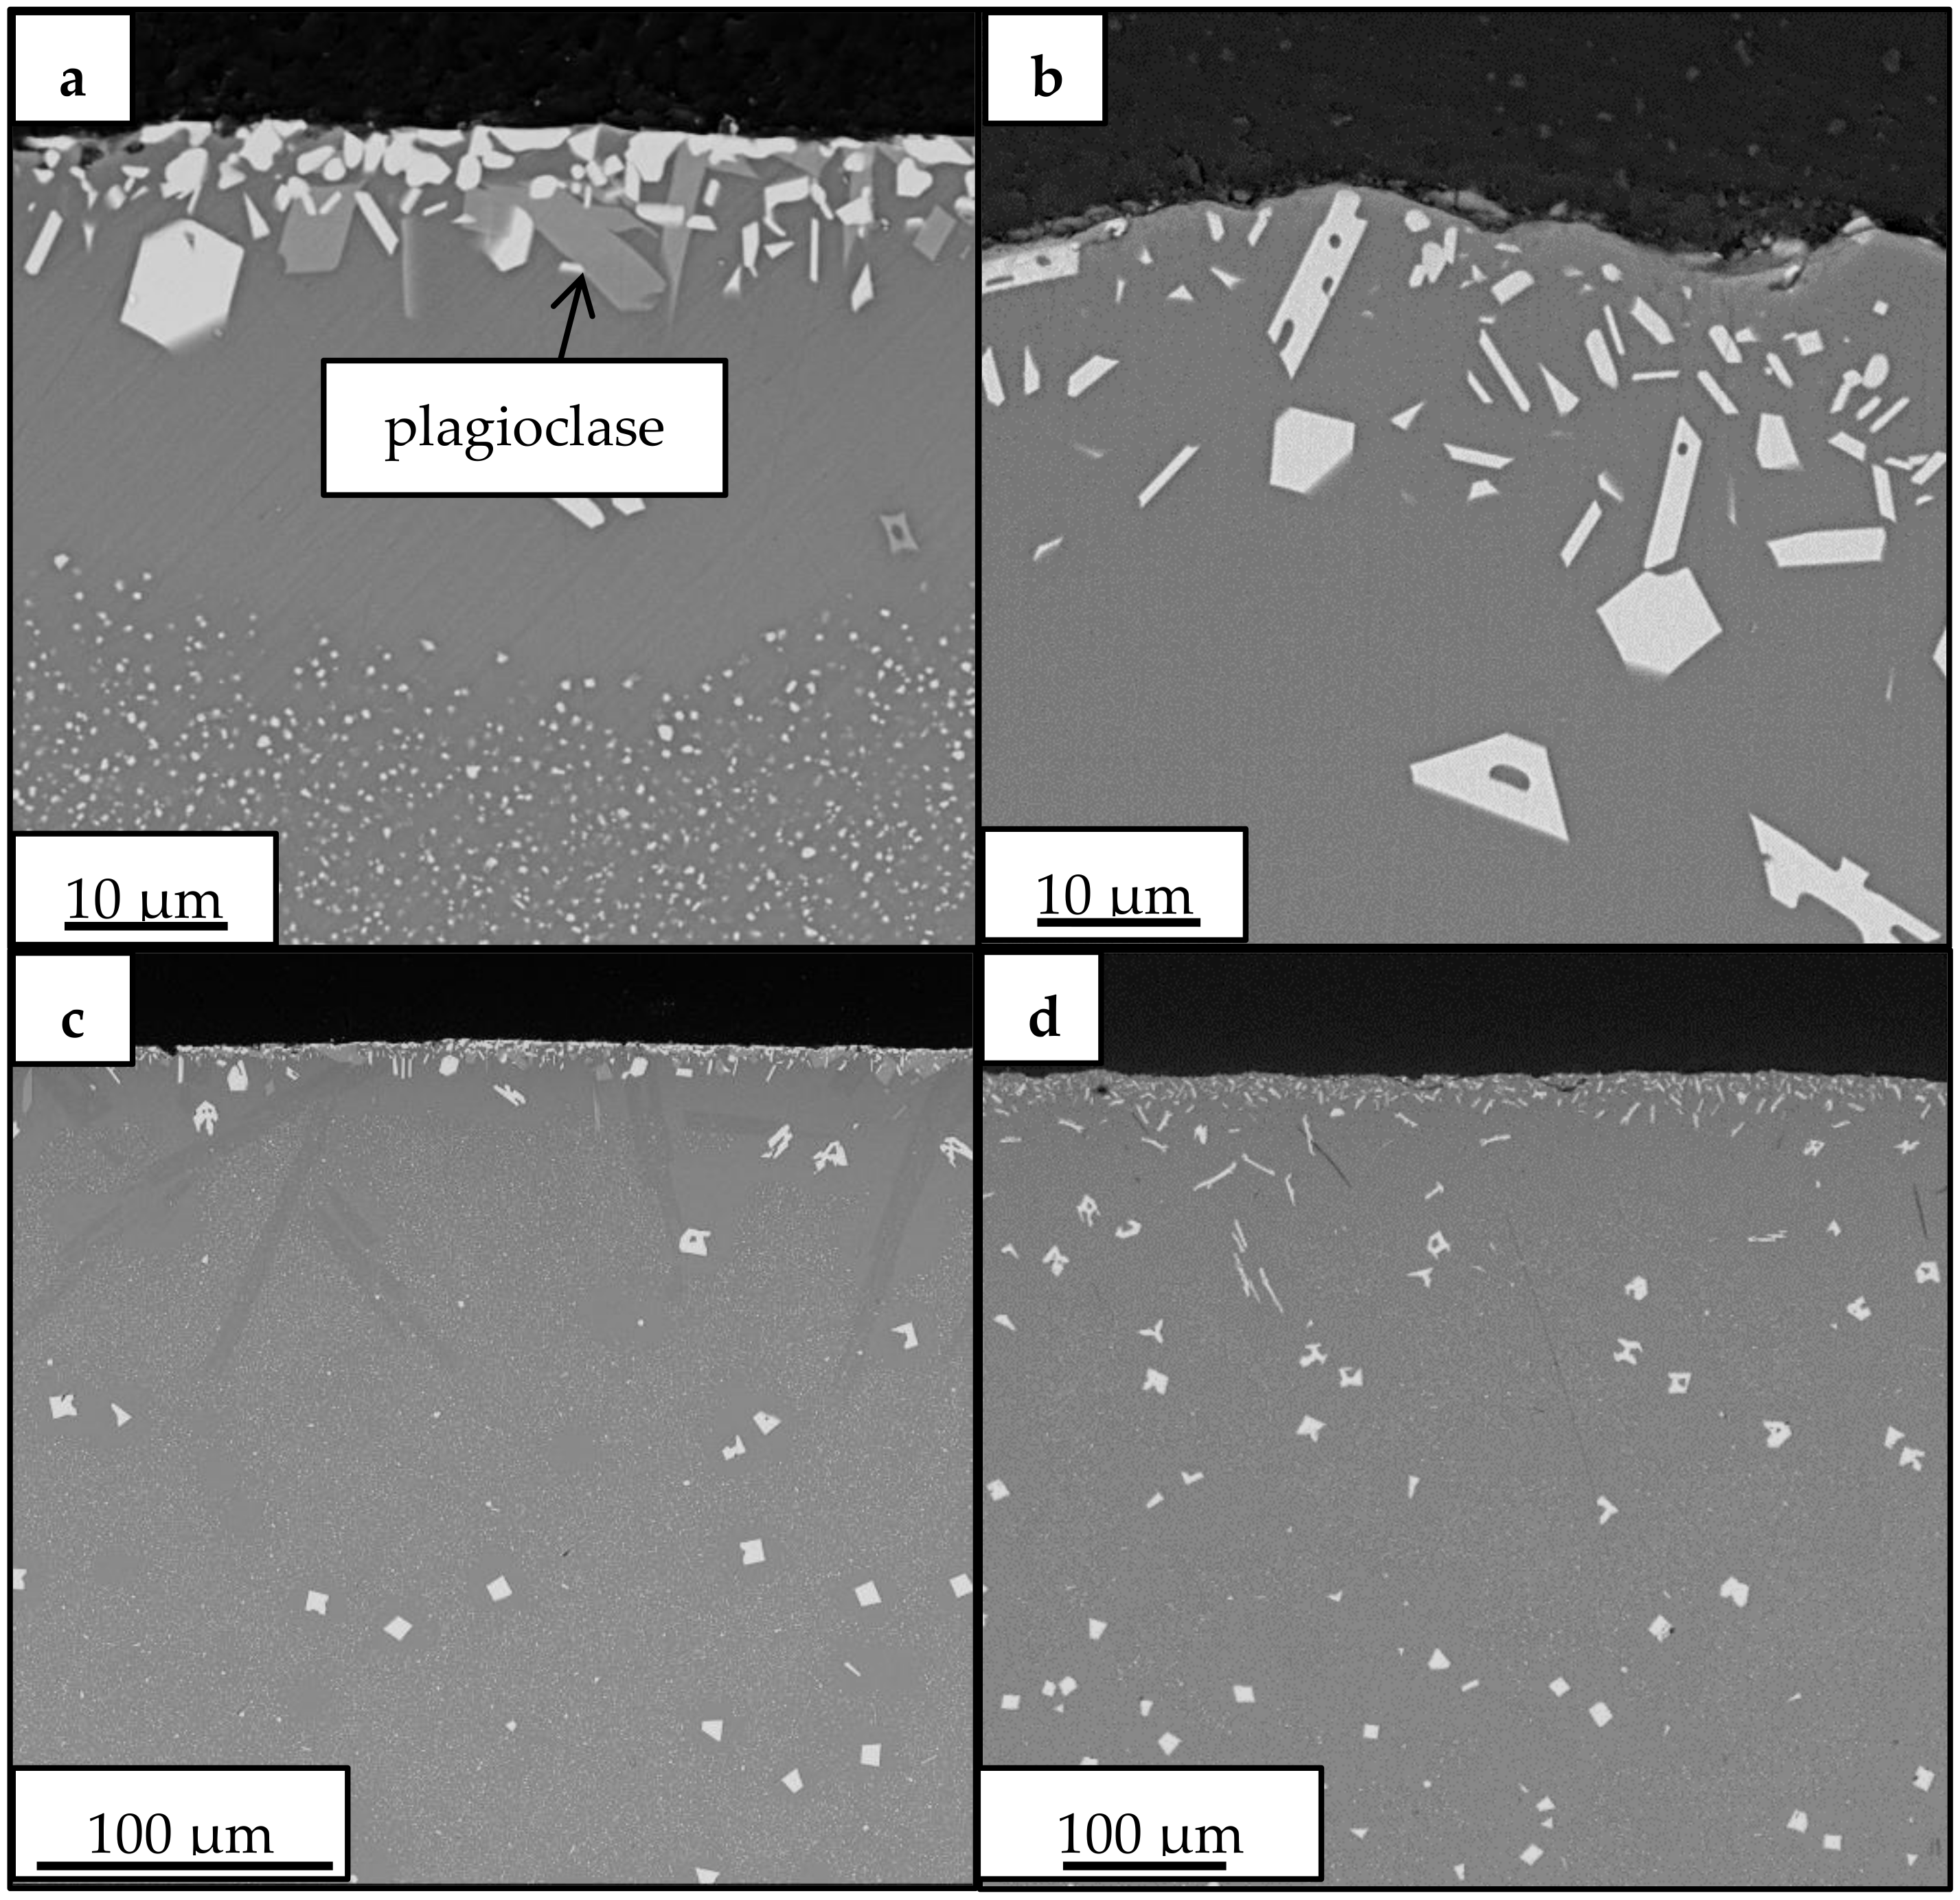
3.2. Crystallization Behavior—Box Furnace Experiments

XRD plots for bulk glass pieces treated for 1 h at 900–1200 °C can be seen in Figure 4. All scans were collected for samples after being heated and cooled at 10 °C/min. XRD patterns for specimens that were placed in and removed from the furnace at temperature (i.e., quenched in air) did not show differences in phase or amount of phase present when compared to samples that were ramped to and from temperature. Consequently, XRD results for quenched specimens were excluded from the rest of this report. In Figure 4, the XRD scan for glass not exposed to temperature is also shown (labeled “Control”) for comparison. Only two phases were discerned—Fe3O4 (magnetite) and Fe2O3 (hematite). After heat treatment at 900 and 1000 °C, broad, shallow peaks for magnetite were present, but the glass appeared to have remained mostly amorphous. At 1100, 1150, and 1200 °C, the peak for magnetite appeared larger and sharper. At 1150 and 1200 °C, the 100% intensity peak for hematite began to emerge.
As the amount of time held at temperature was increased for 1100–1200 °C treatments, the magnetite was converted to hematite (Table 3). The transition from magnetite to hematite occurred more rapidly as the temperature increased, such that there was a higher relative amount of hematite after 10 h at 1200 °C compared to after 10 h at 1100 °C (Table 3). This is likely due to the enhanced diffusion of oxygen through the bulk glass at higher temperatures [22]. The reaction of Fe3O4 to Fe2O3 is given by [23]
4 Fe 3 O 4 + O 2 g 6 Fe 2 O 3
The evolution of the microstructure of samples held at 1150 °C can be seen in Figure 5. Energy dispersive spectroscopy (EDS) was unable to differentiate Fe3O4 from Fe2O3. The bright (by backscattered electron imaging, BSE) Fe-based precipitates appear as both faceted particulates and rod-like structures. Faceted particles are mostly submicron in size after 1 h at temperature but grow to a maximum diameter of approximately 10 μm with increasing time. In some areas, the surface of the glass had a thin layer or “shell” of Fe-based particulates (somewhat visible in Figure 5c,d, more apparent in Figure 6).
At 1100 °C, a third phase, likely a solid solution of anorthite (CaAl2Si2O8) and albite (NaAlSi3O8), was detected after holding for 10 h (see Figure 6). This phase (hereto referred to as plagioclase) may also be present in small amounts at 1000 °C.
SEM BSE cross-section images are presented in Figure 6 for samples held at 1100 and 1150 °C for 10 h. The results given by SEM supported those of XRD. After 10 h at 1100 °C, there appeared to be two phases growing at the surface of the glass (Figure 6a). EDS confirmed a Fe-rich phase (lighter contrast by BSE) and a Si-rich phase (darker by BSE). Iron oxides (likely mostly Fe3O4 based on XRD) were also present throughout the bulk of the sample (Figure 6c) but were generally smaller than those in the 1150 °C sample (Figure 5b and Figure 6d). A thin layer of concentrated Fe precipitates can be seen at the surface of both the 1100 and 1150 °C (Figure 6c,d) samples. This “shell” is likely the Fe2O3 phase, as it has been previously observed in magnetite iron ore pellets oxidized at 800–1200 °C [24]. The “shell” was not always continuous across the surface of samples, which may be due to the removal of material when separating the bulk glass from its platinum substrate. As expected from XRD, no plagioclase phase was observed in the 1150 °C sample (Figure 6b).
When powdered samples were heated in the box furnace at 1100 and 1150 °C, the prominent crystallized phases were Fe2O3 and plagioclase (Figure 7). The amounts of each phase are given in Table 4. It is expected that the increased amount of crystallized glass compared to bulk samples is due to the increased surface area of the powder.
FactSage free energy minimization calculations were performed for both the volcanic ash glass and the synthetic sand glass compositions (Table 1), using the Equilibrium Module and FToxide database, including SLAGA [25], to determine the expected phase distributions at a given temperature based on thermodynamics alone. Respective amounts of the different CMAS oxides (in mol %, Table 1) were used as FactSage inputs. Calculations were performed at 1 atm. As was observed experimentally, FactSage indicated that Fe2O3 and albite (NaAlSi3O8) and anorthite (CaAl2Si2O8) were among the expected phase formations. Between 900–1150 °C, SiO2, MgSiO3, KAlSi3O8, CaSiTiO5, and CaMgSi2O6 (diopside) were among other phases also predicted to appear. Albite was not seen above 1050 °C and Fe2O3 was the only expected solid-phase above ~1200 °C. The amount of the observed phases as a function of temperature is given in Figure 8. A Scheil–Gulliver cooling profile was also performed, with a start and stop temperature of 1300 and 900 °C, respectively, and a step size of 25 °C. This method subtracts precipitated phase constituents from the overall glass composition as they form. At and above 1200 °C, only Fe2O3 is expected. Below 1200 °C, anorthite forms; at ≤1100 °C, MgSiO3, diopside, and CaSiTiO5 appear in addition to Fe2O3 and anorthite. Albite is only discerned at ≤1000 °C.
The same processes were performed for the synthetic sand glass. Wollastonite (CaSiO3) and diopside were among the expected phase formations between 900–1300 °C. Other predicted phases (between 900–1000 °C) included albite, SiO2, and Na2Ca3Si6O16. Figure 9 plots the expected phase formations in the synthetic sand glass as a function of temperature.

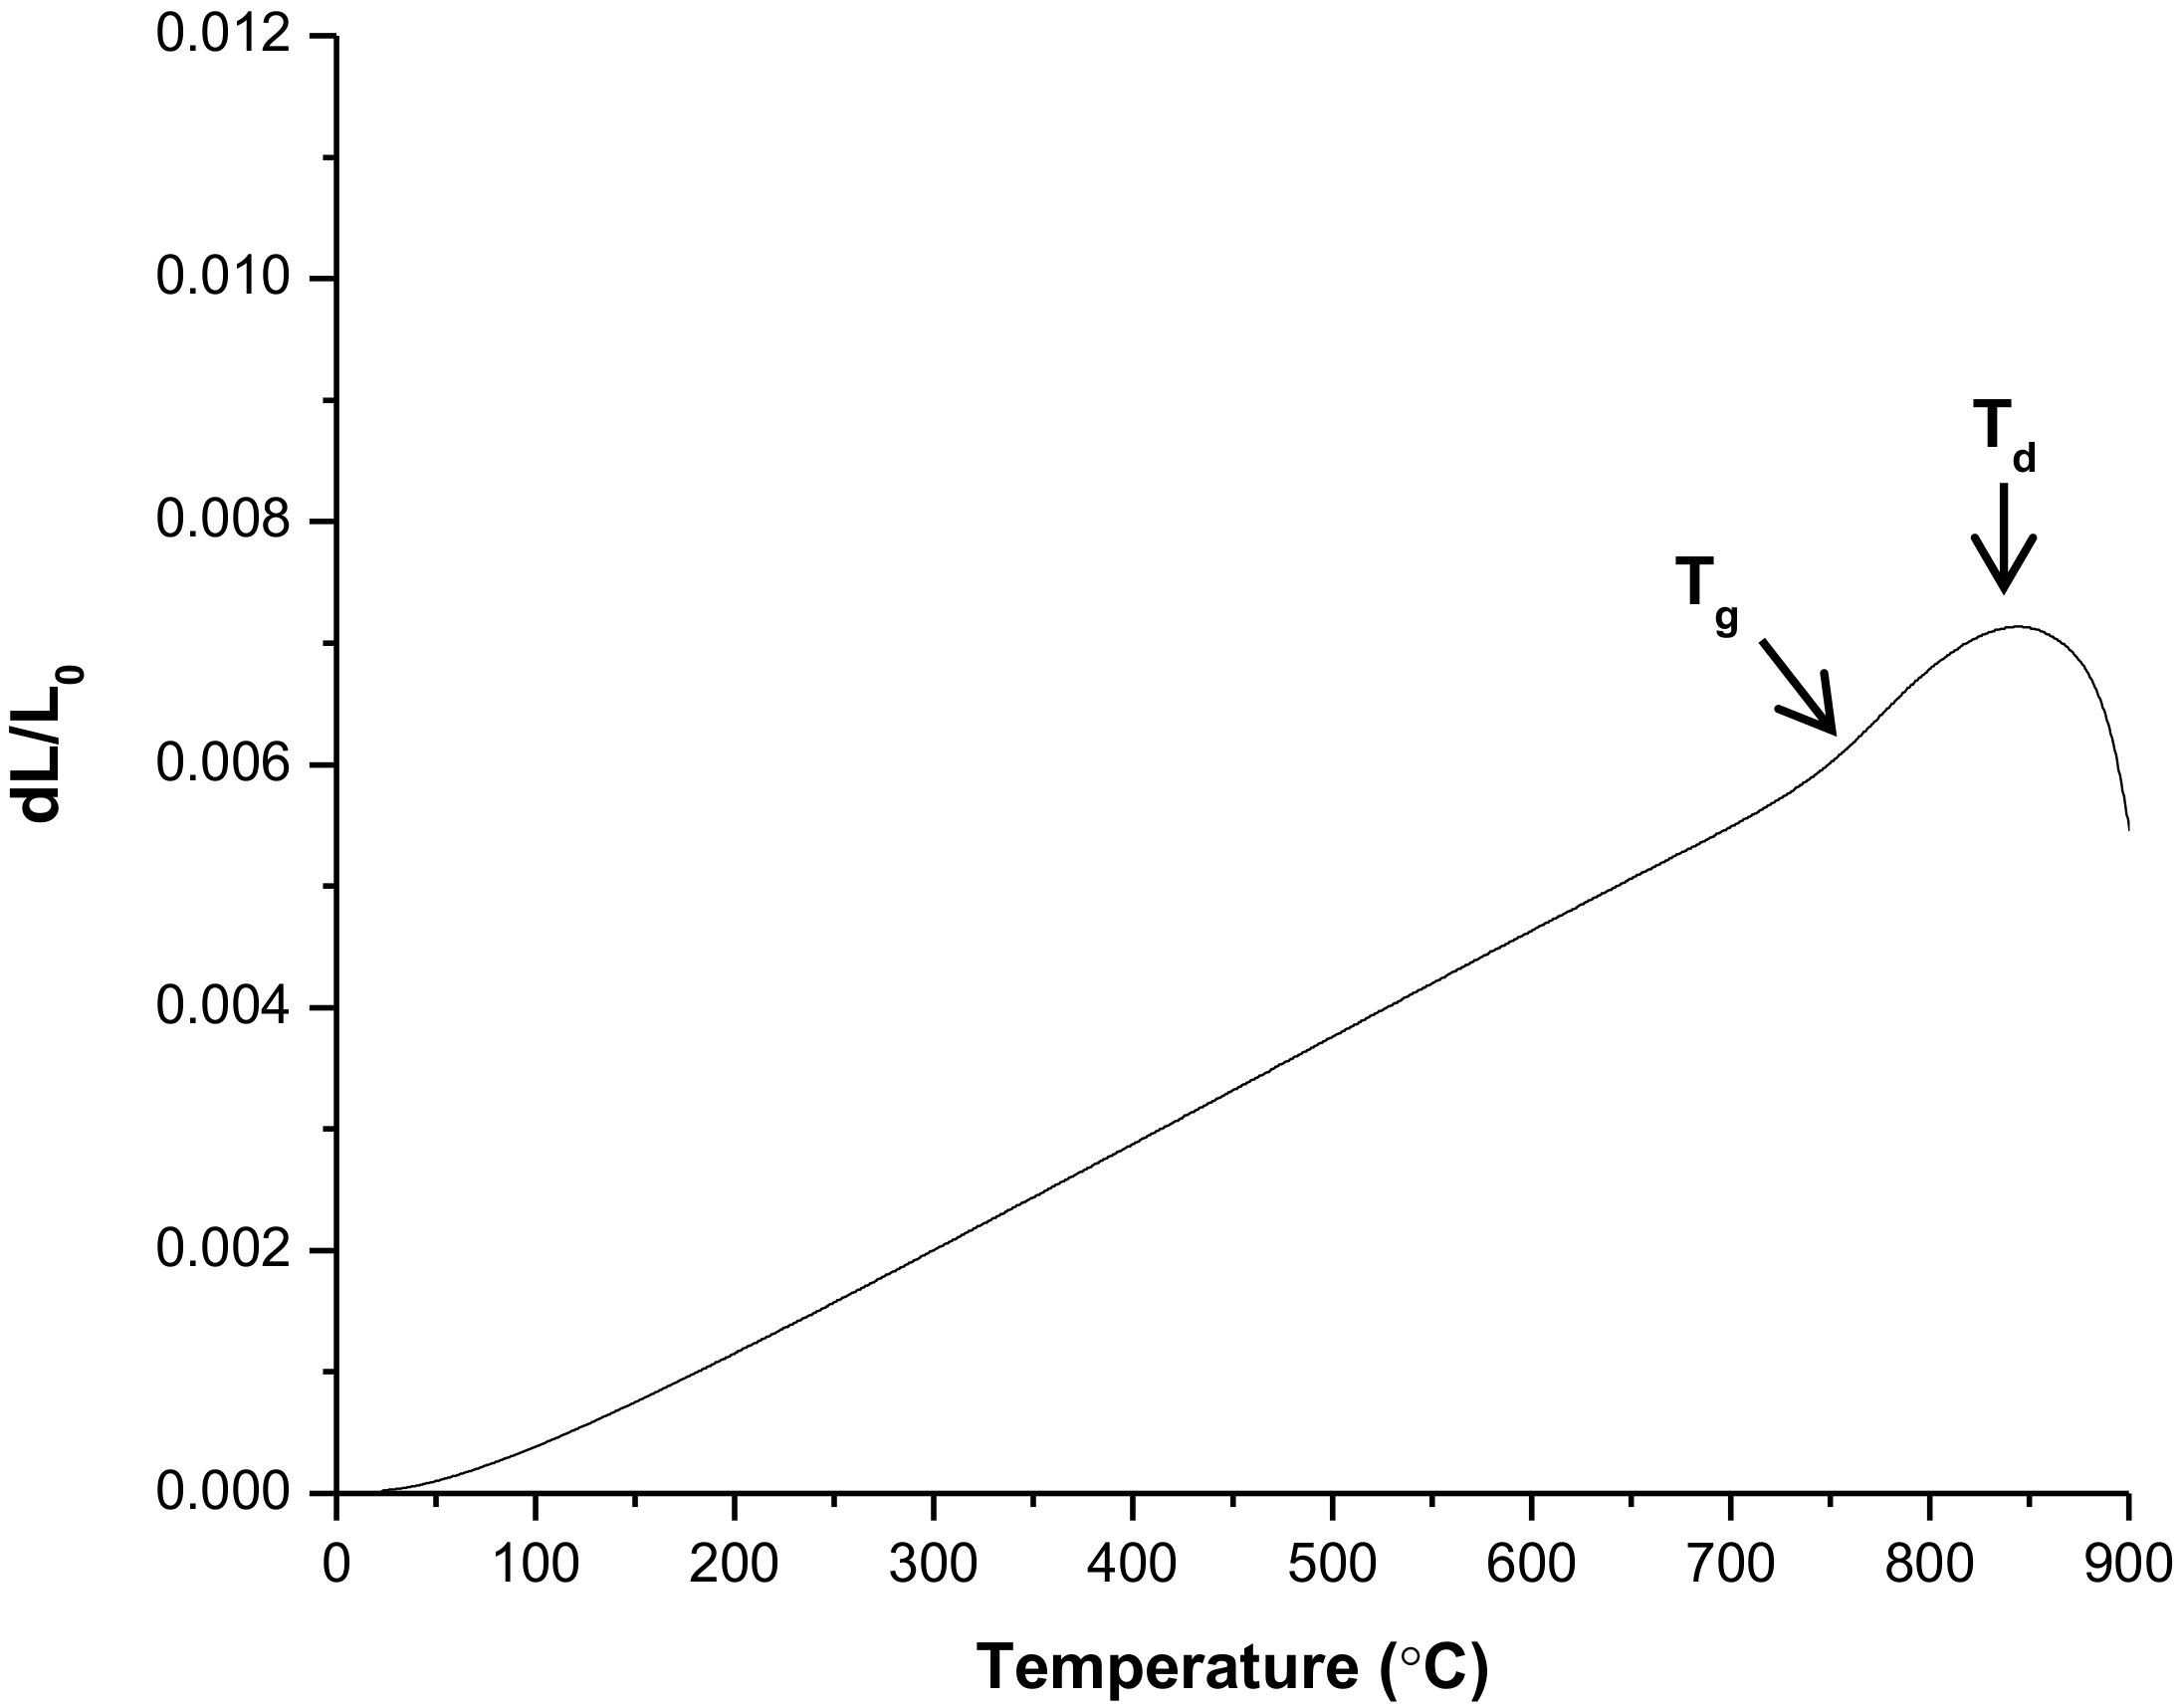
3.3. Thermal Behavior—Dilatometry

Figure 10 shows the dilatometric thermal expansion curve for the hot-pressed volcanic ash glass bar heated at 5 °C/min from RT to 1000 °C. Dilatometric values for the volcanic ash glass, synthetic sand glass, and desert sand glass are found in Table 5. The Tg and Td of the volcanic ash glass were observed to be 741 and 844 °C, respectively. Comparatively, the synthetic and desert sand glasses referred to in Table 1 had reported Tg values of 694 and 706 °C, respectively, and Td values of 751 and 764 °C, respectively. The average linear CTE for the bulk volcanic ash glass was 7.00 × 10⁻⁶ K−1 between 25–720 °C. This value was lower than the reported ~9–10 × 10−6 K−1 for the synthetic and desert sand glasses over the same temperature range.

3.4. Density and Mechanical Properties
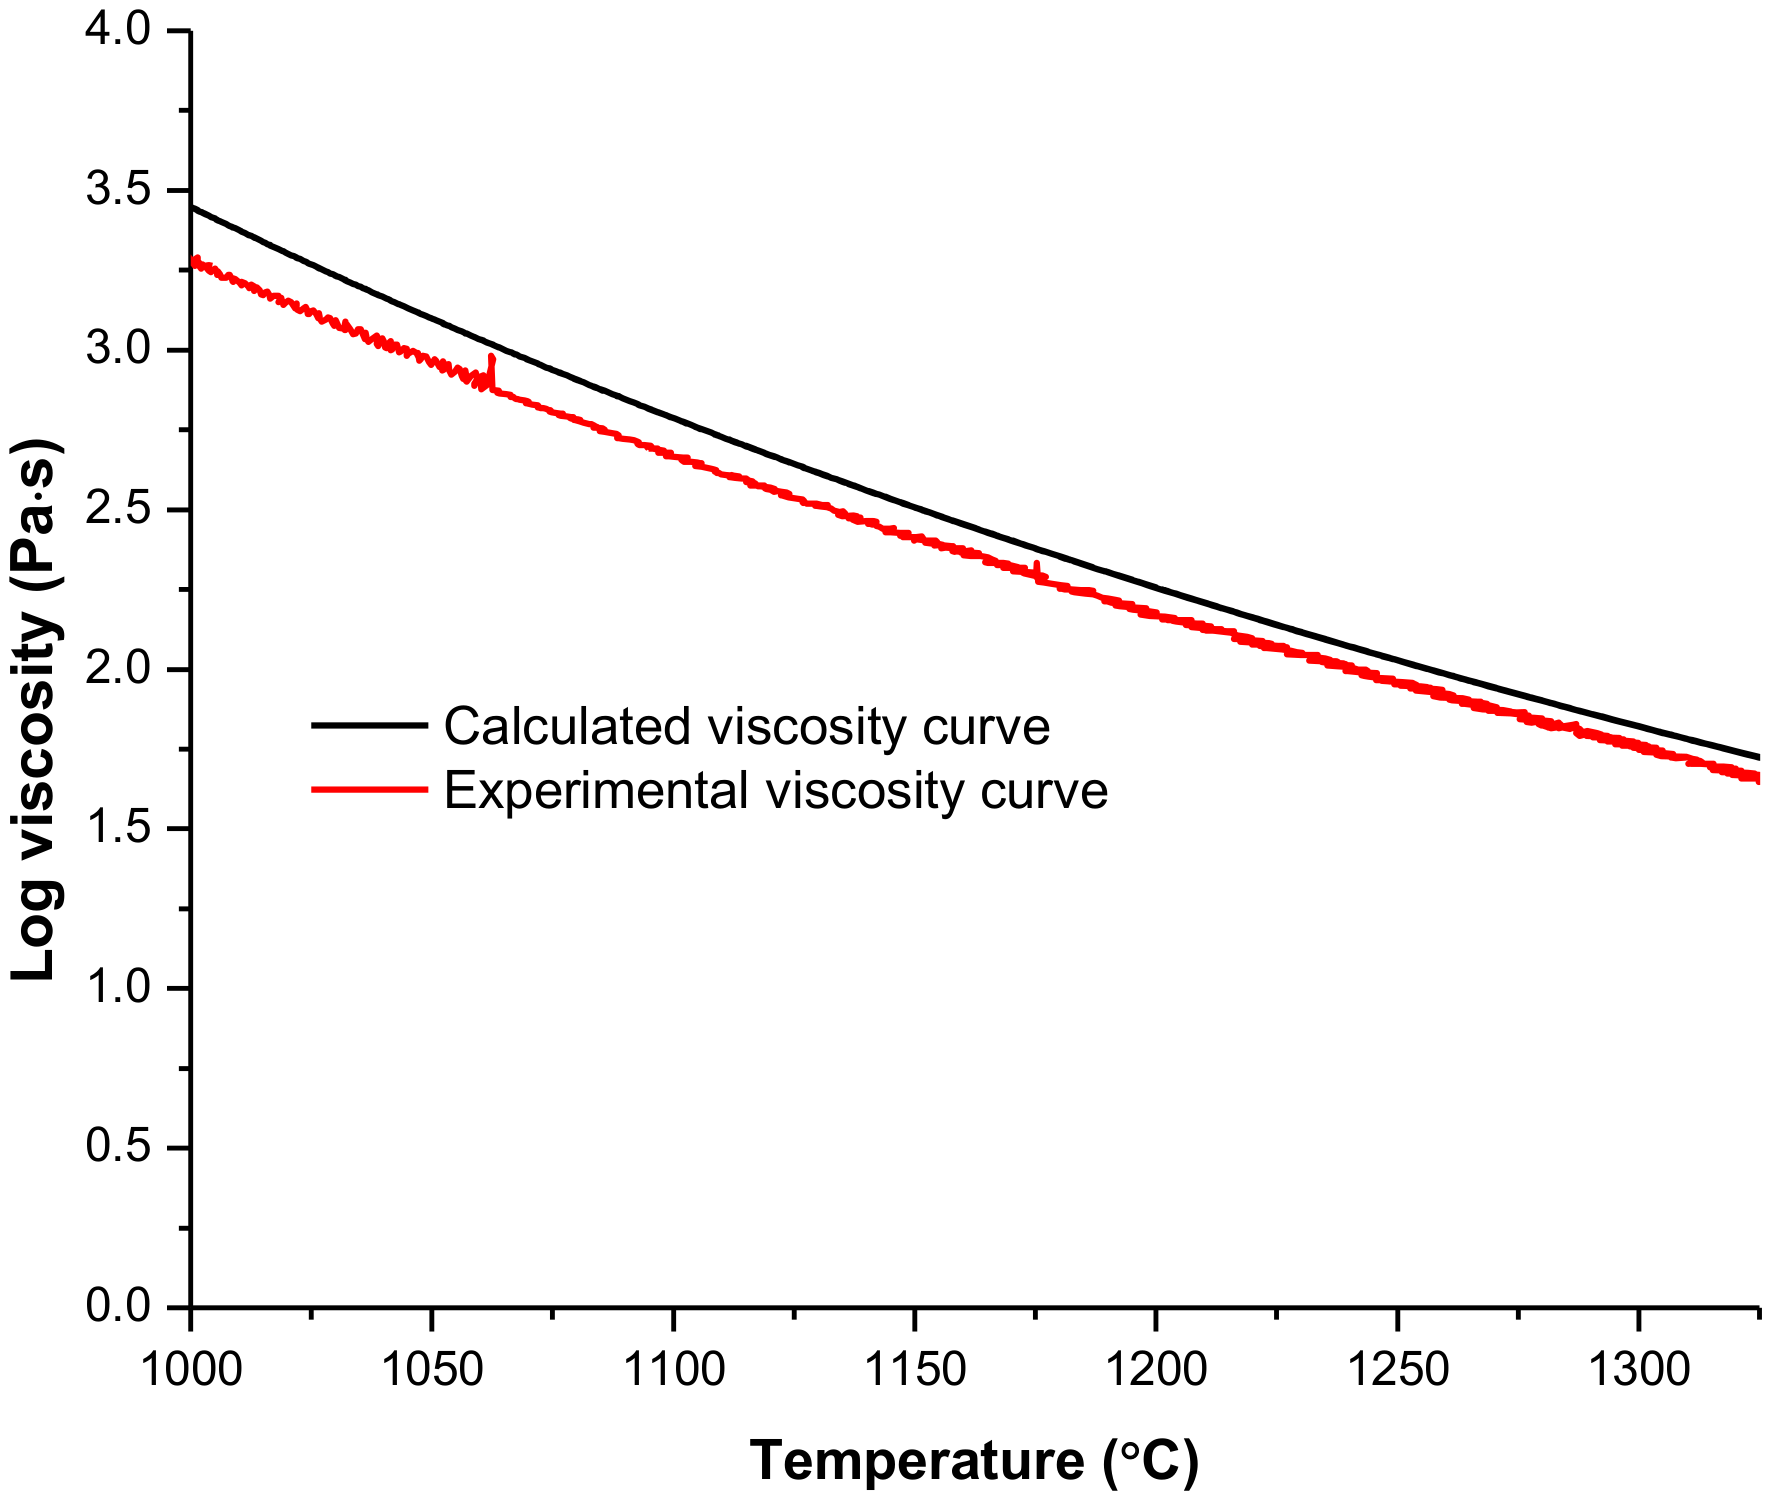
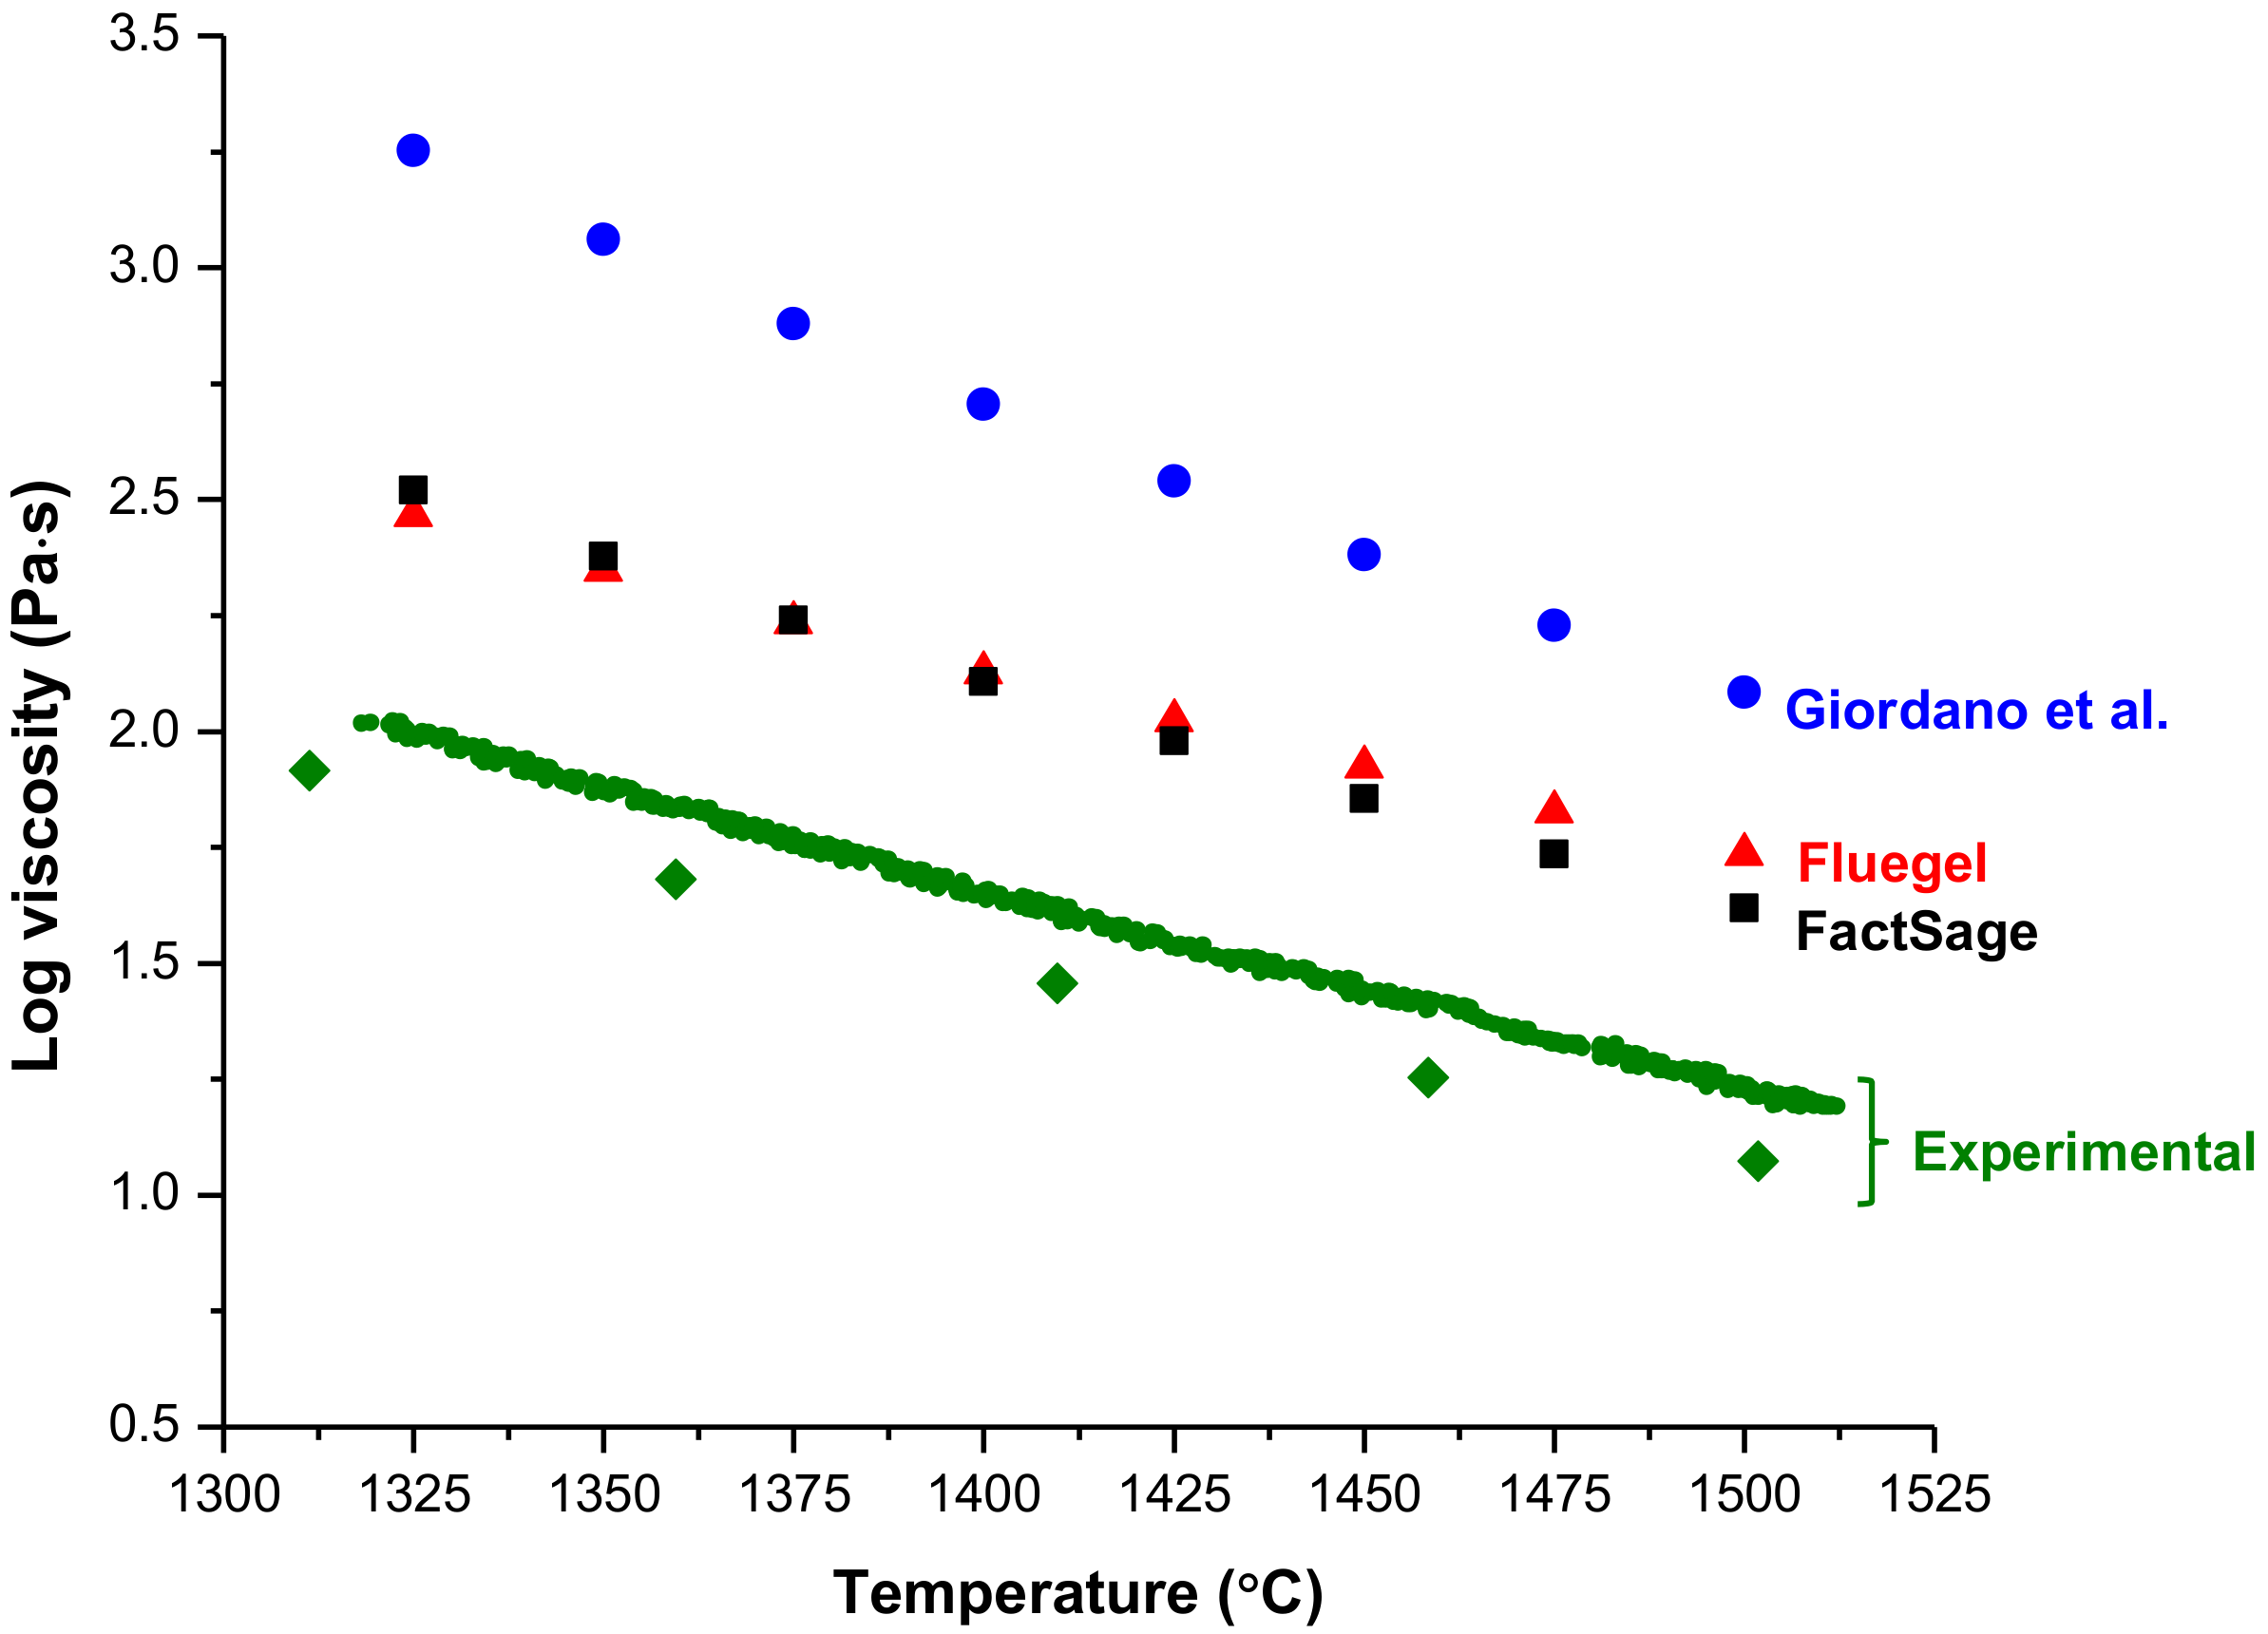
The bulk density, Elastic Modulus (E), Poisson’s ratio (ν), Vickers hardness (HV), and indentation fracture toughness (evaluated by three different equations) for the volcanic ash glass are reported in Table 5 and Table 6. Density was found to be 2.52 g cm−3 and E and ν to be 75 GPa and 0.24, respectively. These values were comparable to those reported for the synthetic and desert sand glasses, though E for the synthetic and desert sand glasses was approximately 84 and 92 GPa, respectively, indicating that the volcanic ash glass was less stiff.
Vickers microhardness was determined at each load using the following equation [21]:
H V = 1.8544 P 2 a 2
where P was the applied load and 2a was the indentation diagonal length. Vickers hardness values determined at loads of 1.96, 2.94, 4.9, and 9.8 N are reported in Table 6.
Indentation fracture toughness (KC) of the volcanic ash glass was calculated from indentation load and crack and diagonal lengths using relationships found in the literature. Miyoshi et al. [26] used the following:
K C = 0.026 a E 0.5   P 0.5   c 1.5
where E was the Young’s Modulus, P was the indentation load, and a and c were half the indent length and crack length, respectively. Marshall and Evans [27] evaluated indentation fracture toughness using the following relation:
K C = 0.036 E 0.4   P 0.6   a 0.8   c 1.5
Anstis et al. [28] presented:
K C = 0.016 ± 0.004   P E H v 0.5 c 1.5
to determine the indentation fracture toughness of glass specimens. KC values calculated using Equations (4)–(6) can be found in Table 6 for a range of indentation loads. The loads were chosen to prevent spalling while giving a reasonably long crack (c > 2a). The hardness values for the volcanic ash glass are comparable to those of the synthetic and desert sand glasses, but the volcanic ash glass is significantly tougher (~1–2 MPa √m). The toughness of the synthetic and desert sand glasses is akin to that of many glasses, however, that of the volcanic ash glass more closely matches a glass-ceramic [29]. Hot pressing the glass at 600 °C resulted in the crystallization of some Fe3O4 precipitates in the sample (data not shown), which may explain the increased toughness.

3.5. Viscosity

Experimental viscosity values for the volcanic ash glass, obtained by both continuous cooling and isothermal holds, are plotted in Figure 11 as a function of temperature. EDS analysis of the glass following viscosity testing suggested that the composition of the glass did not change during testing.
The experimental viscosities range from ~15–105 Pa·s (log values ~1.25–2) with a decreasing temperature. These values are considerably lower than expected from model predictions. Glass viscosity was predicted using three different viscosity models (Giordano et al., Fluegel, and the FactSage Viscosity Module with Melt Database). The Giordano et al. model [30] calculates the non-Arrhenian temperature dependence of viscosity for naturally occurring silicate melts by connecting experimentally obtained viscosity profiles with VFT (Vogel–Fulcher–Tamman) constants. The VFT equation is given by [31,32,33]
log η = A + B T C
where A, B, and C are constants. The Fluegel model [34] also correlates VFT constants to experimental viscosity data, but for commercial silicate-based glasses. On the other hand, the FactSage method [25] of calculation is non-empirical, instead relating viscosity to melt structure. The Modified Quasichemical Model is utilized, along with thermodynamic values, to calculate viscosity for a given composition. The viscosity, based off of the Giordano et al., Fluegel, and FactSage models, is given as a function of temperature for the volcanic ash glass in Figure 11, alongside experimental values. It is assumed that the glass is fully molten at temperatures 1325–1500 °C based on the results discussed previously.
It can be seen from Figure 11 that the FactSage and Fluegel models give values that are in good agreement, while the Giordano model viscosity is greater by up to about one order of magnitude. Wiesner et al. performed similar calculations on the synthetic sand glass composition given in Table 1 and also saw that the FactSage and Fluegel models showed reasonable agreement. Experimental measurements confirmed that the FactSage and Fluegel models were more accurate than the Giordano et al. model for that particular composition [35,36]. This result did not translate to the volcanic ash glass, which had an experimental viscosity lower than the FactSage and Fluegel models by about half an order of magnitude.
It is important to note that the input composition for the Giordano model is slightly different from that reported in Table 1 due to model constraints—notably, that the input was FeO instead of Fe2O3. The composition of the glass for this model was 5.1CaO-2.5MgO-15.2Al2O3-59.9SiO2-9.3FeO-1.7TiO2-4.6Na2O-1.7K2O (wt %). The Fe2O3 reported in Table 1 was converted to FeO (assuming 2 mol FeO for 1 mol Fe2O3 based on Fe alone) and trace oxides were not taken into account due to their total weight being unknown.
Wiesner and Bansal [18] estimated the amount of time (t) it would take for their synthetic sand CMAS to infiltrate a 200 µm TBC, barring CMAS crystallization and/or other thermochemical interactions with the coating, using the following
t ~ k t 8 D c 1 ω ω 2 L 2 η σ LV
where a tortuosity (kt) value of ~3 was considered for the coating [5], the capillary diameter (Dc) was 1 µm [37], ω ≈ 0.1 was the pore fraction open to flow [37], and surface tension (σLV) was assumed to be ~0.4 J m−2, calculated using an approach for silicate glass melts at 1400 °C [38]. Assuming these values for the current system and using the viscosities calculated at 1400 °C by each model, the infiltration time was determined to be ~29 min for the Giordano model and ~7–8 min for both the FactSage and Fluegel models. These values are compared to the calculated infiltration times for the synthetic sand glass in Table 7. Given that the experimental viscosity for the volcanic ash glass is about half an order of magnitude less than that calculated by the FactSage and Fluegel approaches, the expected time to complete infiltration at 1400 °C is actually around 2 min. Experimental viscosities and infiltration times at ~1400 °C are also given in Table 7 for the volcanic ash glass and the synthetic sand glass reported previously [35].

4. Discussion

The crystallized phases observed in this study are similar to those reported elsewhere. Mechnich et al. previously investigated a synthetic volcanic ash glass, prepared by sol-gel, with a composition approximating that of an actual Eyjafjallajökull deposit [39]. Calcination of the base glass powder at 800 °C resulted in the formation of Fe2O3, as well as some pseudobrookite (Fe2TiO5) and aegirine (NaFeSi2O6), within the glass. After heat treatment of a powdered mixture of the volcanic ash glass with TBC yttria-stabilized zirconia (YSZ) at temperatures of 900–1200 °C, the hematite phase was still discerned and plagioclase was evident ≥1000 °C. An electron beam-physical vapor deposited (EB-PVD) YSZ coating exposed to the glass for 1 h at 1200 °C also showed the formation of plagioclase and an Fe-rich oxide at its surface. Jang et al. characterized an as-received volcanic ash deposit from the Eyjafjallajökull 2010 eruption and determined the presence of anorthite/albite (plagioclase), augite (Ca(Mg,Fe,Al)(Si,Al)2O6), and analcime (Na(Al,Si2O6)H2O) [40]. Interestingly, they did not report any Fe-based phases in the as-received sample despite it being composed of nearly 10 wt % Fe2O3. The heat treatment history of their sample is unknown.
The volcanic ash glass showed considerably different crystallization behavior compared to a previously investigated synthetic sand glass (Table 1). Wiesner and Bansal [17] saw the formation of wollastonite (CaSiO3) and aluminum diopside (Ca(Mg,Al)(Si,Al)2O6) in bulk CMAS samples at temperatures as low as 925 °C. For the glass in this study, while DTA indicated crystallization at 900 °C, and FactSage calculations suggested the same, furnace tests revealed that only a very small amount of Fe3O4 formed at this temperature. The synthetic sand CMAS glass was fully crystalline after 20 h at 925 °C or 5 h at 960 °C. Based on the results of this study, it is clear that bulk volcanic ash glass pieces would not fully crystallize at these temperature/time scales. It is interesting to note that the powderized glass showed significantly increased crystallization kinetics (Table 4) compared to the bulk (Table 3) at 1100 and 1150 °C. It is likely that the glass powder would also show increased crystallization at 900, 1000, and 1200 °C compared to the bulk. It is possible, and apparently more desirable in terms of crystallization, that a protective coating (T/EBC) in service will come into contact with fine particles instead of bulk pieces.
Volcanic ash glass of this composition in contact with a T/EBC at temperatures nearing 1300 °C will likely soften/melt and penetrate the coating via defects such as open channels (in a TBC) or grain boundaries and pores/cracks (in an air plasma spray (APS)-deposited EBC). Barring any chemical interaction between the glass/coating, it is unlikely that infiltration will be halted by intrinsic glass crystallization, even with the assumption that there is a thermal gradient in the coating. A 250 μm thick EB-PVD YSZ TBC was nearly completely infiltrated after only 1 h at 1200 °C in contact with an artificial volcanic ash glass [39]. Another study by Mechnich et al. investigated an alternative TBC material, Gd2Zr2O7 (GZO), in contact with the artificial volcanic ash and saw slowed infiltration (50 μm after 1 h at 1200 °C) compared to YSZ [41]. This slowing was likely due to the dissolution of the coating in the glass to form newly crystallized reaction products, including an oxyapatite phase, Ca2Gd8(SiO4)6O2. In the study by Jang et al., the authors investigated the reaction between volcanic ash and a dense EBC material, Yb2SiO5, at 1400 °C [40]. Infiltration was halted by the formation of a thin layer of Yb2Si2O7. Yb2SiO5, in contact with a CMAS composition more closely approximating that of the synthetic sand glass (Table 1; increased CaO content, decreased SiO2 content), formed a much thicker reaction layer containing Yb apatite, Ca2Yb8(SiO4)6O2.
TBC materials YSZ and GZO have higher CTEs than the bulk volcanic ash glass, with values of ~11–12 [42,43]. If a TBC is infiltrated and then cooled, strain from a thermal mismatch between the coating and glass can lead to cracking and delamination. EBC materials, rare earth monosilicates (Y2SiO5, Yb2SiO5), have CTEs ~6–7.5 [6,44,45], which are similar to that of the bulk volcanic ash glass. These materials, however, will have a relatively high thermal mismatch with an underlying SiC-based CMC. SiC has a CTE of about 4.5–5.5 × 10⁻⁶ °C−6 [6]. Other proposed EBC materials, rare earth (RE) disilicates (Y2Si2O7, Yb2Si2O7), have CTEs that more closely match that of SiC, ranging ~3.5–5 × 10⁻⁶ °C−6 [46,47]. The CTE of the bulk glass is greater than that of the CMC/disilicate system and the CTEs of the intrinsically crystallized phases in the glass are considerably so. CTE values (to 1000 °C) for the crystalline products of Fe3O4 and Fe2O3 are around 9–15 and 9–12 × 10−6 K−1 [48], respectively, and 3 and 1.5 × 10⁻⁵ K−1 for albite and anorthite, respectively [49]. Similar to that expected in a TBC system, CTE mismatch between the glass/crystallized glass and an EBC will likely result in spallation at the coating/glass interface.
In addition to CTE, mechanical properties such as elastic modulus, hardness, and toughness of the coated CMC can be compromised by CMAS attack. The bulk elastic moduli of TBC materials YSZ and GZO are on the order of 200–250 GPa [42,50,51,52]. However, the typical in-plane modulus for an EB-PVD TBC is about 30 GPa [13]. Upon infiltration, the coating is stiffened, with an E reaching at least that of the glass (75 GPa), and the in-plane compliance of the TBC is degraded [13]. For current EBCs of γ-Y2Si2O7 and β-Yb2Si2O7, E is around 155 and 168 GPa [53,54], respectively, while Y2SiO5 and Yb2SiO5 have values of 123 and 149 GPa, respectively [55,56]. The effect of changes in the elastic modulus is likely not as important in EBCs because they are relatively dense compared to TBCs.
Hardness and toughness values for YSZ and GZO are between ~12–14 and 1–2, respectively [50,52]. The hardness of the volcanic ash glass is much lower than these TBC materials, while the toughness is similar. For the Yb- and Y-based silicates, HV and KC values are 6.4 and 2.3, respectively, for Yb2SiO5 [56], 7.3 and 2.8 for Yb2Si2O7 [54], 5.3 and 2.2 for Y2SiO5 [55], and 6.2 and 2.1 for Y2Si2O7 [53]. Hardness values reported here for the solidified volcanic ash are on the order of those for the RE silicates; more concerning is the apparent decrease in toughness, which could lead to diminished resistance of the coating to fracture due to CMAS infiltration. It is noted that the volcanic ash glass has a greater toughness than that reported for the synthetic and desert sand glasses.
The viscosity of the volcanic ash glass determined experimentally in this study was much lower than predicted by model calculations. Wiesner et al. reported that the FactSage and Fluegel models better represented experimental viscosity values for the synthetic sand glass composition (Table 1) than the Giordano et al. model [35,36]. While the FactSage and Fluegel model predictions more closely matched experimental data for the volcanic ash glass, compared to the Giordano et al. model, they were still higher by about half an order of magnitude. Preliminary Fourier-transform infrared spectroscopy (FTIR) measurements on the volcanic ash glass suggest that H2O was incorporated into its structure. The presence of water in glass can significantly lower glass viscosity [57], which is a possible explanation for the lower measured viscosity values. It is important to consider the effect of glass bonding with water when modeling CMAS viscosity, especially when considering an actual engine environment wherein high water vapor partial pressures are expected. It is also possible that none of the models investigated are adequate to describe viscosity for this particular composition. Additionally, the valence state of Fe in the glass is uncertain and can vary as a function of composition, temperature and pO2, and its role in the glass structure. The valence state’s effect on glass structure is related to the overall viscosity of the melt. The available iron oxide inputs for the Fluegel and Giordano et al. models are limited to Fe2O3 and FeO, respectively. The FactSage model can incorporate both Fe2O3 and FeO as input compositions. When substituting FeO for Fe2O3 in the volcanic ash glass composition given by Table 1, the predicted viscosity was lower (Table 8), but not to the degree given by experimental data. It is proposed that all Fe2+ acts as a glass network modifier while Fe3+ acts as a network former when Fe3+:Fe2+ > 1 [58], explaining the observed changes in calculated viscosity.
The infiltration times calculated for the synthetic sand glass and the volcanic ash glass determined from experimental viscosity values are not very different. The expected time to complete infiltration (determined using Equation (7) and experimental viscosity values; Table 7) is only slightly longer for coatings exposed to the volcanic ash glass (1.6 min at 1410 °C) compared to the synthetic sand glass (0.41 min at 1411 °C). This small difference in infiltration time is likely due to a slightly higher viscosity of the volcanic ash glass resulting in part from a greater SiO2 and lesser CaO content.
Equation (7) has limitations in its ability to predict the infiltration rate in T/EBCs. The competing effect of crystallization in the determination of infiltration time should be considered for a TBC such as GZO. This coating material dissolves to some degree in contact with CMAS and contributes metal ions to the melt, inducing crystallization of oxyapatite. In addition, this equation is not well suited to predict infiltration in APS-deposited EBCs. APS EBCs are nominally dense and do not contain open channels for CMAS to penetrate (although grain boundaries and pores are susceptible). However, regardless of type, a coating material that reacts quickly with the volcanic ash glass to form newly crystallized phases will likely slow penetration. The low viscosities (Table 7) and sluggish crystallization reported for the volcanic ash glass studied here can lead to fast infiltration via coating channels and defects.

5. Summary and Conclusions

The intrinsic thermal and mechanical properties of a volcanic ash glass were studied using a variety of characterization techniques. It was determined that the glass had a low propensity to crystallize in bulk form, with ≤20 wt % transforming to Fe3O4, Fe2O3, and/or plagioclase after up to 40 h at temperatures of 900–1200 °C. This was in contrast to a previously investigated synthetic sand glass, which was more easily able to crystallize and formed wollastonite (CaSiO3) and diopside (Ca(Mg,Al)(Si,Al)2O6). The ability of the volcanic ash glass to crystallize was improved when exposed in powder form.
The melting temperature (Tm), glass transition temperature (Tg), and glass softening temperature (Td) of the volcanic ash glass were greater than those of sand glass compositions. There was a broad melting range for the volcanic ash glass, determined by DTA; after heating to 1300 °C at 10 °C/min and quenching in air, the glass was mostly amorphous by XRD analysis. The coefficient of thermal expansion (CTE) and Young’s modulus (E) of the volcanic ash glass were lower than those reported for sand glasses. Hardness values were similar, but the indentation fracture toughness of the volcanic ash glass was about twice that of the sand glasses, likely due to the presence of some Fe3O4 crystallites in the tested sample.
The viscosity of the volcanic ash glass was lower than expected from model predictions. This is unlike that reported for the synthetic sand glass composition, which showed relatively good agreement with Fluegel and FactSage viscosity models. The discrepancies in this study could be due to the difference in the glass composition, or possibly the incorporation of water in the volcanic ash glass structure. Experimental viscosities for the volcanic ash glass were higher than for the synthetic sand glass, in part likely due to a greater SiO2 and lesser CaO content.
In conclusion, it has been shown that the chemical and mechanical properties of the Eyjafjallajökull volcanic ash CMAS glass can vary significantly from sand-based CMAS glass compositions. In assessing the potential of new coating (T/EBCs) materials for use over a wide range of operating conditions, the variation of CMAS properties with composition must be understood.

Author Contributions

Conceptualization, V.L.W.; methodology, V.L.W. and R.I.W.; validation, V.L.W., J.A.S. and N.P.B.; formal analysis, R.I.W.; investigation, R.I.W.; resources, V.L.W., J.A.S., N.P.B. and E.J.O.; data curation, V.L.W., J.A.S., N.P.B. and R.I.W.; writing—original draft preparation, R.I.W.; writing—review and editing, V.L.W., J.A.S., N.P.B. and E.J.O.; visualization, V.L.W.; supervision, V.L.W., J.A.S. and N.P.B.; project administration, V.L.W.; funding acquisition, V.L.W. and E.J.O. All authors have read and agree to the published version of the manuscript.

Funding

This research was supported by NASA’s Transformative Tools and Technologies (TTT) Project within the Transformative Aeronautics Concept Program (TCAP) and the Lewis’ Educational and Research Collaborative Internship Project (LERCIP) at NASA Glenn Research Center.

Acknowledgments

The authors are grateful to Gustavo Costa, Bryan Harder, Nathan Jacobson, Dereck Johnson, and Richard Rogers for training and helpful discussion, and Marie Kløve Keiding, Magnus Gudmundsson, and Tinna Jónsdóttir for assistance in obtaining volcanic ash from the Eyjafjallajökull eruption used in this study.

Conflicts of Interest

The authors declare no conflict of interest.

References

  1. De Wet, D.; Taylor, R.; Stott, F. Corrosion mechanisms of ZrO2-Y2O3 thermal barrier coatings in the presence of molten middle-east sand. J. Phys. IV 1993, 3, 655–663. [Google Scholar] [CrossRef] [Green Version]
  2. Stott, F.H.; De Wet, D.; Taylor, R. Degradation of thermal barrier coatings at very high temperature. MRS Bull. 1994, 19, 46–49. [Google Scholar] [CrossRef]
  3. Clarke, D.R.; Oechsner, M.; Padture, N.P. Thermal-barrier coatings for more efficient gas turbine engines. MRS Bull. 2012, 37, 891–898. [Google Scholar] [CrossRef] [Green Version]
  4. Ohnabe, H.; Masaki, S.; Onozuka, M.; Miyahara, K.; Sasa, T. Potential application of ceramic matrix composites to aero-engine components. Compos. Part A 1999, 30, 489–496. [Google Scholar] [CrossRef]
  5. Lee, K.N. Environmental Barrier Coatings for SiCf/SiC. In Ceramic Matrix Composites: Materials, Modeling and Technology; Bansal, N.P., Lamon, J., Eds.; John Wiley and Sons: Hoboken, NJ, USA, 2014; pp. 430–451. [Google Scholar]
  6. Lee, K.N.; Fox, D.S.; Bansal, N.P. Rare earth silicate environmental barrier coatings for SiC/SiC composites and Si3N4 ceramics. J. Eur. Ceram. Soc. 2005, 25, 1705–1715. [Google Scholar] [CrossRef]
  7. Borom, M.P.; Johnson, C.A.; Peluso, L.A. Role of environment deposits and operating surface temperature in spallation of air plasma sprayed thermal barrier coatings. Surf. Coat. Technol. 1996, 86, 116–126. [Google Scholar] [CrossRef]
  8. Krämer, S.; Yang, J.; Levi, C.G. Infiltration-inhibiting reaction of gadolinium zirconate thermal barrier coatings with CMAS melts. J. Am. Ceram. Soc. 2008, 91, 576–583. [Google Scholar] [CrossRef]
  9. Poerschke, D.L.; Jackson, R.W.; Levi, C.G. Silicate deposit degradation of engineered coatings in gas turbines: Progress toward models and materials solutions. Annu. Rev. Mater. Res. 2017, 47, 297–330. [Google Scholar] [CrossRef]
  10. Stolzenburg, F.; Johnson, M.T.; Lee, K.N.; Jacobson, N.S.; Faber, K.T. The interaction of calcium magnesium-aluminosilicate with ytterbium silicate environmental barrier materials. Surf. Coat. Technol. 2015, 284, 44–50. [Google Scholar] [CrossRef] [Green Version]
  11. Zhao, H.; Richards, B.T.; Levi, C.G.; Wadley, H.N.G. Molten silicate reactions with plasma sprayed ytterbium silicate coatings. Surf. Coat. Technol. 2016, 288, 151–162. [Google Scholar] [CrossRef] [Green Version]
  12. Ahlborg, N.L.; Zhu, D. Calcium-magnesium aluminosilicate (CMAS) reactions and degradation mechanisms of advanced environmental barrier coatings. Surf. Coat. Technol. 2013, 237, 79–87. [Google Scholar] [CrossRef] [Green Version]
  13. Wiesner, V.L.; Harder, B.J.; Bansal, N.P. High-temperature interactions of desert sand CMAS glass with yttrium disilicate environmental barrier coating material. Ceram. Int. 2018, 44, 22738–22743. [Google Scholar] [CrossRef]
  14. Levi, C.G.; Hutchinson, J.W.; Vidal-Sétif, M.-H.; Johnson, C.A. Environmental degradation of thermal barrier coatings by molten deposits. MRS Bull. 2012, 37, 932–941. [Google Scholar] [CrossRef] [Green Version]
  15. Zaleski, E.M.; Ensslen, C.; Levi, C.G. Melting and crystallization of silicate systems relevant to thermal barrier coating damage. J. Am. Ceram. Soc. 2015, 98, 1642–1649. [Google Scholar] [CrossRef]
  16. Delmelle, P.; Lambert, M.; Dufrêne, Y.; Gerin, P.; Óskarsson, N. Gas/aerosol-ash interaction in volcanic plumes: New insights from surface analyses of fine ash particles. Earth Planet. Sci. Lett. 2007, 259, 159–170. [Google Scholar] [CrossRef]
  17. Wiesner, V.L.; Bansal, N.P. Crystallization kinetics of calcium-magnesium aluminosilicate (CMAS) glass. Surf. Coat. Technol. 2014, 259, 608–615. [Google Scholar] [CrossRef]
  18. Wiesner, V.L.; Bansal, N.P. Mechanical and thermal properties of calcium magnesium aluminosilicate (CMAS) glass. J. Eur. Ceram. Soc. 2015, 35, 2907–2914. [Google Scholar] [CrossRef]
  19. Bansal, N.P.; Choi, S.R. Properties of CMAS glass from desert sand. Ceram. Int. 2015, 41, 3901–3909. [Google Scholar] [CrossRef]
  20. ASTM C1259-14 Standard Test Method for Dynamic Young’s Modulus, Shear Modulus, and Poisson’s Ratio for Advanced Ceramics by Impulse Excitation of Vibration; ASTM International: Conshohocken, PA, USA, 2014.
  21. ASTM C1327-08 Standard Test Method for Vickers Indentation Hardness of Advanced Ceramics; ASTM International: Conshohocken, PA, USA, 2008.
  22. Lamkin, M.A.; Riley, F.L.; Fordham, R.J. Oxygen mobility in silicon dioxide and silicate glasses: A review. J. Eur. Ceram. Soc. 1992, 10, 347–367. [Google Scholar] [CrossRef]
  23. Monazam, E.R.; Breault, R.W.; Siriwardane, R. Kinetics of magnetite (Fe3O4) oxidation to hematite (Fe2O3) in air for chemical looping combustion. Ind. Eng. Chem. Res. 2014, 53, 13320–13328. [Google Scholar] [CrossRef]
  24. Forsmo, S.P.E.; Forsmo, S.-E.; Samskog, P.-O.; Björkman, B.M.T. Mechanisms in oxidation and sintering of magnetite iron ore green pellets. Powder Technol. 2008, 183, 247–259. [Google Scholar] [CrossRef]
  25. Bale, C.W.; Bélisle, E.; Chartrand, P.; Decterov, S.A.; Eriksson, G.; Hack, K.; Jung, I.-H.; Kang, Y.B.; Melançon, J.; Pelton, A.D.; et al. FactSage thermochemical software and databases-recent developments. Calphad 2009, 33, 295–311. [Google Scholar] [CrossRef]
  26. Miyoshi, T.; Sagawa, N.; Sassa, T. Study on fracture toughness evaluation for structural ceramics. Trans. Jpn. Soc. Mech. Eng. 1985, 51, 2487–2489. [Google Scholar] [CrossRef] [Green Version]
  27. Marshall, D.; Evans, A. Reply to “Comment on ‘Elastic/plastic indentation damage in ceramics: The median/radial crack system’”. J. Am. Ceram. Soc. 1981, 64, C182–C183. [Google Scholar]
  28. Anstis, G.; Chantikul, P.; Lawn, B.R.; Marshall, R. A critical evaluation of indentation techniques for measuring fracture toughness: I. Direct crack measurements. J. Am. Ceram. Soc. 1981, 64, 533–538. [Google Scholar] [CrossRef]
  29. Salem, J.; Jenkins, M. Applying ASTM International C1421 to glasses and optical ceramics. In Proceedings of the 42nd International Conference on Advanced Ceramics and Composites, Ceramic Engineering and Science Proceedings; Salem, J., Koch, D., Mechnich, P., Kusnezoff, M., Bansal, N.P., LaSalvia, J.C., Balaya, P., Fu, Z., Ohii, T., Wiesner, V., et al., Eds.; John Wiley & Sons: Hoboken, NJ, USA, 2019; Volume 39, pp. 27–40. [Google Scholar]
  30. Giordano, D.; Russell, J.K.; Dingwell, D.B. Viscosity of magmatic liquids: A model. Earth Planet. Sci. Lett. 2008, 271, 123–134. [Google Scholar] [CrossRef]
  31. Vogel, D.H. Temperaturabhängigkeitsgesetz der Viskosität von Flüssigkeiten. Phys. Z. 1921, 22, 645–646. [Google Scholar]
  32. Fulcher, G.S. Analysis of recent measurements of the viscosity of glasses. J. Am. Ceram. Soc. 1925, 8, 339–355. [Google Scholar] [CrossRef]
  33. Tammann, G.; Hesse, W. Die abhängigkeit der viskosität von der temperatur bei unterkühlten flüssigkeiten. Z. Anorgan. Allg. Chem. 1926, 156, 245–257. [Google Scholar] [CrossRef]
  34. Fluegel, A. Glass viscosity calculation based on a global statistical modeling approach. Glass Technol. Eur. J. Glass Sci. Technol. Part A 2007, 48, 13–30. [Google Scholar]
  35. Wiesner, V.L.; Vempati, U.K.; Bansal, N.P. High temperature viscosity of calcium magnesium aluminosilicate glass from synthetic sand. Scr. Mater. 2016, 124, 189–192. [Google Scholar] [CrossRef]
  36. Wiesner, V.L.; Vempati, U.K.; Bansal, N.P. Corrigendum to “High temperature viscosity of calcium-magnesium-aluminosilicate glass from synthetic sand” [Scripta Mater. 2016, 124, 189–192]. Scr. Mater. 2017, 130, 298. [Google Scholar] [CrossRef]
  37. Krämer, S.; Yang, J.; Levi, C.G.; Johnson, C.A. Thermochemical interaction of thermal barrier coatings with molten CaO-MgO-Al2O3-SiO2 (CMAS) deposits. J. Am. Ceram. Soc. 2006, 89, 3167–3175. [Google Scholar] [CrossRef]
  38. Kucuk, A.; Clare, A.; Jones, L. An estimation of the surface tension for silicate glass melts at 1400 °C using statistical analysis. Glass Technol. 1999, 40, 149–153. [Google Scholar]
  39. Mechnich, P.; Braue, W.; Schulz, U. High-temperature corrosion of EB-PVD yttria partially stabilized zirconia thermal barrier coatings with an artificial volcanic ash overlay. J. Am. Ceram. Soc. 2011, 94, 925–931. [Google Scholar] [CrossRef]
  40. Jang, B.-K.; Feng, F.-J.; Suzuta, K.; Tanaka, H.; Matsushita, Y.; Lee, K.-S.; Ueno, S. Corrosion behavior of volcanic ash and calcium magnesium aluminosilicate on Yb2SiO5 environmental barrier coatings. J. Ceram. Soc. Jpn. 2017, 125, 326–332. [Google Scholar] [CrossRef] [Green Version]
  41. Mechnich, P.; Braue, W. Volcanic ash-induced decomposition of EB-PVD Gd2Zr2O7 thermal barrier coatings to Gd-oxyapatite, zircon, and Gd,Fe-zirconolite. J. Am. Ceram. Soc. 2013, 96, 1958–1965. [Google Scholar] [CrossRef] [Green Version]
  42. Evans, A.G.; Mumm, D.R.; Hutchinson, J.W.; Meier, G.H.; Pettit, F.S. Mechanisms controlling the durability of thermal barrier coatings. Prog. Mater. Sci. 2001, 46, 505–553. [Google Scholar] [CrossRef]
  43. Touloukian, Y.S.; Kirby, R.K.; Taylor, R.E.; Lee, T.Y.R. Thermal Expansion-Non Metallic Solids; IFI/Plenum: New York, NY, USA, 1977; Volume 13. [Google Scholar]
  44. Fukuda, K.; Matsubara, H. Anisotropic thermal expansion in yttrium silicate. J. Mater. Res. 2003, 18, 1715–1722. [Google Scholar] [CrossRef]
  45. NETL. The Gas Turbine Handbook; United States Department of Energy (DOE): Morgantown, WV, USA, 2006. [Google Scholar]
  46. Sun, Z.; Zhou, Y.; Wang, J.; Li, M. Thermal properties and thermal shock resistance of γ- Y2Si2O7. J. Am. Ceram. Soc. 2008, 91, 2623–2629. [Google Scholar] [CrossRef]
  47. Fernández-Carrión, A.J.; Allix, M.; Becerro, A.I. Thermal expansion of rare-earth pyrosilicates. J. Am. Ceram. Soc. 2013, 96, 2298–2305. [Google Scholar] [CrossRef]
  48. Takeda, M.; Onishi, T.; Nakakubo, S.; Fujimoto, S. Physical properties of iron-oxide scales on Si containing steels at high temperature. Mater. Trans. 2009, 50, 2242–2246. [Google Scholar] [CrossRef] [Green Version]
  49. Tribaudino, M.; Angel, R.J.; Cámara, F.; Nestola, F.; Pasqual, D.; Margiolaki, I. Thermal expansion of plagioclase feldspars. Mineral. Petrol. 2010, 160, 899–908. [Google Scholar] [CrossRef]
  50. Vassen, R.; Cao, X.; Tietz, F.; Basu, D.; Stöver, D. Zirconates as new materials for thermal barrier coatings. J. Am. Ceram. Soc. 2000, 83, 2023–2028. [Google Scholar] [CrossRef]
  51. Van Dijk, M.P.; de Vries, K.J.; Burggraaf, A.J. Oxygen ion and mixed conductivity in compounds with the fluorite and pyrochlore structure. Solid State Ion. 1983, 9–10, 913–919. [Google Scholar] [CrossRef] [Green Version]
  52. Schmitt, M.P.; Stokes, J.L.; Gorin, B.L.; Rai, A.K.; Zhu, D.; Eden, T.J.; Wolfe, D.E. Effect of Gd content on mechanical properties and erosion durability of sub-stoichiometric Gd2Zr2O7. Surf. Coat. Technol. 2017, 313, 177–183. [Google Scholar] [CrossRef] [Green Version]
  53. Sun, Z.; Zhou, Y.; Wang, J.; Li, M. γ-Y2Si2O7, a machinable silicate ceramic: Mechanical properties and machinability. J. Am. Ceram. Soc. 2007, 90, 2535–2541. [Google Scholar] [CrossRef]
  54. Zhou, Y.-C.; Zhao, C.; Wang, F.; Sun, Y.-J.; Zheng, L.-Y.; Wang, X.-H. Theoretical prediction and experimental investigation on the thermal and mechanical properties of bulk β- Yb2Si2O7. J. Am. Ceram. Soc. 2013, 96, 3891–3900. [Google Scholar] [CrossRef]
  55. Sun, Z.; Wang, J.; Li, M.; Zhou, Y. Mechanical properties and damage tolerance of Y2SiO5. J. Eur. Ceram. Soc. 2008, 28, 2895–2901. [Google Scholar] [CrossRef]
  56. Lu, M.-H.; Xiang, H.-M.; Feng, Z.-H.; Wang, X.-Y.; Zhou, Y.-C. Mechanical and thermal properties of Yb2SiO5: A promising material for T/EBCs applications. J. Am. Ceram. Soc. 2016, 99, 1401–1411. [Google Scholar] [CrossRef]
  57. Stolper, E. Water in silicate glasses: An infrared spectroscopic study. Contrib. Mineral. Petrol. 1982, 81, 1–17. [Google Scholar] [CrossRef]
  58. Cook, G.B.; Cooper, R.F. Chemical diffusion and crystalline nucleation during oxidation of ferrous iron-bearing magnesium aluminosilicate glass. J. Non Cryst. Solids 1990, 120, 207–222. [Google Scholar] [CrossRef]
Figure 1. Calculated and experimental viscosity curves for a borosilicate glass standard.
Coatings 10 00100 g001
Figure 2. Bulk (bold line) and powder (dashed line) volcanic ash glass differential thermal analysis (DTA) curves with a ramp rate of 10 °C/min. Labels 1B, 2B, 1P, 2P, and 3P correspond to crystallization in the bulk (B) and powder (P) samples on heating. Labels 3B and 4P show the onset of melting. Labels 4B and 5P indicate solidification of molten glass upon cooling.
Coatings 10 00100 g002
Figure 3. Bulk volcanic ash glass samples before heat treatment (a) and after heat treatment at 1100 (b) and 1150 °C (c). The solidified glass samples are the dark droplets on Pt foil.
Coatings 10 00100 g003
Figure 4. XRD plots for bulk volcanic ash glass heat treated for 1 h at 900, 1000, 1100, 1150, and 1200 °C (ramp rate 10 °C/min). The “Control” spectrum is for volcanic ash glass not exposed to temperature.
Coatings 10 00100 g004
Figure 5. Cross-section backscattered electron imaging (BSE) images of bulk volcanic ash glass after exposure at 1150 °C for 1 h (a), 10 h (b), 20 h (c), and 40 h (d).
Coatings 10 00100 g005
Figure 6. Cross-section BSE images for bulk volcanic ash glass samples treated at 1100 (a,c) and 1150 °C (b,d) for 10 h.
Coatings 10 00100 g006
Figure 7. XRD spectra for bulk (solid line) and powder (dashed line) volcanic ash glass samples exposed to 1100 °C for 1 h.
Coatings 10 00100 g007
Figure 8. Expected phase formations in the volcanic ash glass as a function of temperature, calculated using the FactSage Equilibrium module.
Coatings 10 00100 g008
Figure 9. Expected phase formations in the synthetic sand glass as a function of temperature, calculated using the FactSage Equilibrium module.
Coatings 10 00100 g009
Figure 10. Dilatometric thermal expansion curve on heating for the volcanic ash glass at a heating rate of 5 °C/min in air. Glass transition temperature (Tg) and glass softening temperature (Td) are indicated.
Coatings 10 00100 g010
Figure 11. Viscosity curves for the volcanic ash glass used in this study based on experimental and calculated values. Calculated values were determined using the FactSage Viscosity Module and Melt Database (black squares), the Giordano et al. model (blue circles), and the Fluegel model (red triangles). Experimental data are given in green. The continuous curve is for the experimental method in which the glass was cooled at a constant 2 °C/min while the separate diamond-shaped data points are for the experimental method in which the glass was equilibrated at 50 °C intervals.
Coatings 10 00100 g011
Table 1. Composition (in mol % and wt %, determined by inductively coupled plasma atomic emission spectroscopy—ICP-AES) of the volcanic ash glass prepared in this study compared to previously investigated synthetic sand and desert sand glasses [17,18,19]. Estimated uncertainty for values in the range of 1.0−3.0% = ±10% of actual value, for values in the range of 3.0−10.0% = ±5% of actual value, for values in the range of 10.0−25.0% = ±2% of actual value, for values in the range of 25.0−75.0% = ±1% of actual value.
CaOMgOAl2O3SiO2Fe2O3TiO2Na2OK2OTrace Oxides
Volcanic ash glassmol %6.24.210.167.54.41.45.01.2
wt %4.92.414.657.310.01.64.41.6bal.
Synthetic sand glassmol %23.36.43.162.50.044.10.5
wt %21.94.35.4630.14.30.8bal.
Desert sand glassmol %27.84561.60.61
wt %25.22.68.259.81.61.5bal.
Table 2. List of DTA thermal events presented in Figure 2 for the volcanic ash glass.
BulkApproximate Temperature (°C)PowderApproximate Temperature (°C)
On heating
Onset Melting (endo)3B1050 °C (peak melting at 1350 °C)4P950–1000 °C
Crystallization (exo)1B, 2B900, 1100 °C1P, 2P, 3P900, 1225, 1275 °C
On cooling
Crystallization (exo)4B900 °C5P900 °C
Table 3. The phase composition of bulk volcanic ash glass samples after heat treatment using quantitative XRD analysis.
wt % Amorphouswt % Fe3O4wt % Fe2O3wt % Plagioclase
1100 °C
1 h88.7 ± 0.19.9 ± 0.11.4 ± 0.10.0
10 h87.8 ± 0.28.9 ± 0.11.0 ± 0.12.3 ± 0.2
20 h89.4 ± 0.15.9 ± 0.12.3 ± 0.12.4 ± 0.1
40 h81.7 ± 0.34.6 ± 0.13.0 ± 0.110.7 ± 0.3
1150 °C
1 h90.7 ± 0.18.5 ± 0.10.8 ± 0.00.0
10 h94.2 ± 0.12.8 ± 0.03.0 ± 0.00.0
20 h94.5 ± 0.11.6 ± 0.13.9 ± 0.00.0
40 h95.7 ± 0.00.04.3 ± 0.00.0
1200 °C
1 h90.6 ± 0.17.7 ± 0.11.8 ± 0.10.0
10 h95.5 ± 0.10.9 ± 0.13.6 ± 0.00.0
20 h95.4 ± 0.11.4 ± 0.03.2 ± 0.00.0
Table 4. The phase composition of powder volcanic ash glass samples after heat treatment using quantitative XRD analysis.
wt % Amorphouswt % Fe3O4wt % Fe2O3wt % Plagioclase
1100 °C
1 h50.6 ± 0.53.9 ± 0.17.2 ± 0.138.3 ± 0.5
1150 °C
1 h65.5 ± 0.30.5 ± 0.17.1 ± 0.126.8 ± 0.3
Table 5. Thermal and mechanical properties of volcanic ash, synthetic sand, and desert sand glasses.
PropertyVolcanic Ash GlassSynthetic Sand Glass *Desert Sand Glass ±
Melting (Tm, °C)~1300–1350 °C1176
Density (g/cm3)2.522.632.69
Glass transition temperature (Tg, °C)741694706
Dilatometric softening point (Td, °C)844751764
Coefficient of thermal expansion (CTE α, K−1)7.00 × 10⁻⁶
(~25–720 °C)
9.32 × 10⁻⁶
(~25–690 °C)
9.8 × 10⁻⁶
(~25–700 °C)
Young’s Modulus (E, GPa)7584.392.3
Poisson’s ratio (ν)0.240.260.28
* Values obtained from [17,18]; ± Values obtained from [19].
Table 6. Vickers hardness and indentation fracture toughness at various indent loads for the volcanic ash glass and synthetic sand and desert sand glasses.
Indent Load, P (N)Vickers Hardness, HV (GPa)Indentation Fracture Toughness, KC (MPa √m) Calculated Using Equations (3)–(5)
Miyoshi et al. [26]Marshall and Evans [27]Anstis et al. [28]
Volcanic ash glass (current study)
1.967.02 ± 0.48n/an/an/a
2.946.22 ± 0.281.60 ± 0.241.83 ± 0.281.43 ± 0.22
4.96.99 ± 0.351.31 ± 0.081.53 ± 0.091.17 ± 0.07
9.87.03 ± 0.371.26 ± 0.131.47 ± 0.151.12 ± 0.12
Grand mean6.75 ± 0.401.39 ± 0.181.61 ± 0.191.24 ± 0.17
Synthetic sand glass [17,18]
1.966.12 ± 0.190.72 ± 0.040.82 ± 0.040.62 ± 0.04
2.946.28 ± 0.190.74 ± 0.050.86 ± 0.050.68 ± 0.04
4.96.04 ± 0.180.66 ± 0.050.74 ± 0.050.6
9.86.12 ± 0.130.62 ± 0.040.72 ± 0.040.58 ± 0.04
Grand mean6.14 ± 0.100.69 ± 0.060.79 ± 0.070.62 ± 0.04
Desert sand glass [19]
1.965.90 ± 0.100.70 ± 0.030.70 ± 0.030.60 ± 0.03
2.946.60 ± 0.100.80 ± 0.050.90 ± 0.100.70 ± 0.05
4.96.40 ± 0.100.75 ± 0.050.80 ± 0.100.65 ± 0.05
9.86.20 ± 0.100.65 ± 0.050.70 ± 0.100.60 ± 0.10
Grand mean6.28 ± 0.300.73 ± 0.060.78 ± 0.100.64 ± 0.05
Table 7. Viscosity (η) values (in Pa·s) as a function of temperature, model, and glass composition. The predicted time to complete the infiltration of a 200 μm thick thermal barrier coating (TBC) (dependent on viscosity) at 1400 °C is given for synthetic sand [35,36] and volcanic ash glasses. The expected infiltration time based on experimental viscosity data (using isothermal holds) is also given.
Synthetic SandVolcanic Ash
GiordanoFluegelFactSageExperimentalGiordanoFluegelFactSageExperimental
η 1300 °C274.933.678.119.5 (1318 °C)284838946582.3 (1311 °C)
η 1400 °C70.311.519.67.1 (1411 °C)507.3134.0127.928.6 (1410 °C)
η 1500 °C22.34.86.23.3 (1519 °C)121.454.441.711.8 (1502 °C)
Infiltration Time (1400 °C)3.8 minn/a1.1 min0.41 min (1411 °C)29.2 min7.7 min7.3 min1.6 min (1410 °C)
Table 8. Model FactSage viscosity (η) values using Fe2O3 or FeO as inputs. Using FeO in place of Fe2O3, the composition was the same as that for the Giordano et al. model (5.1CaO–2.5MgO–15.2Al2O3–59.9SiO2–9.3FeO–1.7TiO2–4.6Na2O–1.7K2O wt %).
Temperature (°C)Logη (Pa·s) Using Fe2O3Logη (Pa·s) Using FeO
15001.621.44
14751.741.55
14501.851.66
14251.981.78
14002.111.90
13752.242.03
13502.382.16
13252.522.30

