Abstract
Reduction of graphene oxide is one of the most promising strategies for obtaining bulk quantities of graphene-like materials. In this study, graphene oxide was deposited on SiO2 and reduced by annealing at 500 K under vacuum conditions (5 × 10⁻¹ Pa). Here, graphene oxide films as well as their chemical changes upon heating were characterized in depth by X-ray photoelectron spectroscopy, Raman spectroscopy, and scanning electron and atomic force microscopies. From the chemical point of view, the as prepared graphene oxide films presented a large quantity of oxidized functional groups that were reduced to a large extent upon heating. Moreover, residual oxidized sulfur species that originated during the synthesis of graphene oxide (GO) were almost completely removed by heating while nitrogen traces were integrated into the carbon framework. On the other hand, regarding structural considerations, reduced graphene oxide films showed more homogeneity and lower roughness than graphene oxide films.
1. Introduction
Graphene and related materials have a promising future due to their possible applications in a wide range of fields such as photovoltaics, transistors, and (bio)sensors [1,2]. Among the family of graphene materials, graphene oxide (GO) as well as reduced graphene oxide (rGO) seem to be better positioned than pristine graphene for industrial applications. This is because of some of their chemical methods are well established for synthesizing bulk quantities of GO [3,4,5] and rGO [5,6,7], while it is much more complex to obtain pristine graphene [8,9,10,11].
Thereby, the chemical exfoliation of graphite, the so-called Hummers’ method, and their modified protocols [5], are the main synthetic routes for obtaining bulk quantities of GO flakes. Nevertheless, these methods have several drawbacks that limit the potential applications of the obtained material. The GO flakes produced by these methods usually have uneven shapes, with a thickness of a few layers and a maximum lateral size of few microns [5,6,7,8,9,10,11,12]. The preparation of thin films or paper-like GO by stacking GO flakes [13,14,15,16] is a good approach for partially overtaking the above-mentioned limitations.
However, with an eye on their use in electronic applications, the main handicap to overcome is the low electrical conductivity of GO, as well as GO films. A way to improve the electrical conductivity of GO is by reduction. It can be chemically reduced by using hydrazine hydrate [17], sodium borohydride [18], or other reducing agents [19,20]. Nevertheless, these chemical procedures used to introduce contaminants such as sodium in the rGO films. In addition to carbon and oxygen, GO usually contains small quantities of sulfur and nitrogen, depending on the methodology of the synthesis, and thus rGO has these elements together with the contaminants introduced during its chemical reduction. Accordingly, other reduction methods are preferred to avoid chemical contaminants during the reduction of GO. Thereby, reduction under a hydrogen plasma [21], heating [22,23], or irradiation by high energy electrons [7] also reduce GO but without introducing chemical contaminants during the treatment. The motivation of the present work is to promote the reduction of GO thin films, without introducing contaminants, through a thermal treatment under vacuum conditions. Herein, the chemical environment of carbon, oxygen, sulfur, and nitrogen atoms, of GO, as well as their evolution induced by thermal treatment were characterized by high resolution X-ray photoelectron spectroscopy (XPS). Moreover, both GO and rGO films obtained by our method were characterized by Raman spectroscopy and scanning electron (SEM) and atomic force (AFM) microscopies.
2. Materials and Methods
SiO2 templates were cleaned in sequence by acetone, ethanol, and mq water in ultrasonic during 10 min. This process was repeated until all contaminants were completely removed from the surface. The clean SiO2 surface was checked by XPS.
A solution of commercial GO (graphenea) (0.05%) in mq water was deposited on fresh SiO2 templates by drop coating and naturally dried. To heat the samples, these templates were introduced in a chemical vapor deposition (CVD) furnace and heated at the desired temperature during 40 min. The temperature was ramped at a velocity of 10 K/min, and the pressure during the whole process was 5 × 10⁻¹ Pa. In parallel, the samples were also heated in an ultra-high vacuum (UHV) system for in situ and real-time monitoring of the key chemical changes by XPS.
XPS spectra were acquired in an UHV system with a base pressure of 2 × 10⁻⁸ Pa. The system was equipped with a hemispherical electron energy analyzer (SPECS Phoibos 150, Berlin, Germany), a delay-line detector, and a monochromatic AlKα (1486.74 eV) X-ray source. High-resolution spectra were recorded at normal emission take-off angle and with a pass-energy of 20 eV, which provided an overall instrumental peak broadening of 0.5 eV. SEM micrographs were obtained on a TM4000Plus microscope (Hitachi, Tokyo, Japan). The micrographs were acquired by a backscatter electrons detector for high contrast. AFM measurements were carried out using a Veeco AFM Multimode Nanoscope (IV) MMAFM-2, Veeco microscopy. A conductive Si cantilever (nanosensors, nominal force constant of 42 N/m, and resonant frequency of 330 kHz) was used. AFM scanning in tapping mode was performed on various regions of the films, which produced reproducible images similar to those displayed in this work. Micro-Raman spectroscopy was performed using a Jobin Yvon (HORIBA, Kyoto, Japan) HR800 instrument, using a 530 nm laser wavelength as excitation source (Kimmon, IK series, Tokyo, Japan) and x100 objective (NA = 0.9, Olympus, Tokyo, Japan).
3. Results and Discussion
XPS is a well established technique for detecting surface elements as well as characterizing the chemical state of different molecular species. Moreover, the chemical changes induced by annealing can be followed in situ and in real time.
Figure 1a,c show C 1s and O 1s core levels as a function of the temperature of the sample. In these figures, the intensity of the XPS peaks is color-coded. In both figures, the spectra obtained at room temperature (RT) remained stable until reaching a critical temperature of around 430 K, temperature that was in good agreement with previously reported values for the thermal reduction of GO by following other methods [22]. On the other hand, the analysis of the high-resolution spectra of C 1s and O 1s showed in Figure 1b,d, respectively, offered more detailed information about the chemistry of the samples. At RT, C 1s showed two main peaks followed by a widening at higher binding energies (BEs). The spectra can be deconvoluted into four components (Figure 1b, bottom spectra). The first peak, centered at 284.5 eV, was ascribed to carbon atoms in a C–C/C=C chemical environment, while the three extra components centered at 286.5 eV, 287.6 eV, and 288.7 eV were ascribed to a diversity of oxidized functional groups containing C–O, C=O, and O=C–O bonds, respectively [7,22,24]. Furthermore, O 1s core level showed a single peak, centered at 532.3 eV, with a slight asymmetry at lower BEs, as it is shown in Figure 1d (bottom spectra). The main contribution to this peak was related to C-O bonds in functional groups such as epoxy, ether, or hydroxyl, while the asymmetry was ascribed to C=O interactions [25]. It is worth mentioning there was a small contribution from oxidized sulfur species, in agreement with the analysis by XPS of the S 2p region (shown later).
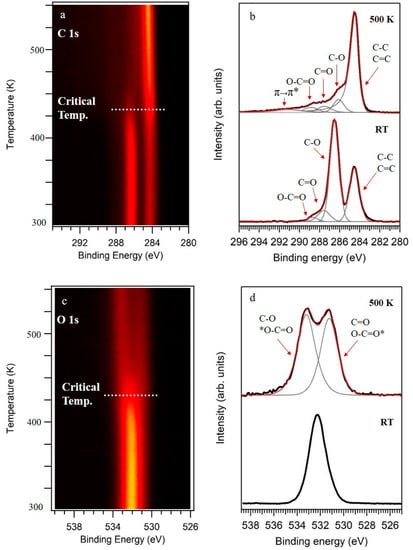
Figure 1.
X-ray photoelectron spectroscopy (XPS) spectra of graphene oxide (GO) obtained at RT and their evolution upon annealing. (a) C 1s spectra as a function of the temperature of the sample. (b) High-resolution C 1s obtained at RT and 500 K. (c) O 1s spectra as a function of the temperature of the sample. (d) High-resolution O 1s obtained at RT and 500 K. In (b,d), the intensities of the spectra were normalized.
On the other hand, a completely different scenario appeared after annealing the samples at 500 K, a temperature higher than the critical temperature (430 K). C 1s and O 1s core levels are shown in Figure 1b,d (top spectra), respectively. We notice that the spectra resulting from the samples reduced at low vacuum in a chemical vapor deposition system were equivalent to the ones annealed under UHV conditions (data not shown). C 1s showed a main peak followed by a structured tail at higher BEs. The best fit was obtained by using an asymmetric function for the main peak, C sp2 at 284.5 eV, typical of graphene-like conductive carbon frameworks, and three extra components that are associated to divers oxidized groups. These three components were centered at 286.1 eV, 287.5 eV, and 288.8 eV, and ascribed to C–O, C=O, O=C–O, respectively [7,22,24]. Moreover, an extra component at 291.1 eV was included in the fitting and ascribed to a π−π* transition [26]. Complementary, the O 1s core level was fitted by two components at BEs of 531.2 eV and 533.2 eV and assigned to C-O and C=O [25].
Therefore, by comparing XPS spectra before and after annealing, it is clear that GO samples were strongly reduced. The intensity of the components ascribed to oxidized carbon greatly diminished, while the components ascribed to C–C/C=C increased. Furthermore, the C/O atomic ratio of 0.76 obtained for GO strongly increased to 5.85 for rGO. These XPS experiments indicated that the loss of oxygen atoms from C–O were the main route activated by the under vacuum thermal reduction of graphene oxide.
On the other hand, besides C and O, minor amounts of S and N were detected by XPS in the GO films. The atomic percentage of these elements obtained by XPS were around 2.5 at. % and 0.8 at. %, respectively. Figure 2a shows a series of high-resolution XPS spectra of sulfur region at different annealing temperatures. S 2p spectra acquired at RT (Figure 2a, top spectra) showed a peak with a S 2p3/2 component at 168.3 eV, indicating the presence of oxidized sulfur species (SOx) in GO [27]. The absence of signal from any metal in the survey spectra point to organic sulfur species, in good agreement with Eigler et al. [28], who investigated the presence of organic sulfates in GO. This species readily left the sample by annealing, and at 500 K the sulfur signal almost disappeared, although a small peak was detected at lower BE (163.6 eV, lower spectra), compatible with C–S species [27]. This fact was confirmed by analyzing a sample annealed in a CVD furnace at 800 K, where only this small S peak at 163.6 eV appeared, indicating that only a very small percentage of the original oxidized sulfur was reduced, while most of it was removed from the sample by the annealing.
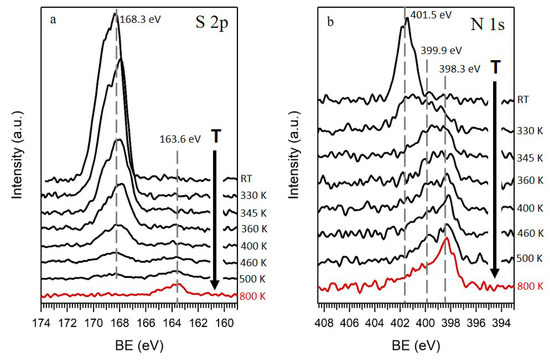
Figure 2.
(a) S 2p and (b) N 1s XPS spectra of GO obtained at RT and their evolution upon annealing at different temperatures, up to 500 K, under UHV conditions (black) and in a CVD system at 800 K (red).
The last element detected in GO films was N. Figure 2b shows the evolution of N 1s XPS spectra as a function of the temperature. At RT (Figure 2b, top spectra), a single symmetric peak appeared at 401.5 eV, an energy ascribed to positively charged nitrogen [29]. As the temperature increased, the peak widened to lower BEs (399.9 eV), and when approaching 500 K became an asymmetric peak with its highest intensity at 398.3 eV, declining towards higher BE. This shape denoted nitrogen in different chemical environments, commonly assigned in the literature to pyridinic (398.3 eV), pyrrolic (399.9 eV), and quaternary (401.5 eV) nitrogen, in increasing order of BEs, as it is marked by lines in Figure 2b [26,30]. The low decrease of the area of the N peak with the temperature indicated that most of the nitrogen remained in the rGO films, integrated in the carbon structure, unlike sulfur, which was almost completely removed upon heating.
Further characterization was done by Raman spectroscopy, a well-established technique for characterizing graphene samples. Figure 3 shows the spectra obtained at three different points of the sample, together with the optical images of the GO (Figure 3a) and rGO (Figure 3b) films. The red, blue, and black spectra were acquired at the respective points indicated in the optical images. In the case of GO, Raman spectra showed two main peaks ascribed to the G-band at 1600 cm−1 (FWHM = 78 cm−1) and D-band at 1352 cm−1 (FWHM = 103 cm−1), values which were in good agreement with previous reported values for GO [31,32]. The G-band was related with the E2g phonon of graphene, while the D-band was related to their defects. Moreover, and extra feature appeared at wave numbers ranging from 2500 cm−1 to 3250 cm−1. This feature presented a modulated bump shape, as had been previously observed [31] and ascribed to the 2D-band. After the samples were heated, Raman spectra of rGO were quite similar to them. The G-band appeared at 1595 cm−1 (FWHM = 100 cm−1), while the D-band was centered at 1350 cm−1 (FWHM = 135 cm−1). The most significant difference observed by Raman was in the background of the spectra. In the case of rGO (Figure 3b), the Raman spectra did not depend on the measuring position, while in the case of GO (Figure 3a), the background strongly depended on the acquiring position. Accordingly, the optical image of GO showed three different regions characterized by its green, yellow, and red colors (see photo of Figure 3a), and consequently Raman spectra were acquired at these three different positions. This inhomogeneity through the samples disappeared by the annealing; both the optical image as well as the Raman spectra (Figure 3b) obtained at different positions indicated a much more homogeneous sample.
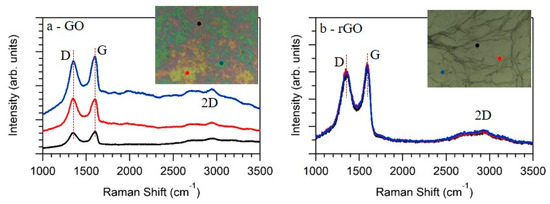
Figure 3.
As measured Raman spectra obtained at different points of the GO (a) and rGO (b) films. The insets show the optical images of the samples, while the red, blue, and black dots indicate the position in which the respective Raman spectra were acquired.
Complementary to the XPS and Raman characterization, the topography of the samples was characterized by SEM and AFM. Figure 4a–d show representative SEM images of GO and rGO films, respectively.
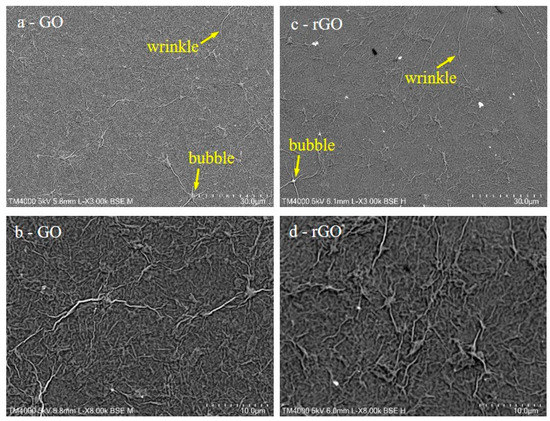
Figure 4.
SEM images of GO (a,b) and reduced graphene oxide (rGO) (c,d) films.
SEM images show that GO as well as rGO films completely covered the SiO2 templates. Moreover, several large wrinkles and bubbles were detected all around the sample, as in previous works of GO films prepared by other methods [23,33,34]. Furthermore, the topology of the samples did not change upon heating, and thus the main change produced in the samples was their chemical reduction, as indicated by XPS.
Besides SEM characterization, AFM is a better technique to characterize the topography of the samples at a lower scale. Figure 5 shows two representative AFM images obtained for GO (Figure 5a) and rGO (Figure 5b) films. As in the case of SEM, AFM indicated that both samples completely covered the SiO2 template. Both GO and rGO accommodated on the surface by forming wrinkles and bubbles. The most significant change detected by AFM upon heating was a reduction of the roughness. As an example, the height profiles showed in Figure 5c clearly indicated that the roughness of rGO was significantly lower than the roughness of GO, as it was recently reported for GO and rGO obtained by other methods [35]. In this figure, the black (GO) and red (rGO) height profiles were obtained from the lines plotted in Figure 5a,b, respectively. Furthermore, the root mean square average (RMS) of the roughness obtained through full AFM images is a better parameter for characterizing the roughness of the surfaces. In the present case, the RMS of the roughness obtained from several AFM images of GO films was 46 nm, while in the case of rGO it diminished to 38 nm. As it was recently reported, the diminution of the roughness upon reduction of GO is ascribed to the elimination of the oxygenated functional groups of GO [35] and adsorbed water, in good agreement with the XPS results discussed in Figure 1.
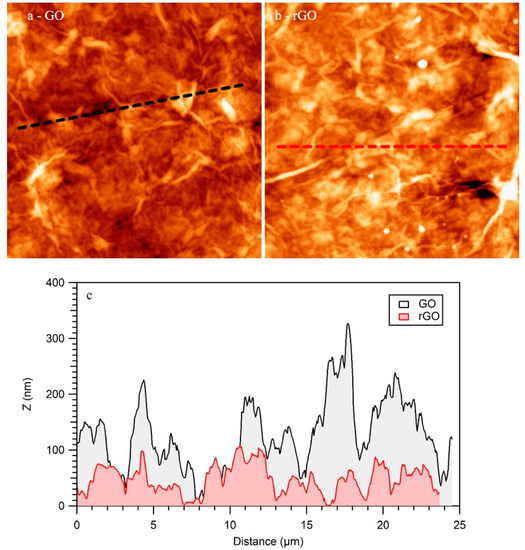
Figure 5.
Atomic force microscoopies (AFM) images of GO (a) and rGO (b) films. (25 × 25) μm2. (c) Height profiles indicated in (a-black) and (b-red).
4. Conclusions
In summary, GO deposited by drop coating completely covered the surface of SiO2 templates and formed a film. Besides carbon and oxygen, small quantities of sulfur and nitrogen were detected by XPS. Upon heating at temperatures higher than 430 K, GO drastically reduced to rGO. XPS spectra of rGO showed that upon heating, mainly functional groups related to C–O bonds such as epoxy, alcohol, or ether leaved the sample. Moreover, unlike chemical procedures for reducing GO, in the case of our method almost all the sulfur atoms desorbed, while most of the nitrogen atoms remained in the sample and changed their chemical environment. Furthermore, the annealing also increased the homogeneity of the films. Thus, rGO films were more homogeneous and less rough than GO films. The results showed in this work indicated that the thermal treatment under vacuum conditions is a quite good method for reducing graphene oxide without using other reducing chemicals.
Author Contributions
Conceptualization, M.J.H. and G.O.-I; Data curation, M.J.H., I.B. and G.O.-I.; Formal analysis, M.J.H., I.B., and G.O.-I.; Funding acquisition, I.B., V.N., and G.O.-I.; Investigation, M.J.H., D.M., I.B., V.N., and G.O.-I.; Methodology, M.J.H. and G.O.-I.; Project administration, M.J.H. and G.O.-I.; Resources, I.B., V.N. and G.O.-I.; Software, M.J.H., I.B., and G.O.-I.; Supervision, M.J.H. and G.O.-I.; Validation, M.J.H. and G.O.-I.; Visualization, M.J.H., D.M., I.B., V.N., and G.O.-I.; Writing—original draft, M.J.H. and G.O.-I.; Writing—review and editing, M.J.H., D.M., I.B., V.N., and G.O.-I. All authors have read and agreed to the published version of the manuscript.
Funding
This work has received support of the Portuguese Foundation for Science and Technology through TEMA strategic development project with reference UID/EMS/00481/2013 and TEMA Research Infrastructures project with reference CENTRO-01-0145-FEDER-022083, financed by national funds through the FCT/MEC and when appropriate co-financed by FEDER under the PT2020 Partnership Agreement”. GO-I and MJH thank FCT for their respective contracts (IF/01054/2015 and BI/UI66/6867/2017). IB wishes to acknowledge the Portuguese Foundation for Science and Technology (FCT) for its financial support: IF/00582/2015. DM also acknowledges the support of the project SGH—Smart Green Homes—POCI-01-0247-FEDER-07678, financed by Portugal 2020 through European Regional Development Fund (ERDF) in the frame of Operational Competitiveness and Internationalization Programmer (POCI).
Conflicts of Interest
The authors declare no conflict of interest. The funders had no role in the design of the study; in the collection, analyses, or interpretation of data; in the writing of the manuscript; or in the decision to publish the results.
References
- Donarelli, M.; Ottaviano, L. 2D materials for gas sensing applications: A review on graphene oxide, MoS2, WS2 and Phosphorene. Sensors 2018, 18, 3638. [Google Scholar] [CrossRef]
- Li, M.-Y.; Chen, C.-H.; Shi, Y.; Li, L.-J. Heterostructures based on two-dimensional layered materials and their potential applications. Mater. Today 2016, 19, 322–335. [Google Scholar] [CrossRef]
- Zaaba, N.I.; Foo, K.L.; Hashim, U.; Tan, S.J.; Liu, W.-W.; Voon, C.H. Synthesis of graphene oxide using modified hummers method: Solvent influence. Procedia Eng. 2017, 184, 469–477. [Google Scholar] [CrossRef]
- Yu, H.; Zhang, B.; Bulin, C.; Li, R.; Xing, R. High-efficient synthesis of graphene oxide based on improved hummers method. Sci. Rep. 2016, 6, 36143. [Google Scholar] [CrossRef] [PubMed]
- Marcano, D.C.; Kosynkin, D.V.; Berlin, J.M.; Sinitskii, A.; Sun, Z.; Slesarev, A.; Alemany, L.B.; Lu, W.; Tour, J.M. Improved synthesis of graphene oxide. ACS Nano 2010, 4, 4806–4814. [Google Scholar] [CrossRef] [PubMed]
- Ghorbani, M.; Abdizadeh, H.; Golobostanfard, M.R. Reduction of graphene oxide via modified hydrothermal method. Procedia Mater. Sci. 2015, 11, 326–330. [Google Scholar] [CrossRef]
- Gonçalves, G.; Borme, J.; Bdkin, I.; González-Mayorga, A.; Irurueta, G.; Nogueira, H.I.S.; Serrano, M.C.; Alpuim, P.; Marques, P.A.A.P. Reductive nanometric patterning of graphene oxide paper using electron beam lithography. Carbon 2018, 129, 63–75. [Google Scholar] [CrossRef]
- Otero, G.; González, C.; Pinardi, A.L.; Merino, P.; Gardonio, S.; Lizzit, S.; Blanco-Rey, M.; Van de Ruit, K.; Flipse, C.F.J.; Méndez, J.; et al. Ordered vacancy network induced by the growth of epitaxial graphene on Pt(111). Phys. Rev. Lett. 2010, 105, 216102. [Google Scholar] [CrossRef]
- Merino, P.; Švec, M.; Pinardi, A.L.; Otero, G.; Martín-Gago, J.A. Strain-driven moiré superstructures of epitaxial graphene on transition metal surfaces. ACS Nano 2011, 5, 5627–5634. [Google Scholar] [CrossRef]
- Martínez, J.I.; Merino, P.; Pinardi, A.L.; Gonzalo, O.-I.; López, M.F.; Méndez, J.; Martín-Gago, J.A. Role of the pinning points in epitaxial graphene moiré superstructures on the Pt(111) Surface. Sci. Rep. 2016, 6, 20354. [Google Scholar] [CrossRef]
- Palacio, I.; Otero-Irurueta, G.; Alonso, C.; Martínez, J.I.; López-Elvira, E.; Muñoz-Ochando, I.; Salavagione, H.J.; López, M.F.; García-Hernández, M.; Méndez, J.; et al. Chemistry below graphene: Decoupling epitaxial graphene from metals by potential-controlled electrochemical oxidation. Carbon 2018, 129, 837–846. [Google Scholar] [CrossRef] [PubMed]
- Tan, Y.; Song, Y.; Zheng, Q. Hydrogen bonding-driven rheological modulation of chemically reduced graphene oxide/poly(vinyl alcohol) suspensions and its application in electrospinning. Nanoscale 2012, 4, 6997. [Google Scholar] [CrossRef] [PubMed]
- Dikin, D.A.; Stankovich, S.; Zimney, E.J.; Piner, R.D.; Dommett, G.H.B.; Evmenenko, G.; Nguyen, S.T.; Ruoff, R.S. Preparation and characterization of graphene oxide paper. Nature 2007, 448, 457–460. [Google Scholar] [CrossRef] [PubMed]
- Park, S.; Lee, K.-S.; Bozoklu, G.; Cai, W.; Nguyen, S.T.; Ruoff, R.S. Graphene oxide papers modified by divalent ions—enhancing mechanical properties via chemical cross-linking. ACS Nano 2008, 2, 572–578. [Google Scholar] [CrossRef]
- Compton, O.C.; Cranford, S.W.; Putz, K.W.; An, Z.; Brinson, L.C.; Buehler, M.J.; Nguyen, S.T. Tuning the mechanical properties of graphene oxide paper and its associated polymer nanocomposites by controlling cooperative intersheet hydrogen bonding. ACS Nano 2012, 6, 2008–2019. [Google Scholar] [CrossRef]
- Liu, S.; Hu, K.; Cerruti, M.; Barthelat, F. Ultra-stiff graphene oxide paper prepared by directed-flow vacuum filtration. Carbon 2019. In press, corrected Proof.. [Google Scholar] [CrossRef]
- Park, S.; An, J.; Potts, J.R.; Velamakanni, A.; Murali, S.; Ruoff, R.S. Hydrazine-reduction of graphite- and graphene oxide. Carbon 2011, 49, 3019–3023. [Google Scholar] [CrossRef]
- Shin, H.-J.; Kim, K.K.; Benayad, A.; Yoon, S.-M.; Park, H.K.; Jung, I.-S.; Jin, M.H.; Jeong, H.-K.; Kim, J.M.; Choi, J.-Y.; et al. efficient reduction of graphite oxide by sodium borohydride and its effect on electrical conductance. Adv. Funct. Mater. 2009, 19, 1987–1992. [Google Scholar] [CrossRef]
- Rath, T.; Kundu, P.P. Reduced graphene oxide paper based nanocomposite materials for flexible supercapacitors. RSC Adv. 2015, 5, 26666–26674. [Google Scholar] [CrossRef]
- Gao, J.; Liu, C.; Miao, L.; Wang, X.; Chen, Y. Free-standing reduced graphene oxide paper with high electrical conductivity. J. Electron. Mater. 2016, 45, 1290–1295. [Google Scholar] [CrossRef]
- Gómez-Navarro, C.; Meyer, J.C.; Sundaram, R.S.; Chuvilin, A.; Kurasch, S.; Burghard, M.; Kern, K.; Kaiser, U. Atomic structure of reduced graphene oxide. Nano Lett. 2010, 10, 1144–1148. [Google Scholar] [CrossRef] [PubMed]
- Lipatov, A.; Guinel, M.J.-F.; Muratov, D.S.; Vanyushin, V.O.; Wilson, P.M.; Kolmakov, A.; Sinitskii, A. Low-temperature thermal reduction of graphene oxide: In situ correlative structural, thermal desorption, and electrical transport measurements. Appl. Phys. Lett. 2018, 112, 053103. [Google Scholar] [CrossRef]
- Tegou, E.; Pseiropoulos, G.; Filippidou, M.K.; Chatzandroulis, S. Low-temperature thermal reduction of graphene oxide films in ambient atmosphere: Infra-red spectroscopic studies and gas sensing applications. Microelectron. Eng. 2016, 159, 146–150. [Google Scholar] [CrossRef]
- Yang, D.; Velamakanni, A.; Bozoklu, G.; Park, S.; Stoller, M.; Piner, R.D.; Stankovich, S.; Jung, I.; Field, D.A.; Ventrice, C.A.; et al. Chemical analysis of graphene oxide films after heat and chemical treatments by X-ray photoelectron and Micro-Raman spectroscopy. Carbon 2009, 47, 145–152. [Google Scholar] [CrossRef]
- Xing, Z.; Ju, Z.; Zhao, Y.; Wan, J.; Zhu, Y.; Qiang, Y.; Qian, Y. One-pot hydrothermal synthesis of Nitrogen-doped graphene as high-performance anode materials for lithium ion batteries. Sci. Rep. 2016, 6, 26146. [Google Scholar] [CrossRef]
- Kumar, N.A.; Nolan, H.; McEvoy, N.; Rezvani, E.; Doyle, R.L.; Lyons, M.E.G.; Duesberg, G.S. Plasma-assisted simultaneous reduction and nitrogen doping of graphene oxide nanosheets. J. Mater. Chem. A 2013, 1, 4431. [Google Scholar] [CrossRef]
- Kim, S.S.; Britcher, L.; Kumar, S.; Griesser, H.J. XPS study of sulfur and phosphorus compounds with different oxidation states. Sains Malays. 2018, 47, 1913–1922. [Google Scholar] [CrossRef]
- Eigler, S.; Dotzer, C.; Hof, F.; Bauer, W.; Hirsch, A. Sulfur species in graphene oxide. Chem. Eur. J. 2013, 19, 9490–9496. [Google Scholar] [CrossRef]
- Girão, A.F.; Gonçalves, G.; Bhangra, K.S.; Phillips, J.B.; Knowles, J.; Irurueta, G.; Singh, M.K.; Bdkin, I.; Completo, A.; Marques, P.A.A.P. Electrostatic self-assembled graphene oxide-collagen scaffolds towards a three-dimensional microenvironment for biomimetic applications. RSC Adv. 2016, 6, 49039–49051. [Google Scholar] [CrossRef]
- Quan, B.; Yu, S.-H.; Chung, D.Y.; Jin, A.; Park, J.H.; Sung, Y.-E.; Piao, Y. Single source precursor-based solvothermal synthesis of heteroatom-doped graphene and its energy storage and conversion applications. Sci. Rep. 2015, 4, 5639. [Google Scholar] [CrossRef]
- Kaniyoor, A.; Ramaprabhu, S. A Raman spectroscopic investigation of graphite oxide derived graphene. AIP Adv. 2012, 2, 032183. [Google Scholar] [CrossRef]
- Johra, F.T.; Lee, J.; Jung, W. Facile and safe graphene preparation on solution based platform. J. Ind. Eng. Chem. 2014, 20, 2883–2887. [Google Scholar] [CrossRef]
- Saleem, H.; Haneef, M.; Abbasi, H.Y. Synthesis route of reduced graphene oxide via thermal reduction of chemically exfoliated graphene oxide. Mater. Chem. Phys. 2018, 204, 1–7. [Google Scholar] [CrossRef]
- Zhang, B.; Li, L.; Wang, Z.; Xie, S.; Zhang, Y.; Shen, Y.; Yu, M.; Deng, B.; Huang, Q.; Fan, C.; et al. Radiation induced reduction: An effective and clean route to synthesize functionalized graphene. J. Mater. Chem. 2012, 22, 7775. [Google Scholar] [CrossRef]
- Fakharan, Z.; Naji, L.; Madanipour, K. Surface roughness regulation of reduced-graphene oxide/iodine – Based electrodes and their application in polymer solar cells. J. Colloid Interface Sci. 2019, 540, 272–284. [Google Scholar] [CrossRef] [PubMed]


© 2020 by the authors. Licensee MDPI, Basel, Switzerland. This article is an open access article distributed under the terms and conditions of the Creative Commons Attribution (CC BY) license (http://creativecommons.org/licenses/by/4.0/).