1. Introduction
Generally, highly efficient materials for photocathode thin film applied in solar water splitting cells are intensively searched. Key factors are low cost, high photoactivity and long-term stability. These materials should have suitable value of bang gap
Eg compatible with the solar spectrum, high absorption coefficient, p-type conductivity and good transport properties for photogenerated holes and electrons. One suitable candidate for efficient photocathode is Cu
2O with direct band gap
Eg = 2 eV [
1] and p-type conductivity. These Cu
2O films were used as effective photocathode in photoelectrochemical (PEC) cells but the stability problem was solved with additional layers ZnO:Al and TiO
2 made by atomic layer deposition (ALD) in order to improve stability during PEC measurement [
2]. Because this approach is technologically complicated further approaches was tested. Some progress was achieved for films CuO. Cupric oxide CuO is p-type semiconductor material with band gap
Eg = 1.2–2.5 eV and high absorption coefficient. CuO with increased stability was applied as photocathode and presented in reference [
3]. In this work the improved stability was achieved with oxygen excess contained in films and with deposition of Au–Pd nanostructures on the surface of CuO films. Further approach for improvement PEC performance and stability of these photocathodes is to deposit CuFeO
2 with delafossite structure. This material has suitable band gap
Eg = 1.47 eV and good stability in alkaline electrolytes which is used in PEC cells [
4,
5]. One of the problems with delafossite is the poor photoinduced electron–hole separation and charge collection [
6]. Further improvement of PEC performance of this material is to deposit a CuFeO
2/CuO composite structure with heterojunction between those two phases helping to improve PEC performance as photocathodes [
7].
Recently, n-type semiconducting films applicable as photoanodes or suitable for photocatalytic application were deposited by the reactive DC, DC pulsed or RF magnetron sputtering as TiO
2 [
8], Fe
2O
3 [
9,
10], TaON [
11], WO
3 [
12,
13]. As photocathodes p-type semiconductor Cu
2O/CuO thin films structures were prepared by reactive sputtering [
14,
15,
16]. Further photocathodes thin films based on CuFeO
2 with p-type conductivity were prepared by RF sputtering [
17].
Recently, reactive high-power impulse magnetron sputtering (r-HiPIMS) has become promising technology for various material preparation [
18,
19,
20,
21,
22,
23,
24,
25]. The magnetron discharge is generated in short pulses (10–100 μs) with low frequency of pulsing (100 Hz–1 kHz). The duty factor is very low in r-HiPIMS, and although the high power is applied in the discharge plasma in the active part of the pulse, the average applied power can be low with similar values like in classical DC magnetron sputtering [
24]. This method relies on the intensive ionization of sputtered and reactively sputtered particles in high current discharge pulse [
26,
27,
28], and the growing films is built from ions rather than from neutrals.
In order to extend possible conditions in r-HiPIMS plasma, a hybrid plasma source based on the combination of r-HiPIMS with RF inductively coupled plasma working in electron cyclotron wave resonance (ECWR) was developed [
29,
30,
31] and tested for the deposition of TiO
2 textured rutile [
32] and Fe
2O
3 with a hematite phase [
33]. The possibility to operate the r-HiPIMS magnetron plasma at very low-pressure
p < 0.05 Pa, further increase of ionization of sputtered particles, higher electron temperature
Te during the active part of discharge pulse are great benefits of this hybrid r-HiPIMS + ECWR deposition system [
31].
In this paper, the study of hybrid r-HiPIMS + ECWR plasma system and pure reactive r-HiPIMS with two magnetrons cathodes is presented together with RF probe plasma diagnostics during the deposition of copper iron oxide thin films. These films were investigated as photocathodes in a PEC solar water splitting system. The aim of this work was to deposit CuFexOy films with different atomic ratio of Cu and Fe atoms contained in the films by these two reactive sputtering methods. The aim was to study this ternary oxide for different molar ratio Cu and Fe contained in the film and to find deposition conditions which lead to growth of films with maximum amount of delafossite phase CuFeO2.
2. Experimental
Copper iron oxide thin films were deposited on fluorine doped tin oxide (FTO) conductive glass substrates. This is the glass substrate with 500 nm thick SnO
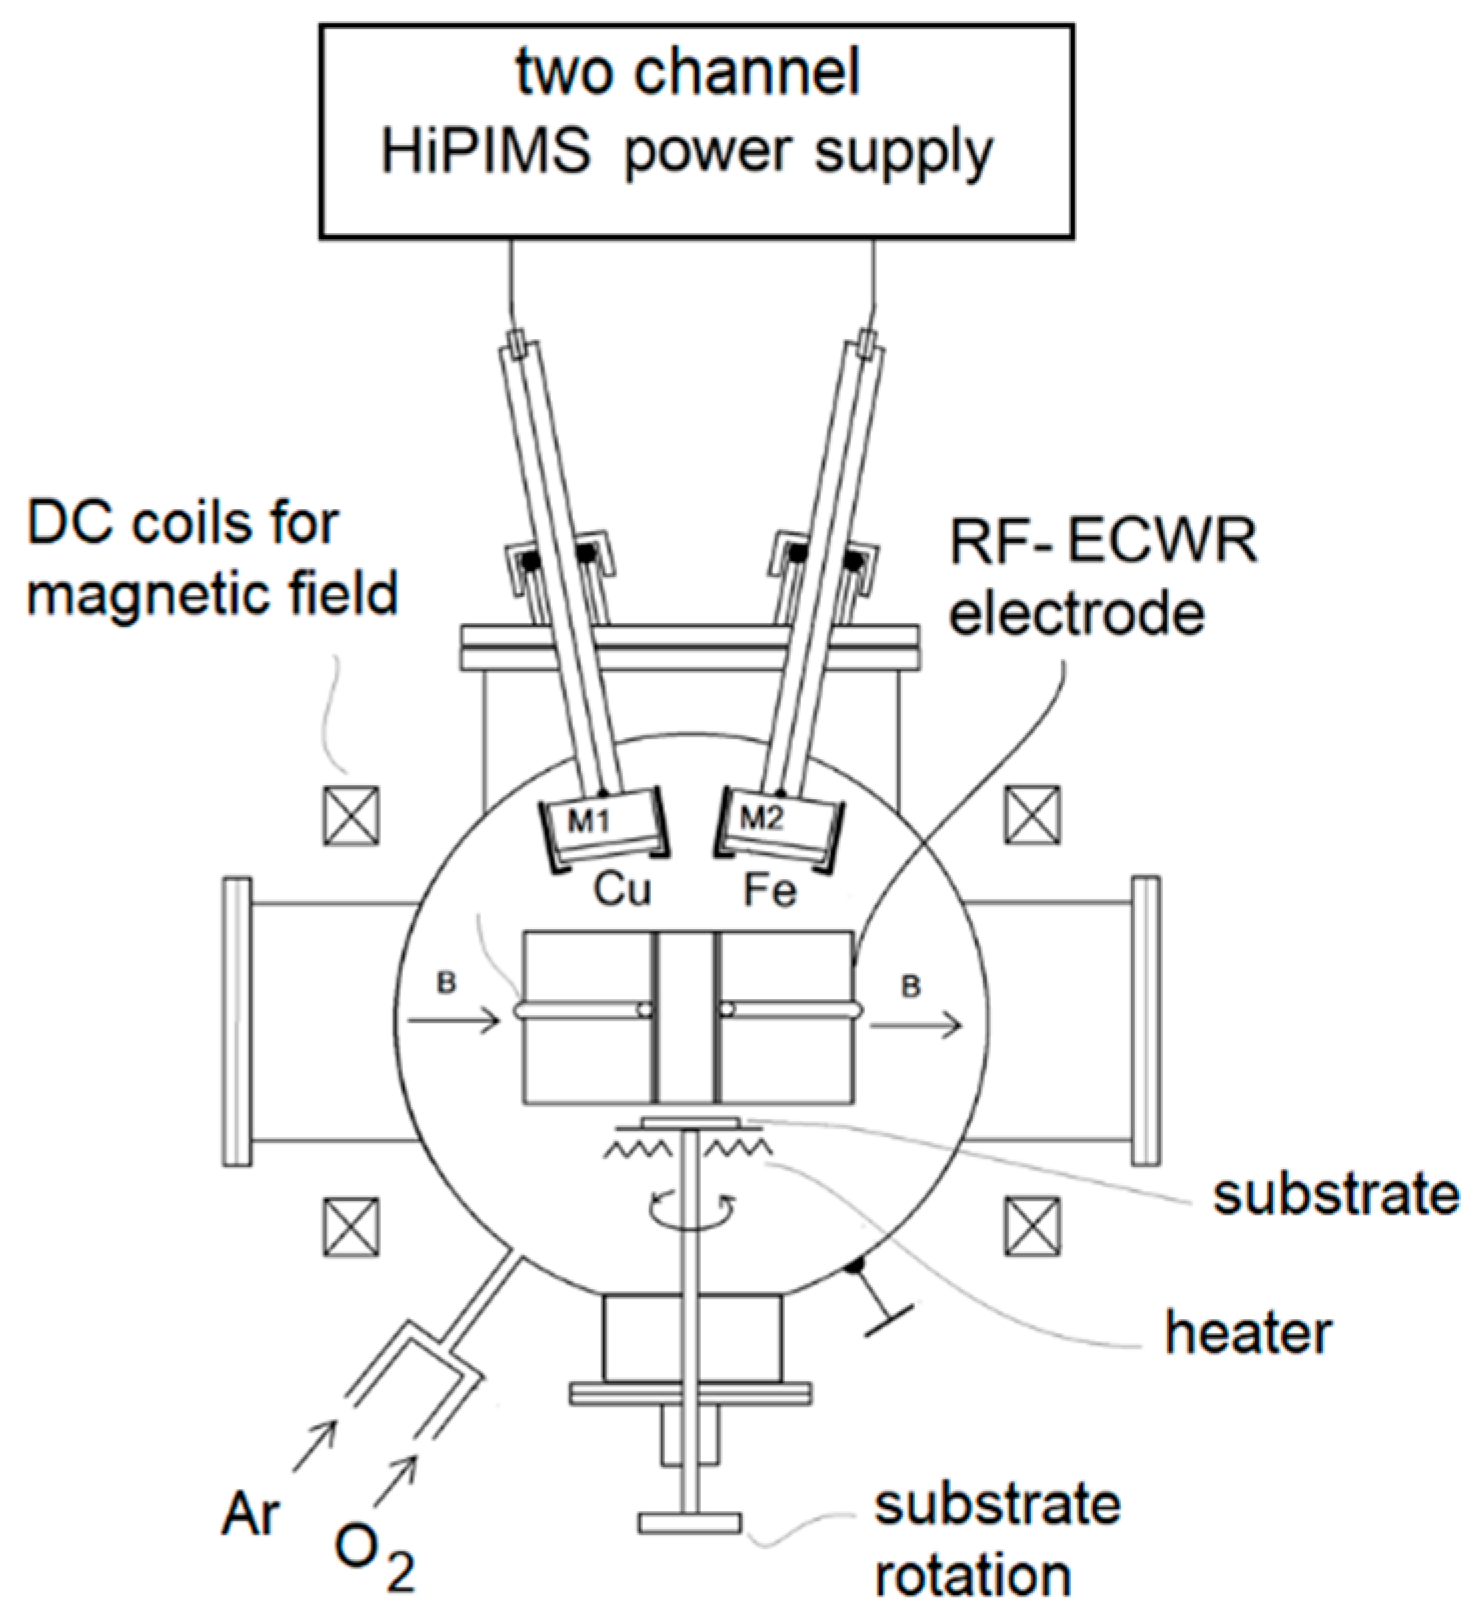
2:F conductive layer with the sheet resistance 15 Ω/□. The hybrid r-HiPIMS + ECWR deposition system can be seen in
Figure 1. The reactor stainless steel chamber was continuously pumped by the turbomolecular (500 L s
−1) as a secondary pump and by the rotary vane pump (25 m
3·h
−1) as primary pump on the base pressure
pb = 1 × 10
−4 Pa. Argon and oxygen gas flow
QAr and
Qo₂ were fed into the reactor through the gas flow controller and the pressure
p in the chamber was controlled during the deposition by the control gate valve and was held for all the deposition conditions on the value
p = 1 Pa. Argon gas flow was held constant on the value
QAr = 26 sccm for all the deposition conditions. The gas flow of oxygen for particular conditions is shown in
Table 1. The system was equipped with two magnetrons with circular planar cathodes with diameter 50 mm. The first cathode was made of pure iron (99.9%) with thickness 1.5 mm and the second one was made of pure copper (99.9%) with thickness 6 mm. The substrate was electrically floating and was placed 150 mm from the surface of both targets. The substrate was heated during the deposition with controlled temperature up to 500 °C. The temperature of the substrate at particular deposition conditions are in
Table 1. The substrate was rotating during the process with rotation speed 1 rpm. The water-cooled RF ICP coil was placed between magnetrons and the substrate (
Figure 1). The diameter of the ICP coil was 200 mm, and the length was 120 mm. The power fed to this ICP coil was
PECWR, and the values for particular conditions are in
Table 1. The DC magnetic field was set to take the system as close as to ECWR resonance and the magnetic field was around
B ≈ 1.7 mT. Deposition time was always 60 min for all the deposited samples.
Typical r-HiPIMS and r-HiPIMS + ECWR discharge waveforms are synchronized and can be seen in
Figure 2 and
Figure 3, respectively. The length of pulses, their relative positions, and their pulsing frequencies were held constant for all investigated conditions. The “ON” time on the iron cathode was
TONFe = 100 μs, and the “ON” time on the copper cathode was
TONCu = 20 μs for samples 5x–10x (
Table 1).
TONCu = 30 μs for the sample 4x, 3x,
TONCu = 100 μs for the sample 2x and
TONCu = 50 μs for the sample 1x. The pulsing frequency on both cathodes was always
Tp = 100 Hz.
Other discharge conditions like average iron cathode discharge current
IFeav, and average copper cathode current
ICuav, copper or iron cathode voltage
UFe, and copper cathode voltage
Ucu are mentioned in
Table 1.
Transmission spectra of selected deposited films on FTO glass were measured by spectrometer (Carry 100, Varian, Palo Alto, CA, USA) with integrating sphere in the spectral range 200–900 nm.
The thickness of the films was determined by profilometry measurements (Alpha-Step 500 KLA Tencor MDL. no. ASIQ, San Jose, CA, USA). The deposited films were analyzed by X-ray diffraction (XRD). XRD data were measured at room temperature on a Bruker AXS D8 powder diffractometer (Billerica, MA, USA) in a Bragg-Brentano geometry using a CoKα radiation wavelength (λ = 1.7903 Å, U = 34 kV, I = 30 mA). Chemical composition regarding molar ratio of Cu/Fe was measured by XRF. ED-XRF spectrometer Niton XL5 (Thermo Scientific, Waltham, MA, USA) equipped with Ag anode X-Ray Tube (6–50 kV, 0–500 μA, max 5 W) was used. Measure area diameter was 3 mm. Niton Connect PC software (Version 1.0) was used for evaluation of the measured data.
In order to get a good and high-quality crystalline structure, the films were annealed after the deposition in air, argon or in high vacuum. A long annealing for 6 h in argon atmosphere on temperature 600 °C was already used for these CuFeO
2 delafossite films prepared by the RF reactive co-sputtering, as reported in reference [
17]. In our experiments, the annealing was done for selected samples in the air atmosphere. Temperature increase rate 10 °C/min to the temperature 650 °C with 3 h retention, and slow cooling (1 °C/min) was used. These conditions were found to be optimal by several preliminary experiments. Also, some samples received annealing in the high vacuum or in the argon directly in the plasma reactor after the deposition. A temperature of 500 or 650 °C and prolonged time of 6 h were used to provide enough time for crystallization process and formation of new crystalline phases in the material under high vacuum conditions.
Photoelectrochemical (PEC) measurements were done by the use of potentiostat (VoltaLAB PGZ100, RadiometerAnalytical SAS, Villeurbanne, France), connected to the three-electrode optical cell filled with 0.1 M Na2SO4 (pH = 5.8) electrolyte. All experiments were done under an air atmosphere. The sample, with irradiated area set to 1 cm2 by Teflon tape, was connected as working electrode. Platinum sheet was used as counter electrode and Ag/AgCl in 3 M KCl EAg/AgCl = 0.207 V) as reference electrode. All potentials reported in our text are related to the mentioned reference electrode. Linear sweep voltammetry (+200 to −600 mV, sweep rate 10 mV/s) was done under the pulsed modulated light illumination with 5 s intervals of light and dark. The light was modulated by an electronic controlled mechanical shutter. Chronoamperometry (at −400 mV) was done under continuous illumination after short 30 s dark conditioning. A solar simulator (Newport, Irvine, CA, USA), emitting artificial AM1.5G solar spectrum with the intensity 100 mW·cm−2, was used as the light source.
Plasma Diagnostics by RF Planar Probe
Plasma diagnostics at conditions of reactive r-HiPIMS and r-HiPIMS + ECWR depositions were done by a so-called RF planar probe, which is described in detail in reference [
34]. This method has origin in Sobolewski method presented in reference [
35,
36,
37]. The detailed experimental description together with
Figures S1–S4 are in the Supplementary Materials. The plasma diagnostics with the RF planar probe is presented in this paper just for two selected types of plasma generation. The first measured type is the pure reactive r-HiPIMS without applied RF power to ECWR electrode
PRF = 0 W. The particular conditions for this first type were:
IFeav = 600 mA,
ICuav =38 mA,
QO₂ =2 sccm. The second measured type is the hybrid reactive r-HiPIMS + ECWR with applied RF power to ECWR electrode
PRF = 180 W. The conditions for this second type were:
IFeav = 550 mA,
ICuav = 38 mA,
QO₂ = 2 sccm. For both these measured types (r-HiPIMS, r-HiPIMS + ECWR) the other parameters were the same, as in case of all deposited samples presented in this paper.
3. Results and Discussion
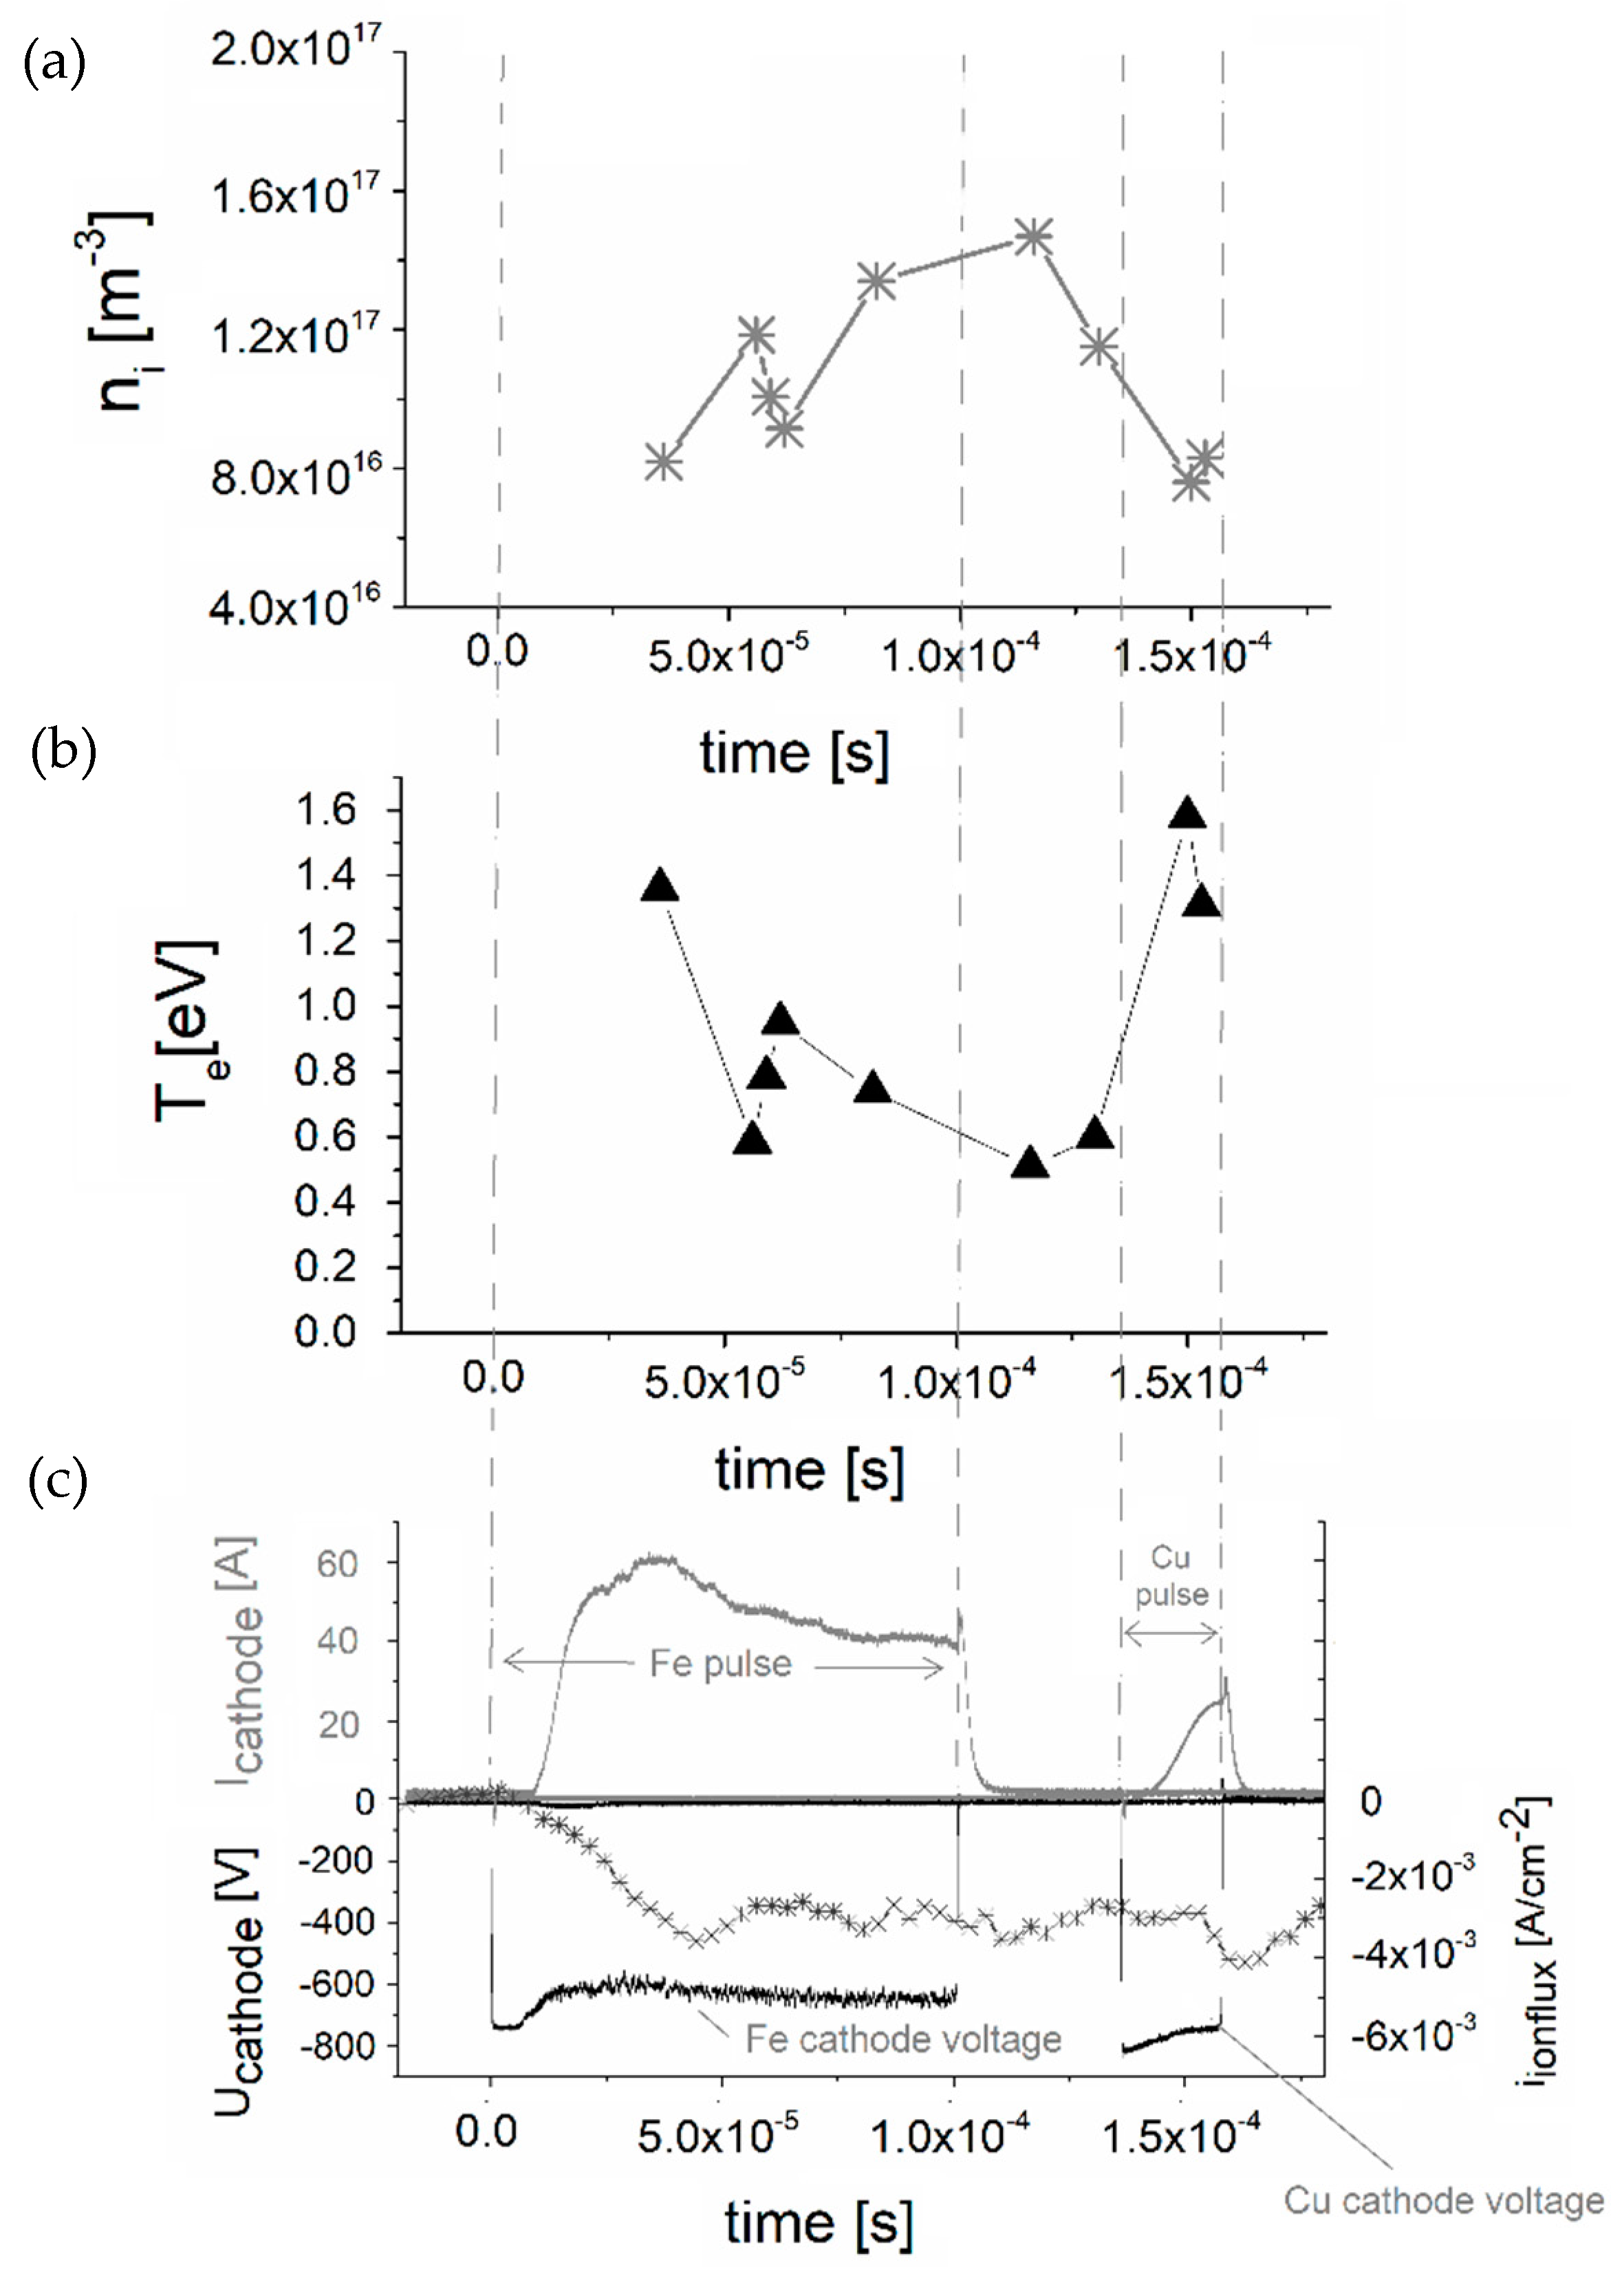
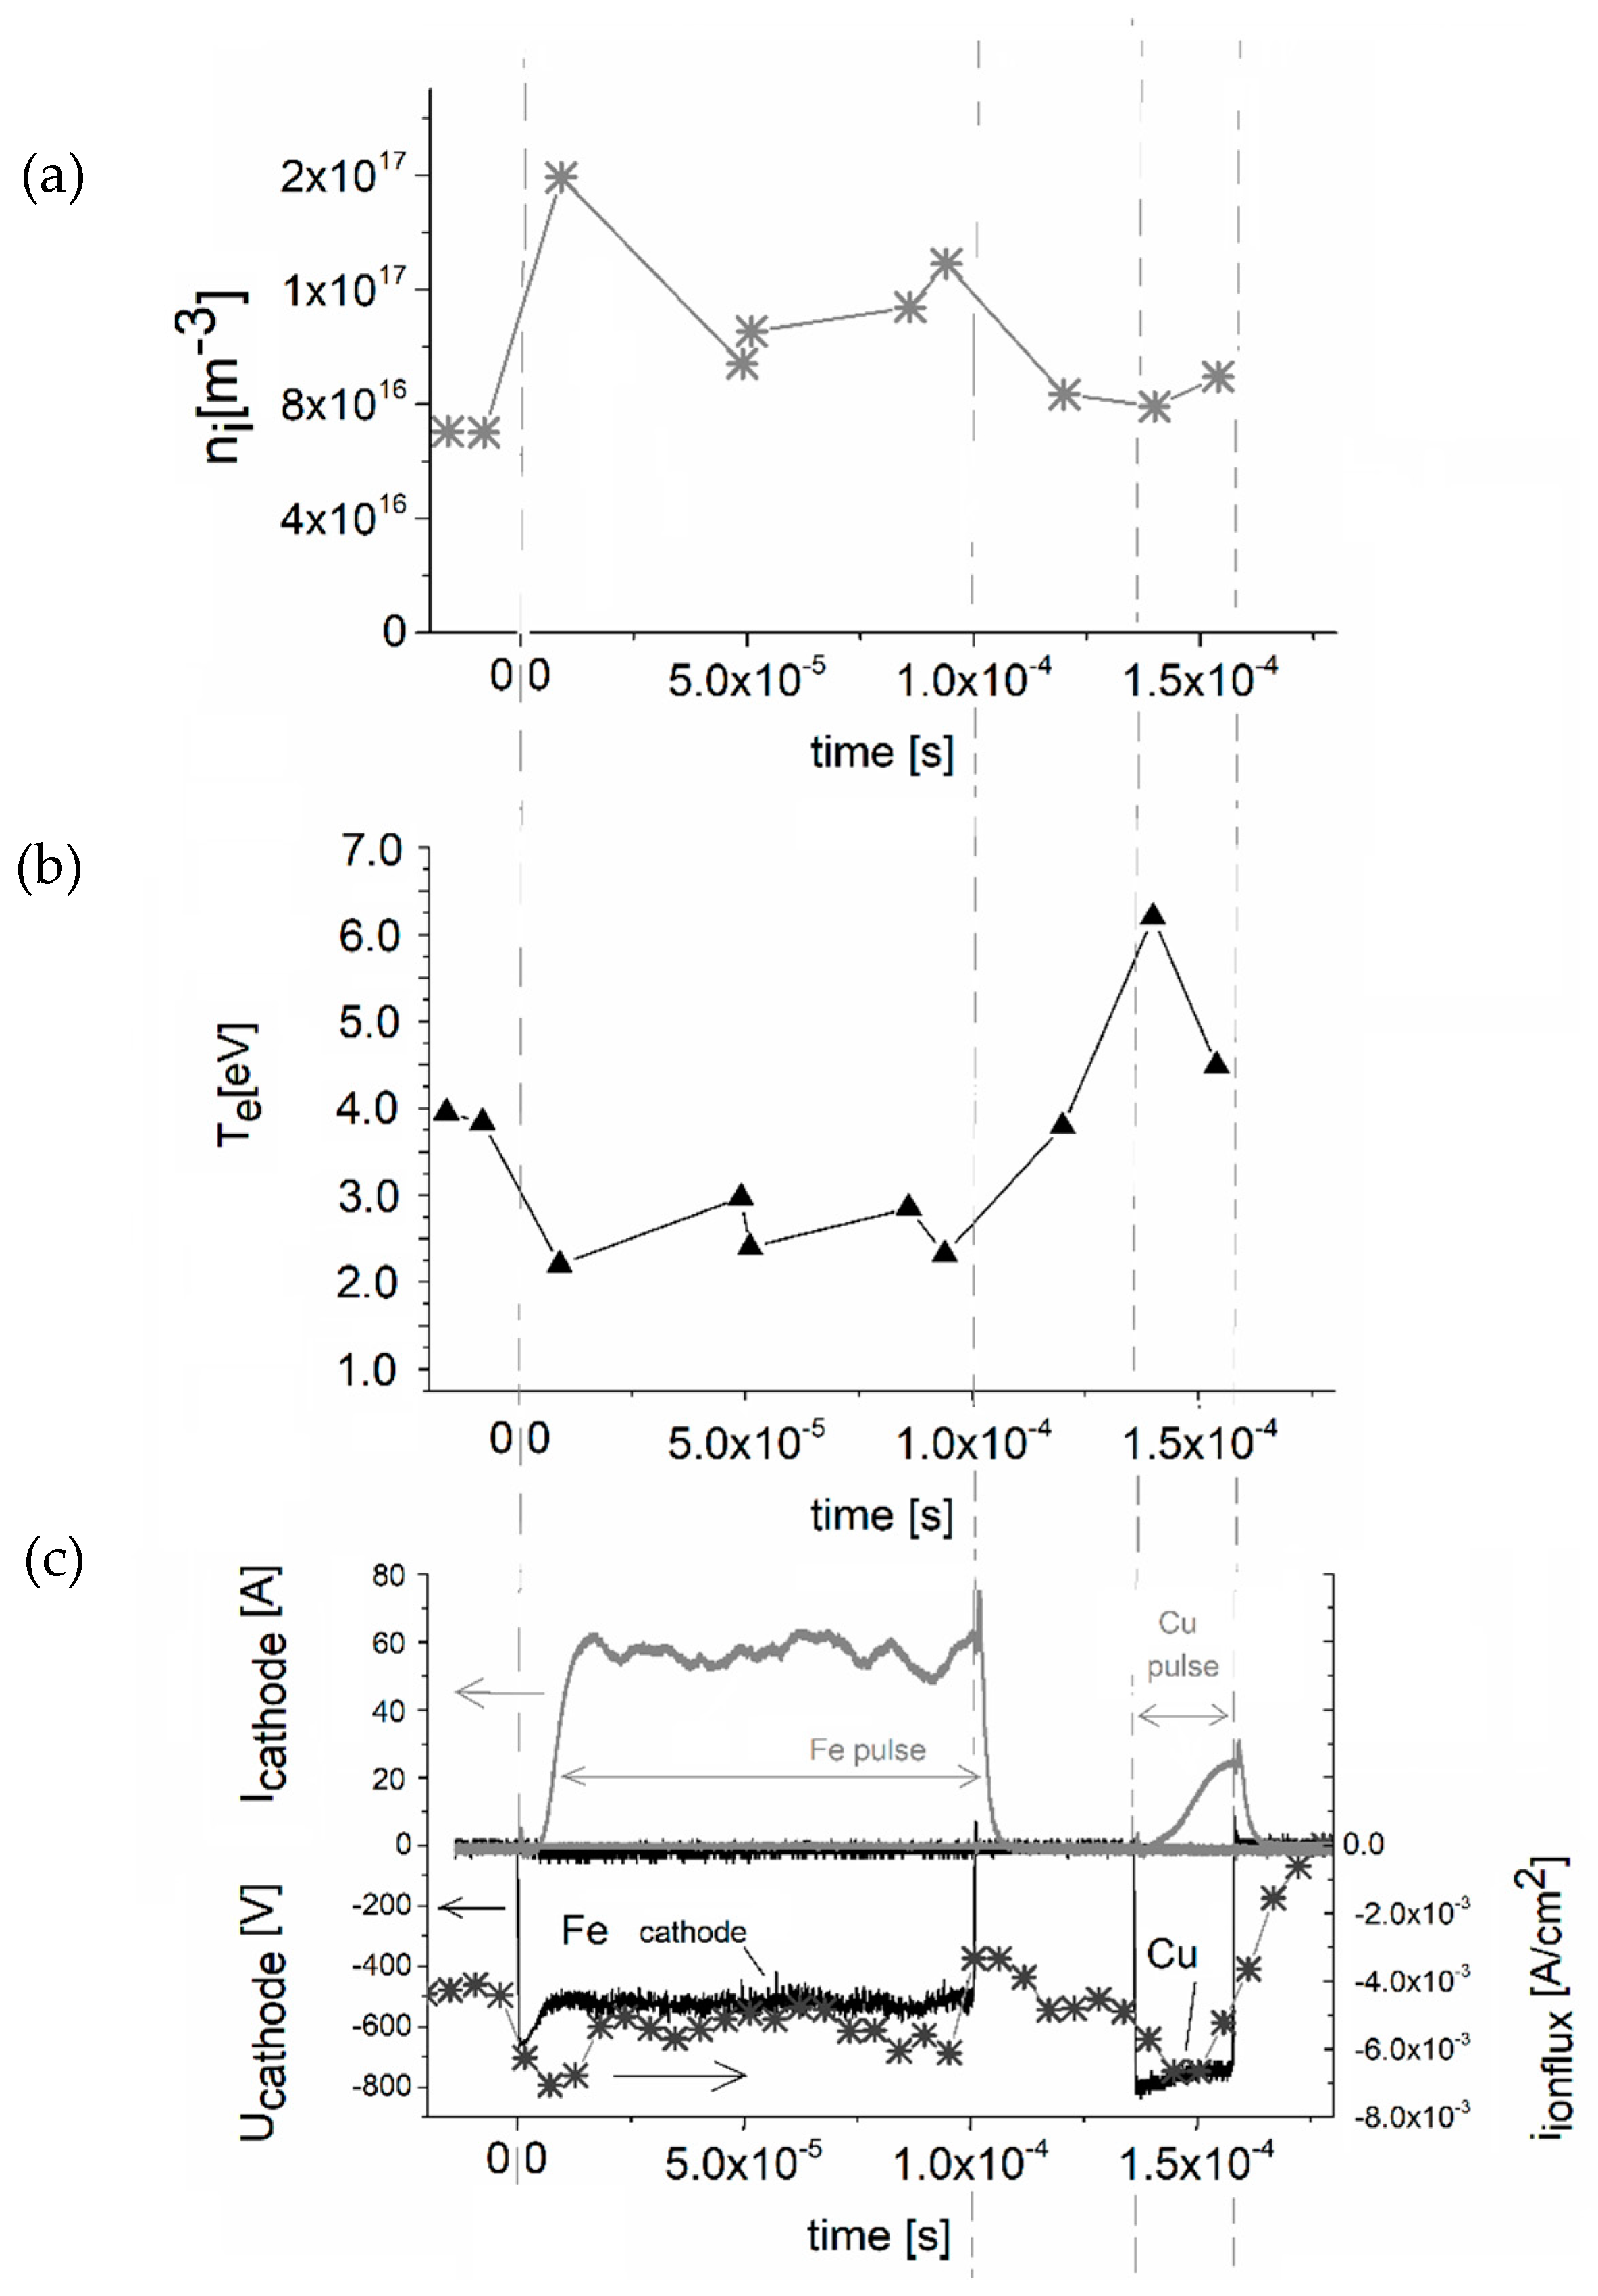
The results of plasma diagnostics of the reactive r-HiPIMS and hybrid r-HiPIMS + ECWR are in
Figure 2 and
Figure 3, respectively. The first difference between these two specific cases is the character of discharge current time evolution during the active discharge pulse on the Fe magnetron cathode where the active discharge pulse is quite long (100 μs). In case of pure r-HiPIMS we see typical discharge current decrease after ≈ 30 μs from the beginning of the pulse (
Figure 2). This is a typical phenomenon in r-HiPIMS caused by so called gas rarefaction at the surface of the cathode due to the sputtering wind [
26]. On the other hand, in case of r-HiPIMS + ECWR, a quite flat discharge current time evolution (
Figure 3) can be observed during the active discharge pulse. Similar behavior was already discussed in reference [
31] and this effect was explained by higher ionization of the plasma during the active pulse and by higher concentration of double ionized Fe
++ in r-HiPIMS + ECWR. We have observed difference between r-HiPIMS and r-HiPIMS + ECWR in value and character of time evolution of the ion flux density
iionflux (
Figure 2 and
Figure 3). In case of r-HiPIMS + ECWR,
iionflux values during active pulses on both cathodes were apparently higher (around 6 mA/cm
2) than in case of pure r-HiPIMS where
iionflux ≈ 3 mA/cm
2. If we compare the tail electron temperature
Te (
Figure 2 and
Figure 3), it can be seen that
Te is much higher in case of r-HiPIMS + ECWR than in pure r-HiPIMS. This is important phenomenon of superimposed ECWR plasma because higher
Te means higher probability of ionization of sputtered particles which is the main feature of r-HiPIMS sources. Furthermore, this
Te is very high (
Te ≈ 4 eV) during all the time of the “OFF” time period of the pulse in case of hybrid r-HiPIMS + ECWR with measured plasma density
ni ≈ 7 × 10
16 m
−3 (
Figure 3). It means the growing films in hybrid source are interacting with quite intensive plasma during the time between active discharge pulses and this is further significant difference from the pure r-HiPIMS which may influence parameters of deposited film. If we compare the time evolution of measured
ni during active pulses in both cases,
Figure 2 and
Figure 3, it can be seen that in the iron cathode active discharge pulse
ni decreases from the beginning to the half of the pulse in case of r-HiPIMS + ECWR (
Figure 3) and in case of pure r-HiPIMS,
ni gradually increases during all the pulse (
Figure 2). During the active discharge pulses of both cathodes, the value of
ni does not significantly differ in hybrid and pure HiPIMS case.
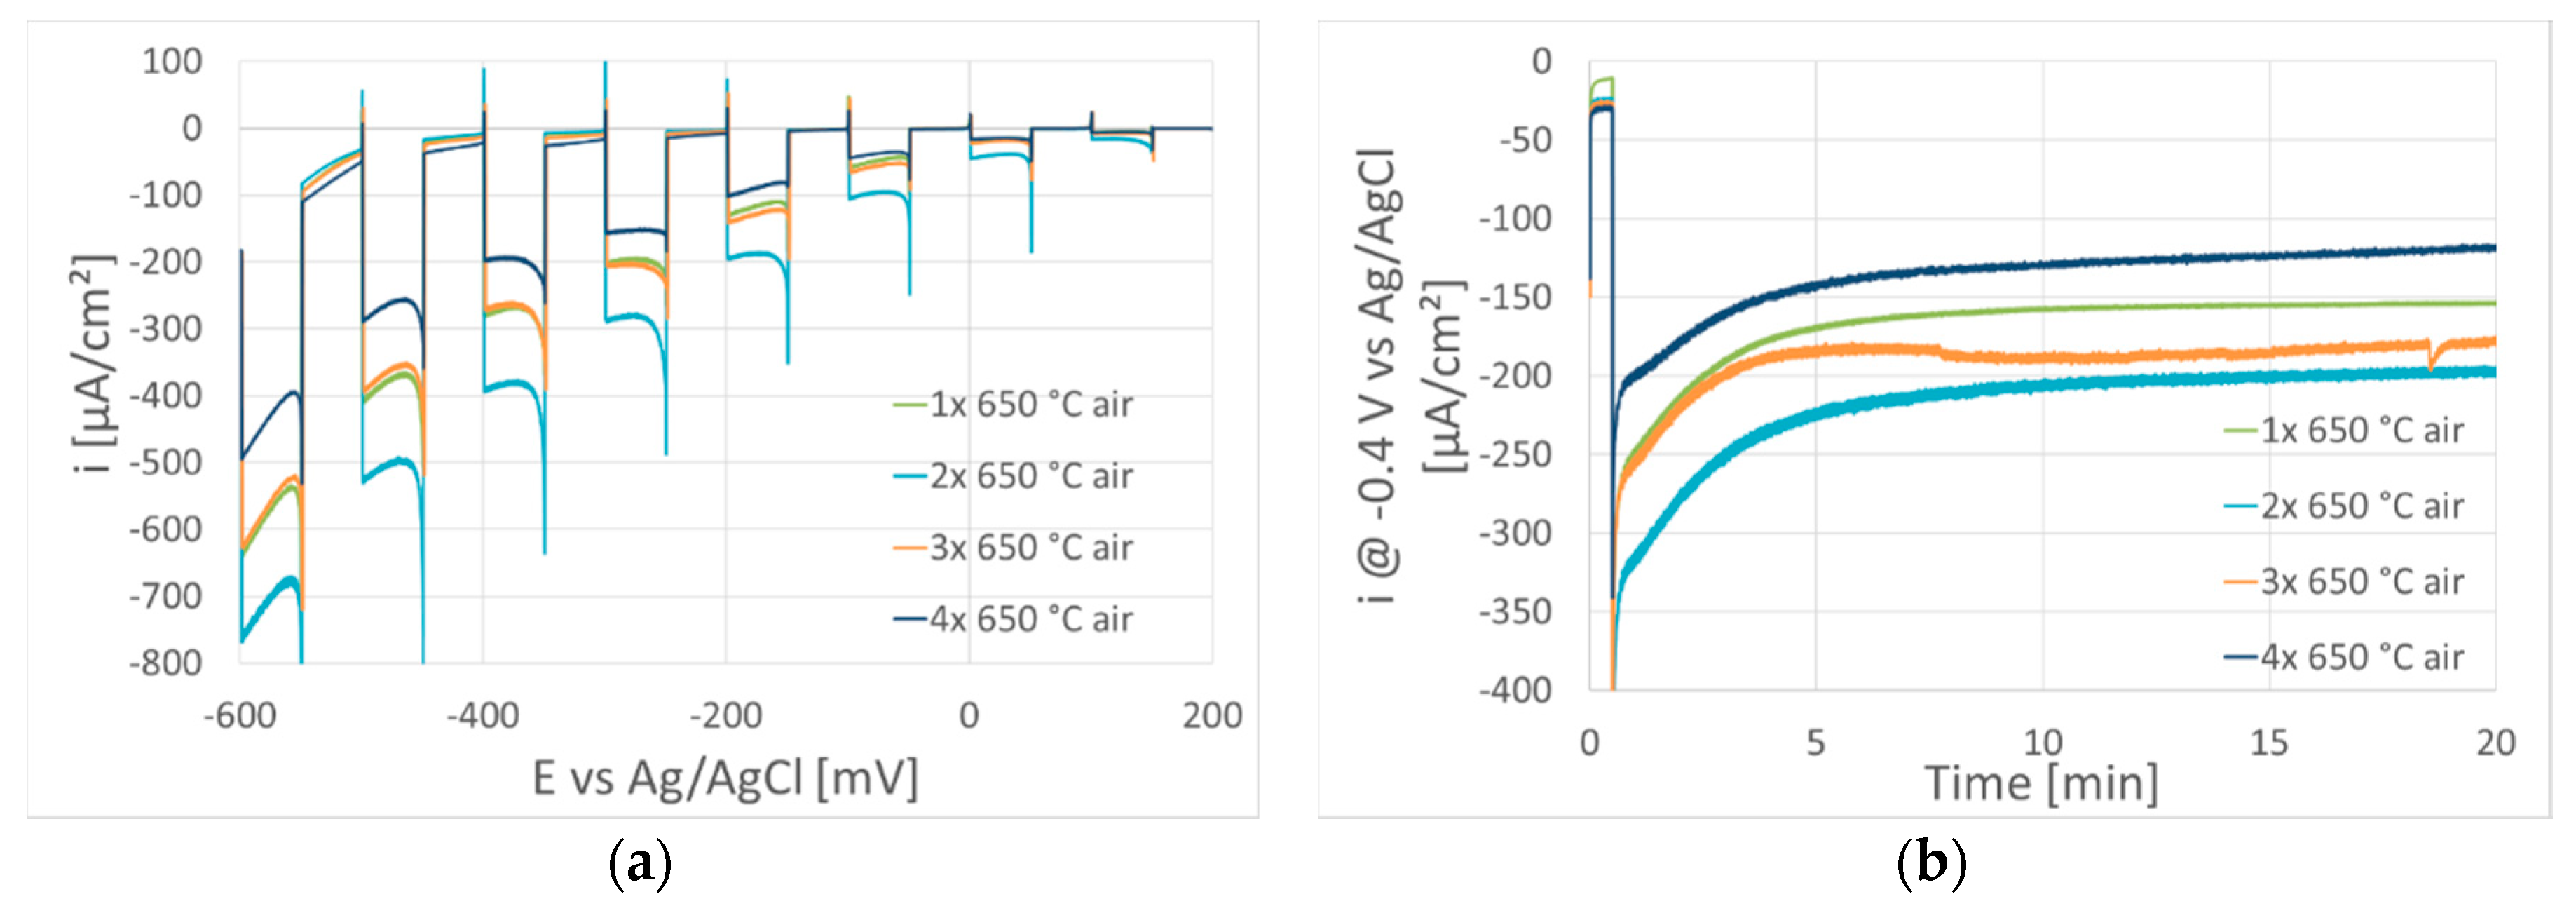
The results of photoelectrochemical measurement of samples 1x, 2x, 3x, and 4x from the
Table 1 can be seen in
Figure 4. The molar ratios of Cu and Fe measured by XRF for these samples are also in the
Table 1. The measured molar ratio was found in the interval between
1.8 up to
12.3. This ratio
is dependent on the ratio of average discharge currents
ICuAV and
IFeAV but is also strongly dependent on the oxygen flow in plasma
QO₂. It is clear that this oxygen flow strongly influences the sputtering rate of iron target which is partially covered by iron oxide layer which has a smaller sputtering yield. As it can be seen from
Table 1, when
QO₂ decreased the amount of iron in deposited films strongly increased. In
Figure 4a, we can see the linear voltammetry of these samples under light illumination and at dark conditions as the light from the solar simulator is chopped by shutter. All the mentioned samples exhibit the p-type conductivity and have quite large photocurrents. The highest photocurrents can be identified for the sample 2x with the molar ratio
, and the highest thickness was 2200 nm.
Figure 4b shows the chronoamperometry under the constant illumination by solar simulator for 20 min. The photocurrent at the beginning quickly drops and then very slowly decreases. It looks like the most stable sample from this set of samples is 3x with
and a thickness of 580 nm.
The influence of the presence of oxygen dissolved in electrolyte was studied for sample 2x (
Figure S5 in the Supplementary Information). Photoelectrochemical measurement in the absence of oxygen was performed under an argon atmosphere in an electrolyte bubbled by argon for five hours. Measurement in the presence of oxygen was performed under an air atmosphere. It was found that there was an almost negligible decrease in photocurrent in the absence of oxygen. Because of the negligible effect of dissolved oxygen, all photoelectrochemical experiments were done in the presence of oxygen (at concentrations corresponding to the equilibrium with air).
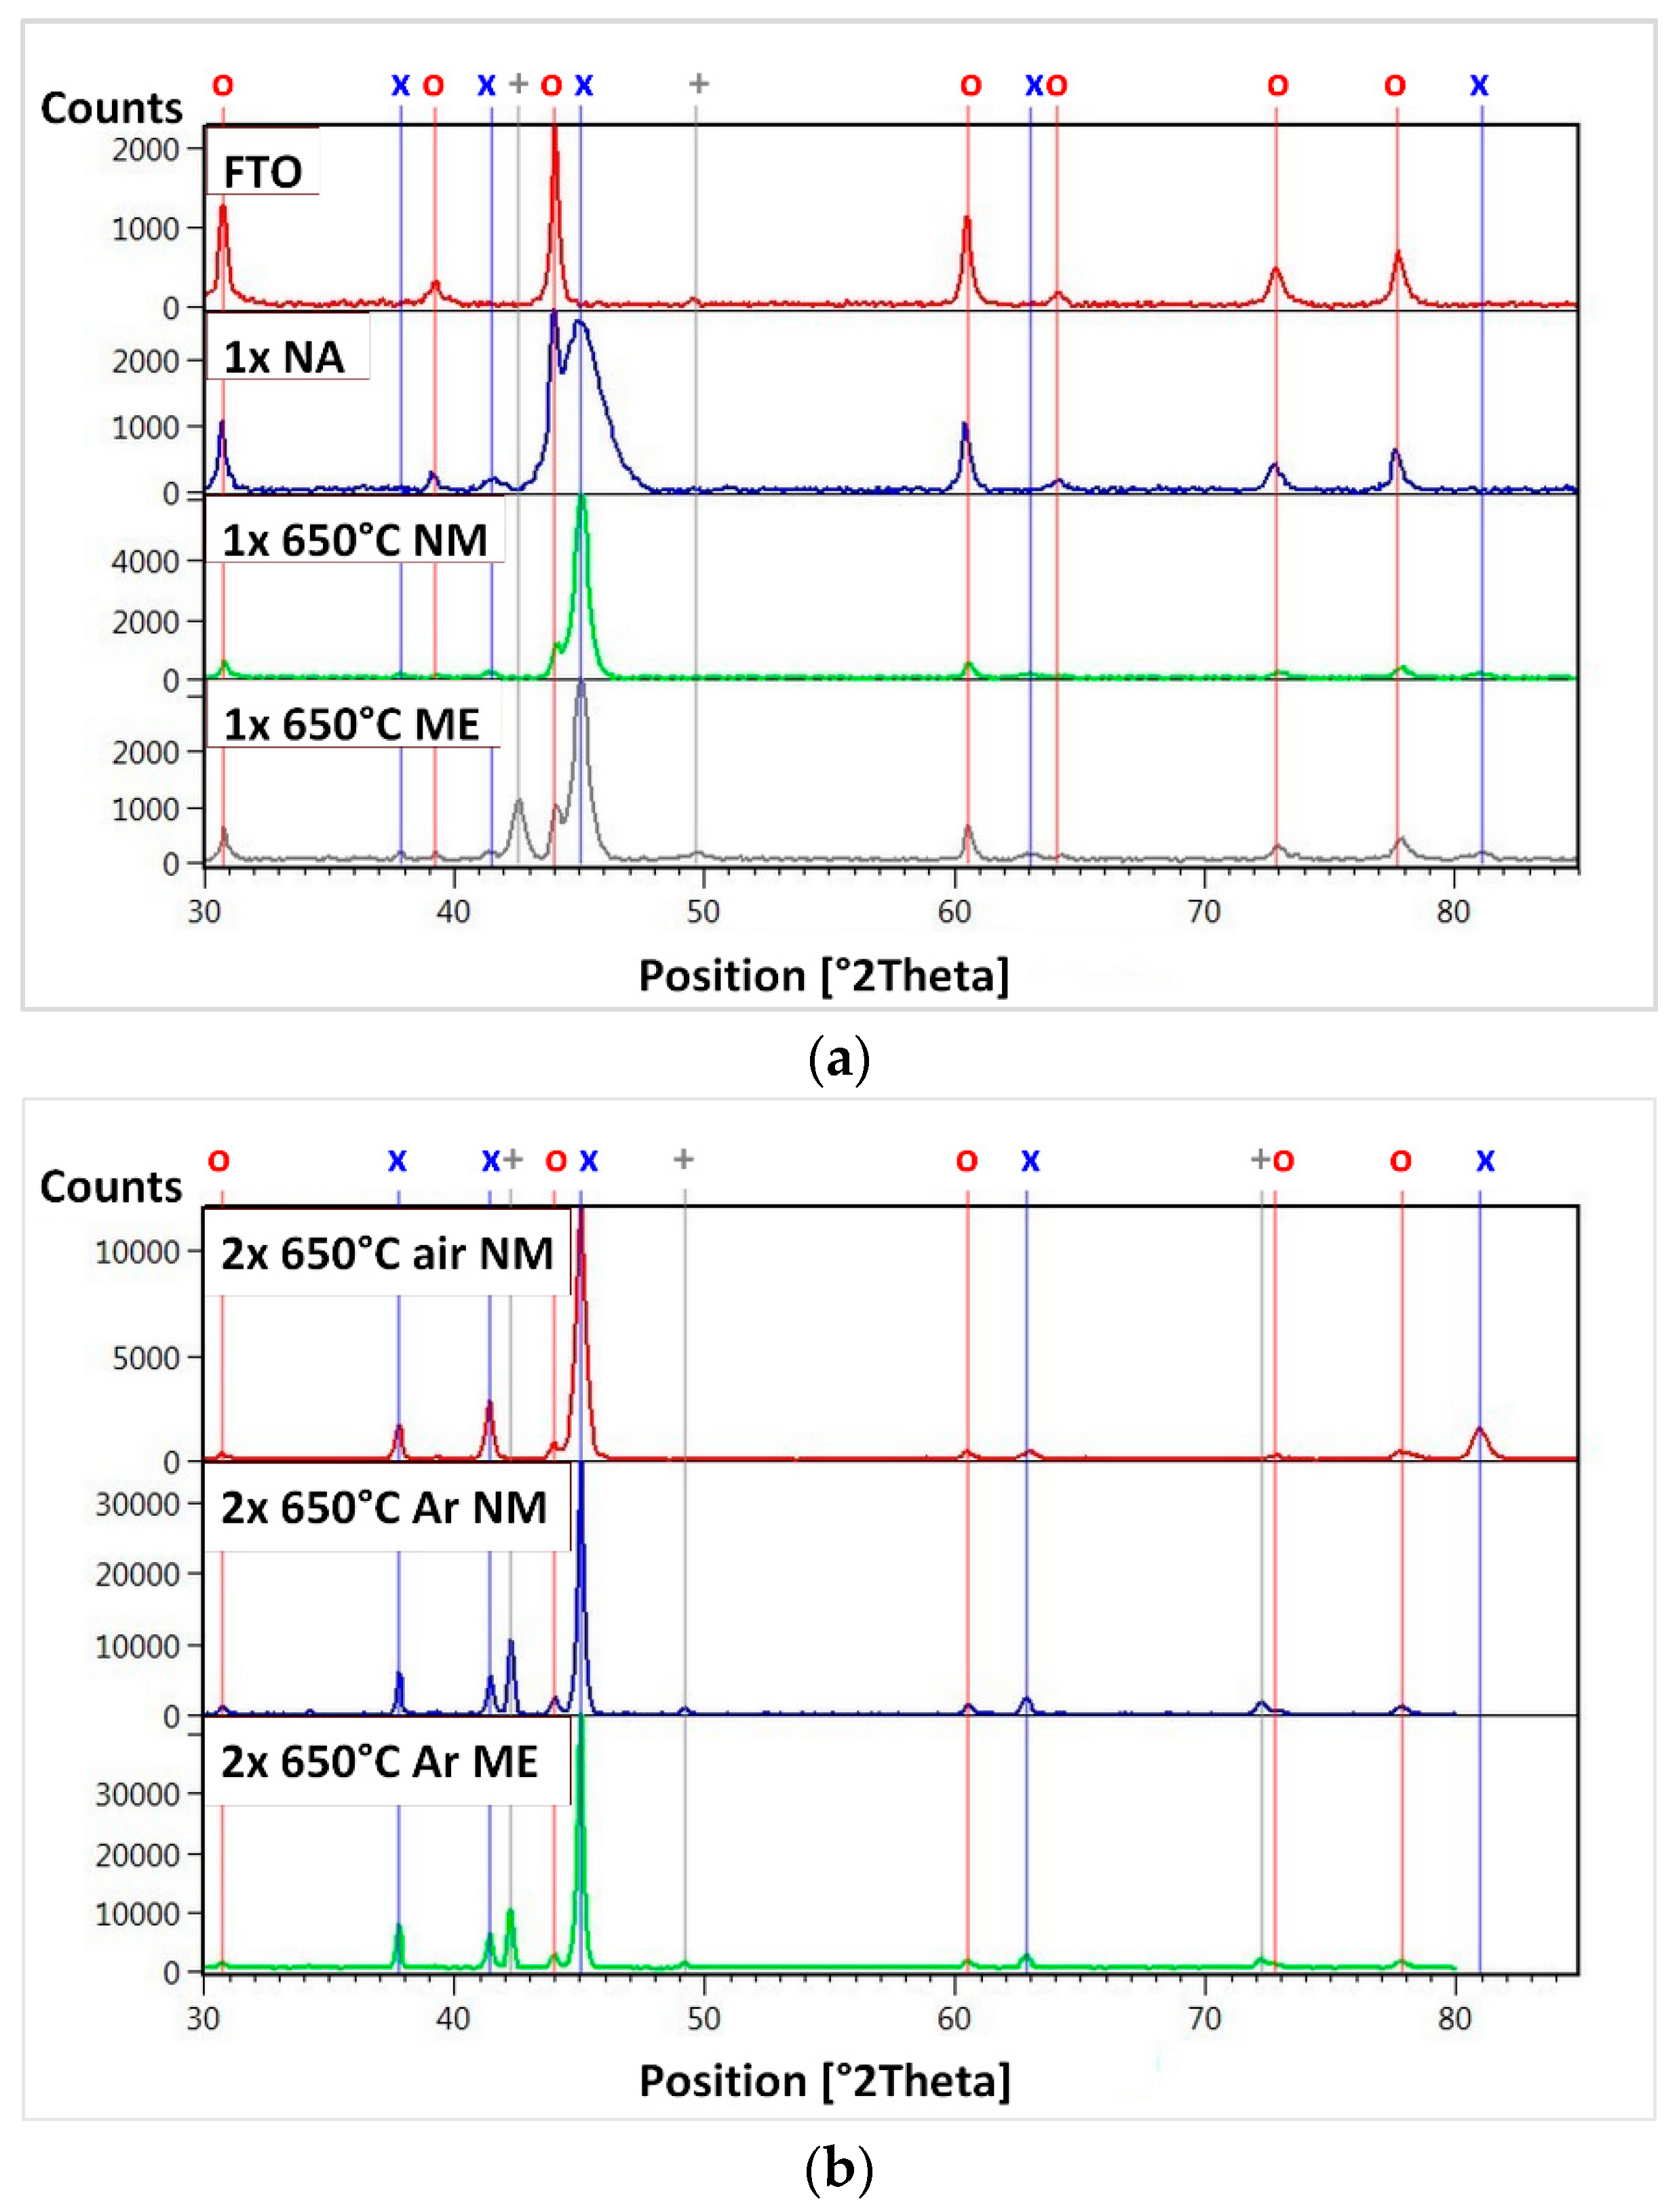
Phase composition of deposited layers 1x–4x changed after post deposition annealing in air or Ar as documented in
Figure 5 for samples 1x and 2x. As the deposited sample contains only CuO crystalline phase, after calcination at 650 °C in air, the XRD peak at 45° corresponding to CuO strongly increased as the result of improved crystallinity (see
Figure 5a). No other phase than CuO was detected. On the other side, Cu
2O phase appears when sample (2x) was annealed in the argon atmosphere as can be seen in
Figure 5b. The formation of Cu
2O phase can be explained by the reduction of CuO during annealing.
The XRD spectra of samples 1x after annealing in air at 650 °C before electrochemical measurement “NM” and after electrochemical measurement “ME” can be also seen in
Figure 5a. The sample 1x contains after electrochemical measurement (linear voltammetry and 20 min chronoamperometry at −400 mV vs. Ag/AgCl under light) “ME” also phase Cu
2O (peaks 42.5° and 49.7°). It means that films were slowly reduced during photoelectrochemical measurement. Photocurrents of samples 1x–4x annealed in argon (not shown in graphs) were much lower than samples annealed in air. As can be seen from
Table 1, samples 1x–4x have Cu/Fe molar ratio much higher than in the desired delafossite CuFeO
2 (1:1). This is probably the reason why the films 1x–4x contain only CuO and not CuFeO
2. Furthermore, although samples 1x–4x contain quite significant fraction of Fe no iron or iron oxide phases were identified in these samples. Conditions of the plasma deposition were then further changed and optimized for samples 5x to 10x to achieve the desired molar ratio of Cu/Fe =1.
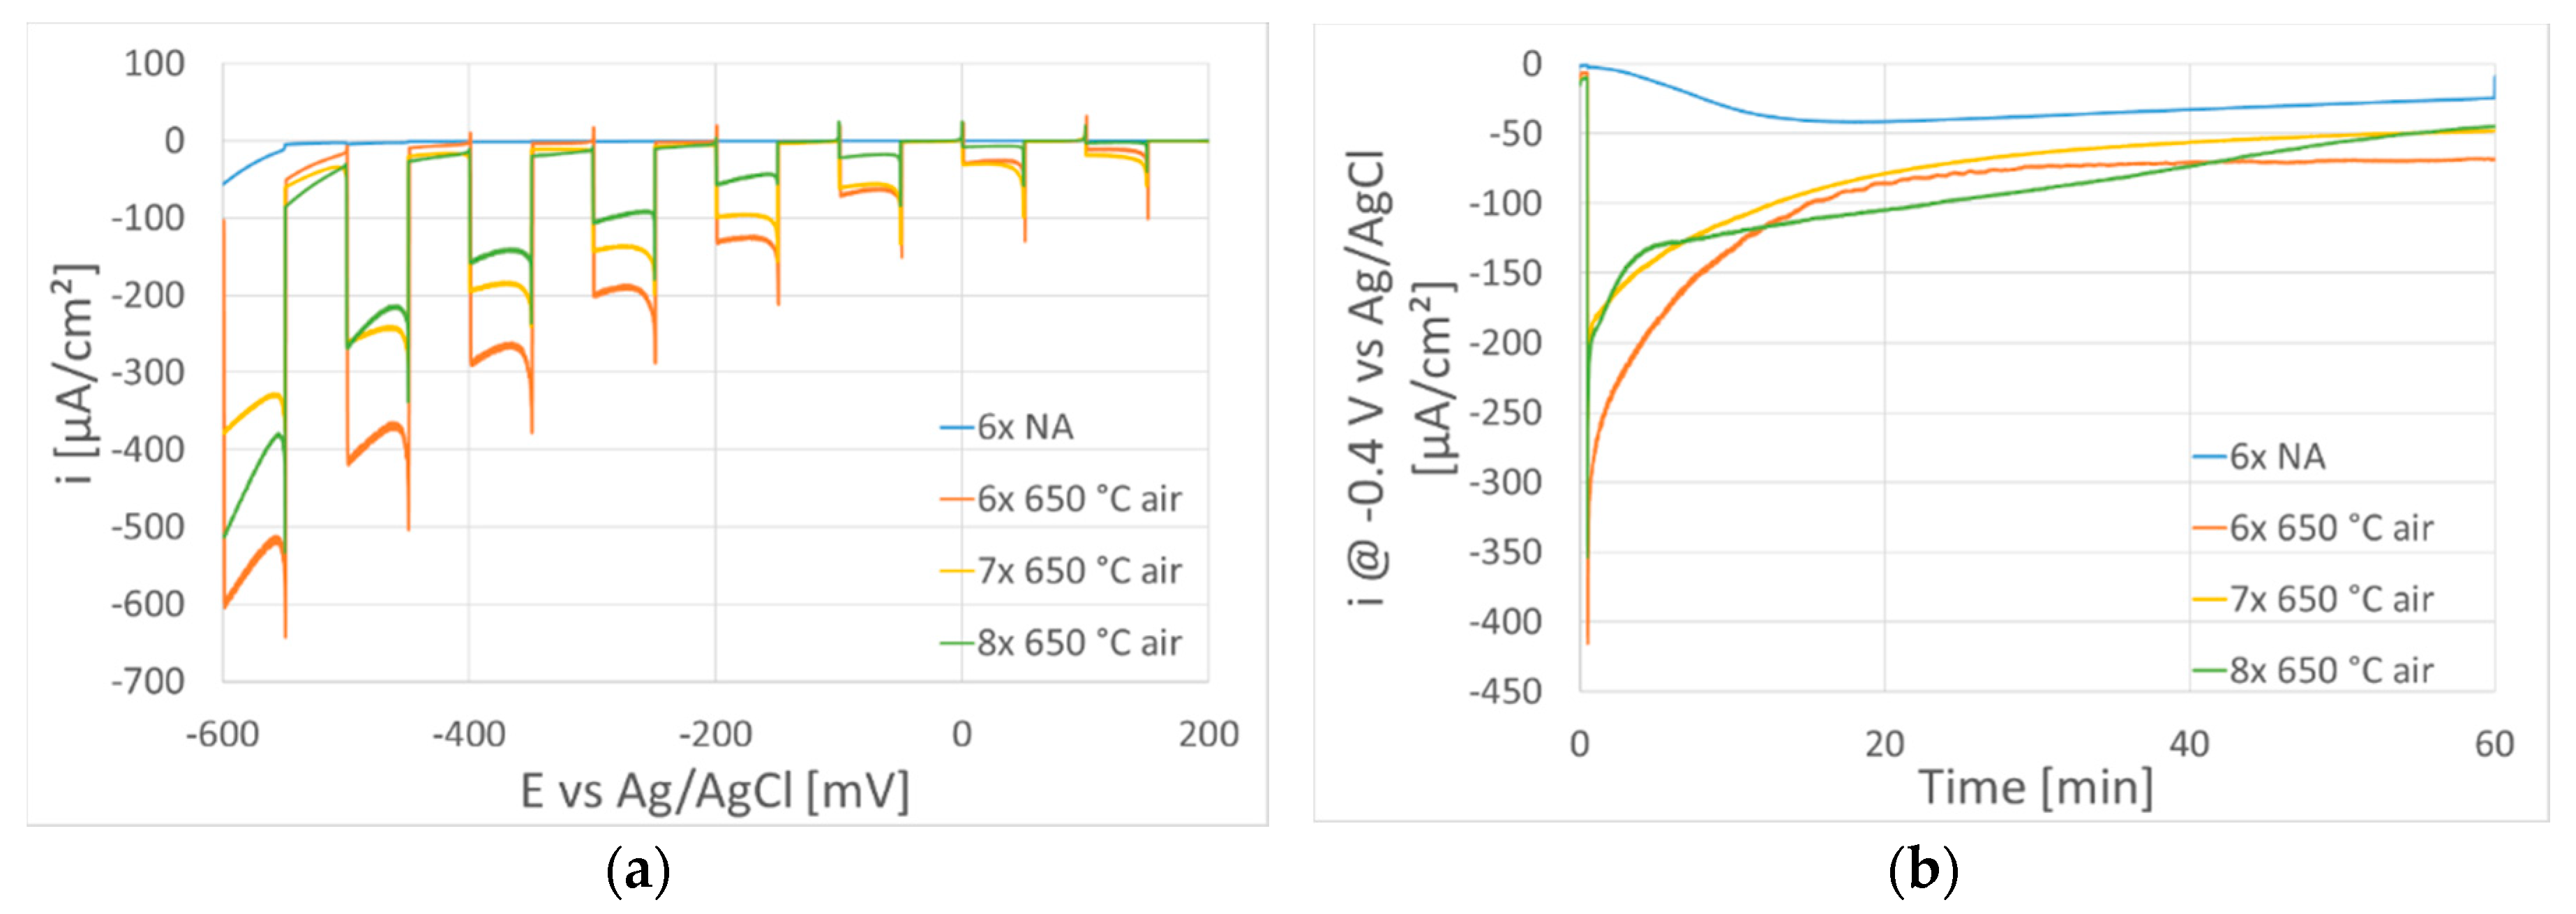
The next investigated series consists of samples 6x, 7x, 8x which were heated during the deposition at 500 °C (
Table 1). The results of linear voltammetry and chronoamperometry measurement can be seen in
Figure 6 for sample 6x as deposited and samples 6x, 7x, 8x annealed in air at 650 °C. The ratio of Cu and Fe measured by XRF in these films were in the interval
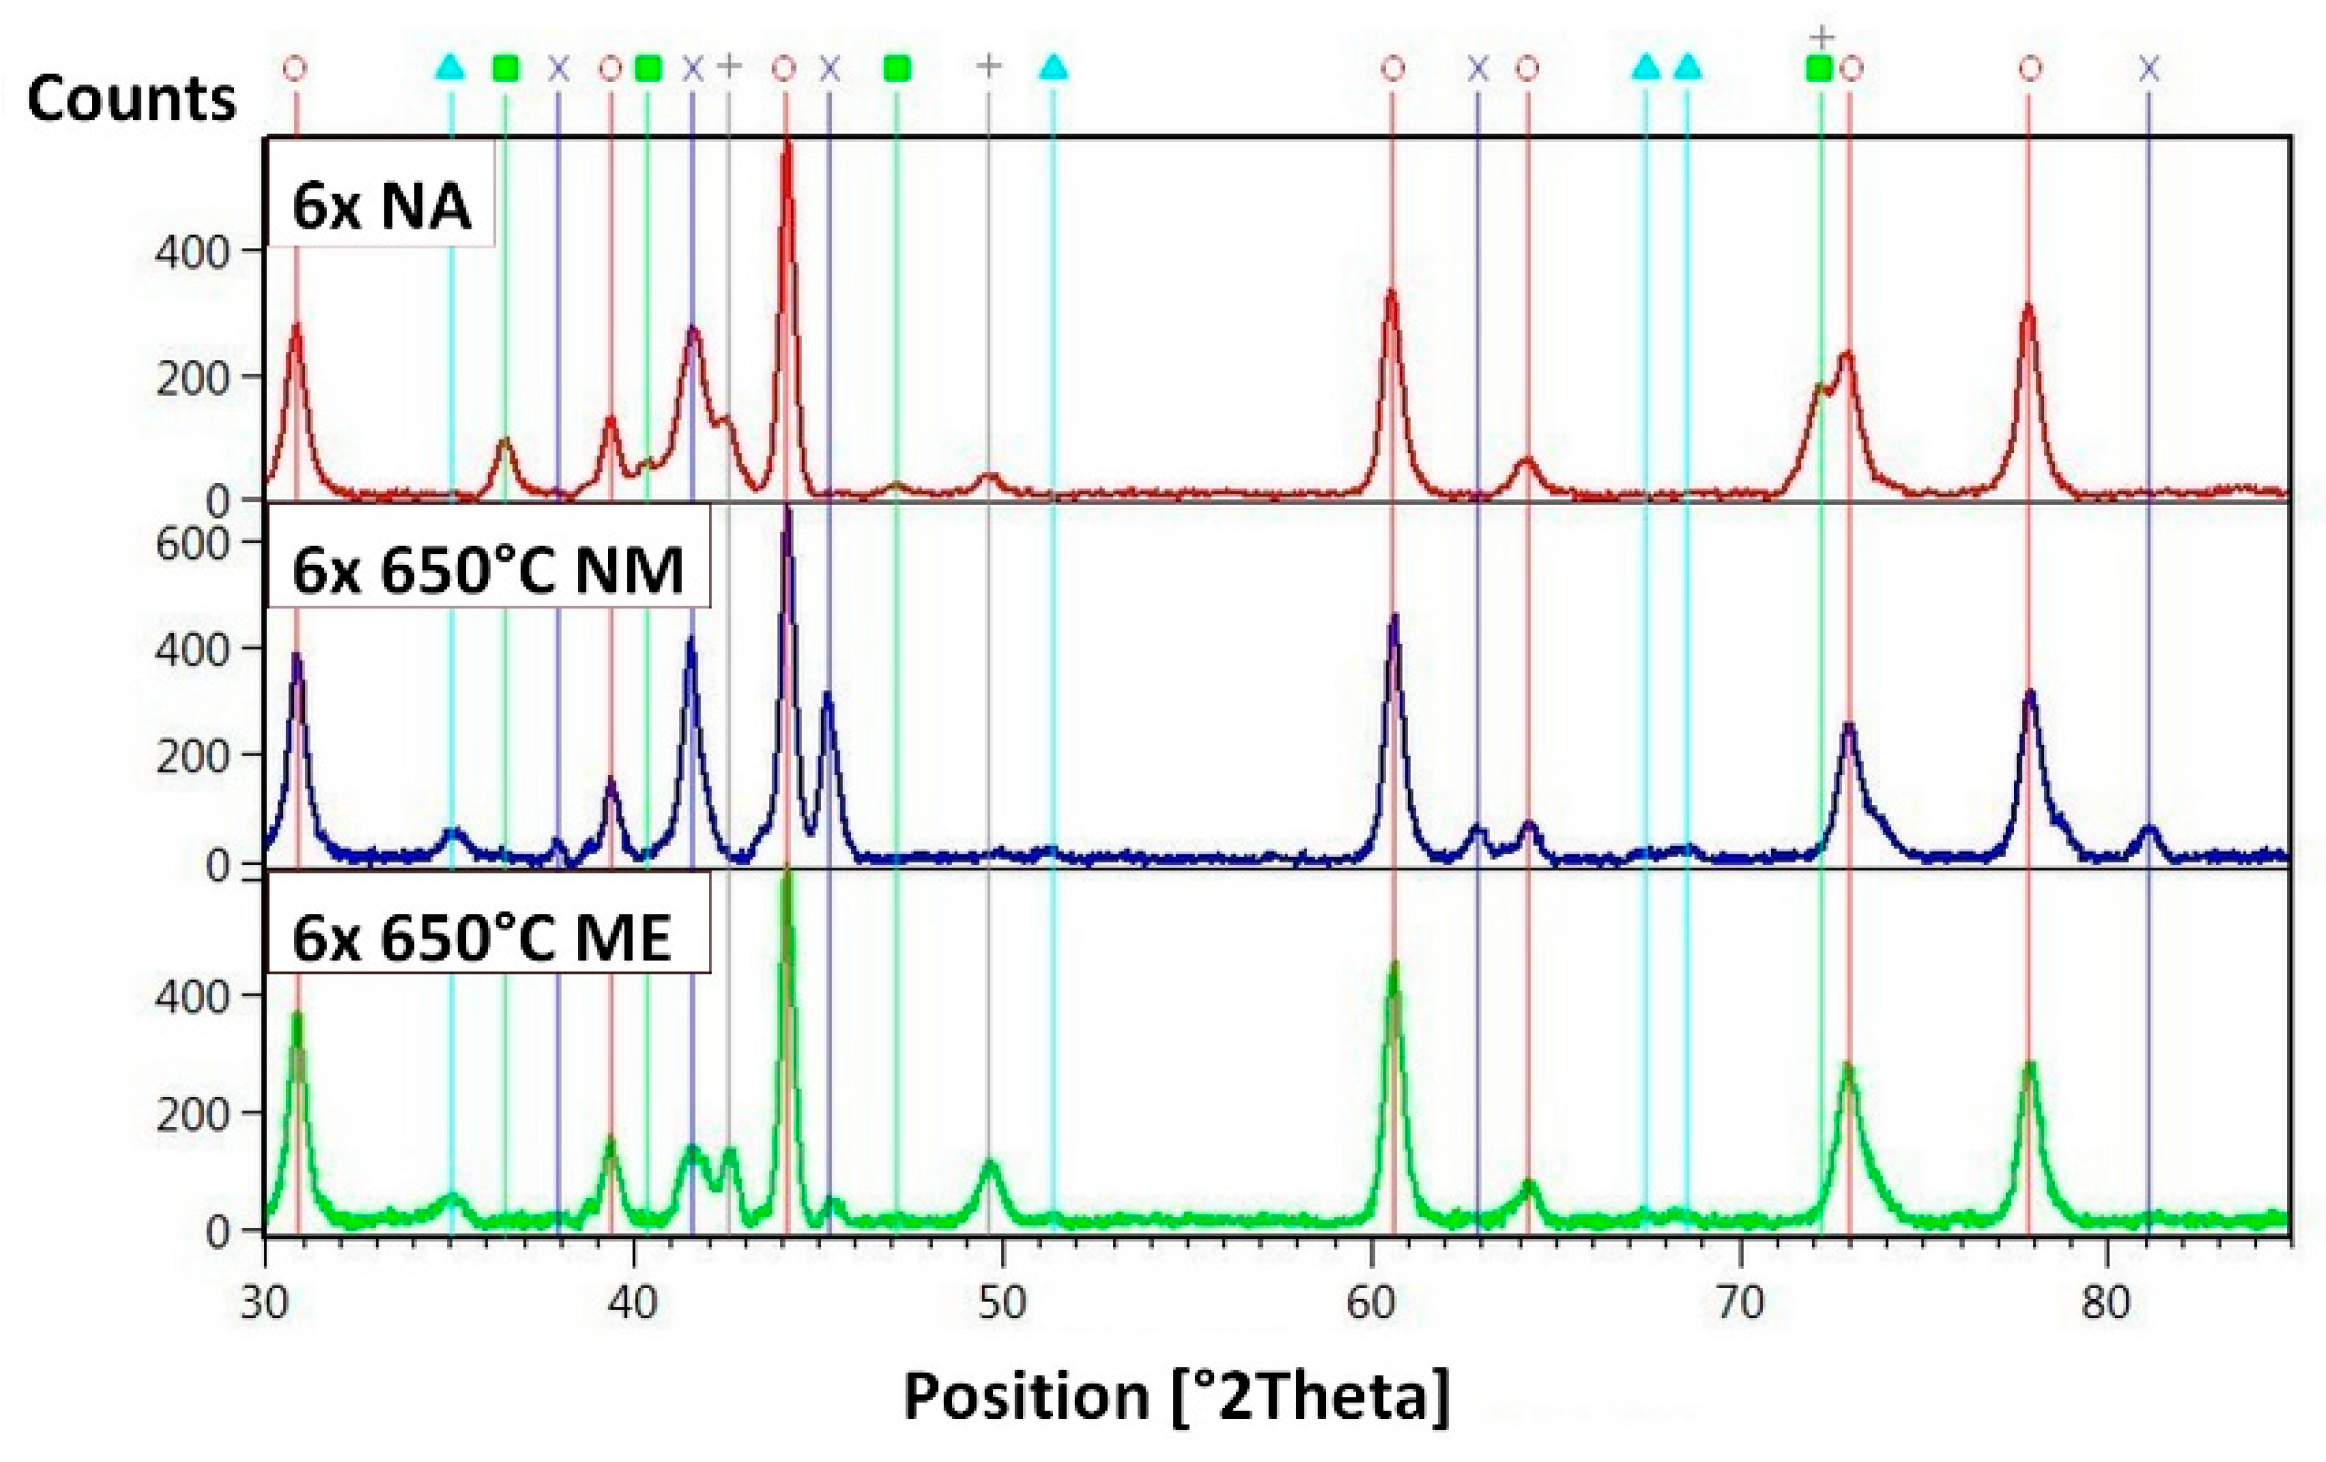
The results of XRD measured on the sample 6x without postdeposition annealing, after annealing in air on 650 °C not electrochemically measured “MN” and after annealing in air on 650 °C after photoelectrochemical (PEC) measurement “ME” can be seen in
Figure 7. As deposited sample 6x contains delafossite phase (peaks at 36.5° and 72.1°), Cu
2O phase and CuO phase but it does not have any photoresponse in PEC measurement (see
Figure 6). After annealing in air, sample 6x lost the delafossite phase which was transformed to CuFe
2O
4 phase, Cu
2O phase disappeared and amount of CuO increased. But annealing in air results in a significant increase in photocurrent response for all samples 6x, 7x and 8x (see
Figure 6a), with the highest photocurrents for sample 6x from this set of samples. The chronoamperometry shown in
Figure 6b shows that observed photocurrents significantly decrease with time which suggests that these films are not stable in time during PEC polarization. Instability was confirmed by XRD measurement of sample 6 after electrochemical measurement “ME” (
Figure 7) which shows the formation of Cu
2O due to the photoelectrochemical reduction of CuO.
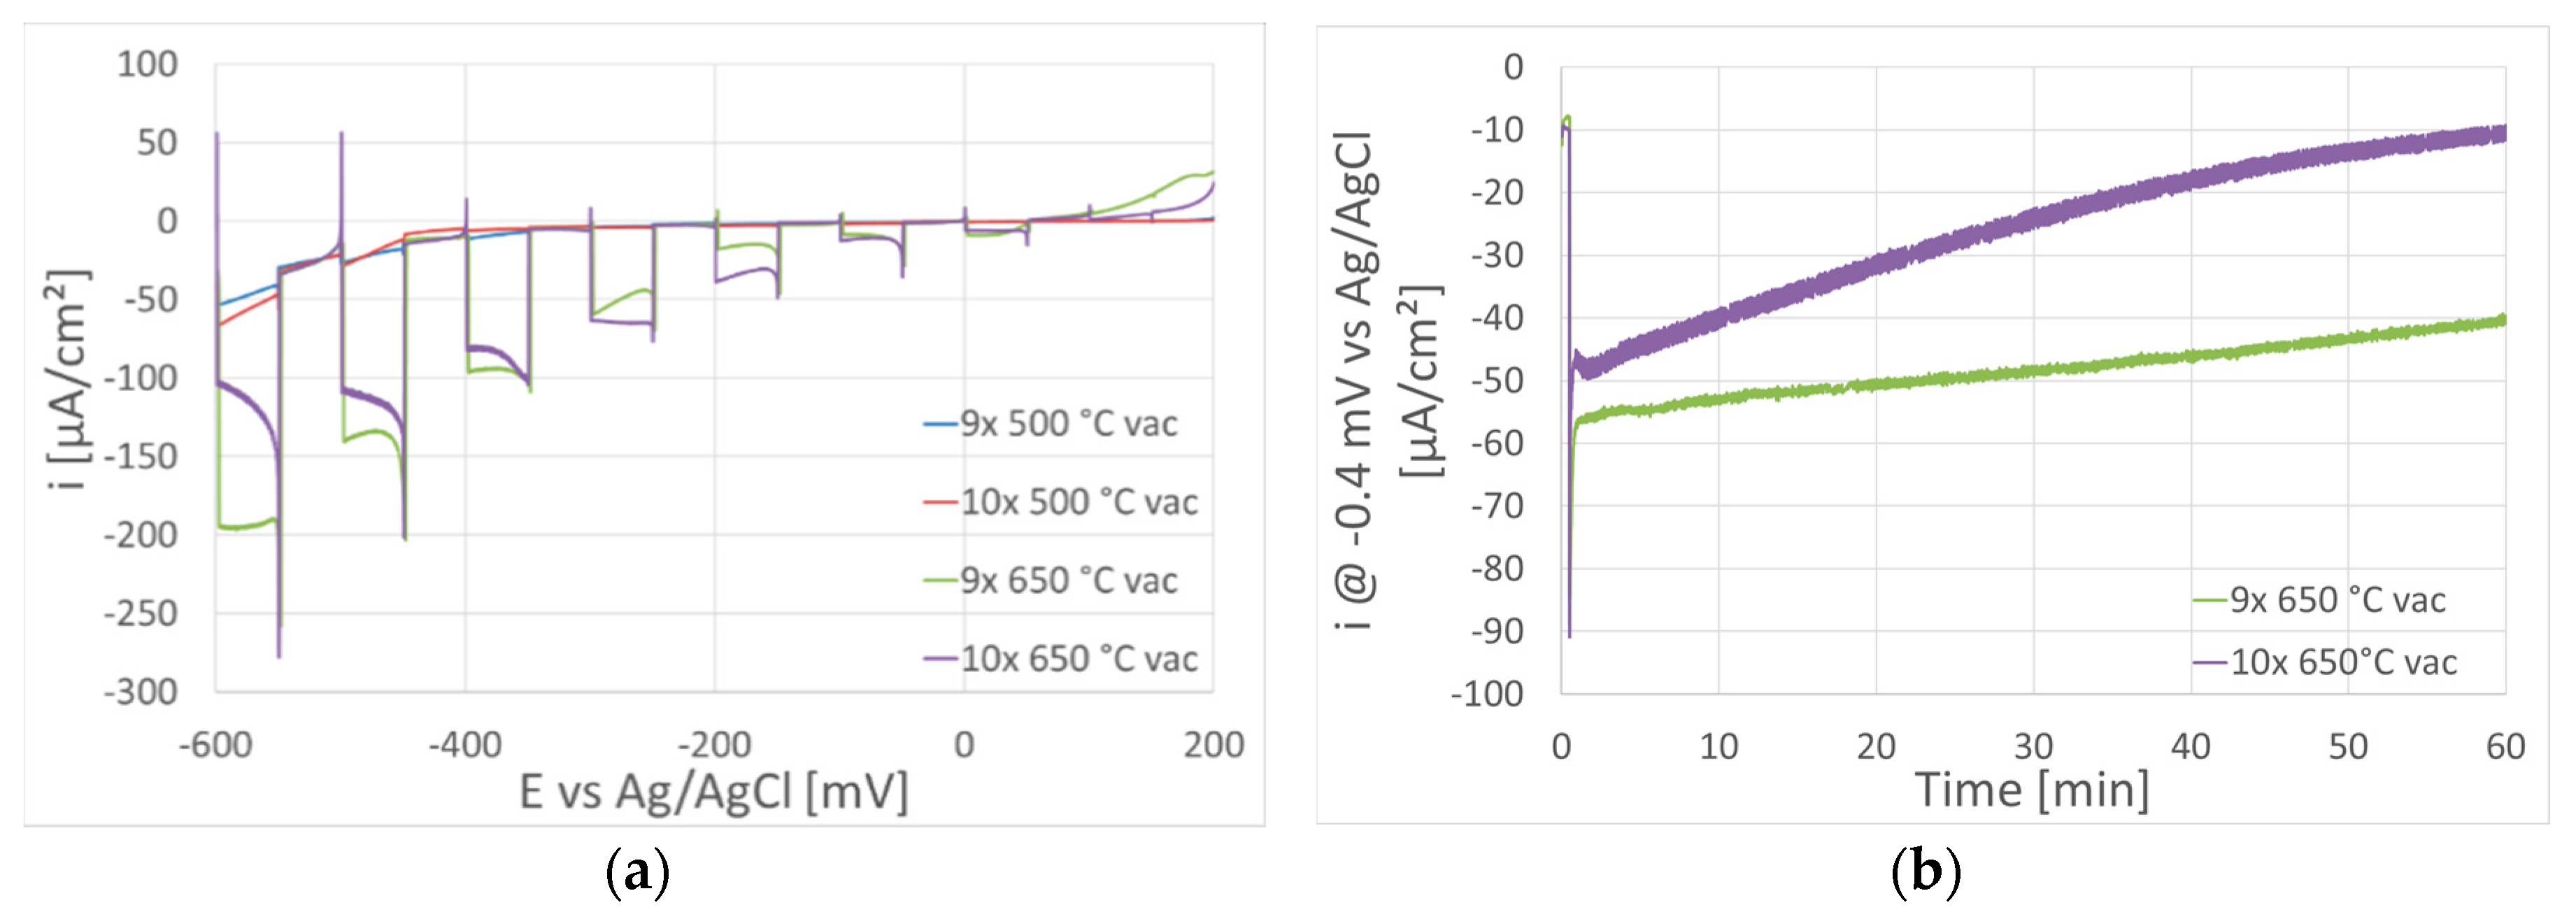
In order to get some photocurrents at films with delafossite structure, samples 9x and 10x were annealed after the deposition in vacuum (10−3 Pa) at 650 and 500 °C.
Figure S6 (in SI) shows XRD patterns of sample 9x after annealing in a vacuum at 650 °C. After this thermal treatment, sample 9x contains large fraction of delafossite (CuFeO
2) phase and a small amount of Cu
2O. No other crystal phase containing iron was found.
Figure 8 shows chopped light linear voltammetry and chronoamperometry. Chronoamperometry (
Figure 8b) of these delafossite samples shows a decrease of photocurrents by time. Although photocurrents obtained from linear voltammetry (
Figure 8a) were rather small in comparison with previous set of samples (6x–8x,
Figure 6a), it is noticeable that the decrease of photocurrent with polarization time is not as fast as in the case of samples 6x–8x.
Table 2 represents the phase composition of samples annealed in vacuum at 650 °C, before (NM) and after (ME) photoelectrochemical polarization. Data are expressed as semiquantitative weight percent phase composition of the measured sample including support FTO glass (SnO
2 phase). There still exist some CuFeO
2 phase after photoelectrochemical polarization, but phase composition for each sample is different. While sample 9x contains a smaller amount of CuFeO
2, an increased amount of Cu
2O, and a new phase Fe
3O
4, sample 10x contains similar amount of CuFeO
2, and Cu
2O disappears. This means that sample 9x contains CuFeO
2, which is stable during photoelectrochemical polarization and at the same time exhibits promising photocurrent values. Further work will be devoted to the deposition of films with higher content of CuFeO
2 at deposition conditions corresponding to sample 9x to achieve more efficient and stable p-type photocathode films.
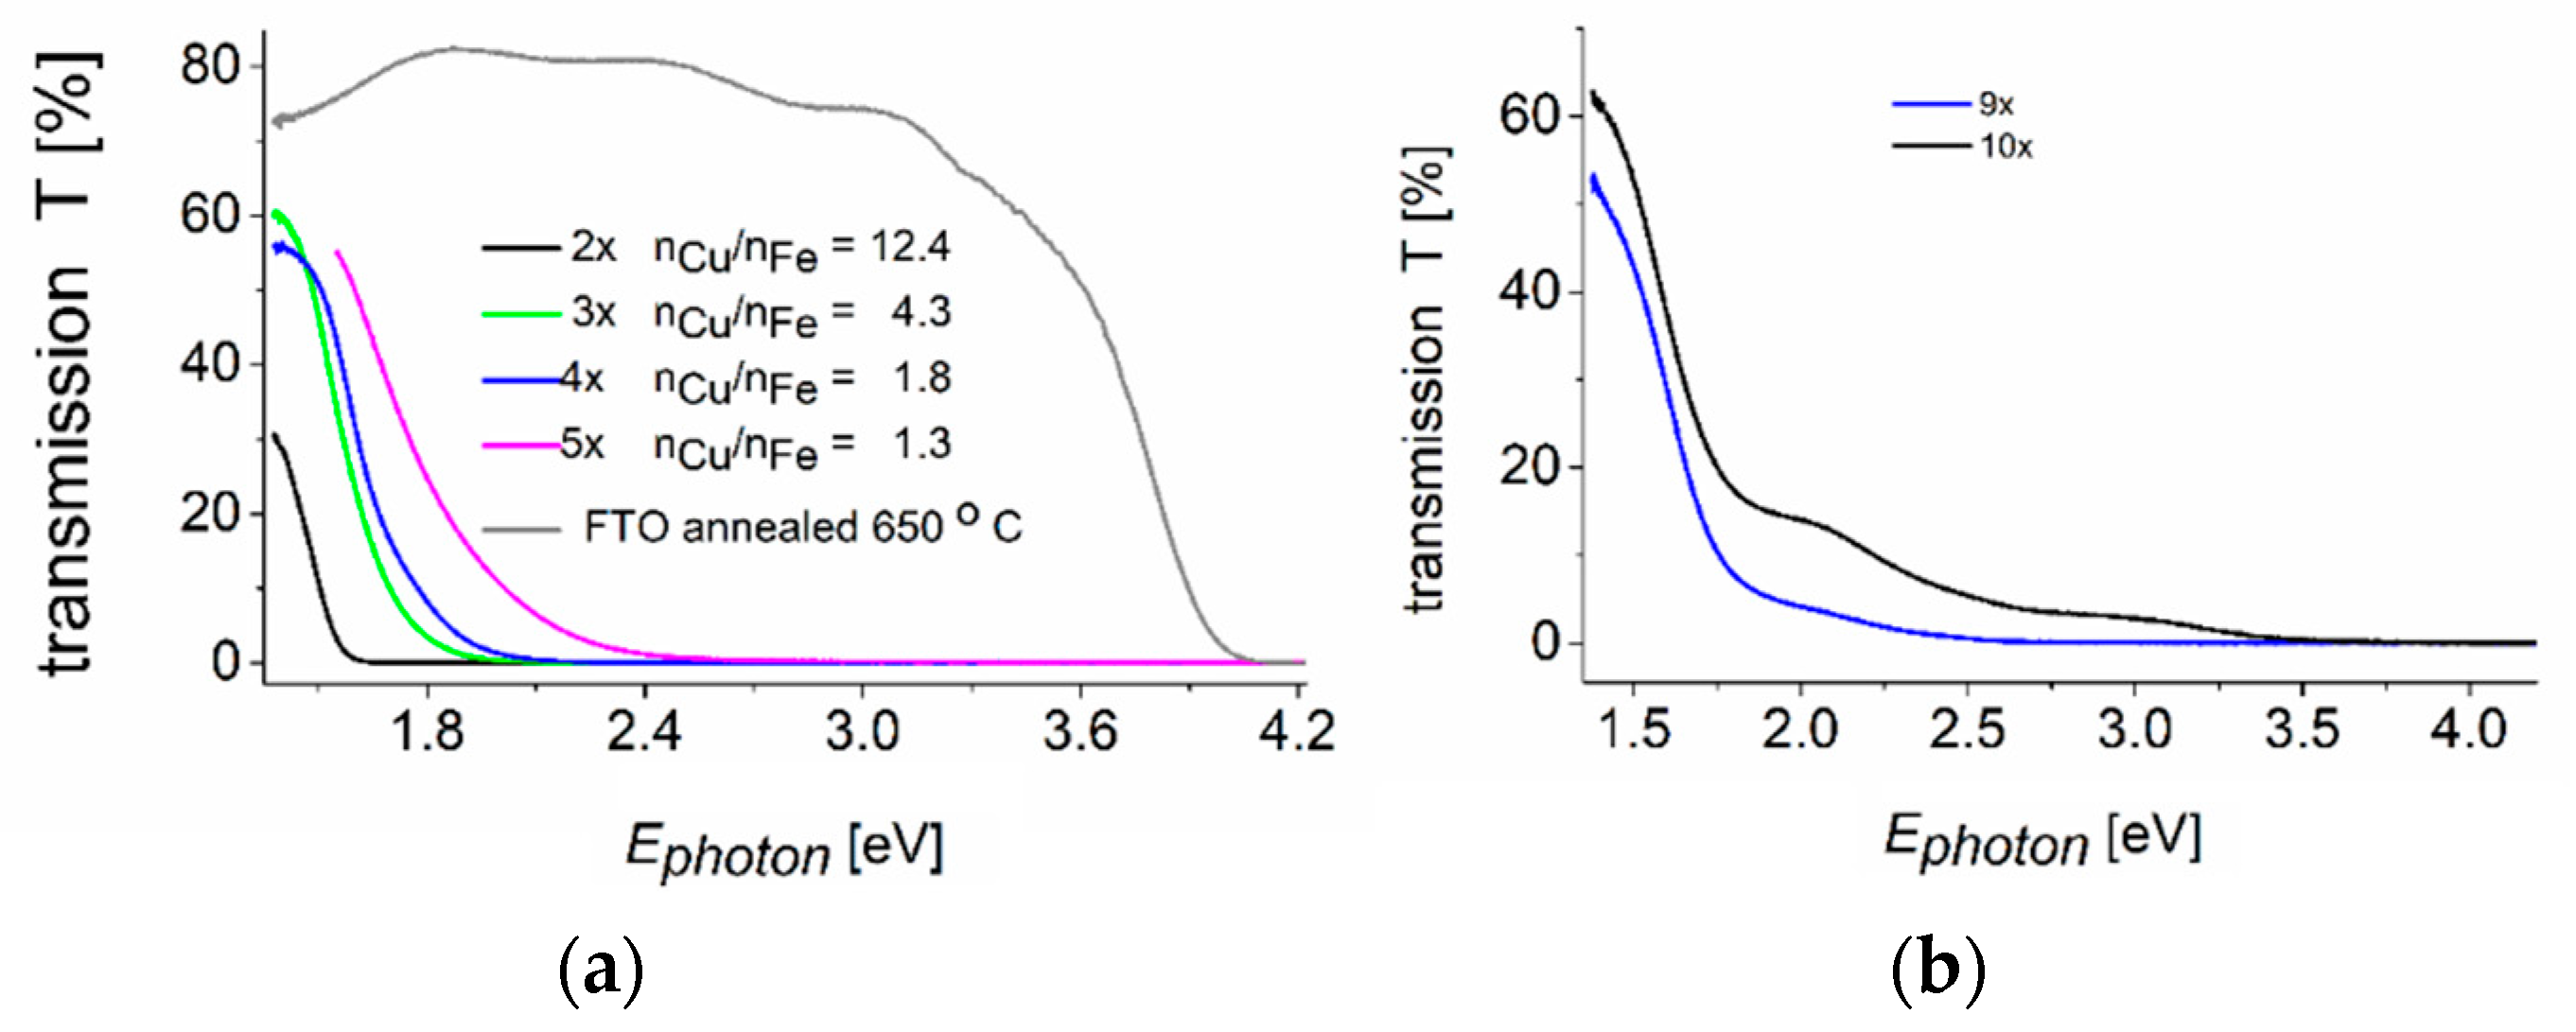
The results of measurement of optical transmission in UV-VIS region can be seen in
Figure 9 for particular deposited samples. The optical band gap can only be roughly estimated because we used only transmission spectra. All optical diagnostics was done on the films before PEC measurements. The right graph shows also optical transmission of bare FTO glass after annealing on 650 °C. It can be seen that FTO glass is still very well transparent up to 3.5 eV. The molar ratio of Cu/Fe is mentioned at each optical spectrum. Samples in the left graph 2x–5x were all annealed in air up to 650 °C. As it was shown from the diffraction experiment, sample 2x with the molar ratio
ncu/
nFe = 12.5 exhibits the crystal structure of CuO (
Figure 5). For the sample 2x the band gap was
Eg ≈ 1.5 eV, which is close to reported value of CuO crystalline material [
38]. When the iron amount grows in the films the band gap increases to the values close to
Eg ≈ 2 eV. On the right graph we can see transmission spectra of samples 9x, 10x annealed in vacuum on 650 °C, and these samples contain a large fraction of delaffosite phase (
Table 2). Samples 9x and 10x with the highest amount of delafossite phase have the band gap
Eg ≈ 1.8 eV, this is in the region typically reported for delafossite [
4]. These two samples have also
ncu/
nFe ≈ 1.

 ,
, 


