Article

Investigation of the Effects of Various Organic Solvents on the PCBM Electron Transport Layer of Perovskite Solar Cells

Department of Opto-Electronic Engineering, National Dong Hwa University, Hualien 97401, Taiwan
*
Author to whom correspondence should be addressed.
Coatings 2020, 10(3), 237; https://doi.org/10.3390/coatings10030237
Submission received: 6 February 2020 / Revised: 1 March 2020 / Accepted: 3 March 2020 / Published: 4 March 2020

Abstract

:
In this study, four organic solvents including 1,2-dichlorobenzene (DCB), chlorobenzene (CB), methylbenzene (MB), and chloroform (CF) were used as solvents in the [6,6]-phenyl-C61-butyric acid methyl ester (PCBM) electron transport layer (ETL) of perovskite solar cells (PSCs). This study observed the effects of various solvents on the surface morphology of the ETL by using an optical microscope (OM) and scanning electron microscope (SEM). The surface roughness, crystal structure, and surface element bonding of the ETL were observed using an atomic force microscope (AFM), X-ray diffractometer (XRD), and X-ray photoelectron spectroscope (XPS), respectively. The absorption spectrum of the perovskite layer was explored using an ultraviolet-visible (UV-Vis) spectrometer. The characteristics of the PSC device were analyzed in terms of its current density–voltage (J–V) curve, external quantum efficiency (EQE), and electrochemical impedance spectroscopy (EIS) measurements. The results showed that DCB is a solvent with a high boiling point, low vapor pressure, and high dielectric constant, and using DCB as the solvent for ETL, the uniformity, coverage, and surface roughness of the ETL showed better properties. The power conversion efficiency of the PSC in which DCB was used as the solvent achieved a value of 11.07%, which was higher than that of the PSCs in which other solvents were used.

1. Introduction

Energy shortages and environmental pollution are two major problems faced by humanity in the 21st century; thus, renewable energies have received attention from numerous countries. Among renewable energy sources, solar energy has the advantages of being inexhaustible, unaffected by geographical location, and of being nonpolluting, making it the most advantageous form of renewable energy. Depending on the materials used, solar cells can be classified into silicon-based solar cells [1,2], compound semiconductors [3,4,5], and organic semiconductors [6,7,8]. In recent years, perovskite solar cells (PSCs) made of perovskite structural materials have received substantial attention. The term “perovskite” is derived from an ore structure discovered in the 19th century. Its chemical formula is CaTiO3, and it consists of eight calcium atoms that form a hexahedron, in which the center point of each side contains an oxygen atom, with a titanium atom located at the center of the hexahedron. The term “perovskite” is thus also a general term that refers to materials with such crystalline structures, and the general formula for them is ABX3, where A and B are two distinct cations and X is an anion.
In 2009, Miyasaka et al. discovered that CH3NH3PbI3, an organic–inorganic hybrid perovskite structural material, has a satisfactory absorption coefficient and excellent carrier mobility. They applied this material to a dye-sensitized solar cell device structure to replace the original small-molecule dye, achieving a conversion efficiency of up to 3.8% and commencing research on PSCs [9]. Park et al. adopted perovskite material as the sensitizer for quantum dot-sensitized solar cells together with a liquid electrolyte, yielding an efficiency of 6.5% [10]. In 2012, a Swiss team led by Grätzel collaborated with a Korean team led by Park and employed the solid-state material spiro-MeOTAD as an electrolyte, developing an all-solid-state PSC with an efficiency of up to 9.7% [11]. In the same year, a British team led by Snaith developed a solution-processed PSC that replaced the conventional mesoporous TiO2 electrode with the nonconducting material Al2O3 and used CH3NH3PbI3−xClx as the light-absorbing material, producing a more satisfactory carrier mobility and stability with an efficiency of up to 10.9%; the team named these PSCs meso-superstructure solar cells [12]. In 2013, Grätzel et al. developed a two-step sequential deposition method that produced a perovskite film by spin-coating a PbI2 film and by immersing it in a CH3NH3I solution, forming a more satisfactory surface morphology and gaining an efficiency of 15% [13]. Snaith et al. produced a perovskite film through evaporation deposition, which yielded an efficiency of up to 15.4% [14]. In 2014, Yang Yang et al. optimized the PSC material parameters and used vapor-assisted deposition to enhance the efficiency to 19.3% [15]. After several years of research and development, the certified maximum conversion efficiency of PSCs has reached 25.2%. PSCs feature advantages such as low material costs and a simple production process; moreover, their ultrathin light-absorbing electrode layer (<1 μm) can be produced through a solution coating process. Accordingly, PSCs are expected to reduce power-generation costs to 1/4–1/5 that of crystalline silicon solar cells. The high efficiency, low cost, and simple production process of PSCs have transformed the field of solar cell technology. The technology for PSC preparation has not yet fully matured, and the fundamental research behind it is actively expanding, with relevant research teams enthusiastically engaged in research and development.
PSCs typically contain an electron transport layer (ETL) and a hole transport layer (HTL), which use energy-level matching to facilitate the transfer of carriers to the external circuit [16,17,18]. Therefore, apart from the perovskite active layer, the ETL and HTL play crucial roles in enhancing the power conversion efficiency (PCE) of PSC [19]. The surface uniformity, surface flatness, and surface coverage of the ETL all contribute to the PCE of the device; thus, optimizing the ETL is essential. In PSCs, common materials for ETLs are WOx, TiO2, ZnO, SnO2, [6,6]-phenyl-C61 butyric acid methyl ester (PCBM), indene-C60 bisadduct (ICBA), and tris[3-(3-pyridyl)-mesityl] borane (3TPYMB) [20]. Coating techniques for producing ETLs include spin-coating, dip-coating, spray-coating, and screen-coating [21,22,23,24]. The morphology of the charge transport layer is an important factor for charge separation and collection in PSCs. Recently, for PSCs with planner-inverted structures, morphological control of the PCBM ETLs have been actively investigated to improve the performance of the PSCs. For example, using poly (methyl methacrylate) (PMMA) as an additive in the PCBM could reduce the aggregation of PCBM, thereby increasing the PCE from 18.02% to 18.72% [25]. Using high boiling-point 1,8-diiodooctane as a solvent additive, a smooth PCBM film and improved device efficiency (12.73%) were obtained [26]. Furthermore, a solvent vapor-annealing method was used to improve the morphology of the PCBM films, and the PSC exhibited a high efficiency of 19.4% [27]. In this study, a PSC was prepared through low-temperature spin-coating. The structure of the device was composed of glass/fluorine-doped tin oxide (FTO)/poly (3,4-ethylene dioxythiophene):poly(styrene sulfonate) (PEDOT:PSS)/perovskite active layer/PCBM/Ag. Various organic solvents including 1,2-dichlorobenzene (DCB), chlorobenzene (CB), methylbenzene (MB), and chloroform (CF) were used as solvents for the ETL. The effects of these distinct solvents on the ETL and the PSC are investigated on the basis of comprehensive material assessment and device characterization to identify the most suitable solvent for the ETL, thereby achieving ETL and PSC optimization.

2. Experiments

2.1. Preparation of Perovskite Precursor Solution and ETL Solution

All chemicals are analytical-grade products purchased from commercial sources and were used as received without further purification. The perovskite precursor solution was prepared as follows: 0.5762 g of PbI2 powder (>99%, Sigma-Aldrich, St. Louis, MO, USA) and 0.1187 g of CH3NH3I (MAI) powder (>98%, Sigma-Aldrich, St. Louis, MO, USA) were added to a mixed solvent consisting of 600 μL of dimethyl sulfoxide (DMSO) (ACS grade, Echo Chemical Co., Ltd., Miaoli, Taiwan) and 400 μL of gamma-butyrolactone (GBL) (>99%, Sigma-Aldrich, St. Louis, MO, USA). The mixture was subsequently shaken for 20 min using an ultrasonic agitator, after which it was heated at 60 °C for 1 h in a nitrogen atmosphere glove box. The preparation of the perovskite precursor solution was then complete. The ETL solution was prepared by adding 0.002 g of PCBM powder (>99.5%, Sigma-Aldrich, St. Louis, MO, USA) into DCB (anhydrous, 99%, Sigma-Aldrich, St. Louis, MO, USA), CB (anhydrous, 99.8%, Sigma-Aldrich, St. Louis, MO, USA), MB (anhydrous, 99.8%, Sigma-Aldrich, St. Louis, MO, USA), or CF (Sigma-Aldrich, St. Louis, MO, USA); each of these solvents had a volume of 90 μL. The mixtures were subsequently shaken for 5 min using an ultrasonic agitator, completing the preparation of the ETL solution. Figure 1 shows the chemical structures of the DCB, CB, MB, and CF solvents. Table 1 lists the chemical formulas, physical properties, and chemical properties of the DCB, CB, MB, and CF solvents.

2.2. Fabrication of the PSC Devices

Figure 2 depicts the PSC preparation process. First, the substrate was etched and cleaned. A 0.6-cm-wide piece of Teflon tape was applied to one side of a 2 cm × 2 cm FTO glass substrate, and 3M tape was subsequently applied to the areas that were not covered by the Teflon tape. The Teflon tape was subsequently removed, and zinc powder was evenly applied to the surface of the substrate that was not covered by the 3M tape, on which hydrochloric acid was dripped to etch the area through the reaction between the FTO, zinc powder, and hydrochloric acid. Subsequently, the substrate was rinsed using deionized water to remove excess zinc powder and hydrochloric acid and was subjected to ultrasonic agitation in isopropyl alcohol for 5 min, after which it was dried using nitrogen gas. Teflon tape was subsequently applied to the nonetched area on the opposite side of the substrate (0.6 cm × 2 cm) to form a cathode to be measured, and the substrate was irradiated using a UV-ozone cleaner for 15 min to remove the organic substances on it and to increase its surface affinity. The HTL production method was as follows: the cleaned substrate was placed in a spin coater, and 50 μL of PEDOT:PSS (UR-AI4083, Uni-onward Corp., Taipei, Taiwan) was coated evenly on it through 30-s spin-coating at 4000 rpm, after which it was heated at 150 °C for 10 min. Subsequently, the perovskite active layer was produced through the following procedure: the substrate was cooled to room temperature and placed in a nitrogen atmosphere glove box (99.995%). The substrate coated with PEDOT:PSS was placed in a spin coater, and 40 μL of perovskite precursor solution was evenly applied to the surface of the substrate through two-stage spin-coating, with the first stage involving 1000-rpm rotation for 10 s and the second stage involving 7500-rpm rotation for 22 s. Toluene was injected at the 18th second of the second stage. After the spin-coating was completed, the substrate was moved onto a hot plate and heated at 100 °C for 5 min. After the substrate had cooled, spin-coating of the perovskite active layer was repeated. The ETL production process was as follows: the substrate coated with the perovskite active layer was placed in a spin coater, and 20 μL of ETL solution was evenly coated onto the surface of the substrate through spin-coating at 1750 rpm for 30 s, after which it was removed from the glove box. Finally, evaporation deposition of the Ag metal electrode was performed. A metal mask was applied to the ETL-coated substrate, which was subsequently placed in the vacuum chamber of a vapor deposition machine, where a mechanical pump was employed to pump the vacuum value to 2 × 10⁻² Torr, after which the turbine pump was activated and warmed for 2 min. The fine-pump valve was subsequently activated, and the background vacuum value was pumped to approximately 2.2 × 10⁻⁵ Torr. The current supplier was activated to gradually increase the current value to 38 A, and the baffle was opened to enable the Ag on the tungsten boat to spread onto the substrate after being heated and vaporized. The duration of evaporation deposition was 4 min, after which the baffle was closed, the current source of the evaporation deposition was turned off, and the vacuum of the chamber was broken to complete PSC device production. The active area of the PSCs in this work was 0.1 cm2.

2.3. Characterization of the ETLs and PSCs

This study comprehensively analyzed both the ETL and PSC. The effects of various solvents on the surface morphology of the ETL were observed by using an optical microscope (OM) and scanning electron microscope (SEM) (JEOL JSM-7000F, JEOL Inc., Peabody, MA, USA). The surface roughness, crystal structure, and surface element bonding of the ETL were observed using an atomic force microscope (AFM) (AutoProbe CP, Thermomicroscopes, Sunnyvale, CA, USA), X-ray diffractometer (XRD) (Rigaku D/Max-2500V, Rigaku Corp., Tokyo, Japan), and X-ray photoelectron spectroscope (XPS) (Thermo K-Alpha, Thermo Fisher Scientific, Waltham, MA, USA), respectively. The absorption spectrum of the perovskite layer was explored using an ultraviolet-visible (UV-Vis) spectrometer (Optizen Pop, Mecasys, Daejeon, Korea). This study also analyzed the PSC device comprehensively. Analysis methods included current density–voltage (J–V) curve analysis (CH Instruments 6116D, CH Instruments, Inc., Austin, TX, USA), external quantum efficiency (EQE) analysis (QE-R, Enlitech, Kaohsiung, Taiwan), and electrochemical impedance spectrum (EIS) analysis (CH Instruments 6116D, CH Instruments, Inc., Austin, USA) [28,29,30]. The J–V characteristics of the PSCs were measured under illumination of simulated AM 1.5G solar light from a 550-W xenon lamp solar simulator (ABET Technologies Sun 3000 Class AAA, Abet Technologies, Inc., Milford, CT, USA).

3. Results and Discussion

3.1. Characterization of the ETLs

After spin-coating the PCBM ETL, the effects of various solvents on the surface morphology of FTO/PEDOT:PSS/perovskite/PCBM were investigated using the OM, SEM, and AFM. The analyzed structure was a glass/FTO/PEDOT:PSS/perovskite active layer/PCBM ETL. First, initial observation of the ETL formed with various solvents was performed using the OM; the results are presented in Figure 3. A fairly flat electrode surface and uniformly dispersed PCBM were observed when DCB and CB were used as the ETL solvent. When MB was used as the ETL solvent, the electrode surface was less smooth and some patterns were formed, with observable aggregation of PCBM that could not be uniformly dispersed. When CF was adopted as the ETL solvent, the substrate exhibited more obvious patterns but less observable PCBM aggregation than when MB was employed as the solvent.
To more clearly observe the ETL surface morphology obtained using different solvents, an SEM was used, and the results are shown in Figure 4. In Figure 4a, DCB was used as the ETL solvent and fairly obvious PCBM nanostructures with an approximate width of 30 nm–40 nm (estimated from the enlarged SEM image) covered the surface of the perovskite active layer evenly. Figure 4b demonstrates the use of CB as the ELT solvent. The dispersion and coverage of PCBM were relatively uniform. In Figure 4c, MB was used as the ETL solvent. A decline in PCBM coverage was observed, with part of the perovskite active layer exposed. Figure 4d demonstrates the surface morphology obtained when CF was used as the ETL solvent. A greater decline in PCBM coverage was observed, and a greater portion of the perovskite active layer was exposed compared to Figure 4c.
According to the SEM, using MB and CF as the ETL solvent yielded relatively unsatisfactory PCBM uniformity and coverage, which might result in relatively inadequate electron transport capacity after the ETLs thus produced are made into devices. Different solvents resulted in varying ETL surface morphologies, and the key to such variations lies in the solubility of PCBM in the solvent and the volatility of the solvent. Solubility is proportional to the dielectric constant; thus, a higher dielectric constant leads to greater solubility [31]. The order of the dielectric constants of the ELT solvents was DCB > CB > CF > MB, with MB exhibiting less favorable solubility for PCBM compared with the other three solvents. DCB exhibited excellent solubility, thus producing an ELT surface that was smoother, with PCBM evenly covering the perovskite active layer. Solvent volatility is inversely proportional to the boiling point and proportional to vapor pressure. Spin-coating was adopted for the ETL in this study, after which the substrate was placed at room temperature for 2 min for the solvent to be removed through volatilization. Because the vapor pressure of CF was much higher than that of other solvents, CF had been completely volatilized before a film could be evenly applied to the perovskite active layer during the spin-coating process; this prevented the completion of spin-coating and resulted in unsatisfactory coverage. The smaller dielectric constant of MB and its lower solubility for PCBM resulted in PCBM aggregation. DCB and CB possessed higher dielectric constants and lower vapor pressures; thus, they had more satisfactory performances in terms of PCBM uniformity and coverage.
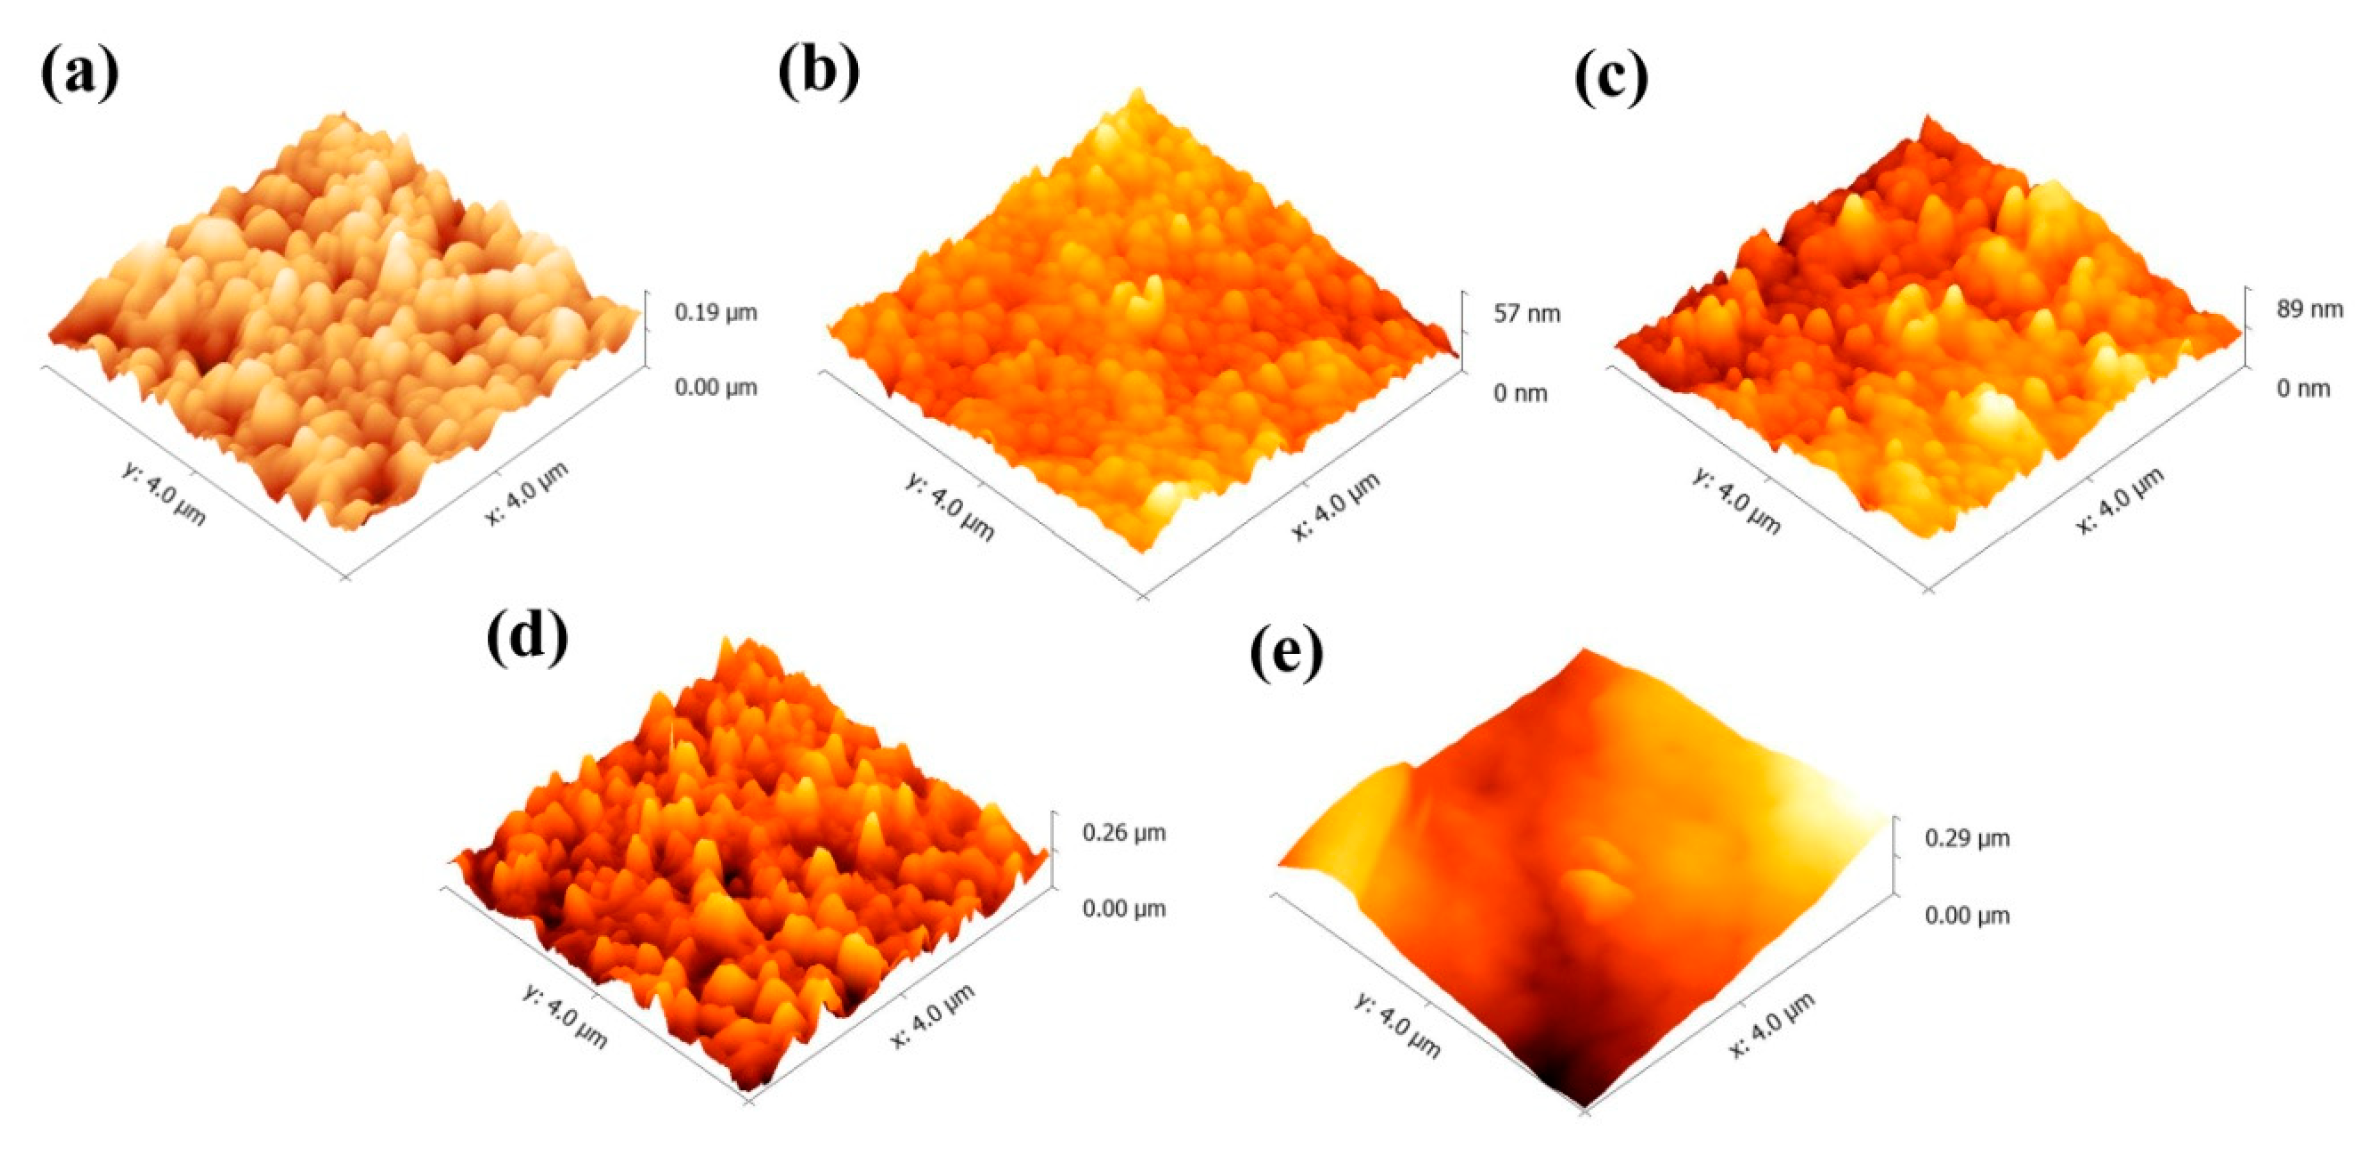
This study used an AFM to determine the surface roughness of the ETL. Flatter ETL films can reduce the number of defects in the evaporation deposition of the electrode and can enhance the photocurrent and power conversion efficiency of the device. The AFM analysis results are presented in Figure 5. Figure 5a shows the AFM image of the perovskite layer. The surface roughness of the perovskite layer was 25.4 nm. When DCB and CB were used as the ETL solvents, the surface roughness values of FTO/PEDOT:PSS/perovskite/PCBM were 5.8 nm and 13.2 nm, respectively; by comparison, when MB and CF were used as the ETL solvents, the respective surface roughness values observed were 35.2 nm and 55.7 nm. The AFM analysis results showed varying degrees of roughness resulting from the use of different solvents; specifically, DCB yielded the lowest degree of surface roughness, CB had a higher degree of roughness, MB had a notably higher degree of roughness, and CF had the highest degree of surface roughness. When CF was used as the ETL solvent, the rapid volatilization of the solvent resulted in inadequate coverage and thus yielded the greatest degree of surface roughness. When MB was used as the ETL solvent, its low solubility caused uneven PCBM dispersion, which resulted in the second highest degree of surface roughness. Regarding the surface roughness obtained from the use of DCB and CB as the ETL solvents, DCB yielded a lower degree of surface roughness and, hence, a smoother surface. This was because its boiling point and dielectric constant are higher than those of CB, while its vapor pressure is lower than that of CB. The results demonstrated that the boiling point, vapor pressure, and dielectric constant of the ETL solvent all have significant influence on the surface morphology of the ETL.
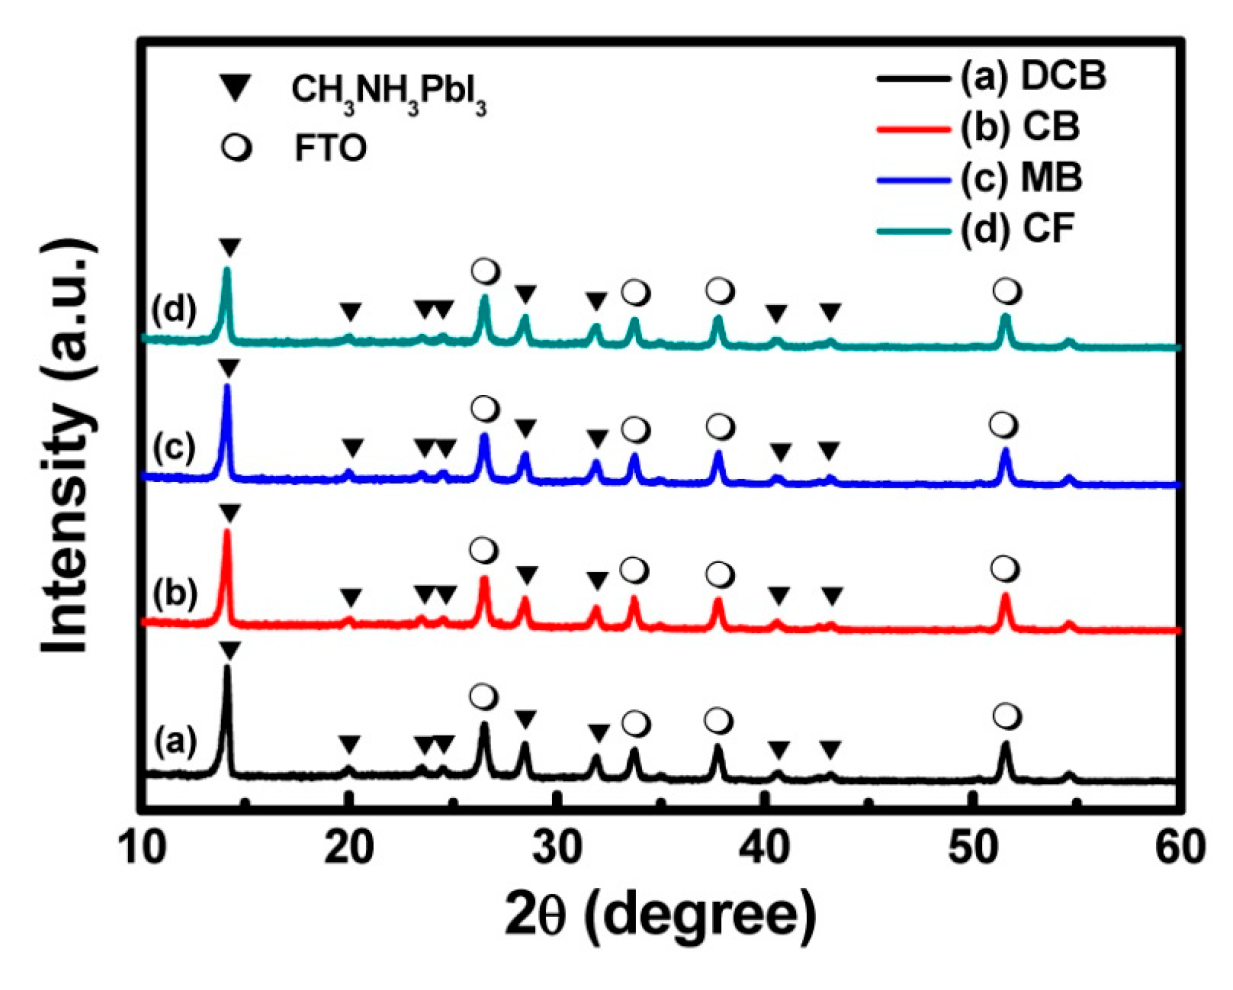
The crystal structure of the FTO/PEDOT:PSS/perovskite/PCBM was analyzed using XRD, and the analysis results are presented in Figure 6. The signals at 26.5°, 33.7°, 37.8°, and 51.6° are the characteristic peaks of the FTO, whereas the signals at 14.1°, 19.9°, 23.5°, 24.6°, 28.5°, 31.9°, 40.6°, and 43.2° are the characteristic peaks of the CH3NH3PbI3 perovskite active layer, with corresponding lattice planes of (110), (112), (211), (202), (220), (310), (224), and (314) [32]. Overall, using DCB, CB, and MB as the ETL solvents did not yield any significant difference in the signals of CH3NH3PbI3. However, using CF as the ETL solvent led to a slight decrease in the CH3NH3PbI3 crystal signals at 28.5° and 31.9° and, particularly, at 14.1°, where the crystal signal exhibited the most significant decline. The formation of CH3NH3PbI3 was proven by the diffraction peaks around 14.1°, 28.5°, and 31.9°, which were assigned to the (110), (220), and (310) lattice planes of the tetragonal perovskite structure, respectively. When CF was used as the ETL solvent, the CH3NH3PbI3 film showed lower signal peaks, which revealed the lower crystallinity of the perovskite layer. The results imply that the CF solvent might have undergone a chemical reaction with the perovskite CH3NH3PbI3, which resulted in the destruction of the original CH3NH3PbI3 crystal. Therefore, CF is less suitable as the ETL solvent.
Subsequently, surface element bonding of the ETL was analyzed using the XPS, and the spectra of O1s, I3d, and Pb4f were investigated. The XPS O1s analysis results are presented in Figure 7a: the binding energy of O was approximately 532.5 eV and was composed of the C–O and C=O bonds in PCBM. At 532.5 eV, the order of the four solvents’ signal strengths was DCB > CB > MB > CF. Because the binding energy of O existed only in PCBM, higher ETL uniformity and coverage led to a stronger O binding energy intensity. By contrast, the O binding energy was minimal when CF was used as the solvent because the ETL uniformity and coverage of CF were low. Figure 7b presents the results of XPS I3d analysis. The source of the I-bond was the CH3NH3PbI3 perovskite layer, and the signals of the binding energies 631 eV and 619.5 eV correspond to the I 3d3/2 and I 3d5/2 peaks, respectively. The order for the binding energy strength of the solvents was CF > MB > CB = DCB. Because XPS is a surface analysis technique, no I-bond signal was detected on the surface when DCB and CB were used as the ETL solvents, indicating that the ETL uniformity and coverage were satisfactory, and the bonding signal of the lower-layer CH3NH3PbI3 could not be detected. Conversely, when MB was used as the ETL solvent, the exposed CH3NH3PbI3 bond was detected because of its inadequate ETL coverage and uniformity. The signal strength detected from the use of CF as the ETL solvent was higher than that of MB, which indicated that its ETL uniformity and coverage were even less favorable. Furthermore, the bonding of Pb was analyzed, and the results are provided in Figure 8. The XPS full spectrum analysis results indicated that the signals at the binding energies of 137.1, 142.1, 284.2, 532.2, 619.2, 631.3, and 977.2 eV corresponded to the Pb 4f7/2, Pb 4f5/2, C1s, O1s, I 3d5/2, I 3d3/2, and O Auger peaks, respectively. The results indicated that, when CF was used as the ETL solvent, the signal strength of the Pb binding energy was the highest. Similar to I, the source of the Pb bond was CH3NH3PbI3, which was mainly generated from the inadequate uniformity and coverage of the ETL.
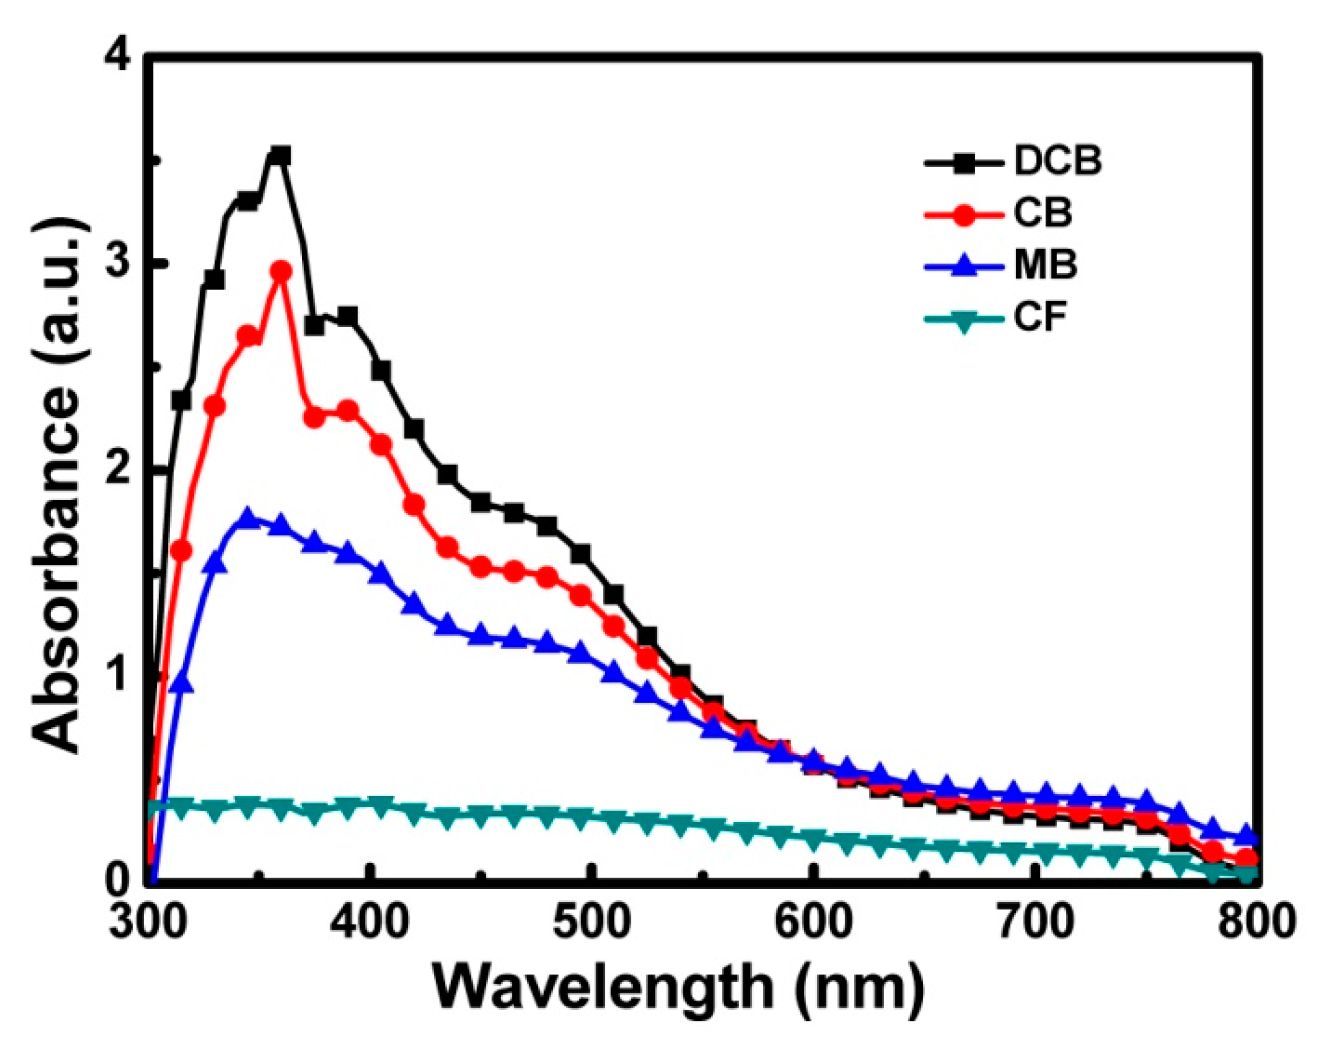
A UV/Vis spectrometer was used to explore the effects of using various solvents in the ETL on the absorption spectrum of the perovskite active layer. The analyzed wavelength range was 300–800 nm, and the results are presented in Figure 9. The experimental results indicated that the CH3NH3PbI3 perovskite active layer possessed satisfactory light absorption characteristics at 310–550 nm, and the order of the absorption spectrum intensity for the solvents was DCB > CB > MB > CF. When DCB was used as the ETL solvent, the perovskite active layer had optimal light absorption, whereas using CF as the ETL solution yielded the least satisfactory light absorption. The reason may be that CF underwent a chemical reaction with the perovskite active layer; thus, using CF as the ETL solvent caused the optical absorption properties of the perovskite active layer to become inadequate and might be detrimental to the device’s performance. This finding was consistent with the results of XRD analysis. Figure 10 presents an SEM cross-sectional image of the PSC device. The structure from bottom up consisted of FTO/PEDOT:PSS/perovskite active layer/PCBM/Ag, and the thickness values of the FTO, PEDOT:PSS, perovskite active layer, PCBM, and Ag were observed to be approximately 170.5 nm, 54.1 nm, 281.3 nm, and 187.5 nm, and 60.2 nm, respectively.

3.2. Characterization of the PSC Devices

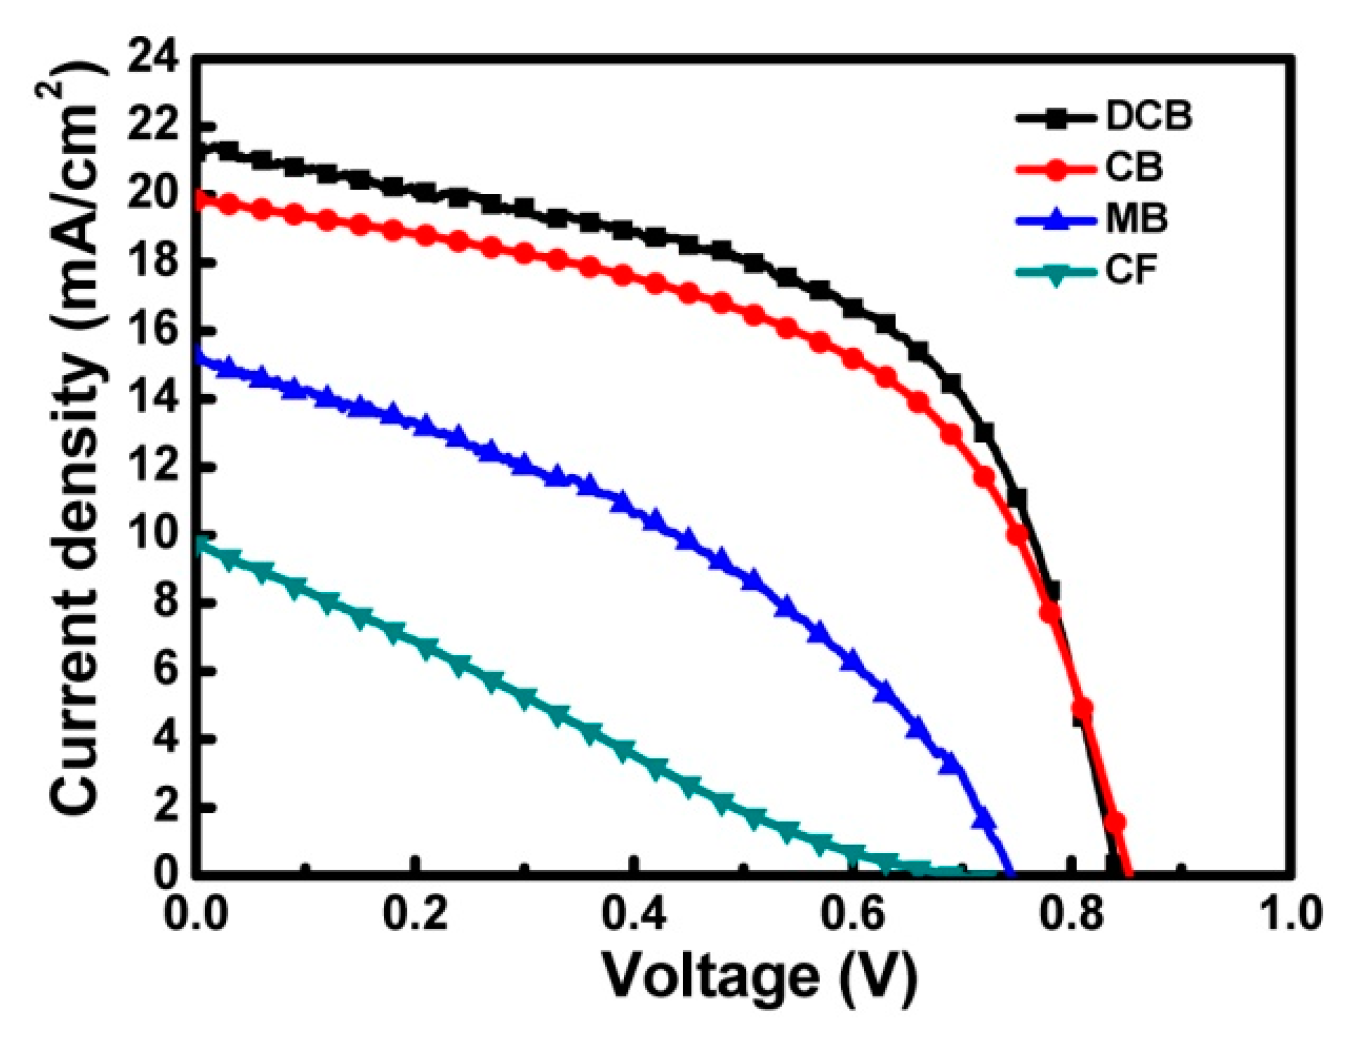
This study subsequently analyzed the effects of producing ETLs using distinct solvents on the PSC device, with the analysis methods including J−V, EQE, and EIS analyses. First, the device was subjected to J–V curve analysis to investigate the effects of using various solvents as the ETL solvent on the short-circuit current density (Jsc), open-circuit voltage (Voc), fill factor (FF), and PCE of the PSC devices. The results are presented in Figure 11 and Table 2: when using distinct solvents (DCB, CB, MB, and CF) as the ETL solvents, the solvents with the lowest and highest Jsc were CF (9.76 mA/cm2) and DCB (21.26 mA/cm2), respectively. CF and CB yielded the lowest and highest Voc (0.70 V and 0.85 V, respectively); CF and DCB possessed the lowest and highest FF (0.26 and 0.62, respectively); and CF and DCB yielded the lowest and highest PCE (1.78% and 11.07%, respectively). In the PSC device, the ETL transports the excited electrons to the electrode, and the ETL film quality is proportional to its Jsc, FF, and PCE. The J–V analysis indicated that the performance of the device (Jsc, Voc, FF, and PCE) was unideal when MB and CF were used as the ETL solvents, with these solvents yielding efficiencies of 4.74% and 1.78%, respectively, and were thus unsuitable as the ETL solvents because of factors such as ETL coverage, uniformity, and roughness. Using DCB and CB as the ETL solvents resulted in satisfactory device performance, with the Jsc of DCB being 1.41 mA/cm2 higher than that of CB, indicating more satisfactory electron transport, whereas the Voc of CB was 0.01 V higher than that of DCB. The FF performance of DCB and CB revealed the key difference between their PCEs, with DCB’s FF being 0.02 higher than that of CB. The factors affecting FF were impedance between interfaces, series resistance, and shunt resistance. AFM analysis indicated that DCB resulted in a lower surface roughness than CB did; thus, the surface was rougher when CB was used as the ETL solvent, leading to an increased resistance between the interfaces and decreased FF and, hence, the 0.95% difference in PCE between the two solvents.
This study subsequently performed EQE analysis of the PSC devices. The range of the EQE measurement wavelength was 300–800 nm, and the analysis results are presented in Figure 12. The PSC device yielded satisfactory EQE values at 380–750 nm. When using distinct solvents as the ETL solvent, the highest peaks of EQE for DCB, CB, MB, and CF were 88.5%, 83.7%, 62.3%, and 38.6%, respectively. Overall, the values of EQE and Jsc (DCB = 21.26 mA/cm2, CB = 19.85 mA/cm2, MB = 15.24 mA/cm2, and CF = 9.76 mA/cm2) showed the same trend of DCB > CB > MB > CF. EQE analysis indicated again that a satisfactory ETL had a significant influence on the electron collection and transport. With the most satisfactory performance in uniformity, coverage, and surface roughness, DCB possessed the highest EQE compared with the three other solvents and was thus the most suitable as the ETL solvent.
The impedance characteristics of the PSCs were analyzed using EIS [33]. The measurement frequency range was 20 Hz–1 MHz, and the AC amplitude was 0.01 V. Figure 13 presents the EIS analysis results. A semicircle generally appeared in the EIS analysis of the PSC and represented the impedance of the carrier transported between the ETL/perovskite active layer/HTL interfaces [34], with less impedance indicating a quicker carrier transport rate.
The experimental results demonstrated that using CF as the ETL solvent yielded a large carrier transport impedance, followed in order by MB. When DCB and CB were used as the ETL solvents, the resulting carrier transport impedances were smaller, among which the carrier transmission impedance of DCB was slightly smaller than that of CB. The only changes in this study were the use of various solvents in the ETLs; thus, the reason for the differences in the impedance values in the EIS analysis was concluded to be the influence of the solvents. The surface roughness of the ETL affected the impedance between the ETL and the electrode as well as the impedance of the carriers transported within the device. The differences in FF in the J–V curve analysis provided preliminary verification of the relationship between the ETL surface roughness and impedance, whereas the EIS analysis more clearly elucidated the differences in the ETL surface roughness with respect to the internal impedance of the device. Overall, DCB was the most satisfactory ETL solvent among the four solvents.

4. Conclusions

In this study, four organic solvents (DCB, CB, MB, and CF) were used as the solvents for PCBM ETLs to investigate their effects on the ETL and the resultant PSC devices. The PSC devices possessed a structure that comprised glass/FTO/PEDOT:PSS/CH3NH3PbI3/PCBM/Ag. Using DCB and CB as the solvents yielded a more uniform surface, whereas PCBM aggregation and a decline in PCBM coverage were observed when MB and CF were used as the solvents. The different ETL morphologies were caused by the uniformity and coverage of the ETL, which were due to the distinct solubility of PCBM in the various solvents. In addition, the volatility, boiling point, vapor pressure, and dielectric constant of the solvents also affected the ETL. According to the XRD analysis results, the crystal signal of the CH3NH3PbI3 exhibited a slight decline when CF was used as the ETL solvent. This may be attributable to a chemical reaction between the solvent CF and CH3NH3PbI3, which destroyed the original CH3NH3PbI3 crystal; thus, CF was less suitable as an ETL solvent. In terms of the analysis of the PSC device characteristics, the J–V analysis results indicated that using DCB as the ETL solvent yielded a higher Jsc, FF, and PCE (21.26 mA/cm2, 0.62, and 11.07%, respectively). According to EQE analysis, PSC had the highest EQE value (88.5%) when DCB was used as the ETL solvent; the EIS analysis results indicated that the carrier transport impedance within the device was the smallest when DCB was used as the ETL solvent. In summary, DCB is a solvent with a high boiling point, low vapor pressure, and high dielectric constant, and using it as the PCBM ETL solvent yields satisfactory ETL uniformity, coverage, and surface roughness as well as excellent device performance, thus making it the most suitable solvent for preparing the ETL of PSCs.

Author Contributions

Conceptualization, C.-H.T.; methodology, C.-H.T., C.-M.L., and C.-H.K.; validation, C.-H.T.; formal analysis, C.-H.T., C.-M.L., and C.-H.K.; investigation, C.-H.T., C.-M.L., and C.-H.K.; resources, C.-H.T.; data curation, C.-H.T., C.-M.L., and C.-H.K.; writing—original draft preparation, C.-H.T.; writing—review and editing, C.-H.T.; supervision, C.-H.T.; project administration, C.-H.T.; funding acquisition, C.-H.T. All authors have read and agreed to the published version of the manuscript.

Funding

The authors gratefully acknowledge the financial support from the Ministry of Science and Technology of Taiwan (MOST 108-2221-E-259-011).

Conflicts of Interest

The authors declare no conflict of interest.

References

  1. Goetzberger, A.; Hebling, C.; Schock, H.W. Photovoltaic materials, history, status and outlook. Mater. Sci. Eng. R Rep. 2003, 40, 1–46. [Google Scholar] [CrossRef]
  2. Rovira, P.I.; Ferlauto, A.S.; Koh, J.; Wronski, C.R.; Collins, R.W. Optics of textured amorphous silicon surfaces. J. Non-Cryst. Solids 2000, 266, 279–283. [Google Scholar] [CrossRef]
  3. Hubbard, S.M.; Cress, C.D.; Bailey, C.G.; Raffaelle, R.P.; Bailey, S.G.; Wilt, D.M. Effect of strain compensation on quantum dot enhanced GaAs solar cells. Appl. Phys. Lett. 2008, 92, 123512. [Google Scholar] [CrossRef]
  4. Qiao, S.; Liu, J.; Fu, G.; Ren, K.; Li, Z.; Wang, S.; Pan, C. ZnO nanowire based CIGS solar cell and its efficiency enhancement by the piezo-phototronic effect. Nano Energy 2018, 49, 508–514. [Google Scholar] [CrossRef]
  5. Fraga, D.; Barrachina, E.; Calvet, I.; Stoyanova, T.; Carda, J.B. Developing CIGS solar cells on glass-ceramic substrates. Mater. Lett. 2018, 221, 104–106. [Google Scholar] [CrossRef]
  6. Tang, C.W. Two-layer organic photovoltaic cell. Appl. Phys. Lett. 1986, 48, 183. [Google Scholar] [CrossRef]
  7. Lami, V.; Weu, A.; Zhang, J.; Chen, Y.; Fei, Z.; Heeney, M.; Friend, R.H.; Vaynzof, Y. Visualizing the Vertical Energetic Landscape in Organic Photovoltaics. Joule 2019, 3, 2513–2534. [Google Scholar] [CrossRef]
  8. Tsai, C.H.; Shiu, S.L.; Lin, W.C.; Chou, Y.R.; Yu, Y.H. Synthesis of reduced graphene oxide/macrocyclic ytterbium complex nanocomposites and their application in the counter electrodes of dye-sensitized solar cells. Org. Electron. 2019, 64, 166–175. [Google Scholar] [CrossRef]
  9. Kojima, A.; Teshima, K.; Shirai, Y.; Miyasaka, T. Organometal halide perovskites as visible-light sensitizers for photovoltaic cells. J. Am. Chem. Soc. 2009, 131, 6050–6051. [Google Scholar] [CrossRef]
  10. Im, J.H.; Lee, C.R.; Lee, J.W.; Park, S.W.; Park, N.G. 6.5% efficient perovskite quantum-dot-sensitized solar cell. Nanoscale 2011, 3, 4088–4093. [Google Scholar] [CrossRef] [Green Version]
  11. Kim, H.S.; Lee, C.R.; Im, J.H.; Lee, K.B.; Moehl, T.; Marchioro, A.; Moon, S.J.; Humphry-Baker, R.; Yum, J.H.; Moser, J.E.; et al. Lead iodide perovskite sensitized all-solid-state submicron thin film mesoscopic solar cell with efficiency exceeding 9%. Sci. Rep. 2012, 2, 591. [Google Scholar] [CrossRef] [PubMed] [Green Version]
  12. Lee, M.M.; Teuscher, J.; Miyasaka, T.; Murakami, T.N.; Snaith, H.J. Efficient hybrid solar cells based on meso-superstructured organometal halide perovskites. Science 2012, 338, 643–647. [Google Scholar] [CrossRef] [PubMed] [Green Version]
  13. Burschka, J.; Pellet, N.; Moon, S.J.; Humphry-Baker, R.; Gao, P.; Nazeeruddin, M.K.; Grätzel, M. Sequential deposition as a route to high-performance perovskite-sensitized solar cells. Nature 2013, 499, 316–319. [Google Scholar] [CrossRef] [PubMed]
  14. Liu, M.; Johnston, M.B.; Snaith, H.J. Efficient planar heterojunction perovskite solar cells by vapour deposition. Nature 2013, 501, 395–398. [Google Scholar] [CrossRef] [PubMed]
  15. Zhou, H.; Chen, Q.; Li, G.; Luo, S.; Song, T.B.; Duan, H.S.; Hong, Z.; You, J.; Liu, Y.; Yang, Y. Interface engineering of highly efficient perovskite solar cells. Science 2014, 345, 542–546. [Google Scholar] [CrossRef] [PubMed]
  16. Chaudhary, B.; Koh, T.M.; Febriansyah, B.; Bruno, A.; Mathews, N.; Mhaisalkar, S.G.; Soci, C. Mixed-dimensional naphthylmethylammoinium-methylammonium lead iodide perovskites with improved thermal stability. Sci. Rep. 2020, 10, 429. [Google Scholar] [CrossRef] [Green Version]
  17. Lee, P.H.; Li, B.T.; Lee, C.F.; Huang, Z.H.; Huang, Y.C.; Su, W.F. High-efficiency perovskite solar cell using cobalt doped nickel oxide hole transport layer fabricated by NIR process. Sol. Energy Mater. Sol. Cells 2020, 208, 110352. [Google Scholar] [CrossRef]
  18. Jeon, N.J.; Noh, J.H.; Yang, W.S.; Kim, Y.C.; Ryu, S.; Seo, J.; Seok, S.I. Compositional engineering of perovskite materials for high-performance solar cells. Nature 2015, 517, 476–480. [Google Scholar] [CrossRef]
  19. Li, Y.; Yan, W.; Li, Y.; Wang, S.; Wang, W.; Bian, Z.; Xiao, L.; Gong, Q. Direct observation of long electron-hole diffusion distance in CH3NH3PbI3 perovskite thin film. Sci. Rep. 2015, 5, 14485. [Google Scholar] [CrossRef]
  20. Yang, G.; Tao, H.; Qin, P.; Ke, W.; Fang, G. Recent progress in electron transport layers for efficient perovskite solar cells. J. Mater. Chem. A 2016, 4, 3970–3990. [Google Scholar] [CrossRef]
  21. Cao, K.; Zuo, Z.; Cui, J.; Shen, Y.; Moehl, T.; Zakeeruddin, S.M.; Grätzel, M.; Wang, M. Efficient screen printed perovskite solar cells based on mesoscopic TiO2/Al2O3/NiO/carbon architecture. Nano Energy 2015, 17, 171–179. [Google Scholar] [CrossRef]
  22. Huang, L.; Li, C.; Sun, X.; Xu, R.; Du, Y.; Ni, J.; Cai, H.; Li, J.; Hu, Z.; Zhang, J. Efficient and hysteresis-less pseudo-planar heterojunction perovskite solar cells fabricated by a facile and solution-saving one-step dip-coating method. Org. Electron. 2017, 40, 13–23. [Google Scholar] [CrossRef]
  23. Das, S.; Yang, B.; Gu, G.; Joshi, P.C.; Ivanov, I.N.; Rouleau, C.M.; Aytug, T.; Geohegan, D.B.; Xiao, K. High-performance flexible perovskite solar cells by using a combination of ultrasonic spray-coating and low thermal budget photonic curing. ACS Photonics 2015, 2, 680–686. [Google Scholar] [CrossRef]
  24. Oku, T.; Matsumoto, T.; Suzuki, A.; Suzuki, K. Fabrication and characterization of a perovskite-type solar cell with a substrate size of 70 mm. Coatings 2015, 5, 646–655. [Google Scholar] [CrossRef]
  25. Chen, K.; Hu, Q.; Liu, T.; Zhao, L.; Luo, D.; Wu, J.; Zhang, Y.; Zhang, W.; Liu, F.; Russell, T.P.; et al. Charge-carrier balance for highly efficient inverted planar heterojunction perovskite solar cells. Adv. Mater. 2016, 28, 10718–60724. [Google Scholar] [CrossRef] [Green Version]
  26. Liu, Z.; Lee, E.C. Solvent engineering of the electron transport layer using 1,8-diiodooctane for improving the performance of perovskite solar cells. Org. Electron. 2015, 24, 101–105. [Google Scholar] [CrossRef]
  27. Shao, Y.; Yuan, Y.; Huang, J. Correlation of energy disorder and open-circuit voltage in hybrid perovskite solar cells. Nat. Energy 2016, 1, 15001. [Google Scholar] [CrossRef]
  28. Tsai, C.H.; Lin, C.M.; Kuei, C.H. Improving the performance of perovskite solar cells by adding 1,8-diiodooctane in the CH3NH3PbI3 perovskite layer. Sol. Energy 2018, 176, 178–185. [Google Scholar] [CrossRef]
  29. Huang, J.; Gao, C.; Zhang, D.; Tian, Q.; Zhang, F.; Liu, S.F. Influence of film quality on power conversion efficiency in perovskite solar cells. Coatings 2019, 9, 622. [Google Scholar] [CrossRef] [Green Version]
  30. Yadav, P.; Prochowicz, D.; Saliba, M.; Boix, P.P.; Zakeeruddin, S.M.; Grätzel, M. Interfacial kinetics of efficient perovskite solar cells. Crystals 2017, 7, 252. [Google Scholar] [CrossRef]
  31. Gorman, W.G.; Hall, G.D. Dielectric constant correlations with solubility and solubility parameters. J. Pharm. Sci. 1964, 53, 1017–1020. [Google Scholar] [CrossRef] [PubMed]
  32. Kim, S.; Chung, T.; Bae, S.; Lee, S.W.; Lee, K.D.; Kim, H.; Lee, S.; Kang, Y.; Lee, H.S.; Kim, D. Improved performance and thermal stability of perovskite solar cells prepared via a modified sequential deposition process. Org. Electron. 2017, 41, 266–273. [Google Scholar] [CrossRef]
  33. Tsai, C.H.; Huang, W.C.; Wang, W.S.; Shih, C.J.; Chi, W.F.; Hu, Y.C.; Yu, Y.H. Reduced graphene oxide/macrocyclic iron complex hybrid materials as counter electrodes for dye-sensitized solar cells. J. Colloid Interface Sci. 2017, 495, 111–121. [Google Scholar] [CrossRef] [PubMed]
  34. Liu, D.; Li, Y.; Yuan, J.; Hong, Q.; Shi, G.; Yuan, D.; Wei, J.; Huang, C.; Tang, J.; Fung, M.K. Improved performance of inverted planar perovskite solar cells with F4-TCNQ doped PEDOT:PSS hole transport layers. J. Mater. Chem. A 2017, 5, 5701–5708. [Google Scholar] [CrossRef]
Figure 1. The chemical structures of the (a) 1,2-dichlorobenzene (DCB), (b) chlorobenzene (CB), (c) methylbenzene (MB), and (d) chloroform (CF) solvents.
Coatings 10 00237 g001
Figure 2. The fabrication process of a perovskite solar cell.
Coatings 10 00237 g002
Figure 3. The optical microscope (OM) images of [6,6]-phenyl-C61-butyric acid methyl ester (PCBM) electron transport layers (ETLs) based on the (a) DCB, (b) CB, (c) MB, and (d) CF solvents.
Coatings 10 00237 g003
Figure 4. The scanning electron microscope (SEM) images of PCBM ETLs based on the (a) DCB, (b) CB, (c) MB, and (d) CF solvents.
Coatings 10 00237 g004
Figure 5. The atomic force microscope (AFM) images of (a) the perovskite layer and PCBM ETLs based on the (b) DCB, (c) CB, (d) MB, and (e) CF solvents.
Coatings 10 00237 g005
Figure 6. The X-ray diffractometer (XRD) results for PCBM ETLs based on various solvents.
Coatings 10 00237 g006
Figure 7. The X-ray photoelectron spectroscope (XPS) (a) O1s and (b) I3d analysis results for PCBM ETLs based on various solvents.
Coatings 10 00237 g007
Figure 8. The XPS full spectrum analysis results for PCBM ETLs based on various solvents.
Coatings 10 00237 g008
Figure 9. The absorption spectra of the perovskite active layers based on various ETL solvents.
Coatings 10 00237 g009
Figure 10. The SEM cross-sectional image of the perovskite solar cell.
Coatings 10 00237 g010
Figure 11. Current density–voltage (J–V) characteristics of the perovskite solar cells (PSCs) based on various ETL solvents.
Coatings 10 00237 g011
Figure 12. External quantum efficiency (EQE) spectra of the PSCs based on various ETL solvents.
Coatings 10 00237 g012
Figure 13. Electrochemical impedance spectroscopy (EIS) Nyquist plots of the PSCs based on various ETL solvents.
Coatings 10 00237 g013
Table 1. The physical and chemical properties of the DCB, CB, MB, and CF solvents.
SolventDCBCBMBCF
FormulaC6H4Cl2C6H5ClC7H8CHCl3
Boiling point (°C)180.513111161.15
Vapor pressure (kPa)0.161.22.825.9
Dielectric Constant9.935.622.384.81
Table 2. Photovoltaic characteristics of PSCs based on various solvents for the ETL.
SolventJsc (mA/cm2)Voc (V)Fill FactorPCE (%)
DCB21.260.840.6211.07
CB19.850.850.6010.12
MB15.240.740.424.74
CF9.760.700.261.78