Precision Machining of Nimonic C 263 Super AlloyUsing WEDM

 ,
, 
Abstract
:1. Introduction
Literature Review
2. Experimental Setup and Material
2.1. Experimental Material
2.2. WEDM Machine Setup
3. Results and Discussion
3.1. Experimental Methods
3.2. Statistical Evaluation of Cutting Speed
3.3. Statistical Evaluation of Sample Surface Topography
3.4. Statistical Evaluation of the Cutting Gap Affecting the Machining Accuracy
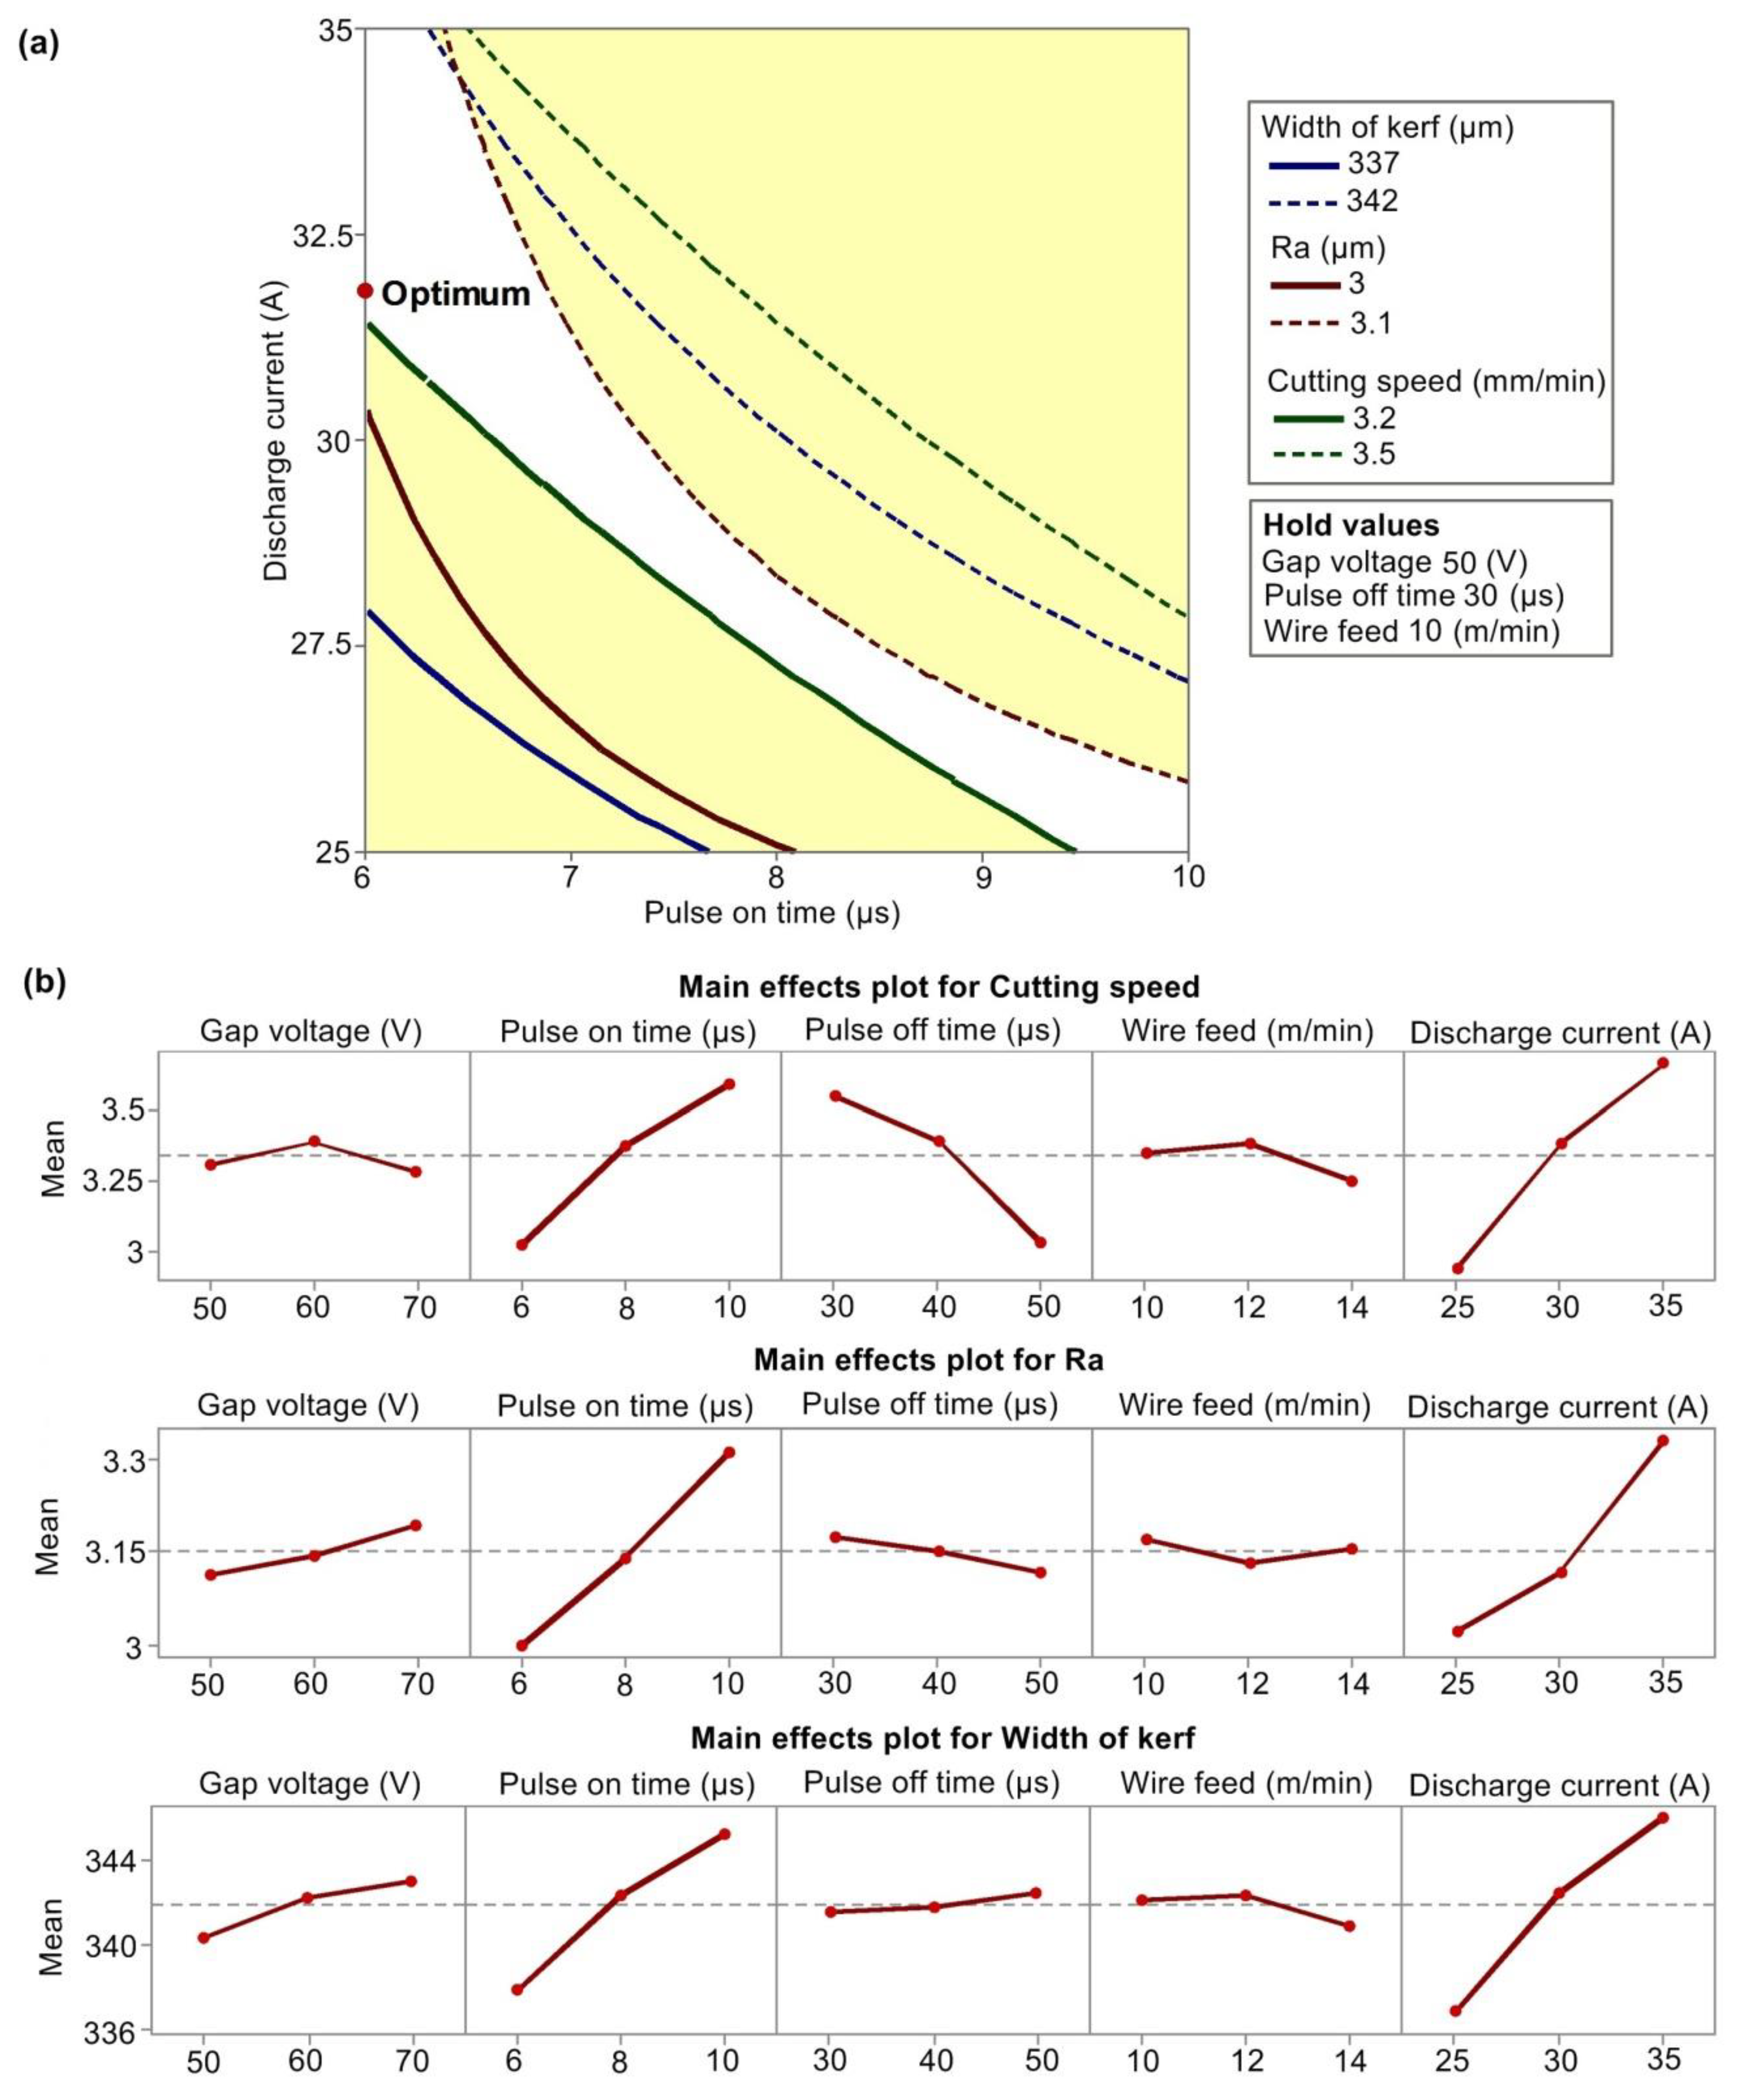
3.5. Multicriteria Optimization
3.6. The Morphology of the Machined Surfaces, the Analysis of Chemical Composition and Subsurface Area
3.7. TEM Lamella Analysis
4. Conclusions
- -
- the highest Cutting speed was achieved for Sample 14, namely 4.1 mm·min−1 with the setting of machine parameters: U = 70 V, Ton = 10 µs, Toff = 30 µs, v = 10 m·min−1 and I = 35 A, and it was found that the factors Pulse on time and Discharge current influence this response the most;
- -
- the topography analysis showed that the lowest values of the parameter Ra = 2.85 µm were achieved in Sample 20, which was machined with the following machine settings: U = 70 V, Ton = 6 µs, Toff = 50 µs, v = 14 m·min−1 and I = 25 A, while Pulse on time and Discharge current were also the factors most influencing the response;
- -
- the cut gap that most affects machining accuracy was the smallest for Sample 21 machined with machine setting parameters: U = 50 V, Ton = 6 µs, Toff = 30 µs, v = 14 m·min−1 and I = 25 A, at only 330 µm;
- -
- regression equations were created describing the dependence of the Cutting speed, Width of kerf and surface topography parameter Ra on machine setting parameters,
- -
- using multicriteria optimization, it was found and verified by testing that with the requirement of maximizing Cutting speed, and simultaneous minimization of Ra and Width of the kerf is the optimal setting of machine parameters: U = 50 V, Ton = 6 µs, Toff = 30 µs, v = 10 m·min−1 and I = 31.67 A;
- -
- the morphology analysis showed the absence of any surface or subsurface defects in the form of cracks or burnt cavities in all machined samples, with the recast layer moving to a maximum thickness of 20 µm;
- -
- the EDX analysis showed significant diffusion processes between the wire electrode and the workpiece, with 15 wt.% of Cu and about 2 wt.% of Zn adhering to the surface of the sample;
- -
- the analysis of the produced TEM lamella showed in detail its composition at the atomic level, including clear maps of individual elements, diffraction patterns in the area of the recast layer and the base material were also displayed.
Author Contributions
Funding
Acknowledgments
Conflicts of Interest
References
- Vates, U.K. Wire-EDM Process Parameters and Optimization; Springer: Berlin/Heidelberg, Germany, 2018; ISBN 978-620-2-30578-5. [Google Scholar]
- Jahan, M.P. Electrical Discharge Machining (EDM): Types, Technologies and Applications; Nova Science Publishers: Hauppauge, NY, USA, 2014. [Google Scholar]
- Kibria, G.; Jahan, M.P.; Bhattacharyya, B. Micro-Electrical Discharge Machining Processes; Springer: Singapore, 2019; ISBN 978-981-13-3074-2. [Google Scholar]
- Gowthaman, P.S.; Jeyakumar, S. A Review on machining of High Temperature Aeronautics Super-alloys using WEDM. Mater. Today Proc. 2019, 18, 4782–4791. [Google Scholar] [CrossRef]
- Koyilada, B.; Gangopadhyay, S.; Thakur, A. Comparative evaluation of machinability characteristics of Nimonic C-263 using CVD and PVD coated tools. Measurement 2016, 85, 152–163. [Google Scholar] [CrossRef]
- Mouralova, K.; Prokes, T.; Benes, L.; Sliwkova, P. Analysis of subsurface defects occurrence in abrasion resistant Creusabro steel after WEDM including the study of morphology and surface topography. Mach. Sci. Technol. 2019, 24, 274–290. [Google Scholar] [CrossRef]
- Mouralova, K.; Prokes, T.; Benes, L.; Bednar, J. The Influence of WEDM Parameters Setup on the Occurrence of Defects When Machining Hardox 400 Steel. Materials 2019, 12, 3758. [Google Scholar] [CrossRef] [Green Version]
- Mouralova, K.; Benes, L.; Bednar, J.; Zahradnicek, R.; Prokes, T.; Matousek, R.; Hrabec, P.; Fiserova, Z.; Otoupalik, J. Using a DoE for a comprehensive analysis of the surface quality and cutting speed in WED-machined hadfield steel. J. Mech. Sci. Technol. 2019, 33, 2371–2386. [Google Scholar] [CrossRef]
- Mouralova, K.; Benes, L.; Zahradnicek, R.; Bednar, J.; Hrabec, P.; Prokes, T.; Matousek, R.; Fiala, Z. Quality of surface and subsurface layers after WEDM aluminum alloy 7475-T7351 including analysis of TEM lamella. Int. J. Adv. Manuf. Technol. 2018, 99, 2309–2326. [Google Scholar] [CrossRef]
- Mouralova, K.; Prokes, T.; Benes, L. Surface and subsurface layers defects analysis after WEDM affecting the subsequent lifetime of produced components. Arabian J. Sci. Eng. 2019, 44, 7723–7735. [Google Scholar] [CrossRef]
- Goswami, A.; Kumar, J. Investigation of surface integrity, material removal rate and wire wear ratio for WEDM of Nimonic 80A alloy using GRA and Taguchi method. Eng. Sci. Technol. Int. J. 2014, 17, 173–184. [Google Scholar] [CrossRef] [Green Version]
- Mandal, A.; Dixit, A.R.; Das, A.K.; Mandal, N. Modeling and optimization of machining nimonic C-263 superalloy using multicut strategy in WEDM. Mater. Manuf. Process. 2016, 31, 860–868. [Google Scholar] [CrossRef]
- Mandal, A.; Dixit, A.R.; Chattopadhyaya, S.; Paramanik, A.; Hloch, S.; Królczyk, G. Improvement of surface integrity of Nimonic C 263 super alloy produced by WEDM through various post-processing techniques. Int. J. Adv. Manuf. Technol. 2017, 93, 433–443. [Google Scholar] [CrossRef]
- Amitesh, G.; Jatinder, K. An investigation into the machining characteristics of nimonic 80A using CNC wire-EDM. Int. J. Adv. Eng. Technol. 2012, 3, 170–174. [Google Scholar]
- Bisaria, H.; Shandilya, P. Experimental investigation on wire electric discharge machining (WEDM) of Nimonic C-263 superalloy. Mater. Manuf. Process. 2019, 34, 83–92. [Google Scholar] [CrossRef]
- Sonawane, S.A.; Kulkarni, M.L. Optimization of machining parameters of WEDM for Nimonic-75 alloy using principal component analysis integrated with Taguchi method. J. King Sauduniv. Eng. Sci. 2018, 30, 250–258. [Google Scholar] [CrossRef]
- Goswami, A.; Kumar, J. Optimization in wire-cut EDM of Nimonic-80A using Taguchi’s approach and utility concept. Eng. Sci. Technol. Int. J. 2014, 17, 236–246. [Google Scholar] [CrossRef] [Green Version]
- Kumar, V.; Jangra, K.K.; Kumar, V.; Sharma, N. WEDM of nickel based aerospace alloy: Optimization of process parameters and modelling. Int. J. Interact. Des. Manuf. (IJIDeM) 2017, 11, 917–929. [Google Scholar] [CrossRef]
- Singh, B.; Misra, J.P. Empirical modelling of wear ratio during WEDM of nimonic 263. Mater. Today Proc. 2018, 5, 23612–23618. [Google Scholar] [CrossRef]
- Ezilarasan, C.; Velayudham, A. Effect of machining parameters on surface integrity in machining Nimonic C-263 super alloy using whisker-reinforced ceramic insert. J. Mater. Eng. Perform. 2013, 22, 1619–1628. [Google Scholar] [CrossRef]
- Mouralova, K. Moderní Technologie Drátového Elektroerozivního Řezání Kovových Slitin. Ph.D. Thesis, Brno University of Technology, Brno, Czech Republic, 2015. [Google Scholar]
- Montgomery, D.C. Design and Analysis of Experiments; John Wiley & Sons: Hoboken, NJ, USA, 2017; ISBN 9781119113478. [Google Scholar]
- ISO25178-2. Geometrical Product Specifications (GPS)—Surface Texture: Areal-Part 2: Terms, Definitions and Surface Texture Parameters; International Organization for Standardization: Geneva, Switzerland, 2012. [Google Scholar]
- ISO 4287. Geometrical Product Specifications (GPS)-Surface Texture: Profile Method—Terms, Definitions and Surface Texture Parameters; International Organization for Standardization: Geneva, Switzerland, 1997. [Google Scholar]
- Werner, A. Method for enhanced accuracy in machining curvilinear profiles on wire-cut electrical discharge machines. Precis. Eng. 2016, 44, 75–80. [Google Scholar] [CrossRef]
- Mouralova, K.; Kovar, J.; Klakurkova, L.; Prokes, T. Effect of Width of Kerf on Machining Accuracy and Subsurface Layer After WEDM. J. Mater. Eng. Perform. 2018, 27, 1908–1916. [Google Scholar] [CrossRef]
- Goswami, A.; Kumar, J. Surface topography and Kerf study of Nimonic 80A using Wire-cut EDM. Mater. Sci. Forum 2015, 808, 35–41. [Google Scholar] [CrossRef]
- McGeough, J.A. Advanced Methods of Machining; Springer Science & Business Media: Berlin, Germany, 1988. [Google Scholar]
- Singh, B.; Misra, J.P. Empirical modeling of cutting speed during WEDM of nimonic 263. J. Phys. Conf. Ser. 2019, 1240, 012035. [Google Scholar] [CrossRef]


| Parameter | Gap Voltage | Pulse onTime | Pulse off Time | Wire Feed | Discharge Current |
|---|---|---|---|---|---|
| (V) | (µs) | (µs) | (m·min−1) | (A) | |
| Level 1 | 50 | 6 | 50 | 10 | 25 |
| Level 2 | 60 | 8 | 40 | 12 | 30 |
| Level 3 | 70 | 10 | 30 | 14 | 35 |
| Number of Sample | Gap voltage (V) | Pulse on Time (µs) | Pulse off Time (µs) | Wire Feed (m·min−1) | Discharge Current (A) | Cutting speed (mm·min−1) | Number of Sample | Gap voltage (V) | Pulse on Time (µs) | Pulse off Time (µs) | Wire Feed (m·min−1) | Discharge Current (A) | Cutting Speed (mm·min−1) |
|---|---|---|---|---|---|---|---|---|---|---|---|---|---|
| 1 | 70 | 8 | 40 | 12 | 30 | 3.4 | 18 | 60 | 8 | 40 | 12 | 30 | 3.4 |
| 2 | 60 | 8 | 30 | 12 | 30 | 3.6 | 19 | 60 | 8 | 40 | 12 | 30 | 3.4 |
| 3 | 60 | 8 | 40 | 12 | 25 | 2.95 | 20 | 70 | 6 | 50 | 14 | 25 | 2.35 |
| 4 | 60 | 10 | 40 | 12 | 30 | 3.9 | 21 | 50 | 6 | 30 | 14 | 25 | 3 |
| 5 | 50 | 8 | 40 | 12 | 30 | 3.3 | 22 | 60 | 8 | 40 | 12 | 30 | 3.4 |
| 6 | 60 | 8 | 50 | 12 | 30 | 3 | 23 | 70 | 10 | 30 | 14 | 25 | 3.3 |
| 7 | 60 | 6 | 40 | 12 | 30 | 3 | 24 | 50 | 6 | 50 | 10 | 25 | 2.4 |
| 8 | 60 | 8 | 40 | 12 | 35 | 3.85 | 25 | 60 | 8 | 40 | 12 | 30 | 3.4 |
| 9 | 60 | 8 | 40 | 10 | 30 | 3.4 | 26 | 50 | 10 | 50 | 14 | 25 | 2.9 |
| 10 | 60 | 8 | 40 | 14 | 30 | 3.35 | 27 | 50 | 10 | 30 | 10 | 25 | 3.5 |
| 11 | 60 | 8 | 40 | 12 | 30 | 3.4 | 28 | 50 | 6 | 50 | 14 | 35 | 3 |
| 12 | 50 | 6 | 30 | 10 | 35 | 3.7 | 29 | 50 | 10 | 50 | 10 | 35 | 4 |
| 13 | 70 | 10 | 50 | 10 | 25 | 2.9 | 30 | 70 | 6 | 30 | 14 | 35 | 3.6 |
| 14 | 70 | 10 | 30 | 10 | 35 | 4.1 | 31 | 50 | 10 | 30 | 14 | 35 | 4 |
| 15 | 60 | 8 | 40 | 12 | 30 | 3.4 | 32 | 60 | 8 | 40 | 12 | 30 | 3.4 |
| 16 | 70 | 6 | 50 | 10 | 35 | 3 | 33 | 70 | 6 | 30 | 10 | 25 | 3.2 |
| 17 | 70 | 10 | 50 | 14 | 35 | 3.75 | 3.4 |
| Cutting Speed (mm/min) | Contribution | Effect | p-Value |
|---|---|---|---|
| Model | 97.30% | 0 | |
| Linear | 91.89% | 0 | |
| Pulse on time (µs) | 26.19% | 0.5667 | 0 |
| Pulse off time (µs) | 22.24% | −0.5222 | 0 |
| Wire speed (m/min | 0.91% | −0.1056 | 0.009 |
| Discharge current (A) | 42.54% | 0.7222 | 0 |
| Square | 1.55% | 0.001 | |
| Pulse off time (µs)*Pulse offtime(µs) | 1.55% | −0.2044 | 0.001 |
| 2-Way Interaction | 3.86% | 0 | |
| Pulse on time (µs)*Pulse off time (µs) | 2.22% | 0.1750 | 0 |
| Pulse on time (µs)*Discharge current (A) | 0.92% | 0.1125 | 0.009 |
| Pulse off time (µs)*Discharge current (A) | 0.72% | 0.1000 | 0.018 |
| Error | 2.70% | ||
| Lack-of-Fit | 2.70% | Impossible to determine | |
| Pure Error | 0.00% | ||
| Total | 100.00% |
| Ra (µm) | Contribution | Effect | p-Value |
|---|---|---|---|
| Model | 78.22% | 0 | |
| Linear | 61.84% | 0 | |
| Gap voltage(V) | 1.97% | 0.0794 | 0.137 |
| Pulse on time (µs) | 29.81% | 0.3092 | 0 |
| Pulse offtime (µs) | 0.95% | −0.0553 | 0.296 |
| Discharge current(A) | 29.11% | 0.3056 | 0 |
| 2-Way Interaction | 16.39% | 0.001 | |
| Gap voltage(V)*Pulse offtime (µs) | 6.49% | −0.1530 | 0.01 |
| Pulse on time (µs)*Discharge current(A) | 9.90% | 0.1890 | 0.002 |
| Error | 21.78% | ||
| Lack-of-Fit | 19.93% | 0.149 | |
| PureError | 1.84% | ||
| Total | 100.00% |
| Width of Kerf (µm) | Contribution | Effect | p-Value |
|---|---|---|---|
| Model | 85.28% | 0 | |
| Linear | 75.47% | 0 | |
| Gap voltage(V) | 3.71% | 2.667 | 0.017 |
| Pulse on time (µs) | 28.05% | 7.333 | 0 |
| Pulse offtime (µs) | 0.41% | 0.889 | 0.401 |
| Discharge current(A) | 43.30% | 9.111 | 0 |
| 2-Way Interaction | 9.81% | 0.001 | |
| Pulse on time (µs)*Discharge current(A) | 4.53% | 3.125 | 0.009 |
| Pulse offtime (µs)*Discharge current(A) | 5.28% | −3.375 | 0.005 |
| Error | 14.72% | ||
| Lack-of-Fit | 12.30% | 0.454 | |
| PureError | 2.41% | ||
| Total | 100.00% |
| Response | Fit | 95% CI | 95% PI | Test |
|---|---|---|---|---|
| Width of kerf(µm) | 338.02 | (335.91; 340.14) | (333.01; 343.04) | 341 |
| Ra (µm) | 2.9264 | (2.8084; 3.0444) | (2.6715; 3.1814) | 2.967 |
| Cutting speed (mm/min) | 3.4975 | (3.4077; 3.5873) | (3.3117; 3.6833) | 3.4 |
| EDX 1 | EDX 2 | EDX 3 | EDX 4 | |||||
|---|---|---|---|---|---|---|---|---|
| Element | Atomic Fraction (%) | Atomic Error (%) | Atomic Fraction (%) | Atomic Error (%) | Atomic Fraction (%) | Atomic Error (%) | Atomic Fraction (%) | Atomic Error (%) |
| S | 0.26 | 0.07 | 0.17 | 0.06 | 0.33 | 0.11 | 0.17 | 0.09 |
| C | 0.06 | 0.02 | 1.37 | 0.33 | 0.70 | 0.17 | 1.24 | 0.29 |
| Ti | 2.30 | 0.43 | 2.32 | 0.43 | 2.29 | 0.42 | 4.28 | 0.76 |
| Cr | 22.23 | 4.12 | 21.71 | 4.02 | 21.78 | 4.01 | 19.86 | 3.60 |
| Co | 18.04 | 3.35 | 17.57 | 3.25 | 17.73 | 3.26 | 16.37 | 2.92 |
| Ni | 47.70 | 8.85 | 47.00 | 8.70 | 46.72 | 8.61 | 42.07 | 7.59 |
| Cu | 5.16 | 0.96 | 4.64 | 0.86 | 6.26 | 1.15 | 9.83 | 1.75 |
| Zn | 0.00 | 0.00 | 0.00 | 0.00 | 0.30 | 0.06 | 0.96 | 0.17 |
| Mo | 3.20 | 0.58 | 3.04 | 0.55 | 3.29 | 0.59 | 3.27 | 0.57 |
| Al | 0.39 | 0.09 | 0.66 | 0.16 | 0.46 | 0.11 | 1.09 | 0.25 |
| B | 0.00 | 0.06 | 0.91 | 0.17 | 0.00 | 0.09 | 0.00 | 0.16 |
| Si | 0.13 | 0.03 | 0.33 | 0.08 | 0.15 | 0.03 | 0.38 | 0.09 |
| Fe | 0.50 | 0.09 | 0.28 | 0.05 | 0.26 | 0.05 | 0.48 | 0.09 |
| Mn | 0.03 | 0.01 | 0.00 | 0.00 | 0.00 | 0.01 | 0.00 | 0.00 |
© 2020 by the authors. Licensee MDPI, Basel, Switzerland. This article is an open access article distributed under the terms and conditions of the Creative Commons Attribution (CC BY) license (http://creativecommons.org/licenses/by/4.0/).
Share and Cite
Mouralova, K.; Benes, L.; Bednar, J.; Zahradnicek, R.; Prokes, T.; Fiala, Z.; Fries, J. Precision Machining of Nimonic C 263 Super AlloyUsing WEDM. Coatings 2020, 10, 590. https://doi.org/10.3390/coatings10060590
Mouralova K, Benes L, Bednar J, Zahradnicek R, Prokes T, Fiala Z, Fries J. Precision Machining of Nimonic C 263 Super AlloyUsing WEDM. Coatings. 2020; 10(6):590. https://doi.org/10.3390/coatings10060590
Chicago/Turabian StyleMouralova, Katerina, Libor Benes, Josef Bednar, Radim Zahradnicek, Tomas Prokes, Zdenek Fiala, and Jiri Fries. 2020. "Precision Machining of Nimonic C 263 Super AlloyUsing WEDM" Coatings 10, no. 6: 590. https://doi.org/10.3390/coatings10060590