Article

Polyimide Surface Modification Using He-H2O Atmospheric Pressure Plasma Jet-Discharge Power Effect

by
Essam Abdel–Fattah
1,2,* and
Mazen Alshaer
1,3
1
Physics Department, College of Science and Humanities, Prince Sattam Bin Abdulaziz University, P.O. 173, Al-Kharj 11942, Saudi Arabia
2
Physics Department, Faculty of Science, Zagazig University, Zagazig 44519, Egypt
3
Geobiosciences, Geotechnologies and Geoengineering Research Center, Campus de Santiago, University of Aveiro, 3810-193 Aveiro, Portugal
*
Author to whom correspondence should be addressed.
Coatings 2020, 10(7), 662; https://doi.org/10.3390/coatings10070662
Submission received: 17 June 2020 / Revised: 6 July 2020 / Accepted: 6 July 2020 / Published: 9 July 2020
(This article belongs to the Special Issue Surface Plasma Treatments)

Abstract

:
The atmospheric pressure He- H 2 O plasma jet has been analyzed and its effects on the Kapton polyimide surface have been investigated in terms of discharge power effect. The polyimide surfaces before and after plasma treatment were characterized using atomic force microscopy (AFM), X-ray photoelectrons spectroscopy (XPS) and contact angle. The results showed that, increasing the discharge power induces remarkable changes on the emission intensity, rotational and vibrational temperatures of He- H 2 O plasma jet. At the low discharge power ≤5.2 W, the contact angle analysis of the polyimide surface remarkably decrease owing to the abundant hydrophilic polar C=O and N–C=O groups as well as increase of surface roughness. Yet, plasma treatment at high discharge power ≥5.2 W results in a slight decrease of the surface wettability together with a reduction in the surface roughness and polar groups concentrations.

1. Introduction

Nowadays, flexible electronics, such as wearable health monitoring devices, flexible solar cells, medical implants, and flexible displays, have great interest over the conventional silicon-based semiconductor technology as it is easily conform to curved surfaces and is stretchable [1,2]. The widespread applications of flexible electronics has resulted in active research in the polymer-based electronics [3,4,5,6]. Polyimide is considered to be a promising flexible substrate due to its excellent optical, mechanical, thermal stability and low dielectric constant properties [7,8]. Yet, it is seldom used in its pristine form, as pristine polyimide surface is usually inert and partially hydrophobic. Thus, the inherited polyimide surface characters lead to poor wettability and/or a weak inter-facial interaction between polyimide (as flexible substrate) and the metal/semiconductor pattern. That is why surface modification of the polyimide is an important process which enables full usage of the relatively excellent polyimide’s bulk properties [9].
So far, various surface treatment techniques have been proposed to modify polyimide surface, such as wet chemical treatment [10,11], ultraviolet radiation graft [12], laser and ion beam treatment [13,14]. Wet chemical treatment improve the surface roughness and hence yield better mechanical interlocking. The increasing environmental awareness and time constraints has prompted searching for new eco-friendly technology to improve surface characteristics of polyimide surface. Plasma technology has been proposed as an efficient technique to modify surfaces [15,16,17,18,19,20]. Plasma technology of surface modification has an advantage as it is dry, efficient, rapid, clean with no residual solvents, and its surface penetration limited to several angstroms [18]. In contrast to laser and UV radiation treatment methods, plasma can introduce a wide range of functional groups on the polyimide surface. Plasma is composed of a reactive species such as ions, electrons and radicals. These active species interact with the exposed surfaces and expect to induce modifications to the surface morphology as well as the surface chemistry. The route of surface modifications depends on the plasma discharge parameters. In other words, the specific mechanism or the role of plasma species on polymer surface treatment is still a debatable issue. For better control of the treatment processes, it is essential to correlate between the discharge parameters and the physical and chemical properties of the polyimide surface. To the authors’ knowledge, the effect of the discharge power on the plasma parameters as well as the polyimide surface has not been addressed yet. Plasma plays a crucial role in heating the polymer to be treated. Thus, accurate measurement of the gas temperature in the plasma is vital, since gas temperature strongly influences the sample bulk properties. At atmospheric pressure conditions, the gas temperature is comparable to the rotational temperature T rot of gas molecules owing to their fast collisional relaxation [21]. In the current work, polymide polymers samples are treated by atmospheric pressure He/ H 2 O plasma mixture. The plasma treatment was performed at various discharge power values, fixed treatment time of 30 s and gas flow rate. The pristine and plasma treated polymide samples were characterized by atomic force microscopy (AFM), X-ray photoelectron emission spectroscopy (XPS) and contact angles (CA) measurements.

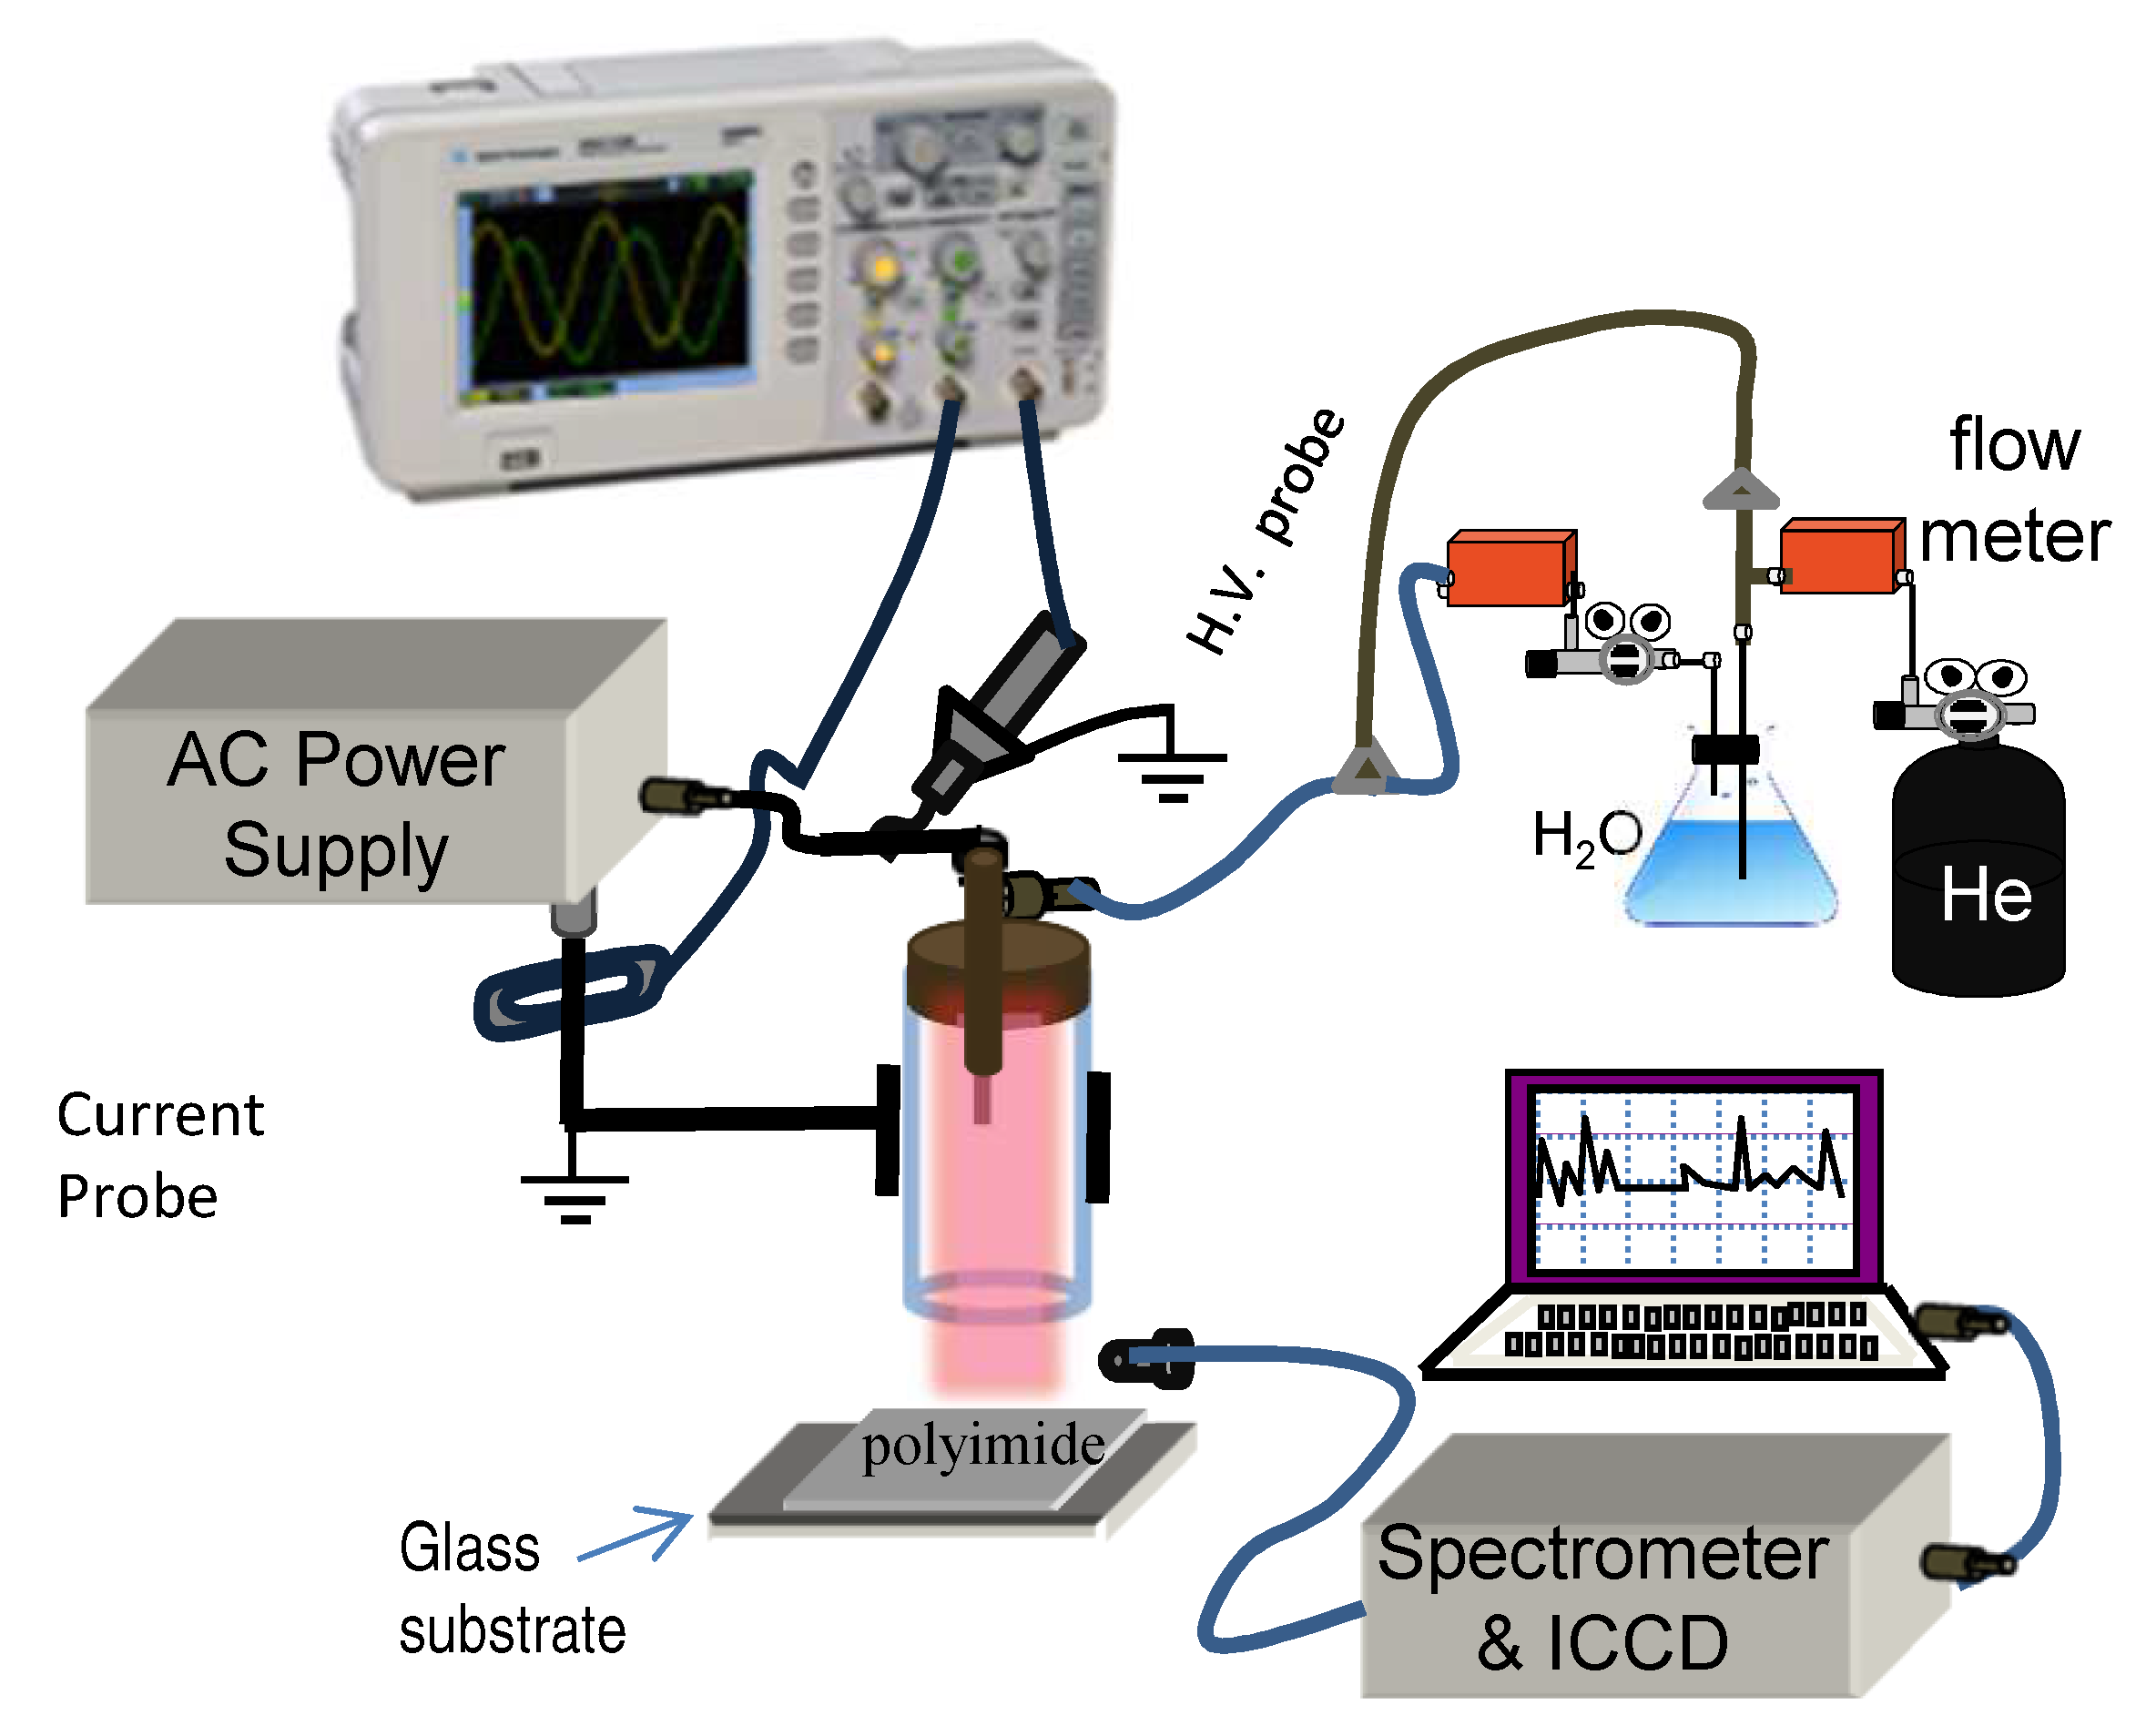
2. Materials and Methods

The atmospheric pressure plasma jet APPJ set-up is shown in Figure 1. The APPJ set-up is similar to that described in [18]; The discharge power (18 kHz) is applied to a tungsten wire (1 mm diam.) placed at the center of a quartz capillary tube of 2.5 mm in diameter. The tungsten wire acts as a power electrode, while the grounded electrode is a copper strip wrapped on the outer diameter of quartz capillary tube. The discharge generated inside the quartz tube then with gas flow, it can be blown outside the tube orifice. The He- H 2 O vapour mixture is introduced to the plasma jet via a bubbling system containing distilled water, carried by a secondary He flow. The H 2 O vapour content in the He- H 2 O vapour plasma jet is adjusted to be 0.15% of the total flow rate. The total He- H 2 O flow rate delivered at a flow rate 10 L/min is controlled by (Darhor) flow meter. The discharge power V waveform at the discharge electrode was measured using high-power probe 1000:1 (P6015A), directly attached to the tungsten wire; while the discharge total current I was monitored using current probe (Tektronix TCP202, Tektronix, OR, USA). The total discharge power ( V p p ) and current waveforms are displayed on digital oscilloscope (DPO4054B, Tektronix, OR, USA). The polyimide samples to be treated were cut-off from commercial Kapton tape, washed by deionized (DI) water in ultrasonic cleaner for 10 min and dried. The samples were placed on glass plate at distance of 5 mm from the jet orifice.
The plasma emission spectra were measured using a Ocean Optics USB2000 spectrometer (Ocean Optics, Winter Park, FL, USA) equipped with a intensified charge-coupled device (ICCD), with a spectral range of 240–900 nm. The 2 nd positive system of N 2 ( C 3 Π u B 3 Π g ) , ν = 1 in range of 345–362 nm, have been used to determine the T rot and T vib using SPECAIR software (version 3.0) [22]. The chemical composition of the pristine and plasma treated polyimide surfaces were measured by X-ray photoelectron spectroscopy, using a flood gun for charge compensation. The XPS spectra and data analysis including peak fitting were performed by Thermo Avantage software (version 5.932). The surface morphology of the pristine and plasma treated polyimide films were investigated with atomic force microscopy (AFM, Bruker Icon Dimension, Billerica, MA, USA), with ultra-sharp silicon tip. The images were collected utilizing contact mode operated in the open air. For contact angle measurements 10 μ L of blue ink, deionized (DI) water and glycerol were dropped individually on the top of polyimide samples and the contact angle was estimated using sessile drop technique with a digital microscope.

3. Results and Discussion

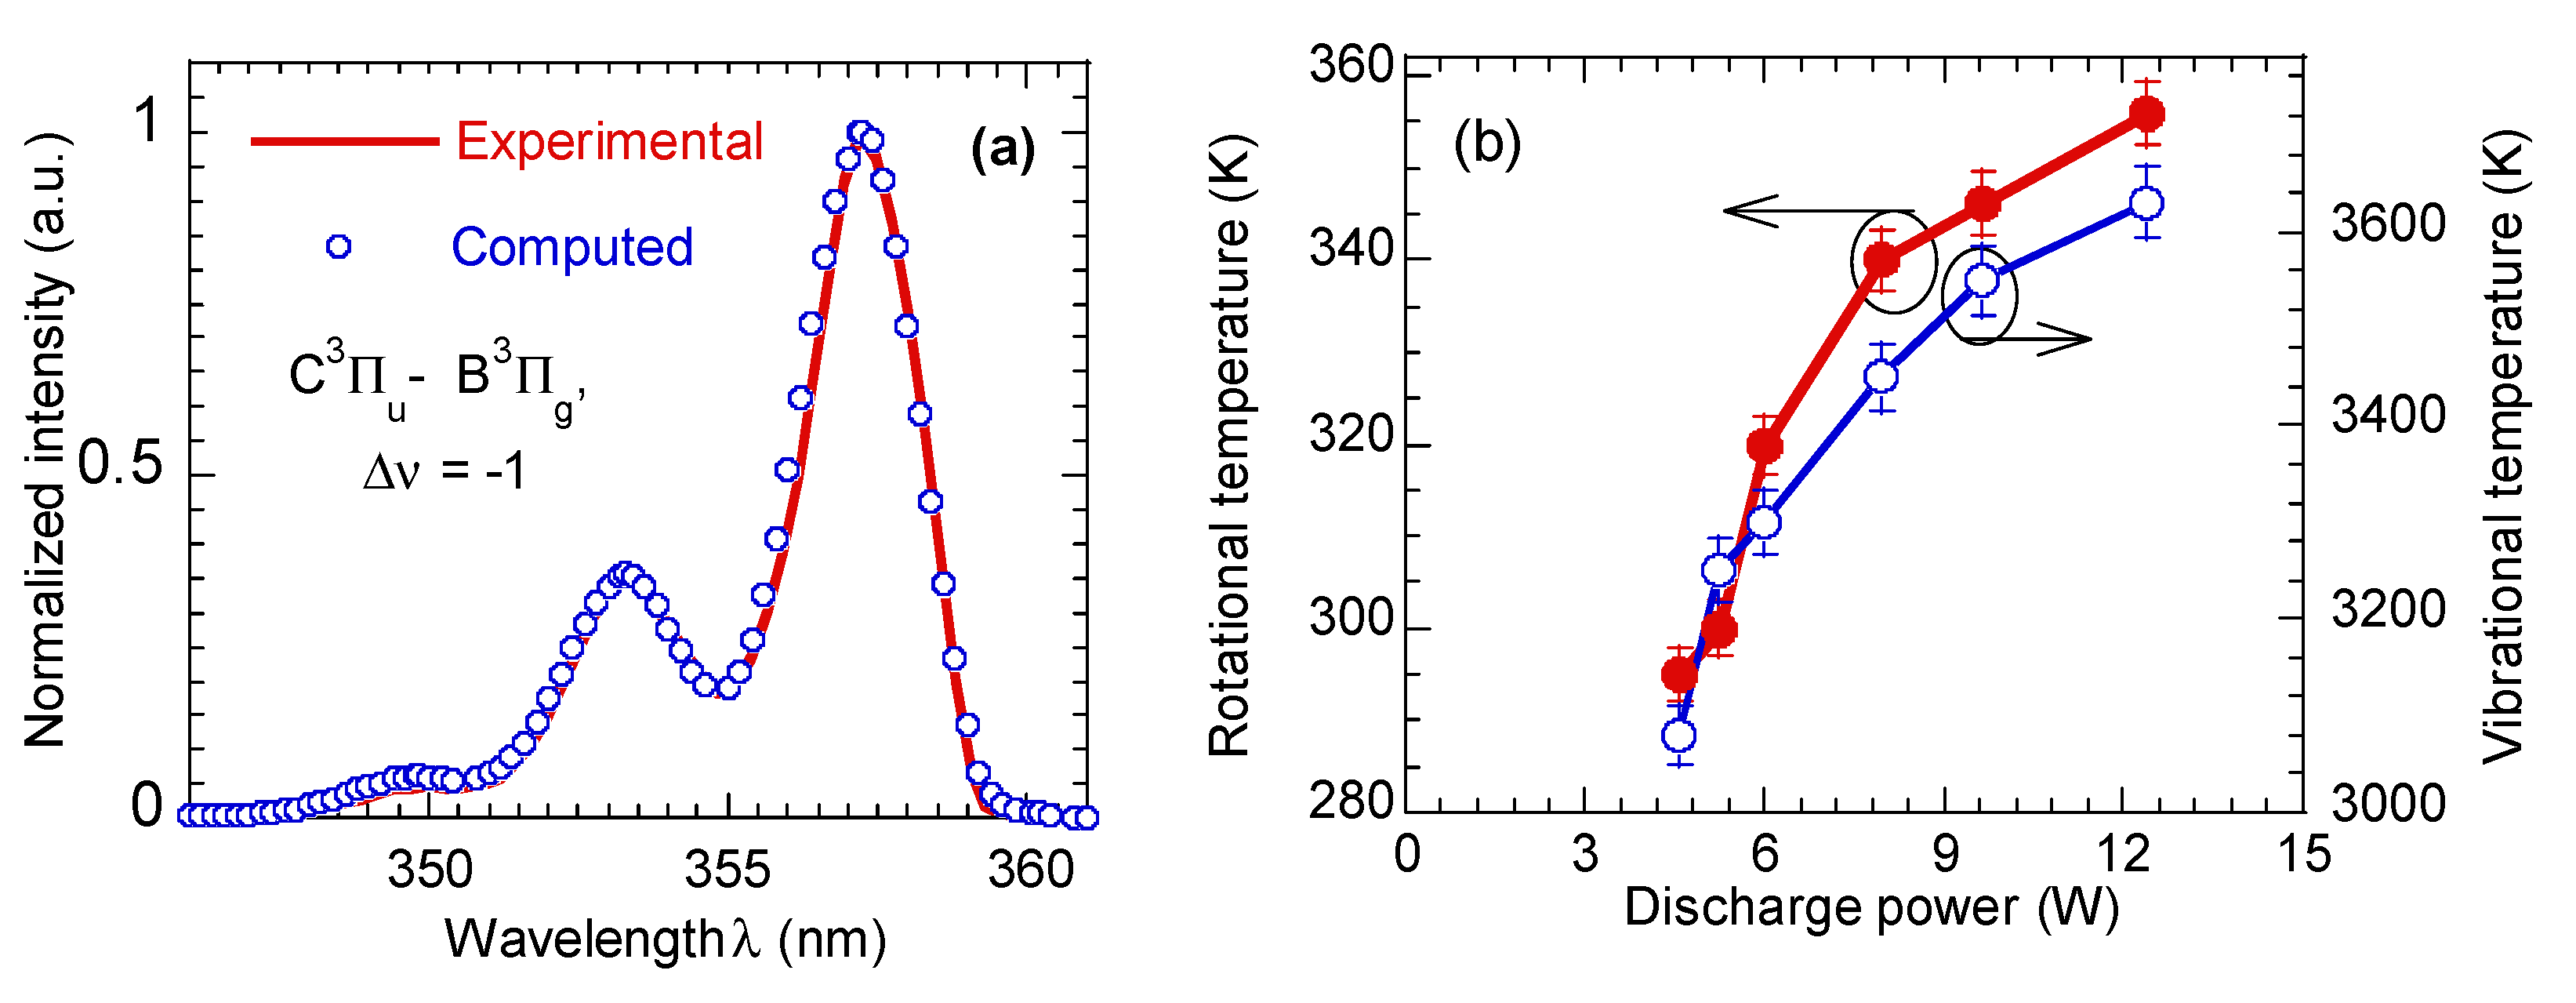
3.1. Electrical and Optical Characteristics of He- H 2 O Plasma Jet

A typical example of the total power-total current waveforms of the He- H 2 O plasma mixture is presented in Figure 2a, in which the mixture total flow rate was set at 10 L/min. The He- H 2 O gas mixture generates a very uniform discharge (plasma plume) as peaks are smooth and filamentary free over the entire discharge powers. The discharge power (W) is calculated by integrating the product of the discharge power and current over one cycle; according to the following equation (T = period of the discharge):
W = 1 T · 0 T I ( t ) V ( t ) d t
with I ( t ) and V ( t ) being the measured power and current waveforms. As seen in Figure 2b both consumed power and the discharge current increases almost linearly as the applied discharge power increase. When the discharge power varies from 3.8 to 6.2 kV ( V p p ), the consumed discharge power increases from 4 to 12.5 W and the measured total current is from 22 to 40 mA. The linear increment of both currents and dissipated power reflects the homogeneous nature of the discharge, i.e., streamer free.
The in situ diagnostics of the active species existing in the He- H 2 O plasma mixtures helps to understanding the chemical/physical processes involved in the plasma-polyimide surface interaction. Figure 3a depicts an emission spectrum in the wavelength range of 290–800 nm from an atmospheric-pressure He- H 2 O plasma jet. The He- H 2 O mixture plasma spectra is clearly dominated by He I atomic lines; 388.8, 438.8, 501.6, 587.6, 667.8, 706.5, and 728.1 nm. The spectral lines of He spectra are identified using the NIST atomic spectra database [23]. Moreover, several molecular nitrogen spectral bands in the range 330–420 nm, atomic oxygen O I at 777.41 nm and weak atomic hydrogen H ff at 656.3 nm can be seen in the emission of the He- H 2 O plasma jet. The existence of OI, OH, N 2 , H ff spectrum are inheriting as the air molecules interact readily with the He plasma jet and therefore many dissociation processes occur. Fortunately, the presence of these excited species in the plasma composition are very favorable in the surface treatment process. The spectral intensity of He I line 706 nm that indicates the presence of high-energy electrons is more intense than helium metastable (spectral lines 388.8 and 501.6 nm), over the complete spectrum range. Thus, we conclude that only the generated atoms or radicals modify the polyimide surface and contribute to hydrophilization.
Figure 3b shows the emission intensities of OH (307.2 nm), He I (706.5 nm), N 2 (337.1 nm) and O I (777.2 nm) excited species dependences on the discharge power at a fixed He- H 2 O total flow rate 10 L/min. As expected emission intensity of the considered plasma species are increased as the discharge power is increased. Increasing the discharge power results in enhancement of the number of high-energy electrons (∼12 eV). In consequence, these energetic generates more excited plasma species through collisions with He atoms as well as the ambient air molecules. The spectral band of N 2 (337.1 nm) has the highest intensity probably due to their low excitation energy (<12 eV). Helium atom metastable penning ionization quenching with the surrounding N 2 and O 2 in the background air is another factor to decrease the emission intensity of He lines.
The second positive system (SPS) N 2 ( C 3 Π u B 3 Π g ) band spectra has been used as probe to evaluate the vibrational T vib and rotational T rot temperatures of the He- H 2 O plasma mixture. As seen in Figure 4a, an excellent reproduction of the measured SPS N 2 spectra was obtained for T rot = 376 K and T vib = 1650 K. The effect of discharge powers on the T vib and T rot is displayed in Figure 4b. At the lower discharge power, the T rot is almost equal to room temperature, and thus in thermodynamic equilibrium with the background gas and hence can be equated with the gas temperature. Yet, since T vib T rot this implies that the plasma is non-thermal equilibrium which is favorable for plasma enhanced chemistry. As the discharge powers increases the T vib and T rot increases from 3100 to 3650 K and 295 to 350 K, respectively. As T vib accounts for the energy transfer from high-energy electrons to other plasma species, the increase of T vib with discharge power suggests an increase of the discharge benefit for surface treatment. The increment of both T rot and T vib with discharge power is probably a consequence of the increase of the population of the higher-lying vibrational levels of the N 2 ( C 3 Π u ) radiative states (see in Figure 3a).

3.2. Surface Characterization

Hydrophilic Effect Induced by Plasma at Various Discharge Powers

The adhesion characters of the the Kapton polyimide surface can be speculated using contact angle (CA) measurements. As Figure 5 shows, the contact angles θ of pristine polyimide was ranging from 52 o –69 o for blue ink, DI water and glycerol, respectively. Such high CA values characterize the hydrophobic character of the pristine polyimide. The CA decreases rapidly after He- H 2 O plasma treatment for 30 s at discharge power of 5.2 W. This confirms the improvement of Kapton surface wettability, even for low discharge power as 5.2 W. As discharge power increases further up to 12.4 W, the contact angles of the respective liquids slightly increased to higher values irrespective of liquid type. The reduction in polyimide CA after He- H 2 O plasma treatment imply physical/chemical modifications of the polyimide surface upon plasma treatment. The slight increment of the polyimide CA with the plasma discharge power suggests that, the higher discharge power value is not favorable as plasma parameter for polymer surface treatment.

3.3. AFM Surface Morphology

To identify the possible morphological modifications of the polyimide surface upon plasma treatment, AFM images have been taken. Figure 6 shows 3D-AFM images of the pristine polyimide and plasma treated polyimide at varius discharge power. The scanned surface area for all polyimide samples were 5 × 5 μ m 2 . The 3D-AFM image of the pristine polyimide surface shows no regular features, meanwhile, plasma-treated ones reveal non-uniform node-like structure with relative roughness varying with the discharge power. In other words, the discharge power significantly affects the roughness of the plasma-treated polyimide surfaces. In general, it is expected that the plasma excited species by interacting with polyimide surface either through polymer chain scission or grafting radicals onto the polyimide surface enhance the polymer surface roughness [24]. The rougher surfaces typically result in increase in mechanical interlocking with adhesives i.e. increase surface wettability. The surface roughness R a (evaluated from the AFM images) for pristine polyimide was 11.8 nm, and it changes to 266, 143, 100, 44.4, 41.7 nm for plasma discharge power of 5.2, 6.2, 8.0, 9.6 and 12.4 W, respectively. It is evident that, the low discharge power is more effective in altering the polyimide surface morphology. The reduction in polyimide surface roughness with increasing the plasma discharge power might be due to an increase in the surface mobility induced by high gas temperature as observed in Figure 4b. Alternatively, cross-linking is another mechanism that is used to reduce the surface roughness. Cross linking of polymer chain molecules increases with UV radiation. The UV components of the plasma emission ( λ 400 nm) increases with discharge power as seen in Figure 3a,b. Therefore, we can conclude that the low discharge power induces more roughness surface in compare with the high discharge power.

X-ray Photoelectron Spectra Analysis

X-ray photoelectron spectroscopy (XPS) technique is used to investigate the chemical composition of the sample surfaces. Table 1 summaries the atomic concentration of C 1s, N 1s and O 1s as well as the N/C and O/C ratios for the pristine and plasma treated polyimide as a function of discharge power. The N/C and O/C ratio for plasma treated polyimide samples remarkably depends on the discharge power. The N/C ratio from 6.8% (pristine) to 12.85% at plasma discharge power increased up to 9.6 W, then it is slightly decreased to 11.8% as discharge power increased to 12.4 W. While, the O/C ratio remarkably increased and peaked at 5.2 W, then it decreased as discharge power increased further. The decrease of the O/C ratio at higher discharge power ≥5.2 W probably due chain scissions and formation of low weight volatile byproducts such as CO or CO 2 . The O/C and N/C ratio values for untreated and treated polyimide are comparable to the values reported by Inagaki et al. [25]. In general, the increase of the N/C and O/C ratio on the polyimide surface upon exposure to the plasma is a clear evidence that plasma induces surface functionalization of the polyimide surface. Moreover, the plasma discharge power control the type/intensity of functional groups created on the plasma-treated polyimide surface. The concentration of the N and O based functional groups affects the hydrophilicity efficiency of the polyimides surface. The increment of N/C ratio with plasma discharge power results from N radical formation on the polyimide surface during plasma treatment. Figure 3 shows the remarkable increase of the intensity of nitrogen band spectra as discharge power increased. These results verify that the diffused air plays an important role in the performance of atmospheric pressure plasma jet.
To evaluate the type of the functional groups on the polyimide surface upon the plasma treatment, we performed fitting for the high-resolution XPS peak spectra of C 1s, N 1s and O 1s as seen in Figure 7a,d,g. All binding energy values were corrected to C 1s ≈ 284.08 eV. The relative concentrations of these components are shown in the Table 2. The C 1s peak of the pristine polyimide sample can be resolved into four main components; peak at 284.08 eV assigned to C-C aromatic carbon; peak at 285.0 eV represents carbon atoms linked to nitrogen (C–N or C–N–C), peak at 286.0 eV assigned to carbon atoms linked to oxygen (C–O) and finally peak at 288.0 eV assigned to carboxylic groups C=O or N–C=O [9,26,27]. The N 1s spectrum exhibited two peaks; N–C–C at 398.9 eV and N–C=O from amide group at 399.65 eV (Figure 7 (N 1s)). Further, the O 1s spectrum of the pristine polyimide exhibited two peaks: O=C or O=C–N at 531.9 eV assigned to carbonyl and C–O at 532.8 eV as seen in Figure 7 (O 1s).
After plasma treatment at various discharge power, the high resolution C 1s, N 1s and O 1s spectra of the plasma treated-polyimide samples were observed to broaden and the peak position shifted towards higher binding energy values. This observation suggests incorporation of oxygen-nitrogen functional groups on the polyimide surface upon plasma treatment. Furthermore, the widening in the N 1s and the asymmetry of O 1s for treated samples reveals an increased disorder on the surface. Hence, changes of chemical groups that form the N 1s and O 1s spectra. The C 1s spectra of the treated samples preserve the same four components (C–C, C–N–C, C=O and N–C=O) as for the pristine sample, however, with varying intensity. In addition, a low-intensity peak (shake-up) around 291 eV assigned to π * can be seen in Figure 7 (C 1s). The N 1s spectra of the plasma-treated polyimide can be resolved into 3 peaks at; 399.1 eV (C–N or C=N), 399.9 eV (N–C=O) amide group and 401.1 eV that assigned to N- H 2 (amine). The H atoms probably came from the H 2 O dissociation in the He- H 2 O plasma jet. The O 1s peak resolved into two peaks: C=O (or N–C=O) carbonyl group at 531.9 eV and C–O at 532.9 eV [27].
The behavior of the C 1s, N 1s and O 1s components intensity with plasma discharge power are remarkable as seen in Table 2. The C–C or (C=C) bond intensity remarkably decreases from 47.8% to 23.3% as discharge power increased to 6.2 W, beyond which it is slightly increased to 30.3% as discharge power increased up to 12.4 W. The C–N–C bond intensity continuously increases with the discharge power from 12.1% to 21.9%. Meanwhile, both of C–O and C=O (N–C=O) bonds intensities increases rapidly and show plateau peak, then slightly decreases as discharge power increases. The bonding energy of the C–N, C–C and C–O bonds are 3.5, 3.6 and 3.7 eV, which are lower than that of C=O bond (11.09 eV). This suggest a chain breaking at the C–N–C, C–C and C–O bounds induced by plasma species. The remarkable increment of the nitrogen bonds (C–N and N–C=O ) on plasma-treated polyimide surface attributed to the rich nitrogen species on the plasma as observed in Figure 3; nitrogen active species properly bonded to carbon atoms at defected sites of the treated polyimide surfaces. Alternatively, it may be due to the rearrangement of N on the polyimide surface due to plasma interaction with the surface [28]. The slight increase of the C–C or(C=C) bond ratio at high discharge power ≥6.2 W may be due to the cross-linking [9] caused by the abundance of UV radiation existed in the He plasma emission as seen from Figure 3. The UV photons ( λ 400 nm) remarkably increases as the plasma discharge power increased. The high resolution N 1s and O 1s spectra components shows similar dependences on the discharge power as that of their comparable components of C 1s as seen in Table 2.
From these results, it can be concluded that at the low-moderate discharge power the plasma functionalization of polyimide surface takes place through breakage weak covalent C–N and C–O bonds which results in opening the imide ring. Later, it is saturated with other free oxygen/nitrogen species and forming various nitrogen/oxygen containing functional groups. These groups that containing oxygen/or nitrogen bonded to carbon are polar and tend to improve the hydrophilic properties of polyimide surface. The shift in the peak binding energy for carbon and nitrogen spectrum, as well as the higher percentage of the O=C bond in the O 1s spectra, is another indicator of opening the imide ring and conversion of surface imide to amide functional groups through oxygenation and amination of the C–N bond.

4. Conclusions

In this work, an atmospheric pressure plasma jet generated in He+ H 2 O mixtures has been investigated as well as their effects on polyimide surface. The electrical characteristics shows that the input power and discharge currents increases with the increase of the discharge power. Different radicals and excited species produced in the plasma jet have been identified. The T rot and T vib of He+ H 2 O plasma mixtures are measured by OES. The optical characterization shows that, the emission intensity of various species, T rot and T vib , increase with discharge power, which indicates that the input power generates new plasma species as well as heating the plasma. The T rot is much lower than T vib , and thus non-equilibrium plasma is favorable for plasma polyimide processing. The polyimide CA rapidly decreases after plasma treatment for 30 s and at low discharge power of 5.2 W irrespective of liquid type. Increasing the discharge power slightly increases the polyimide CA. AFM images revealed an increased roughness of polyimide surface treated at low power of 5.2 W, however, the maximum roughness of the treated samples decreases as the discharge power increased, which supports the CA observations. XPS analysis identified polar groups such as C–O, N–C=O, C=O and other nitrogen containing functional groups such as C–N and NH 2 on the plasma treated polyimide surfaces. The plasma-functionalized polyimide surface promote adhesion for subsequence interlayers deposition processes. The concentration of the polar groups (C–O, N–C=O, C=O) decreases as discharge power increases beyond 5.2 W. High discharge power increases high gas temperature, hence increases molecules surface mobility leading to reduced the surface roughness. In addition, it generates strong UV emission that results in increasing the cross-linking of the C–C bond which decreases the hydrophilic polar group concentrations i.e. high discharge power condition decreases the plasma functionalization efficiency of polyimide surface.

Author Contributions

E.A.-F. designed and performed the experiments; E.A.-F. and M.A. contributed to the analysis of the results and to the writing of the manuscript. All authors have read and agreed to the published version of the manuscript.

Funding

This research received funding from deanship of scientific research at Prince Sattam bin Abdulaziz university under research project 2019/01/10897.

Conflicts of Interest

The author declare no conflict of interest.

References

  1. Akinwande, D.; Petrone, N.; Hone, J. Two-dimensional flexible nanoelectronics. Nat. Commun. 2014, 5, 5678. [Google Scholar] [CrossRef] [PubMed]
  2. Chwang, A.; Lu, J.P.; Shih, C.; Tung, Y.-J.; Hewitt, R.; Hack, M.; Ho, J.; Brown, J. Cockpit and Future Displays for Defense and Security (Proceedings of SPIE); Society of Photo Optical: Orlando, FL, USA, 2005; pp. 234–248. [Google Scholar]
  3. Bauer, S. Flexible electronics: Sophisticated skin. Nat. Mater. 2013, 12, 871–872. [Google Scholar] [CrossRef]
  4. Kubo, Y.; Tanaka, H.; Saito, Y.; Mizoguchi, A. Fabrication of a bilayer structure of Cu and polyimide to realize circuit microminiaturization and high interfacial adhesion in flexible electronic devices. ACS Appl. Mater. Interfaces 2018, 10, 44589–44602. [Google Scholar] [CrossRef] [PubMed]
  5. Lee, H.M.; Choi, S.-Y.; Jung, A.; Ko, S.H. Highly conductive aluminum textile and paper for flexible and wearable electronics. Angew. Chem. 2013, 125, 7872–7877. [Google Scholar] [CrossRef]
  6. Jin, H.; Zhou, J.; He, X.; Wang, W.; Guo, H.; Dong, S.; Wang, D.; Xu, Y.; Geng, J.; Luo, J.K.; et al. Flexible surface acoustic wave resonators built on disposable plastic film for electronics and lab-on-a-chip applications. Sci. Rep. 2013, 3, 2140. [Google Scholar] [CrossRef] [PubMed] [Green Version]
  7. Isfahani, H.N.; Faghihi, K.; Hajibeygi, M.; Bokaei, M. New optically active poly(amide-imide)s from N’-(bicyclo[2,2,2]oct-7-ene-2,3,5,6-tetracarboxylic)bis-L-phenyl alanine and aromatic diamines: Synthesis and characterization. Polym. Bull. 2010, 64, 633–646. [Google Scholar] [CrossRef]
  8. Chao, M. Synthesis and characterization of semicrystalline polyimides containing bridged linkages. Int. J. Polym. Sci. 2018, 2018, 8590567. [Google Scholar] [CrossRef] [Green Version]
  9. Abdel-Fattah, E. Surface activation of poly(Methyl Methacrylate) with atmospheric pressure Ar- H2O plasma. Coatings 2019, 9, 228. [Google Scholar] [CrossRef] [Green Version]
  10. Park, S.-J.; Lee, E.-J.; Kwon, S.-H. Influence of surface treatment of polyimide film on adhesion enhancement between polyimide and metal films. Bull. Korean Chem. Soc. 2007, 28, 188. [Google Scholar]
  11. Park, Y.J.; Yu, D.M.; Ahn, J.H.; Choi, J.-H.; Hong, Y.T. Surface modification of polyimide films by an ethylenediamine treatment for a flexible copper clad laminate. Macromol. Res. 2012, 20, 168–173. [Google Scholar] [CrossRef]
  12. Dong, S.-S.; Shao, W.-Z.; Yang, L.; Yeb, H.-J.; Zhena, L. Surface characterization and degradation behavior of polyimide films induced by coupling irradiation treatment. RSC Adv. 2018, 8, 28152. [Google Scholar] [CrossRef] [Green Version]
  13. Castillo, F.J.A.S.; Rivadeneyra, A.; Albrecht, A.; Godoy, A.; Morales, D.P.; Rodriguez, N. In-depth study of laser diode ablation of kapton polyimide for flexible conductive substrates. Nanomaterials 2018, 8, 517. [Google Scholar]
  14. Velardi, L.; Lorusso, A.; Paladini, F.; Siciliano, M.V.; Giulio, M.; Raino, A.; Nassisi, V. Modification of polymer characteristics by laser and ion beam. Radiat. Effects Def. Solids 2010, 165, 637–642. [Google Scholar] [CrossRef]
  15. Nedela, O.; Slepicka, P.; Svorcik, V. Surface modification of polymer substrates for biomedical applications. Materials 2017, 10, 1115. [Google Scholar] [CrossRef] [PubMed]
  16. Kim, C.; Jeong, D.; Hwang, J.; Chae, H. Argon and nitrogen plasma surface treatments of polyimide films for electroless copper plating. J. Korean Phys. Soc. 2009, 54, 621–627. [Google Scholar] [CrossRef]
  17. Sava, I.; Kruth, A.; Kolb, J.F.; Miron, C. Optical properties of polyimides films treated by nanosecond pulsed electrical discharges in water. Jpn. J. Appl. Phys. 2018, 57, 0102BF. [Google Scholar] [CrossRef] [Green Version]
  18. Abdel-Fattah, E. Surface and thermal characteristics relationship of atmospheric pressure plasma treated natural luffa fibers. Eur. Phys. J. D. 2019, 73, 71. [Google Scholar] [CrossRef]
  19. Bhusari, D.; Hayden, H.; Tanikell, R.; Allen, S.A.B.; Kohla, P.A. Plasma treatment and surface analysis of polyimide films for electroless copper buildup process. J. Electrochem. Soc. 2005, 152, F162–F170. [Google Scholar] [CrossRef] [Green Version]
  20. Abdel-Fattah, E.; Yehia, A.; Bazavan, M.; Ishijima, T. Optical emission and surface characterization of stainless steel treated by pulsed microwave-atmospheric helium plasma jet. Eur. Phys. J. D. 2017, 71, 178. [Google Scholar] [CrossRef]
  21. Abdel-Fattah, E.; Bazavan, M.; Shindo, H. Temperature measurements in microwave argon plasma source by using overlapped molecular emission spectra. Phys. Plasma 2015, 22, 093509. [Google Scholar] [CrossRef]
  22. Laux, C.O. Radiation and nonequilibrium collisional-radiative models. In Physico-Chemical Modeling of High Enthalpy and Plasma Flows; van Karman Institute Lecture Series; Fletcher, D., Charbonnier, J.-M., Sarma, G.S.R., Magin, T., Eds.; Von Karman Institute: Rhode-Saint-Genese, Belgium, 2002. [Google Scholar]
  23. Available online: http://physics.nist.gov/cgi-bin/ATDdata/display.ksh (accessed on 10 May 2020).
  24. Kostova, K.G.; Nishime, T.M.C.; Castro, A.H.R.; Toth, A.; Hein, L.R.O. Surface modification of polymeric materials by cold atmospheric plasma jet. Appl. Surf. Sci. 2014, 314, 367. [Google Scholar] [CrossRef] [Green Version]
  25. Inagaki, N.; Tasaka, S. and Hibi, K. Surface modification of Kapton film by plasma treatments. J. Polym. Sci. A Polym. Chem. 1992, 30, 1425–1431. [Google Scholar] [CrossRef]
  26. Abdel-Fattah, E.; Ogawa, D.; Nakamura, K. Oxygen functionalization of MWCNTs in RF-dielectric barrier discharge Ar/O2 plasma. J Phys. D Appl. Phys. 2017, 50, 265301. [Google Scholar] [CrossRef]
  27. Beamson, G.; Briggs, D. High Resolution XPS of Organic Polymers, the Scienta ESCA 300 Database; John Wiley: Chichester, UK; New York, NY, USA, 1992; pp. 54–75. [Google Scholar]
  28. Flitsch, R.; Shih, D.Y. An XPS study of argon ion beam and oxygen RIE modified BPDA-PDA polyimide as related to adhesion. J. Adhes. Sci. Technol. 1996, 10, 1241–1253. [Google Scholar] [CrossRef]
Figure 1. Schematic diagram of the experimental set-up for He- H 2 O atmospheric pressure plasma processing.
Coatings 10 00662 g001
Figure 2. (a) Typical discharge power-total current waveform and (b) the discharge powers and the peak current dependence of discharge power at a fixed flow rate.
Coatings 10 00662 g002
Figure 3. (a) Optical emission spectra of atmospheric pressure He- H 2 O plasma jet during treatment of polyimide at a fixed flow rate of 10 L/min; (b) Peak emission intensities of N 2 337, He 706 and OI 777 nm dependences of discharge power.
Coatings 10 00662 g003
Figure 4. (a) Measured and synthetic spectra of the SPS of nitrogen in the spectra range 342–360 nm ( Δ ν = −2), for He- H 2 O plasma mixtures; (b) Relationship between discharge power and vibrational and rotational temperatures of at fixed gas flow rate.
Coatings 10 00662 g004
Figure 5. Contact angle θ measurements as a function of discharge power at conditions of total flow rate 10 L/min and treatment time of 30 s for three various liquids.
Coatings 10 00662 g005
Figure 6. 3D-AFM images of polyimide before and after He– H 2 O plasma treatment at various discharge power conditions and at a fixed gas flow rate and treatment time of 30 s.
Coatings 10 00662 g006
Figure 7. High resolution C 1s, N 1s and O 1s spectra of polyimide before and after He- H 2 O plasma treatment, at various discharge power, a fixed gas flow rate and treatment time of 30 s.
Coatings 10 00662 g007
Table 1. XPS elemental analysis of the pristine and plasma-treated polyimide as a function of discharge power at He- H 2 O flow rate of 10 L/min and treatment time of 30 s.
Discharge Power (W)C 1s (%)O 1s (%)N 1s (%)O/C (%)N/C (%)
071.623.94.5233.36.3
5.258.3365.761.79.8
6.260.932.76.453.710.5
8.061.831.2750.511.3
9.663.428.58.145.012.8
12.466.625.40838.112.0
Table 2. Relative percentage of functional groups composed of high resolution C 1s, N 1s, and O 1s spectra of the pristine and plasma-treated polyimide as a function of discharge power. Same discharge conditions as Table 1.
Discharge Power (W)C 1s
C–C (%)C–N (%)C–O (%)N–C=O (%) π π (%)
047.812.13.76.60
5.223.315.54.912.10.5
6.226.216.03.813.30.75
8.026.616.73.513.941.2
9.629.018.32.412.261.5
12.430.321.91.7311.51.5
Discharge Power (W)N 1sO 1s
C–N (%)N–C=O (%)N- H 2 (%)C=O (%)C–O (%)
02.01.70.016.249.9
5.22.22.80.7520.415.4
6.22.33.60.9517.814.2
8.02.54.00.915.114.6
9.62.64.00.715.712.7
12.43.03.70.513.612.6

