Article

A Novel High-Frequency Ultrasonic Approach for Evaluation of Homogeneity and Measurement of Sprayed Coating Thickness

1
School of Mechanical Engineering, Beijing Institute of Technology, Beijing 100081, China
2
Fundamental Science on Advanced Machining Laboratory, Beijing 100081, China
*
Authors to whom correspondence should be addressed.
Coatings 2020, 10(7), 676; https://doi.org/10.3390/coatings10070676
Submission received: 7 June 2020 / Revised: 13 July 2020 / Accepted: 13 July 2020 / Published: 15 July 2020

Abstract

:
A high-frequency ultrasonic approach for testing and evaluating sprayed coating thickness is proposed in this paper. This technique is based on the maximum frequency interval method of the magnitude spectrum of the acoustic pressure reflection coefficient that adopts Welch spectrum estimation. The acoustic propagation model was set up at normal incidence, and the relationship between the maximum frequency interval by the Welch power spectrum and the coating thickness was established to provide the principle for determining coating thickness. According to this principle, the thickness of a series of stainless steel coatings and ZrO2–Y2O3 (yttria-stabilized zirconia (YSZ)) coatings were detected by scanning acoustic microscopy. The relative error was less than 4% with the microscope method, indicating that the proposed ultrasonic method provides a reliable nondestructive way to measure sprayed coating thickness. The uniformity of the sprayed coating thickness could be intuitively observed from C-scan images by programming.

1. Introduction

Thin layers and coatings have been widely applied in the aerospace, petrochemical, automobile manufacturing, and large-scale thermal power generation industries. The coating thickness is a key technical index used to characterize the quality of the coating, which is related to the evaluation and calculation of the service life, bonding strength, nonuniform internal stress, and manufacturing cost of the coating [1,2]. There are many methods available for thickness detection of coatings, including metallographic analysis [3], the eddy current method [4], the ultrasonic method [5], and the infrared method [6]. Among these methods, ultrasonic testing is widely used in the nondestructive testing and evaluation of coating structures due to its advantages of wide application range, high detection sensitivity, low cost, and suitability for field testing.
Many researchers have conducted abundant studies on coating thickness measurements by ultrasonic approaches. Based on the theory of acoustic pressure reflection of a multilayered medium proposed by Brekhovskikh, the magnitude spectrum and phase spectrum curves of the acoustic pressure reflection coefficient of a multilayered medium under vertical incidence conditions were deduced in [7,8]. The thickness of various layers of media was confirmed by acquiring the various peaks in three inverse spectrum diagrams of a multilayered medium in [9]. An inverse algorithm was proposed to obtain a group of dimensionless parameters through two groups of reflection spectrum data, and the coating thickness was calculated with an analytical expression in [10]. The methods summarized above are based on the pulse echo principle. The key to this method lies in the fact that it can measure the time difference between the bottom and top surface echoes of the material. However, if the material thickness is too thin, the waves will be mixed and the bottom and top surface echoes cannot be accurately distinguished; thus, this method loses its efficiency. To avoid the mixing of echoes, the frequency of the detection probe should be improved so that the pulse width is lessened and two echoes can be distinguished. As the frequency of the detection probe increases, its depth of penetration is greatly reduced, especially for coatings with a large attenuation coefficient. In view of this problem and the limitations in using acoustic time differences to measure material thickness, many researchers have turned to signal processing methods, such as the acoustic pressure reflection coefficient method [11], ultrasonic reflection coefficient phase spectrum method [12], and ultrasonic reflection coefficient amplitude spectrum method [5], in which the coating thickness is acquired by extracting useful characteristic parameters.
In this study, a high-frequency ultrasonic method was developed to measure sprayed coating thickness and evaluate its homogeneity. The ultrasonic wave propagation model in the coatings were analyzed. The overlapping and interference of echoes forming the top and bottom surfaces were improved using Welch’s power spectrum. In order to evaluate the proposed method as fully as possible, ultrasonic experiments were performed on stainless steel coatings and ZrO2–Y2O3 (yttria-stabilized zirconia (YSZ)) coatings with various thicknesses. Then, the experimental results were compared with those from the microscope method, and the relative errors of measurement for coating thickness were found to be less than 4%. The homogeneity of sprayed coating thickness was observed from C-scan images by programming.

2. Experimental Equipment, Materials, and Measuring Method

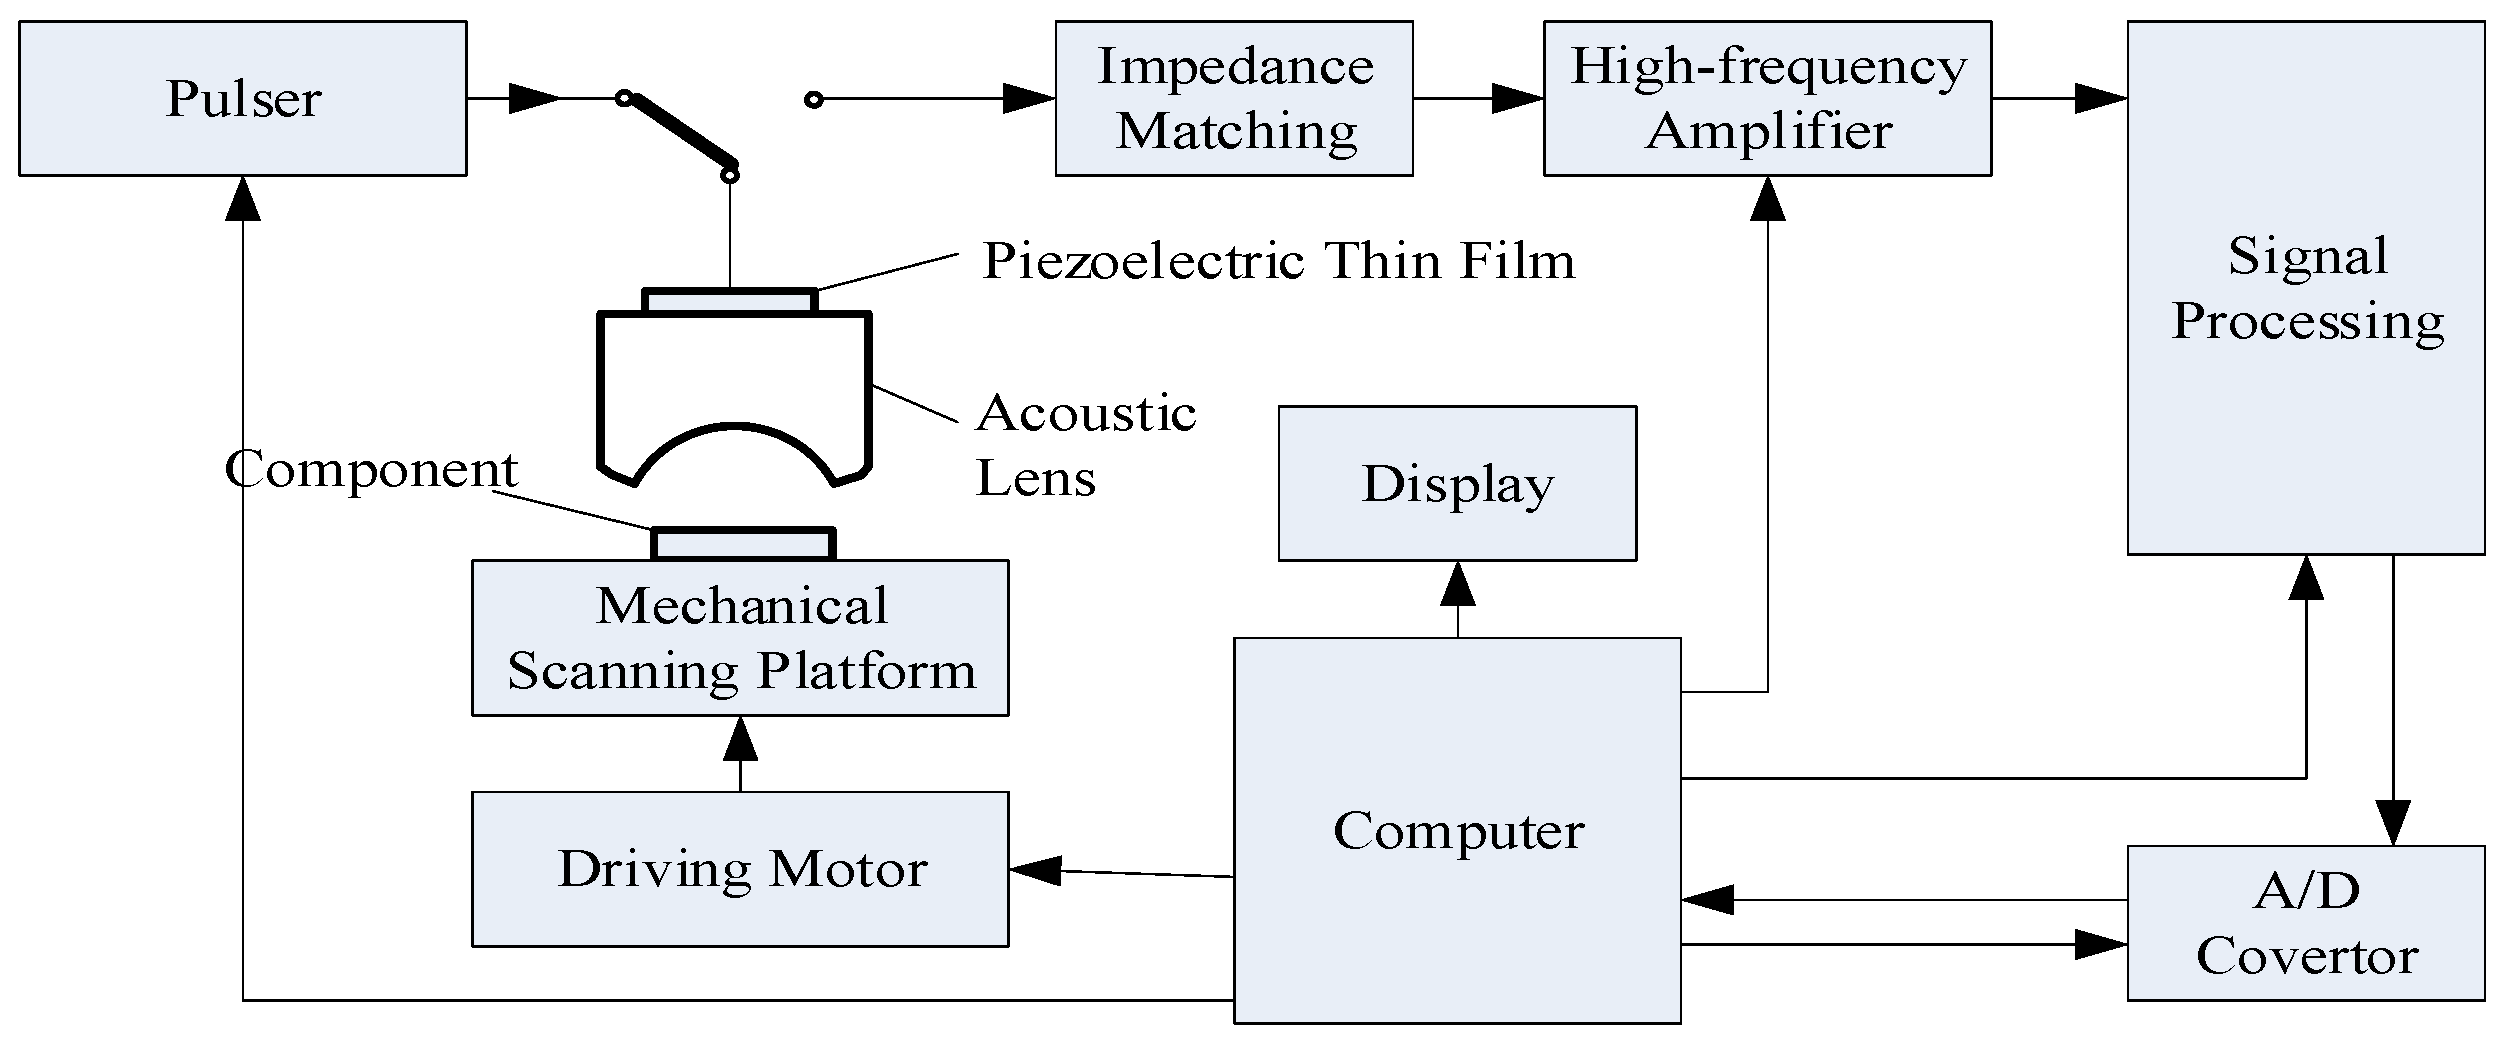
2.1. Architecture of Scanning Ultrasonic Microscopy System

The scanning ultrasonic microscopy system was used as a high-frequency ultrasonic method to evaluate the homogeneity and measurement of sprayed coating thickness. As shown in Figure 1, a reflective scanning ultrasonic microscopy system consists of an acoustic lens, a pulser/receiver apparatus, an ultra-high-speed card, a mechanical scanning system, etc.
Scanning ultrasonic microscopy employs high-frequency ultrasound, which is of high resolution and can easily detect micro- and nanophysical defects in the surface layer and the interior of components. Scanning ultrasonic microscopy uses a reflective ultrasonic microscope. As shown in Figure 2a,b, by using the same focused transducer both as the pulser and the receiver, ultrasonic data containing both the amplitude and the phase at each point in the scan plane at a certain depth (z) are collected and displayed in C-scan mode. A two-dimensional (area) acoustic image can be obtained by processing the data collected in C-scan mode.

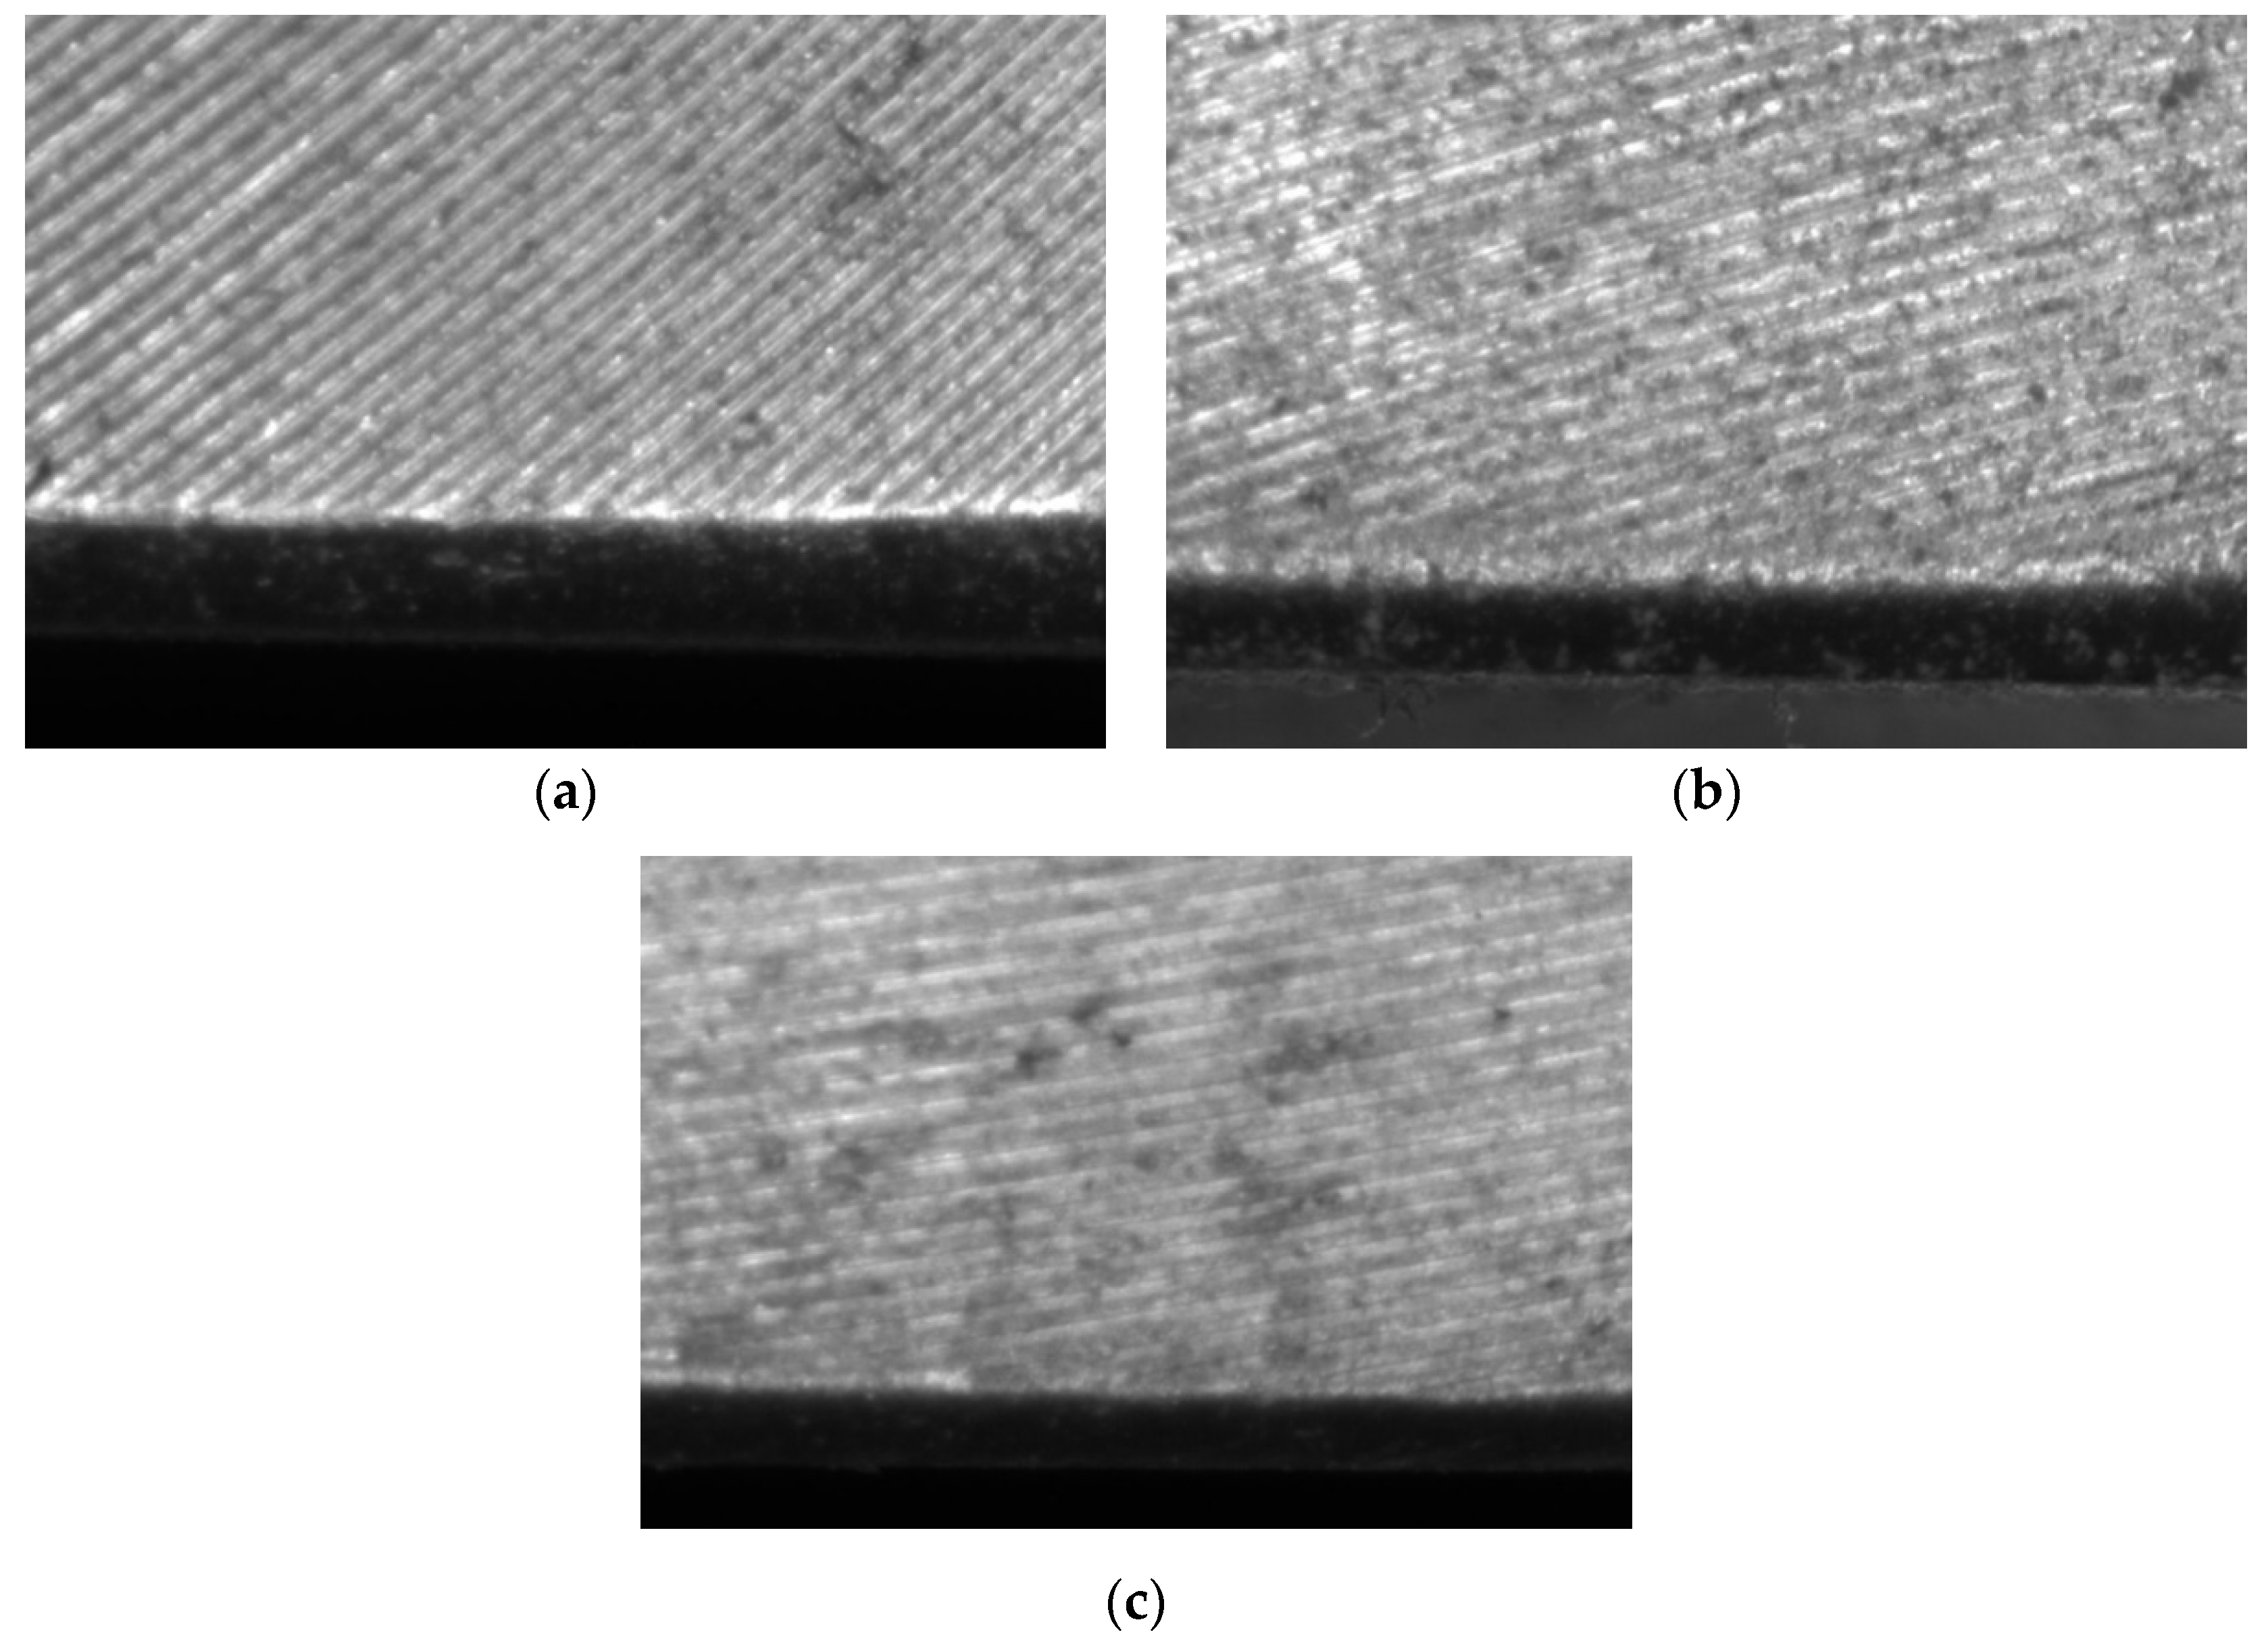
2.2. Experimental Spray Coating Materials

Two types of coating were used for the ultrasonic measurement of thickness in this study. The first was stainless steel coating, which used stainless feeler gauges of existing thicknesses (200, 300, and 400 µm) that adhered to the coating with good uniformity on polymethyl methacrylate. The second was YSZ thermal barrier coating, which was prepared on #45 steel (S45C/c45) (50 mm × 50 mm × 8 mm) with plasma spray. The stainless steel coatings were denoted as specimens #1–#3 and the YSZ coatings as specimens #4–#6. The cross section perpendicular to the YSZ coating specimen surface was first ground with sandpaper to obtain a smooth interface, then the cross-sectional image was obtained with a digital microscope, and finally the thickness was measured with the Matrox Inspector 9.0 image processing software. The microscopic images and measured values of specimens #4, #5, and #6 were 329.5, 248.2, and 176.3 µm, respectively, as shown in Figure 3.

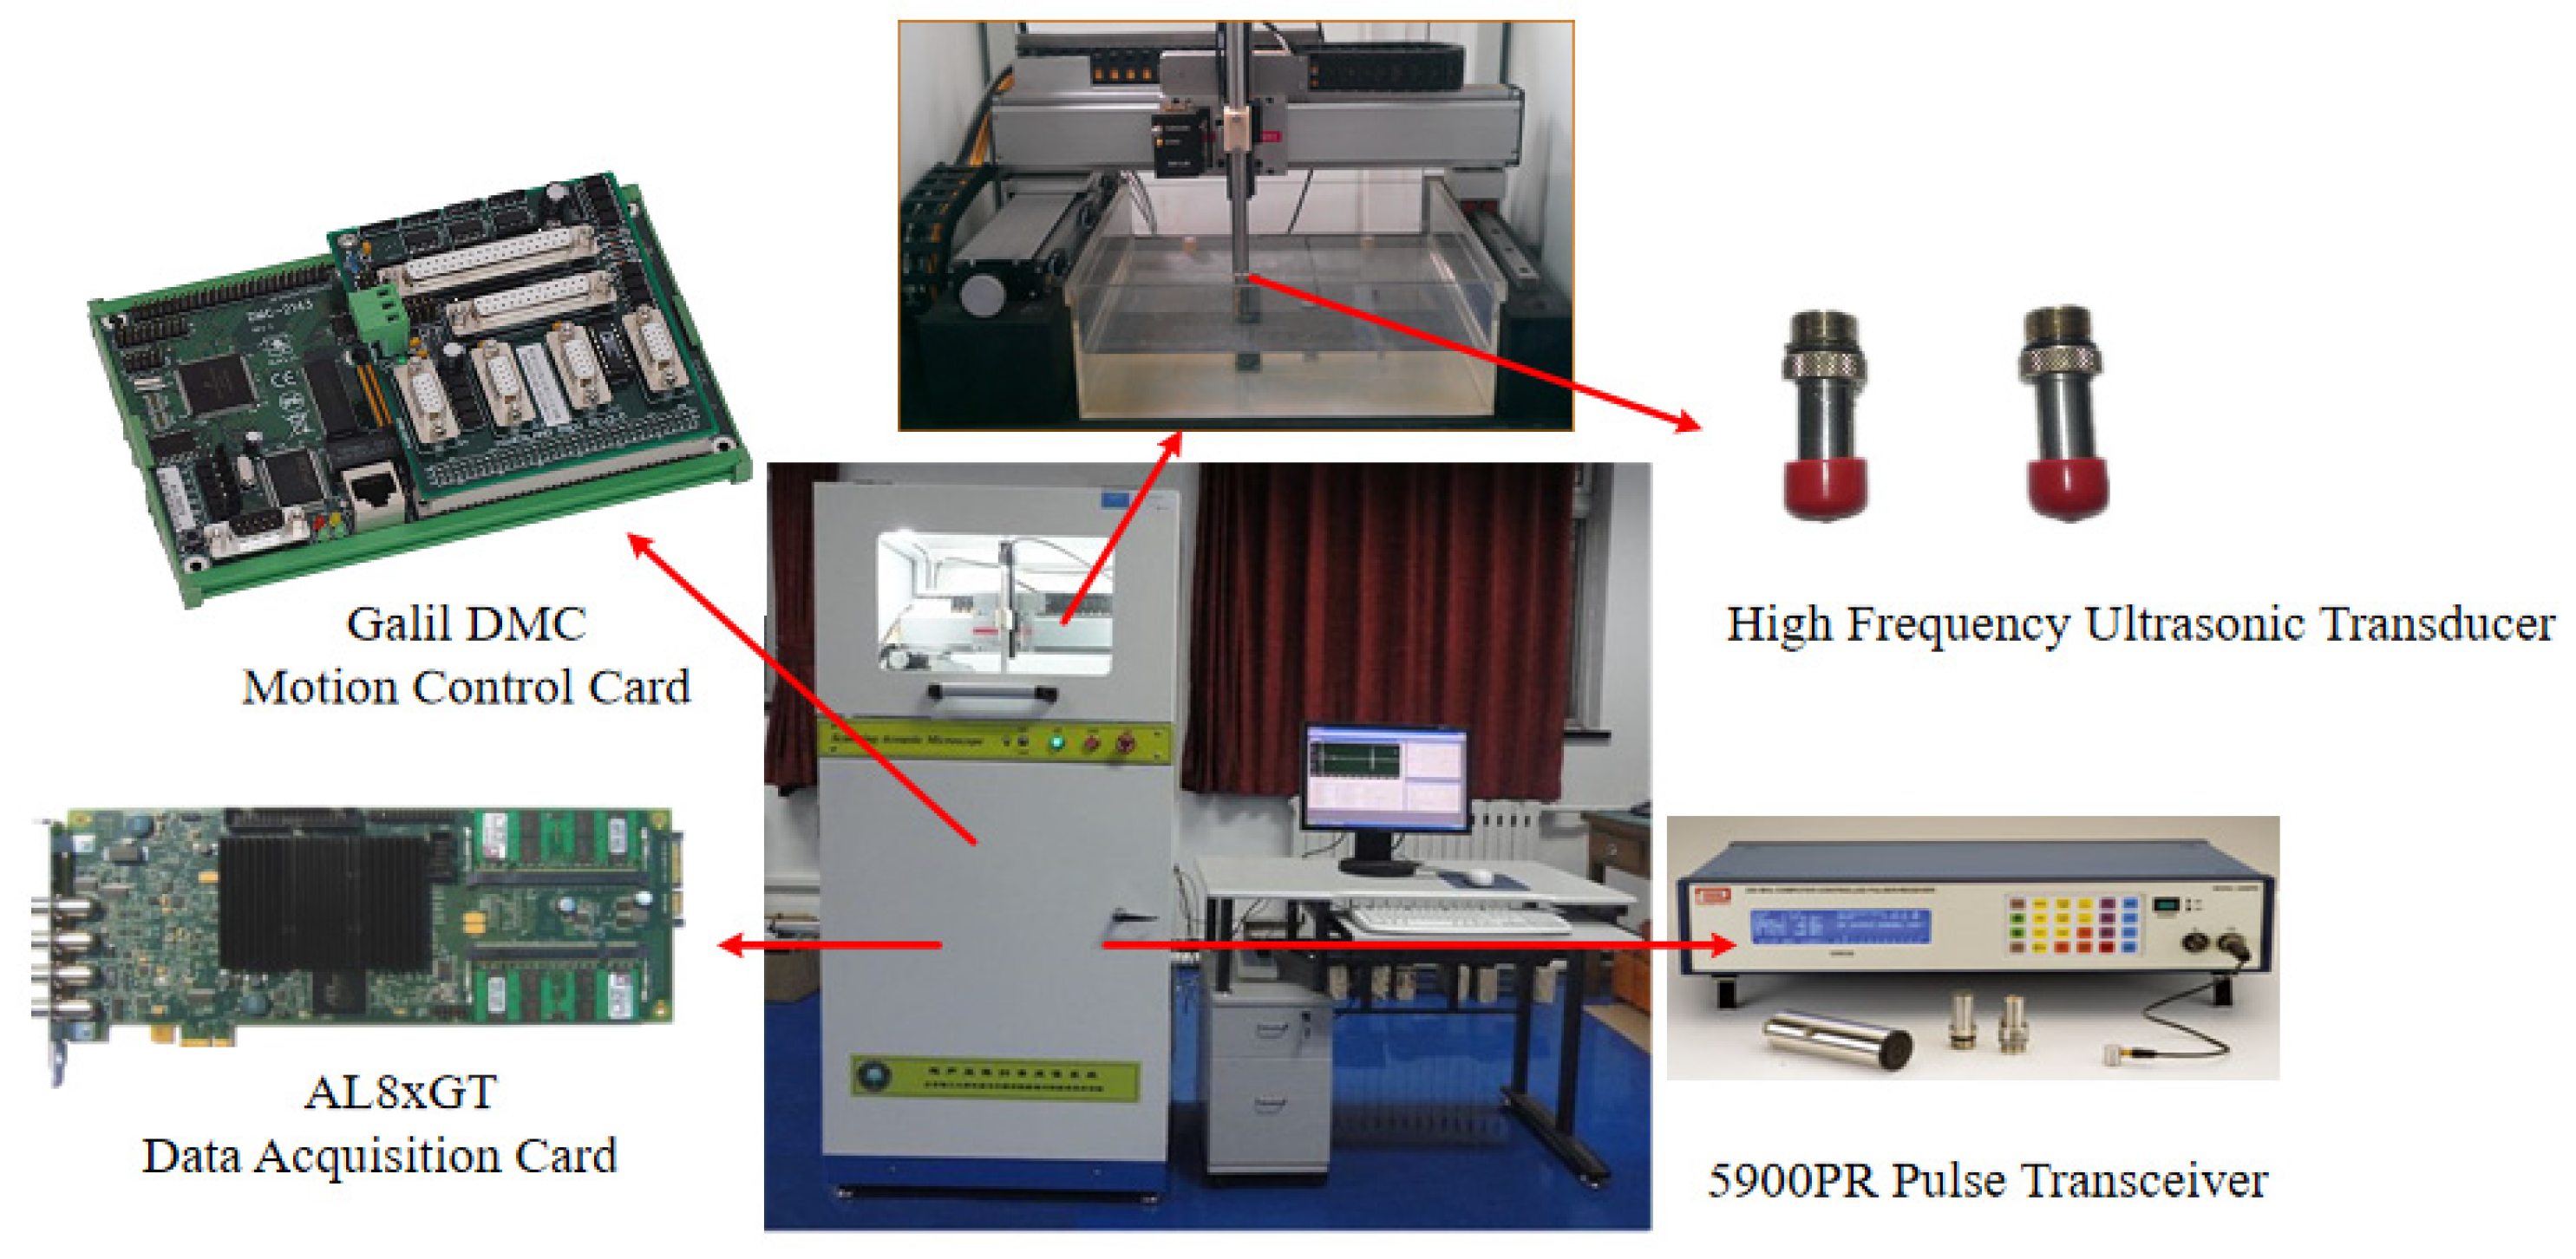
2.3. Scanning Ultrasonic Microscopy System

To realize coating thickness measurement, a corresponding ultrasonic testing system needed to be established. Ultrasonic microscopy consists of a computer, a high-frequency ultrasonic transducer, a wide-band pulse transceiver, a high-speed data acquisition card, and a precise motion control system. The motion control system is responsible for controlling the position and speed of the probe to realize precise scanning. The computer completes user interaction, parameter calculation, data storage, data processing, image processing, and measurement calculation functions. The ultrasonic transducer is responsible for the conversion of the electric pulse signal and sound signal. In this study, the scanning ultrasonic microscopy system was assembled by our laboratory. Its scanning range was X × Y × Z = 200 mm × 200 mm × 15 mm. The ultrasonic transducers selected were the water immersion focusing probes V373 and V311 by Panametrics-NDT (Waltham, MA, USA) with the center frequency of 20 and 10 MHz, respectively. The high-speed data acquisition card is responsible for digital-to-analogue conversion. The pulse transceiver excites the transducer to transmit ultrasonic waves and receives and processes the electrical signal output by the transducer’s converted reflection echo. The actual system structure and prototype are shown in Figure 4. Considering the n-time reflection echo signal at the coating and substrate interface is relatively weak, to extract the signal more efficiently, the immersion focus pulse echo method was applied.

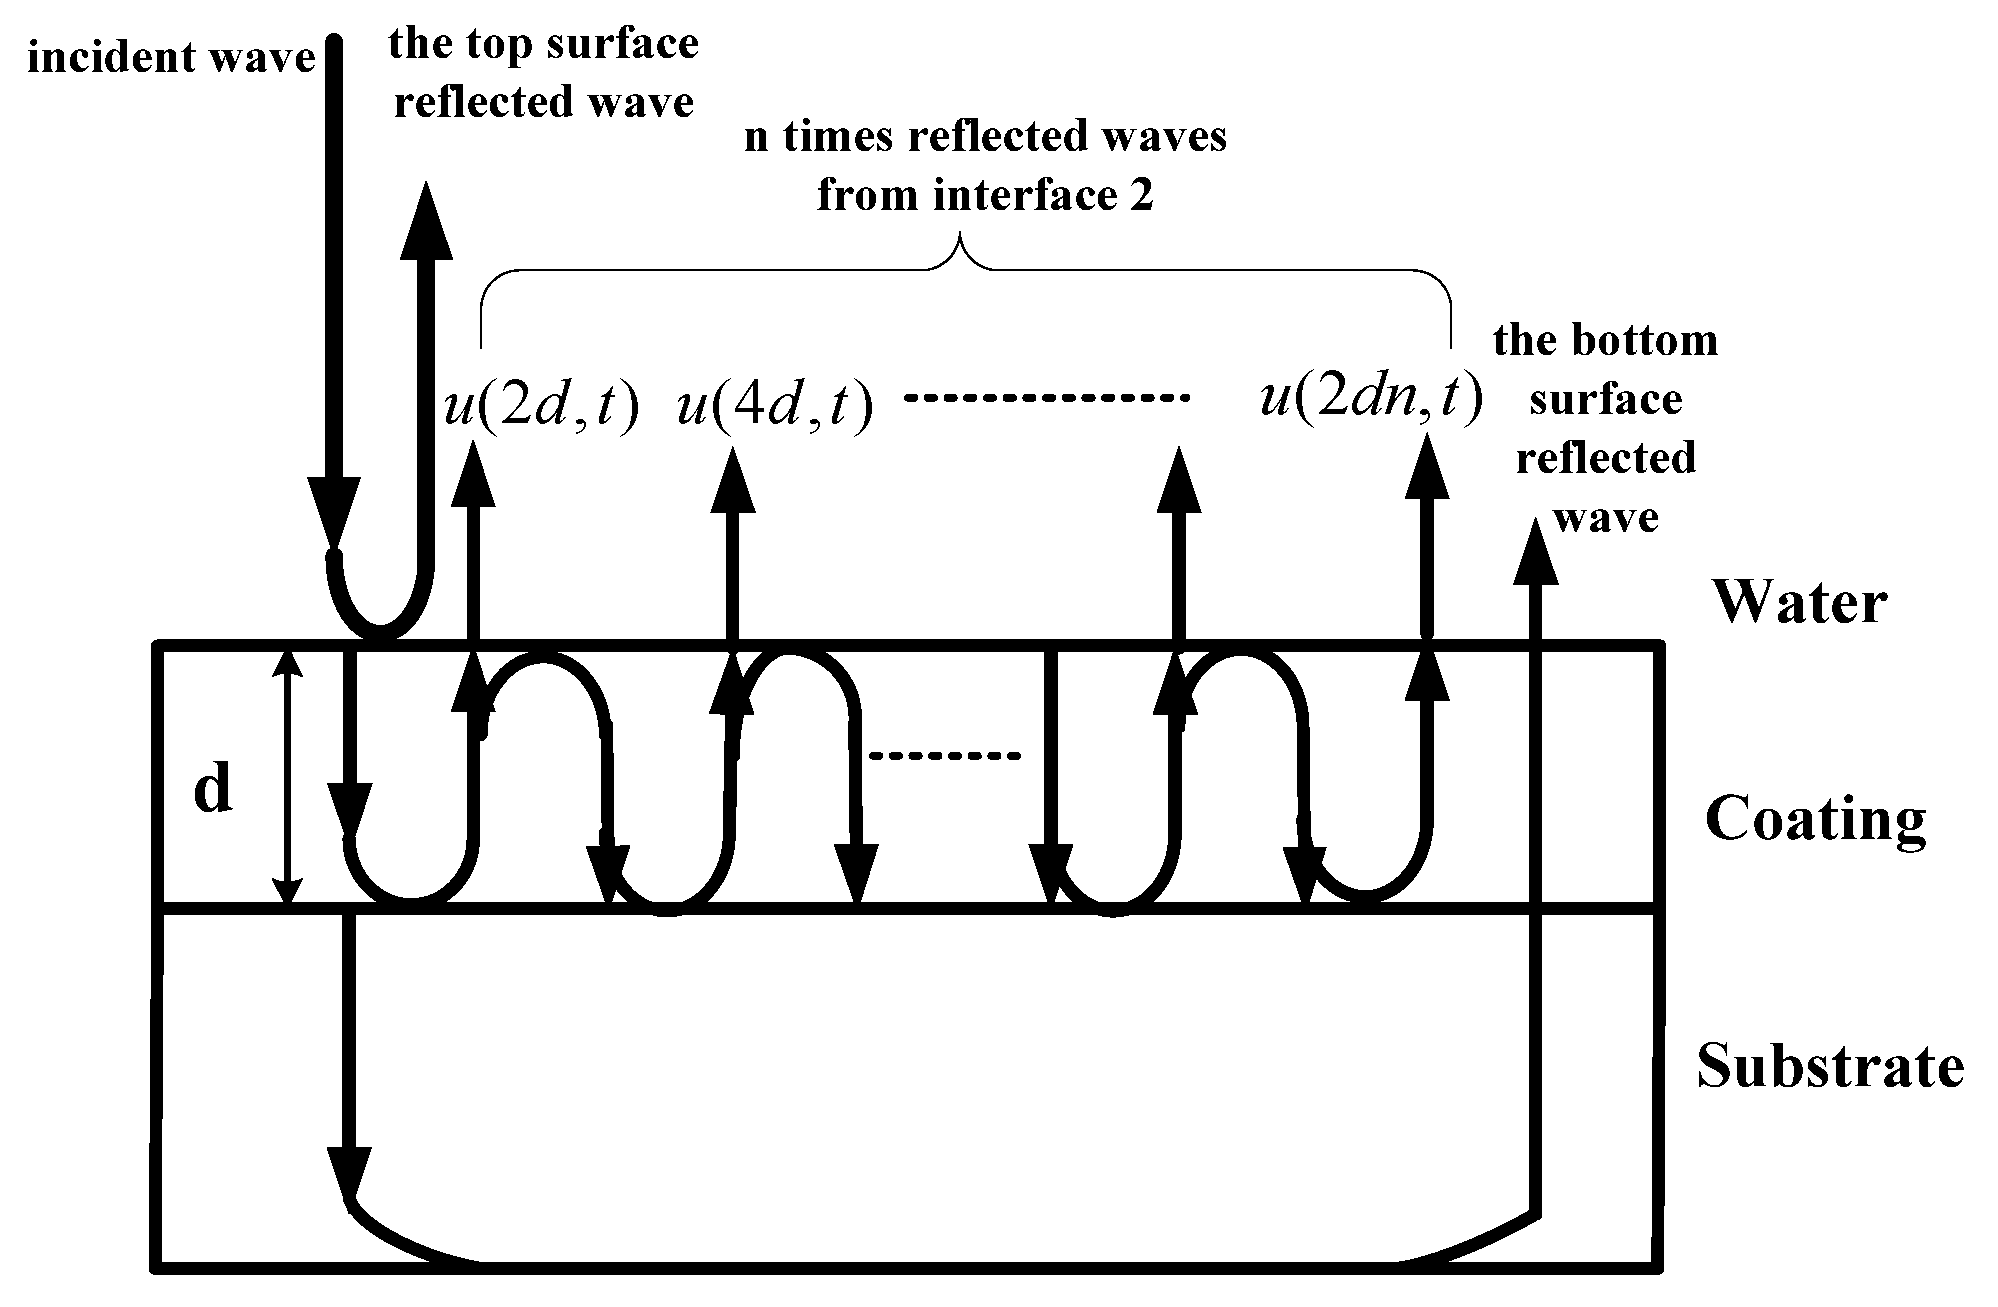
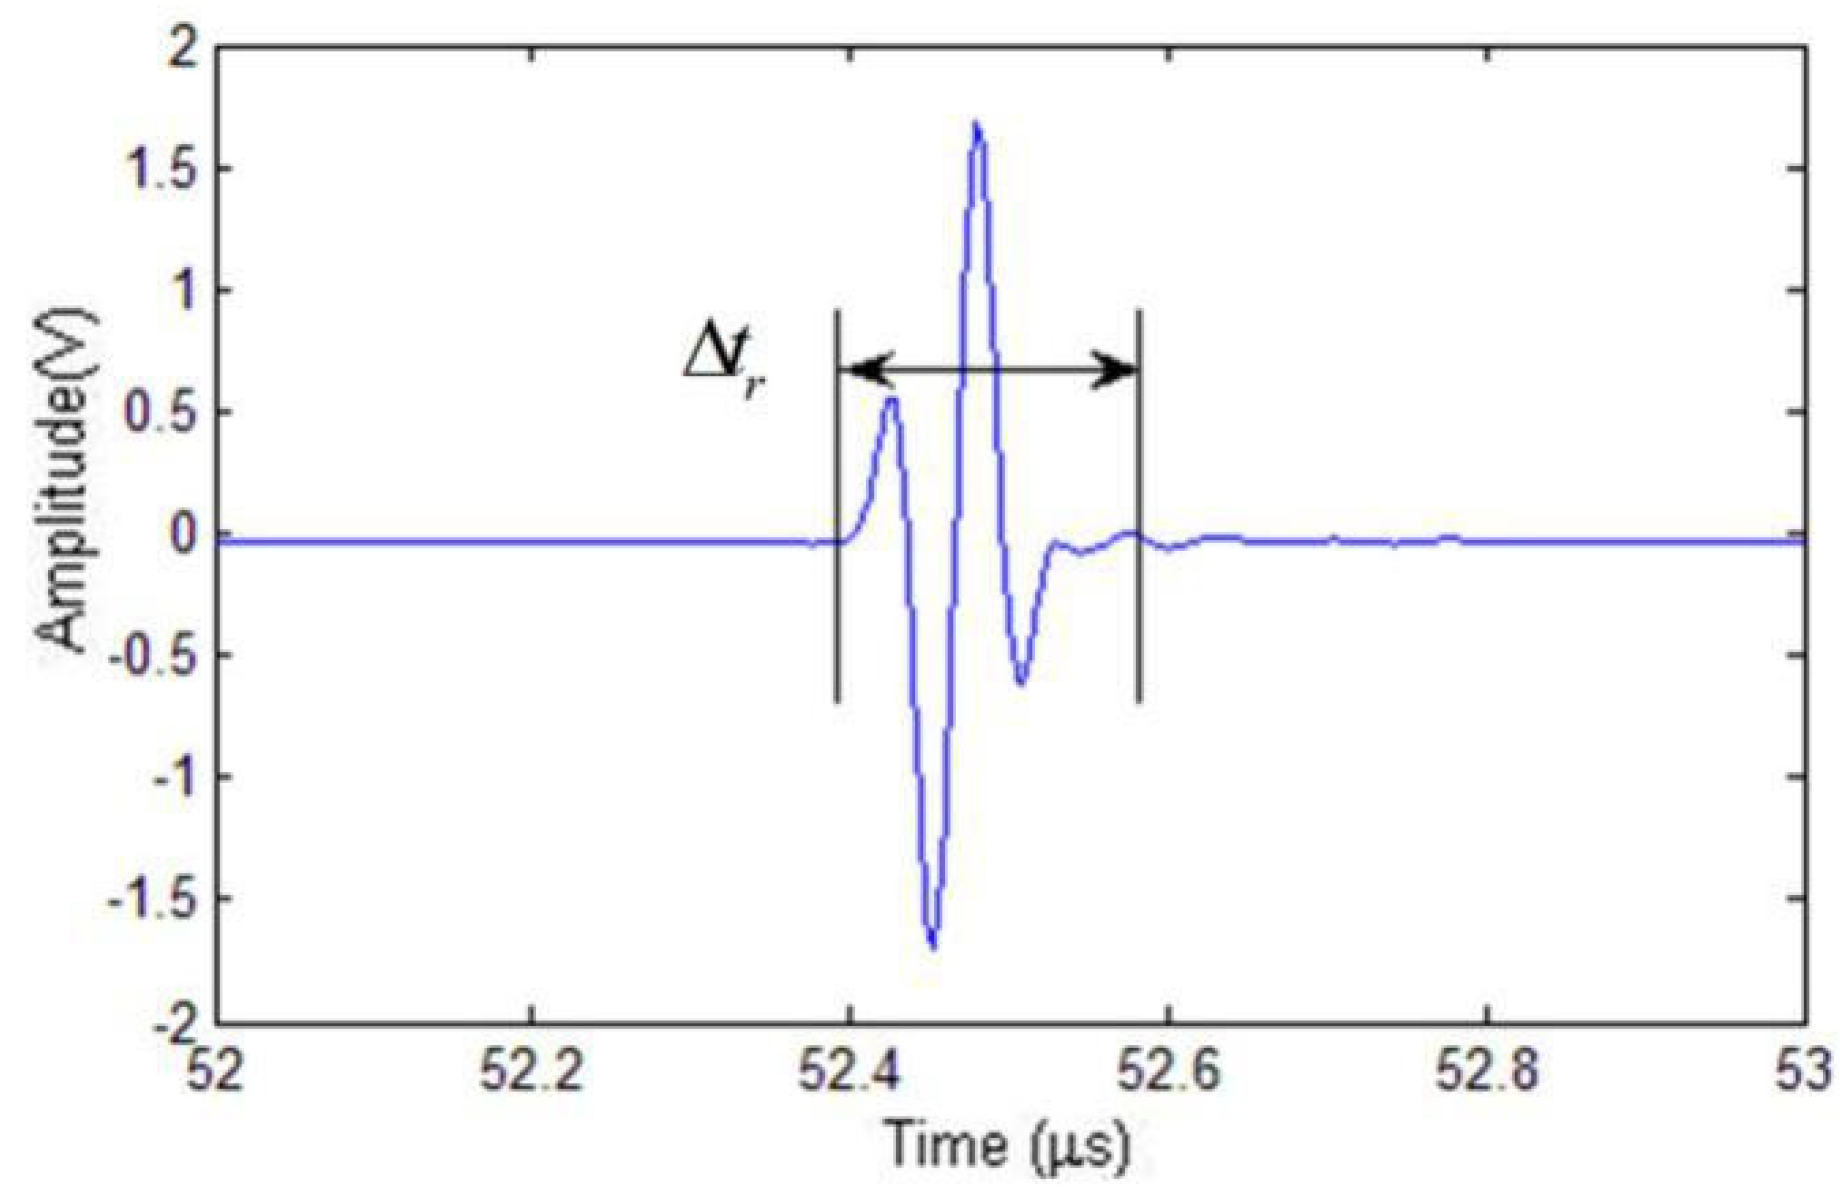
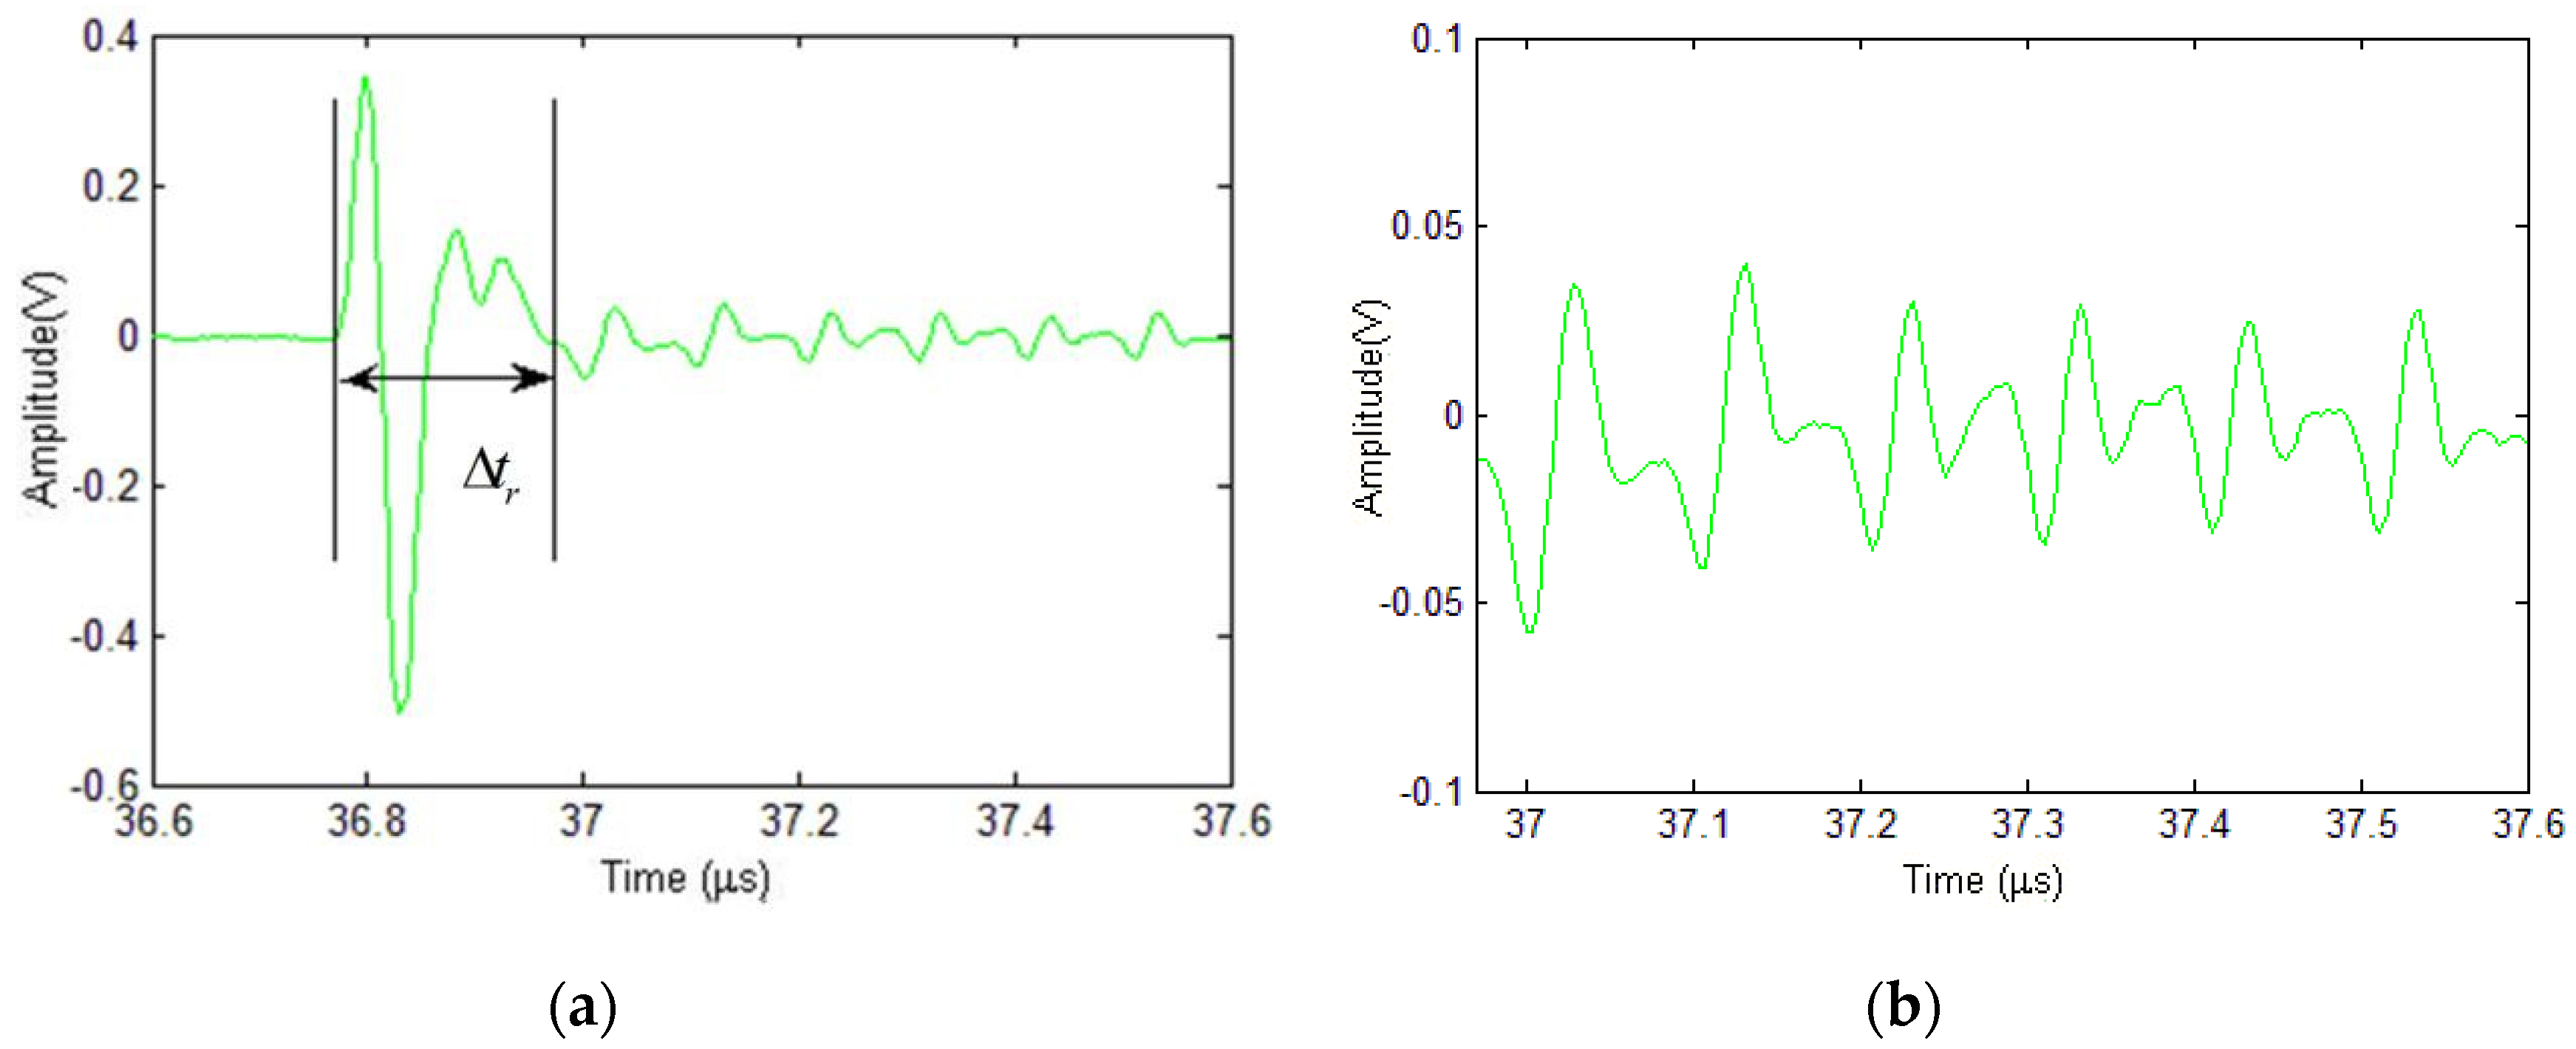
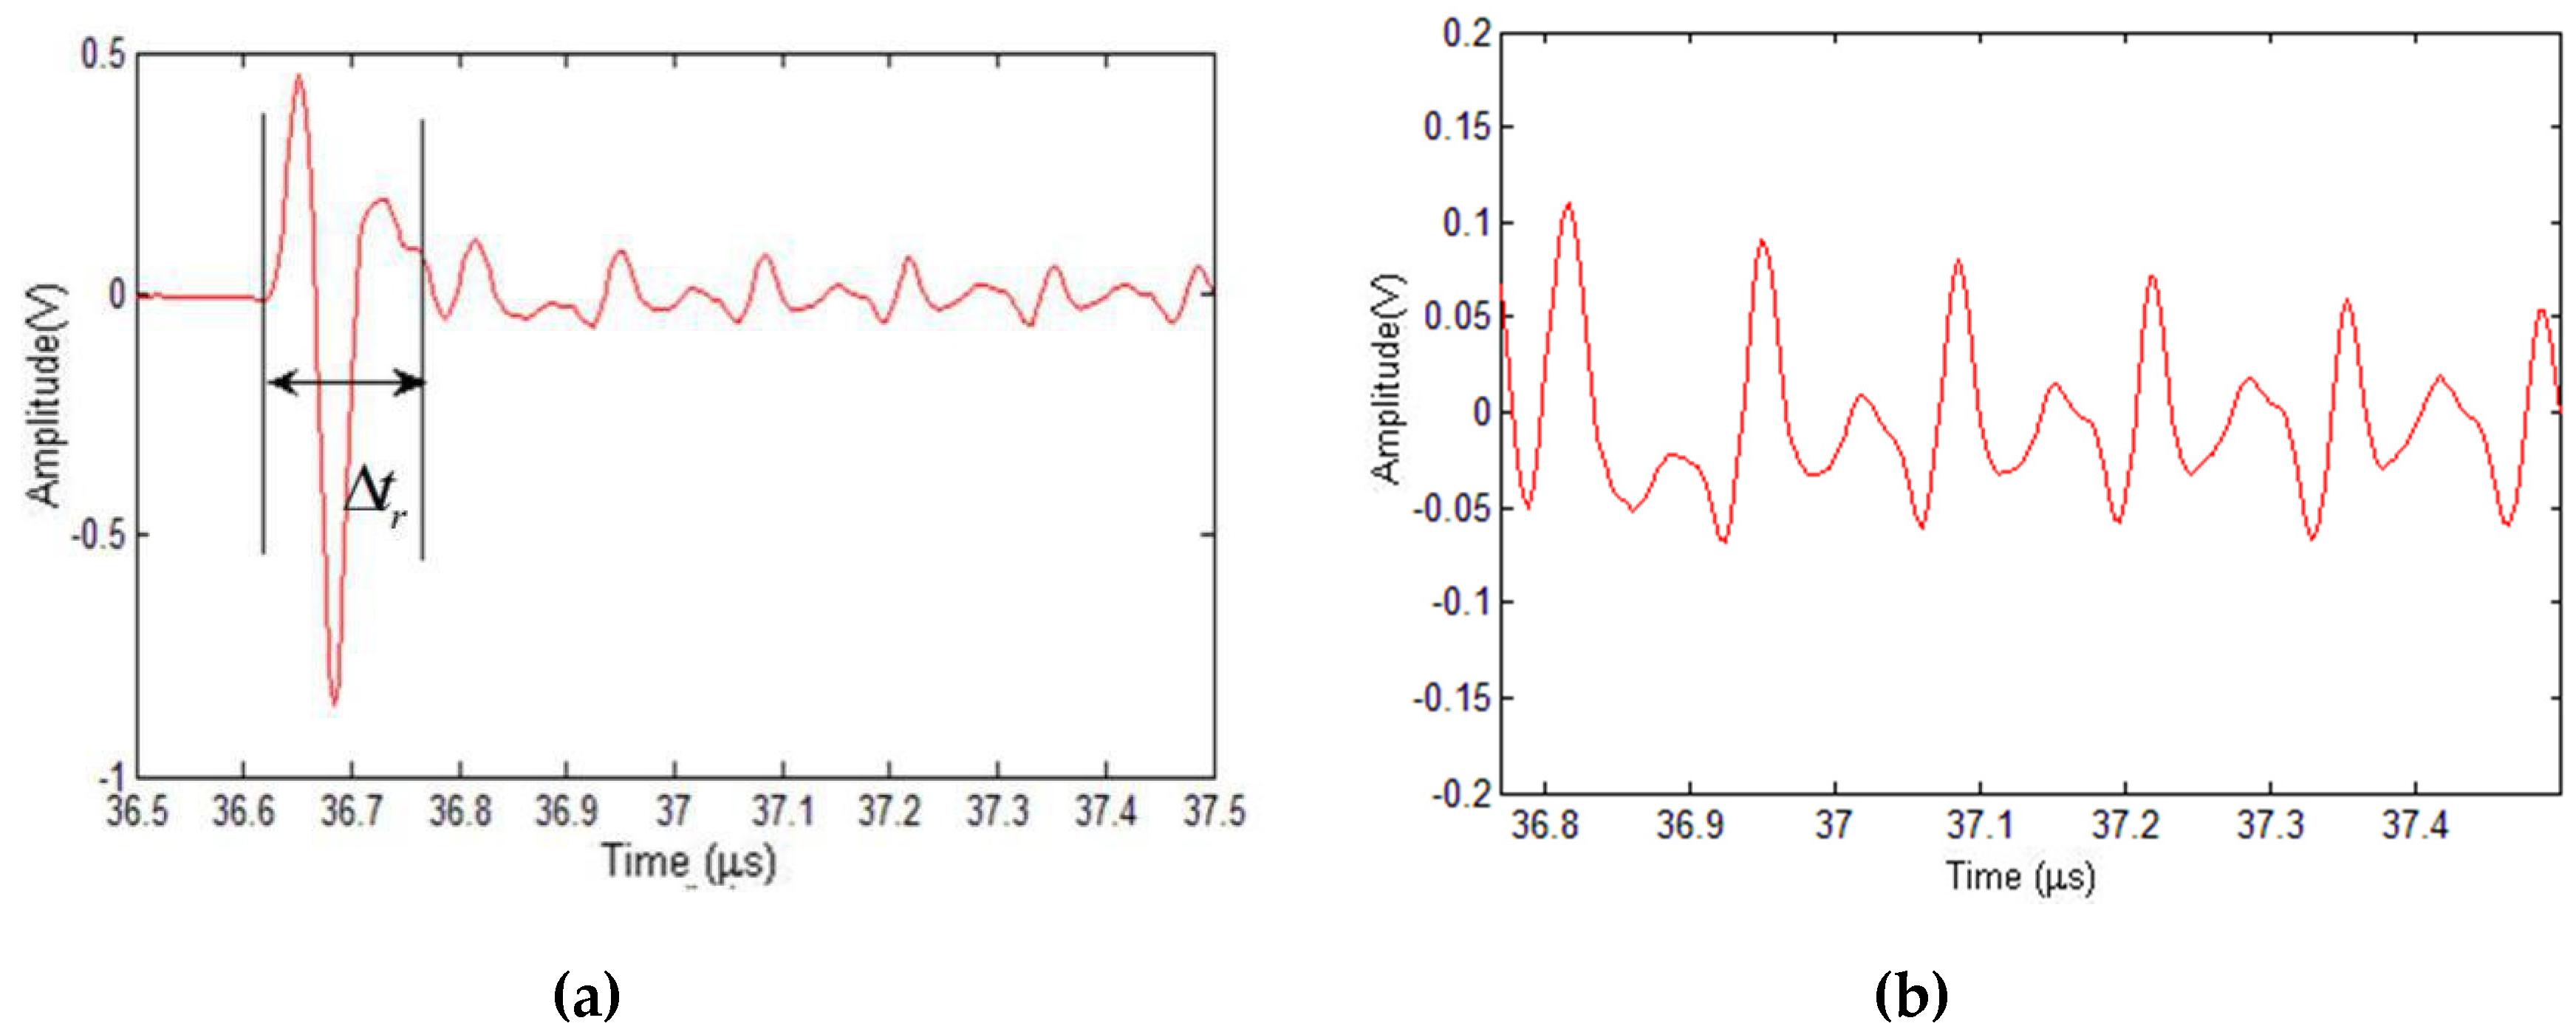
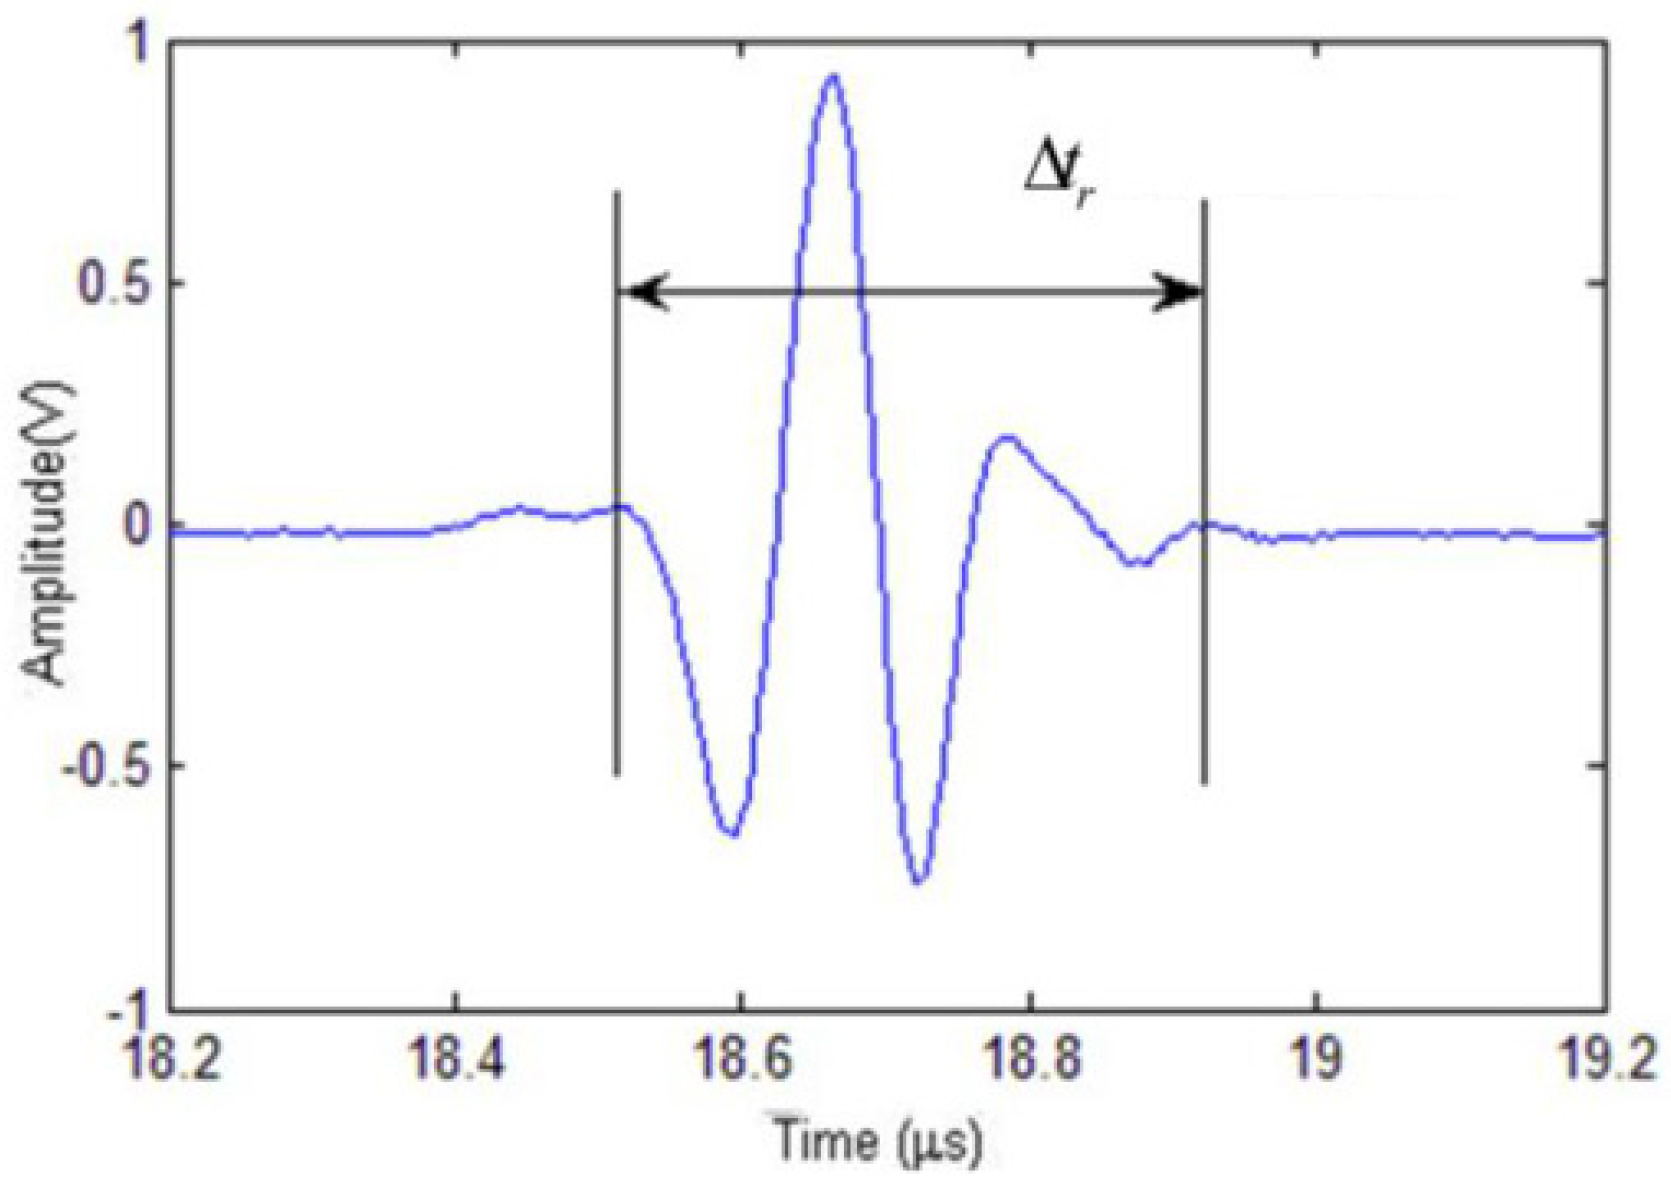
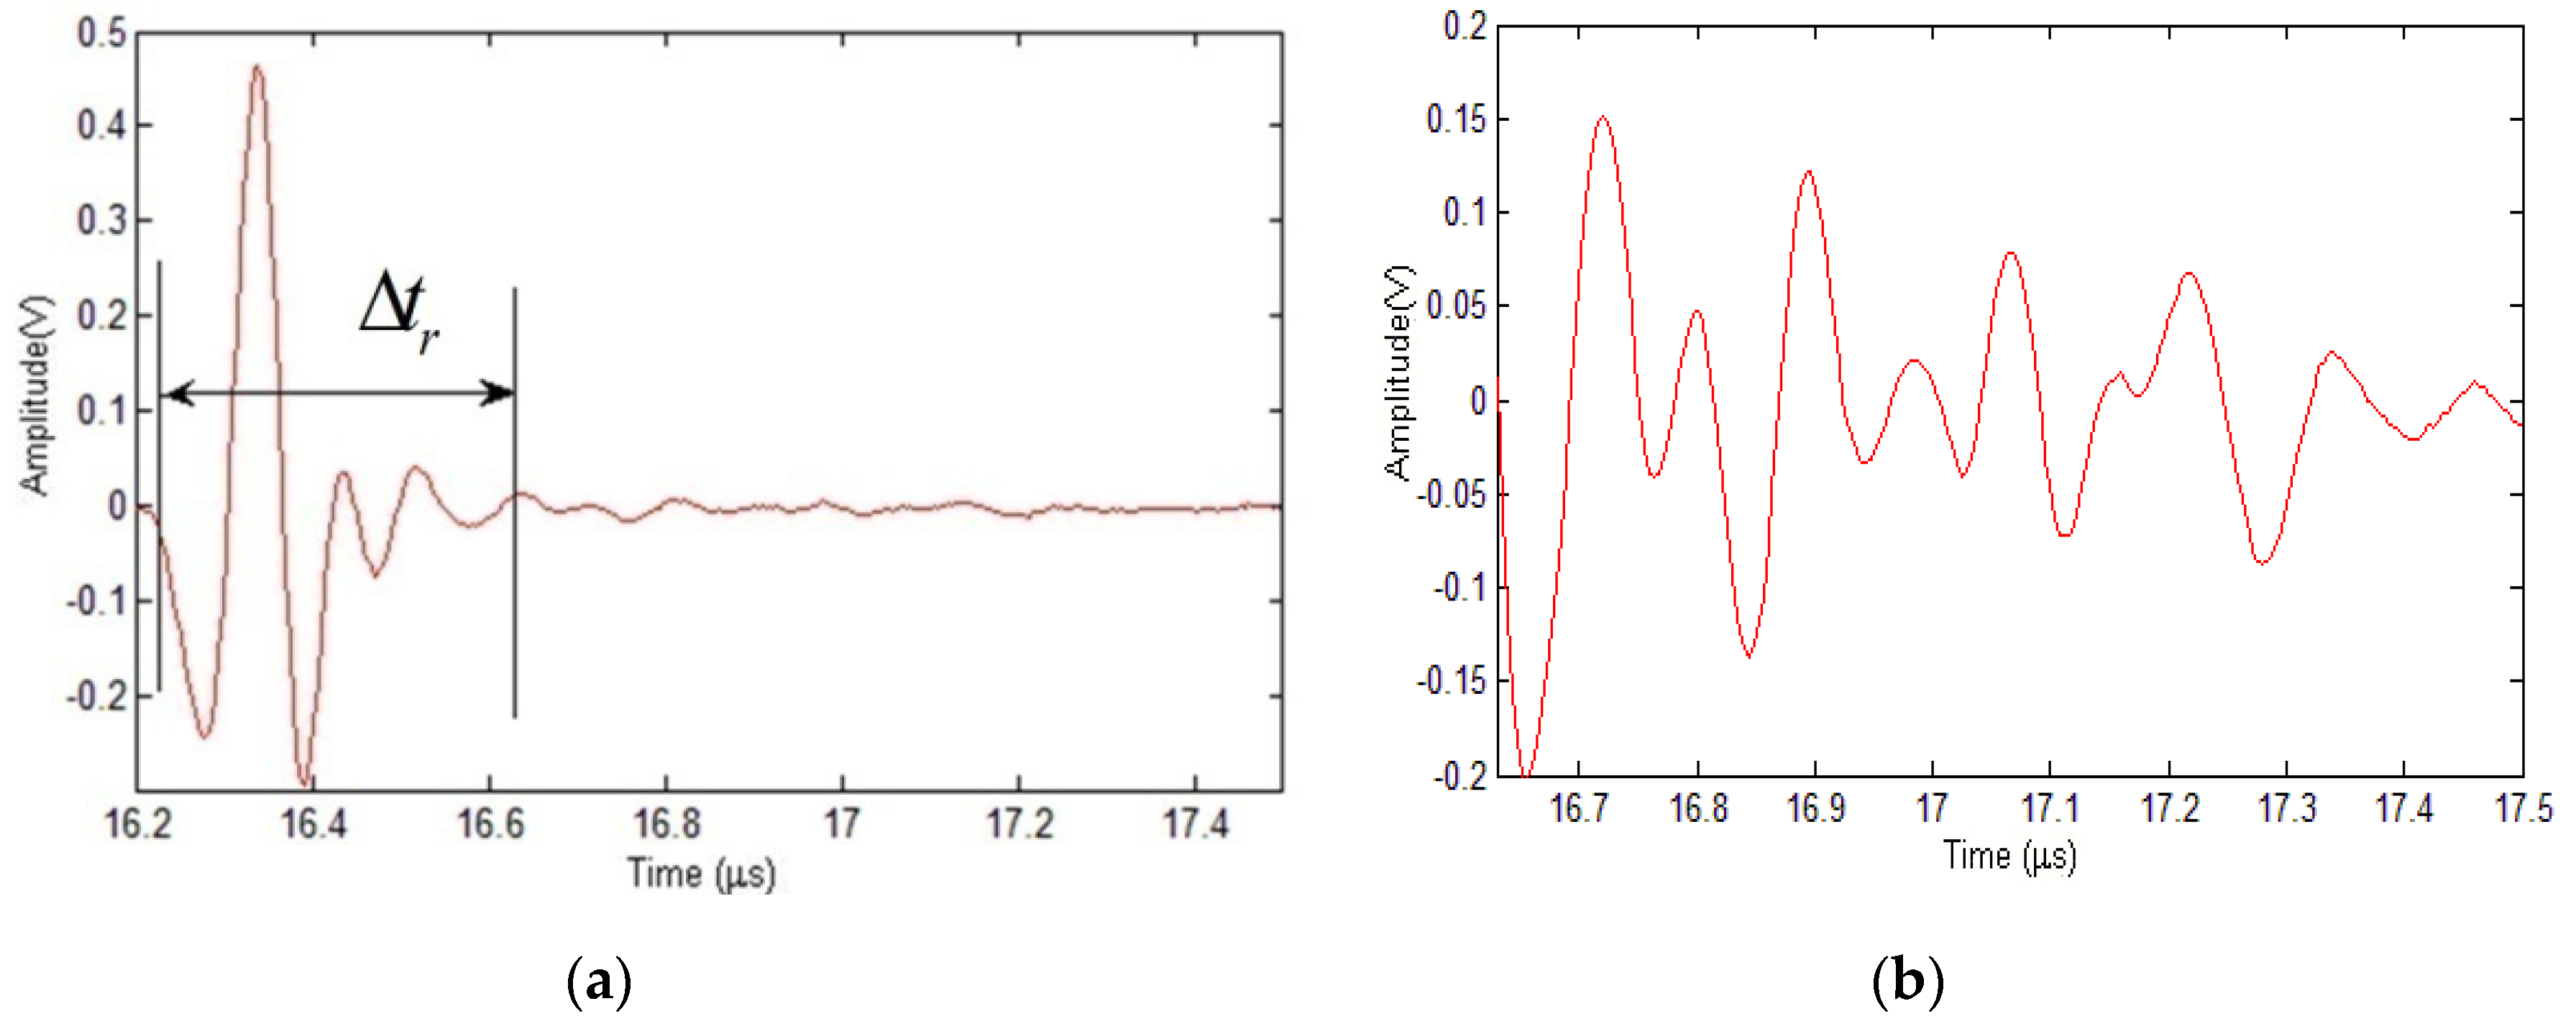
3. Principle of Measurement

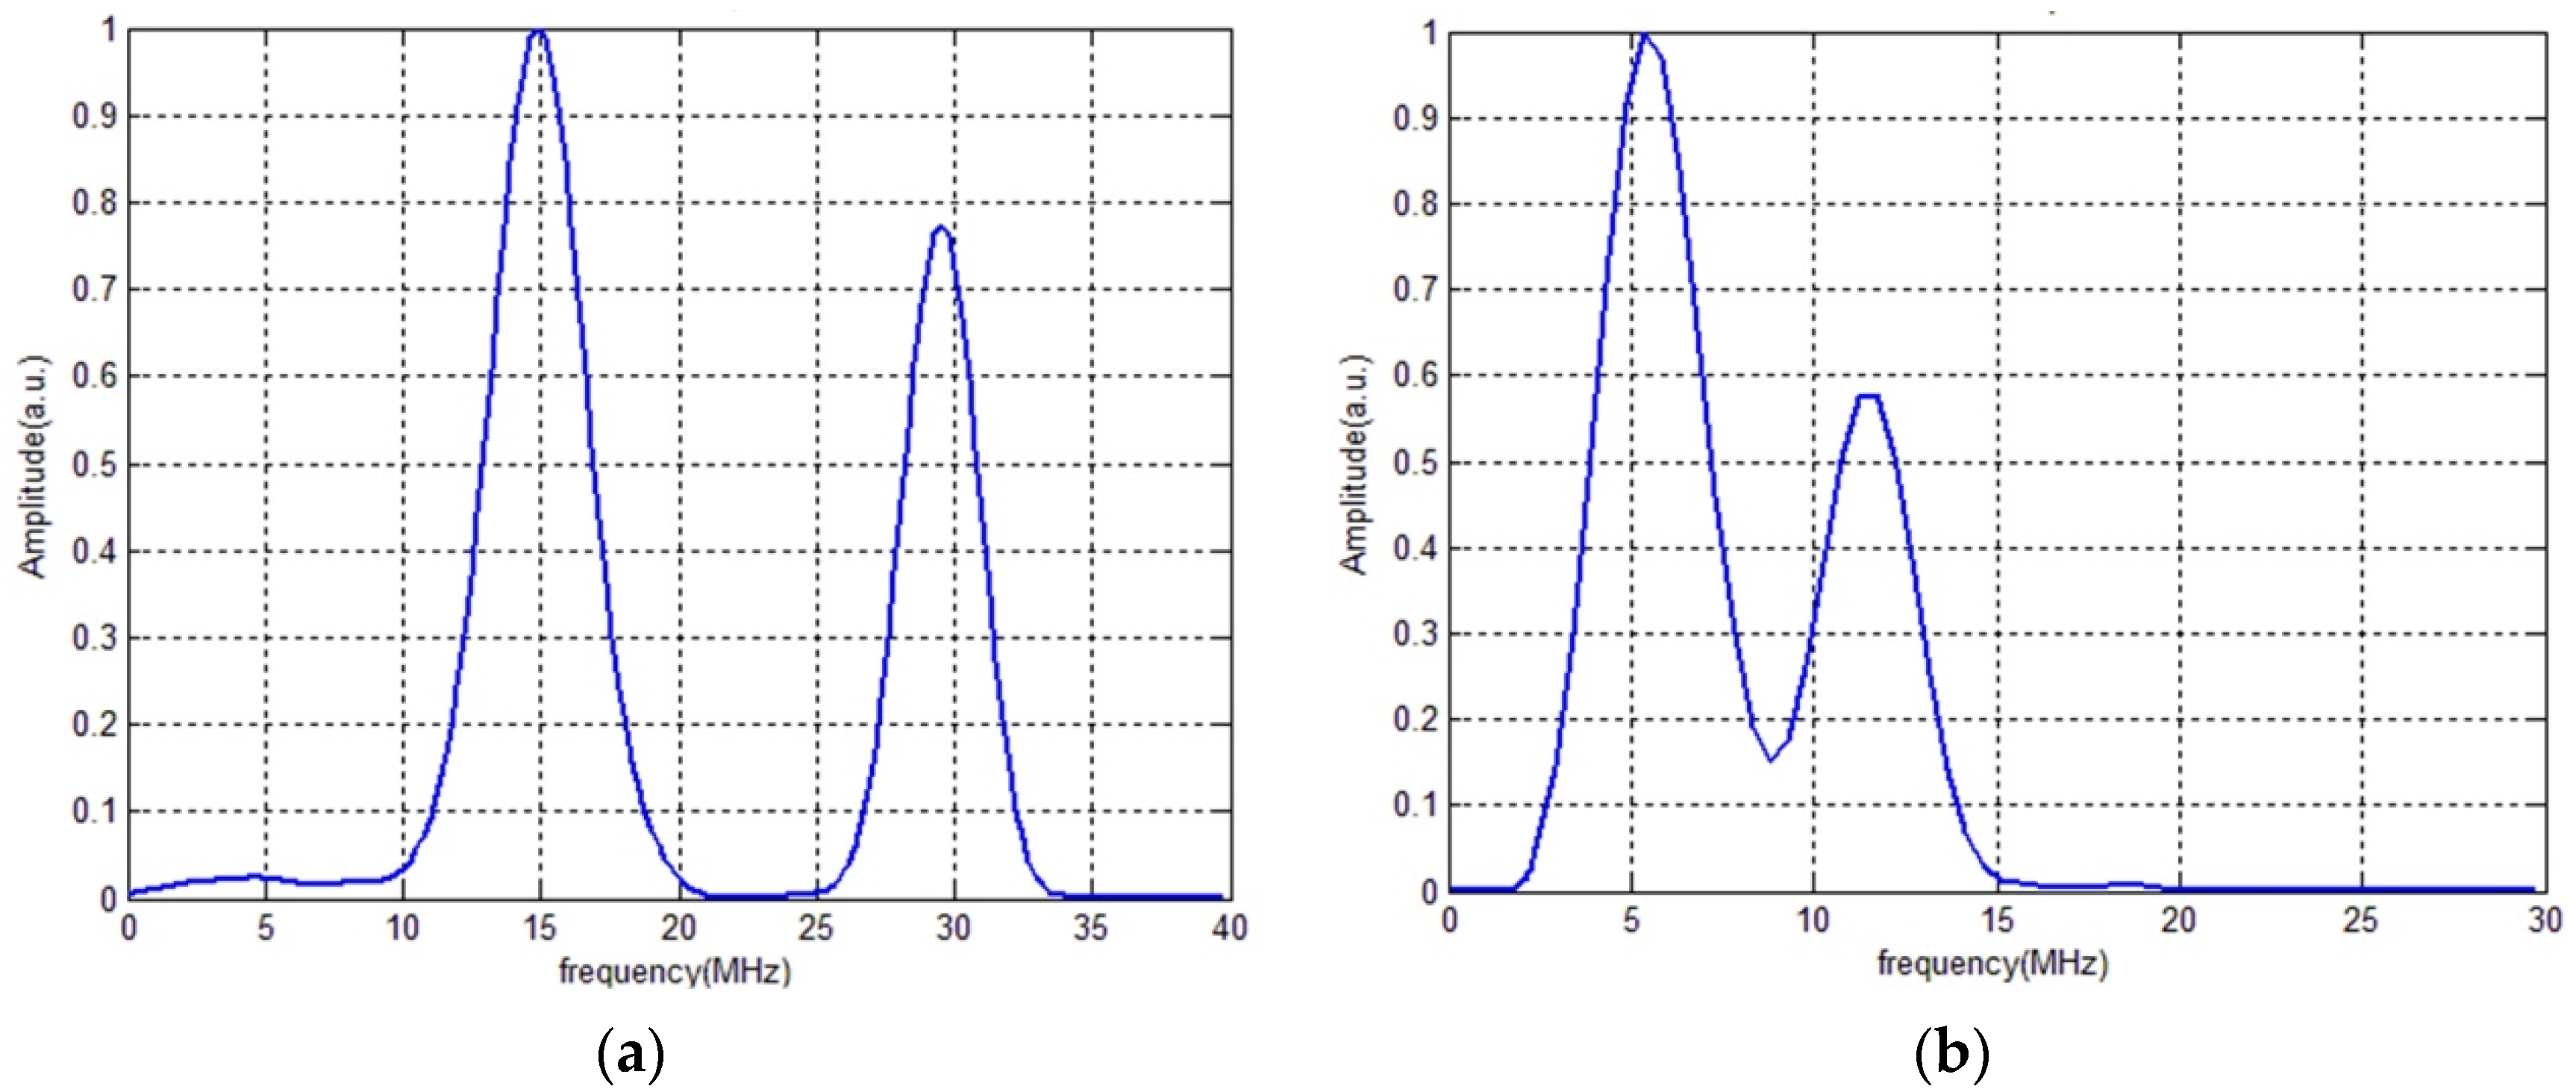
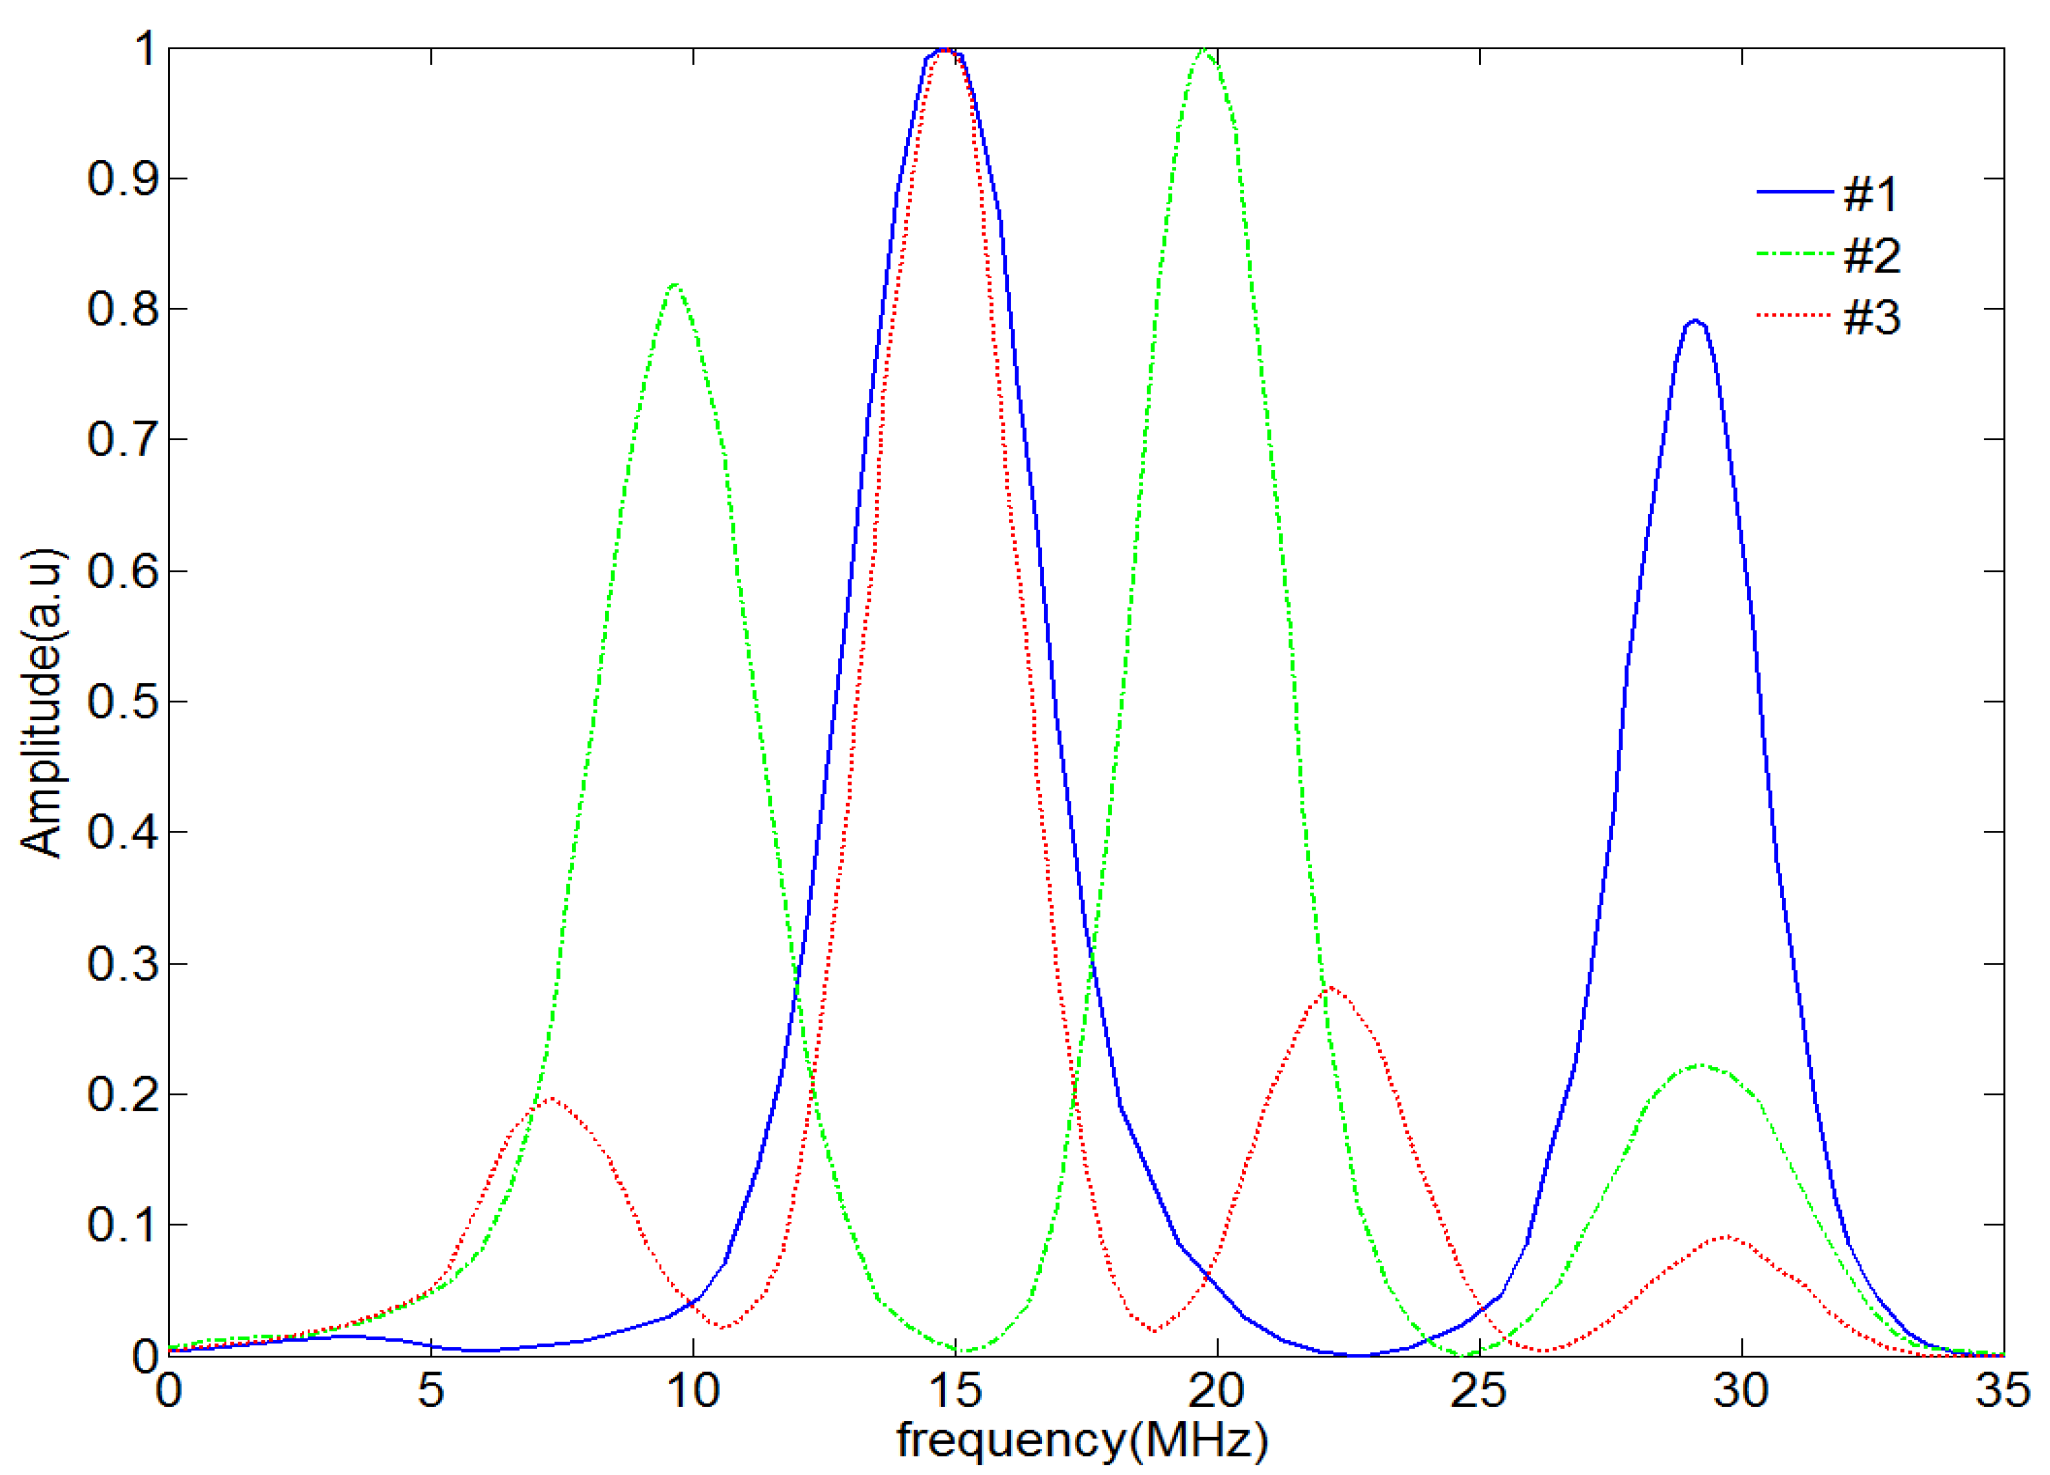
3.1. The Minimum Frequency Interval Method of the Magnitude Spectrum of the Acoustic Pressure Reflection Coefficient

A propagation model of ultrasonic waves in a three-layer medium system formed by water/coating/substrate is shown in Figure 5. Because the coating is thin (micrometer level), the multiple echoes reflected from the coating/substrate interface will mix together with the reflection echo of the coating upper surface, and the characteristic parameters relevant to the coating thickness are included in the mixed signals. Therefore, the acoustic propagation of the model should be analyzed.
In 1978, based on the acoustic pressure reflection coefficient formula of the multilayered medium of the former Soviet Union scientist Brekhovskikh, Haines, Bell, and other researchers [7,10] derived the magnitude spectrum formula (1) of the acoustic pressure reflection coefficient of a multilayered medium under vertical incidence conditions.
| r | = [ r 13 + r 23 e ( 2 α d ) 2 4 r 13 r 23 e 2 α d sin 2 ( 2 π f d / c 3 ) 1 + r 13 r 23 e ( 2 α d ) 2 4 r 13 r 23 e 2 α d sin 2 ( 2 π f d / c 3 ) ] 1 / 2
where lower angles 1, 2, and 3 represent probe delay block, base material, and thin layer, respectively; r 13 and r 23 are the sound pressure reflection coefficients of the interface of heterogeneous materials; d is the thickness of the thin layer; and c 3 f are the sound velocity and sound attenuation coefficients of the thin layer, respectively.
It can be found from the above formula that when sin 2 ( 2 π f d / c 3 ) = 1 i.e., 2 π f d / c L = n π + 2 / π ( n = 0 , 1 , 2 ) , | r | gains the minimal value, and thus the thickness of the interlayer can be obtained from the following formula:
d = c 3 2 Δ f M i n
The coating thickness can be calculated through the minimum frequency interval of the magnitude spectrum of the acoustic pressure reflection coefficient. However, when testing the coatings with this method, it was found that the minimum corresponding frequency was not easily obtained. Therefore, this method should be improved.

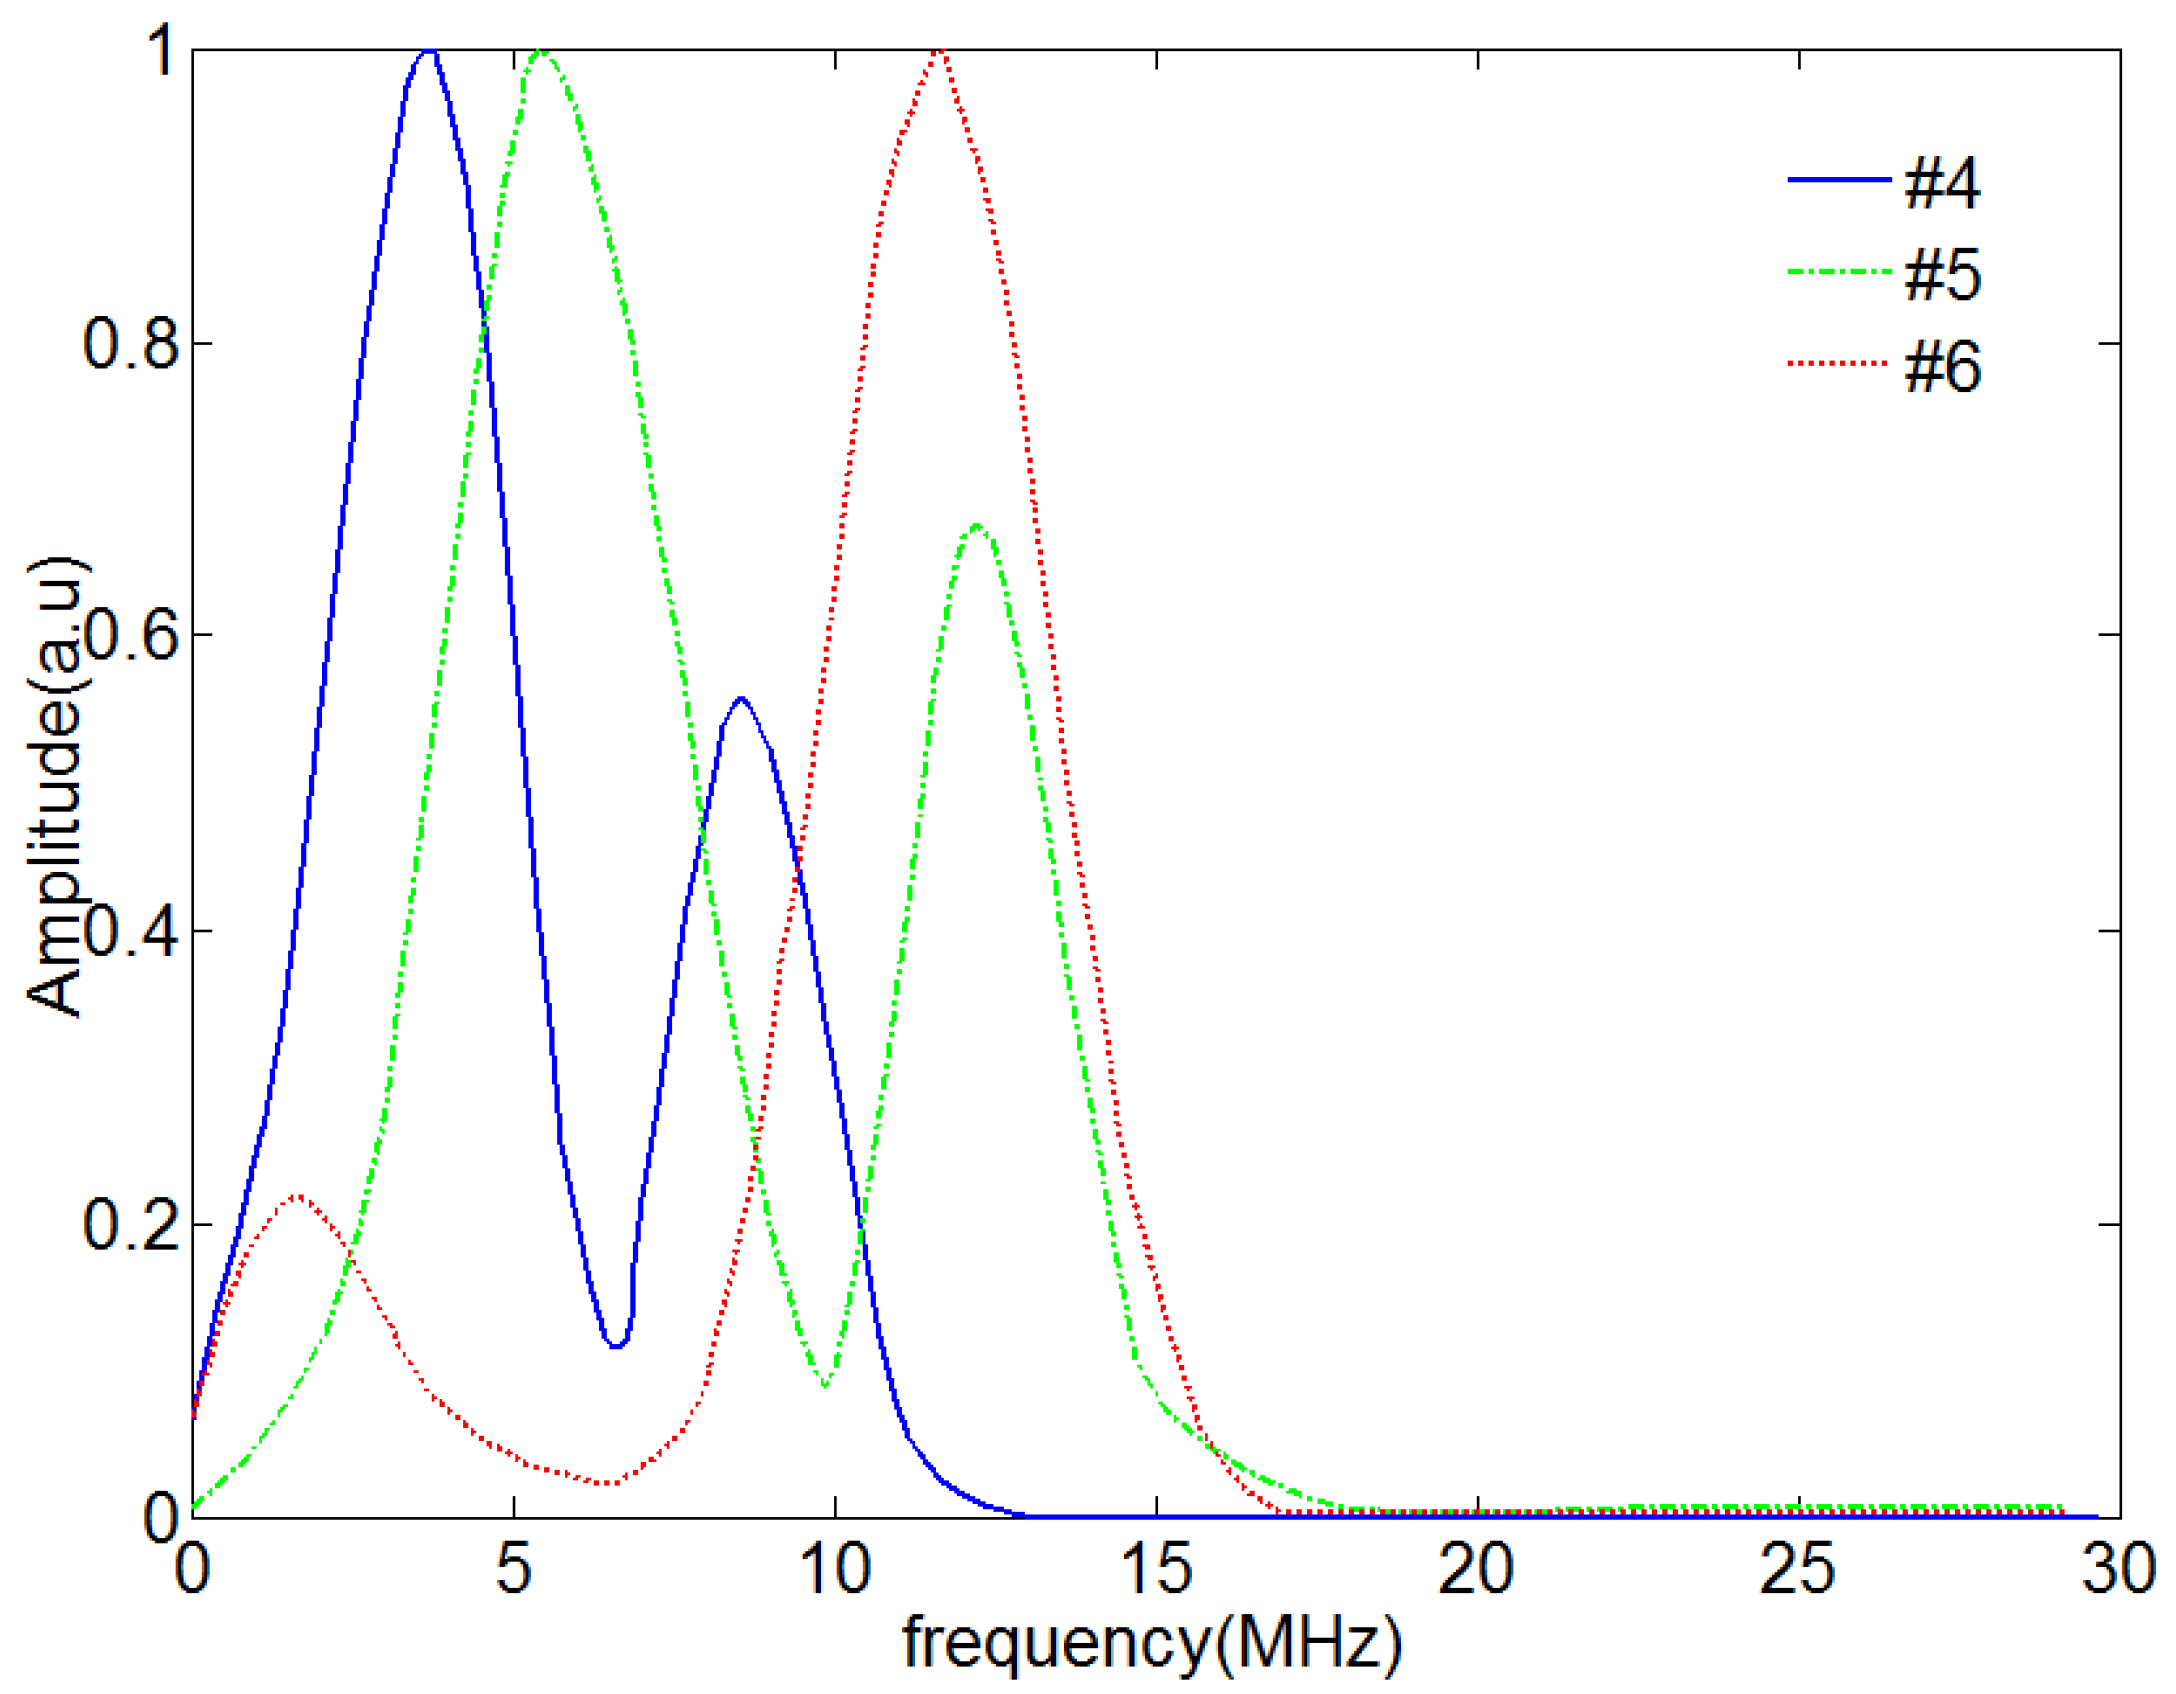
3.2. The Maximum Frequency Interval Method of the Magnitude Spectrum of the Acoustic Pressure Reflection Coefficient

When the ultrasonic wave enters the coating through vertical incidence, a series of reflection echoes will be generated. The method used by Haines analyzed the upper surface reflection echo and the reflection echoes of all coating/substrate surfaces. It can be seen from the analysis of the model in Figure 5 that the reflection coefficient of the water/coating interface is large and acoustic attenuation in the coating is large. Therefore, the amplitude of the upper surface echo is notably larger than the amplitude of the n-time reflection echo of the coating/substrate interface, thus inevitably influencing its signal. Additionally, as the coating thickness information is included in the n-time reflection echo but not in the upper surface echo, we excluded the upper surface reflection echo and only analyzed the multiple-reflection echoes at the coating/substrate interface.
Suppose u ( L , t ) is the signal after ultrasonic propagation of distance L , its Fourier transform is as follows [13]:
F [ u ( L , t ) ] = F [ u ( 0 , t ) ] exp ( α L ) exp ( i k L )
where u ( 0 , t ) is the initial ultrasonic signal, k is the ultrasonic wavenumber, and α is the attenuation coefficient.
Suppose the number of multiple reflection echoes is n , then the reflection echoes can be denoted as n = 0 u ( 2 d n , t ) , in which d is the coating thickness (as shown in Figure 5).
It can be learned from Equation (3) that the Fourier transform of the n -time reflection echo is as follows:
F [ n = 0 u ( 2 d n , t ) ] = n = 0 F [ u ( 2 n d , t ) ] = F [ u ( 0 , t ) ] n = 0 exp ( 2 α n d ) exp ( 2 i k n d )
By making x = exp ( 2 α d ) exp ( 2 i k d ) (in which x < 1 ), the last term in Equation (4) can be represented as follows:
n = 0 exp ( 2 α n d ) exp ( 2 i k n d ) = n = 0 x n = ( 1 x n 1 x ) = ( 1 x ) 1
Substituting Equation (5) into (4) obtains the following:
F [ n = 0 u ( 2 d n , t ) ] = F [ u ( 0 , t ) ] [ 1 exp ( 2 α d ) exp ( 2 i k d ) ] 1
where k = 2 π f / c L and c L represents the longitudinal wave velocity of the coating.
By taking the square to the two sides of Equation (6), the following is obtained:
| F [ n = 0 u ( 2 d n , t ) ] | 2 = | F [ u ( 0 , t ) ] | 2 1 + exp ( 4 α n d ) 2 exp ( 2 α d ) cos ( 4 π f d / c L )
It is learned from the analysis of the above equation that when cos ( 4 i π f d / c L ) = 1 , i.e., 4 π f d / c L = 2 m π ( m = 0 , 1 , 2 ) , Equation (5) assumes the maximum value. At this time, its thickness can be calculated from the following formula when the coating acoustic velocity is known:
d = c L 2 Δ f M a x
where Δ f M a x represents the frequency interval between two adjacent maximum values in the spectrogram.
Formulas (8) and (2) are similar in form because their principles are both interference effects. The experiments show that the improved method can help improve the maximum value corresponding frequency.

3.3. The Maximum Frequency Interval Method by Adopting Welch Spectrum Estimation

To accurately extract the maximum value frequency corresponding to each examination point, the analysis method of power spectrum estimation was introduced for further improvement. The classic spectrum analysis methods can be divided into autocorrelation methods used to acquire spectrum with random sequences and direct methods used to acquire spectrum with fast Fourier transforms. In a direct method, i.e., a period gram method, the N-point data of ultrasonic testing signal x(t) are considered finite energy signals, and their Fourier transforms are taken. Then, the period gram spectrum estimation expression is as follows [14]:
P p e r ( f ) = ( 1 / N ) | X N ( f ) | 2
where N represents the data number of the signal and X N ( f ) represents the Fourier transform corresponding to data point x N .
By making a simultaneous equation between (7) and (9), the period gram spectrum estimation of the n-time reflection echo signal can be obtained:
P p e r ( f ) = 1 N | F [ n = 0 u ( 2 d n , t ) ] | 2 = | F [ u ( 0 , t ) ] | 2 N [ 1 + exp ( 4 α n d ) 2 exp ( 2 α d ) cos ( 4 π f d / c 2 ) ]
It can be found from the above analysis that the period gram spectrum estimation P p e r ( f ) is directly obtained with the Fourier transform, and its variance performance is poor. Additionally, when the processing data are long, the spectrum curve fluctuation is large; however, when the data are short, its resolution ratio is low. In these cases, the extreme value points in the power spectrum chart are not obvious, so the improved spectrum estimation method needs to be applied.
Therefore, the Welch spectrum estimation method was adopted to process the signal. The Welch method [15] is an improved method used to estimate the period gram. It is also called the weighted overlapped segment averaging method. Adopting the ideas of segmental averaging and time window function, Welch method spectrum estimation can improve the variance of data and obtain better power spectrum estimation.
In this method, the datum x N ( n ) with a length of N is first divided into L sections in partial overlapping, namely,
x N i ( n ) = x ( n + i M N ) , 0 n M 1 , 1 i L
where M represents the data length of each section, L = N/M.
Then, the window function is applied to each section of data truncation to select the Hamming window. Then, L amended period gram spectrum estimations can be calculated:
J i ( f ) = 1 M U | n = 0 M 1 x N i ( n ) d 2 ( n ) e j w n | 2 ,   i = 1 , 2 , , L
where d 2 ( n ) is the Hamming window, and U is the normalizing factor. The expression of U is denoted as follows:
U = 1 M n = 0 M 1 d 2 2 ( n )
Finally, we average Equation (12), and then the power spectrum estimation obtained by the Welch method is as follows:
P p e r ( f ) = 1 L i = 1 L P p e r i ( f ) = 1 M U L i = 1 L | n = 0 M 1 x N i ( n ) d 2 ( n ) e j w n | 2
Therefore, the overlapping signal of the n-time reflection echo can be selected to make the Welch method spectrum estimation. It can be found from the above analysis that the Welch power spectrum will have a periodic maximum, and the coating thickness can be calculated from Formula (8) by acquiring the frequency interval between two adjacent maximum values.
The proposed method was used to measure the two kinds of coatings (as shown in Figure 6). The maximum corresponding frequency was clearly obtained, so the improved method was more suitable for coating testing.

4. Results and Discussion

This section is divided into subheadings to provide a concise and precise description of the experimental results, their interpretations, and the experimental conclusions that can be drawn.

4.1. Stainless Steel Coating Detection

The method described in Section 3.3 was used to detect the stainless steel coating system. Figure 7 shows a schematic diagram of the pulse duration Δ t r of the 20 MHz immersion probe.
Figure 8a, Figure 9a, and Figure 10a show the time domain figures of specimens #1, #2, and #3, respectively, including the upper surface echo of the coating. Figure 8b, Figure 9b, and Figure 10b show the time domain signals of n-time echo signals obtained after the corresponding specimen removed the upper surface echo through pulse duration.
Then, the signals were processed with the Welch method to obtain the corresponding Welch power spectrum figure (Figure 11). The stainless steel velocity c L was 5820 m/s.
We made 10 measurements of specimens #1, #2, and #3 and took the average intervals, which were 14.8, 9.8, and 7.3 MHz, respectively. The ultrasonic measurement values were 196.6, 296.9, and 398.6 µm, respectively, and the errors were 1.7%, 1.0%, and 0.4%, respectively, as shown in Table 1.

4.2. YSZ Coating Detection

To verify whether the method applies to thermal sprayed coating, the same measurement steps were adopted for specimens #4, #5, and #6. Figure 12 shows a schematic diagram of the pulse duration Δ t r of the 10 MHz immersion probe.
The time domain figures of specimens #4, #5, and #6, including the upper surface echo of the coating, are shown in Figure 13a, Figure 14a, and Figure 15a, respectively. The time domain signals of n -time echo signals obtained after the corresponding specimen removed the upper surface echo through pulse duration are shown in Figure 13b, Figure 14b, and Figure 15b.
Then, the signals were processed with the Welch method to obtain the corresponding Welch power spectrum figure (Figure 16). The YSZ velocity c L was 3250 m/s.
The same procedure was applied to specimens #4, #5, and #6, and the ultrasonic measurement values were 345.7, 235.5, and 165.8 µm, respectively, and the errors were 2.7%, 3.7%, and 3.9%, respectively, as shown in Table 2. Comparing the errors of the two kinds of specimens, the measurement error of the YSZ coating was obviously larger than that of the uniform stainless steel coating, which can be attributed to the nonuniform coating caused by the thermal spraying preparation technology.

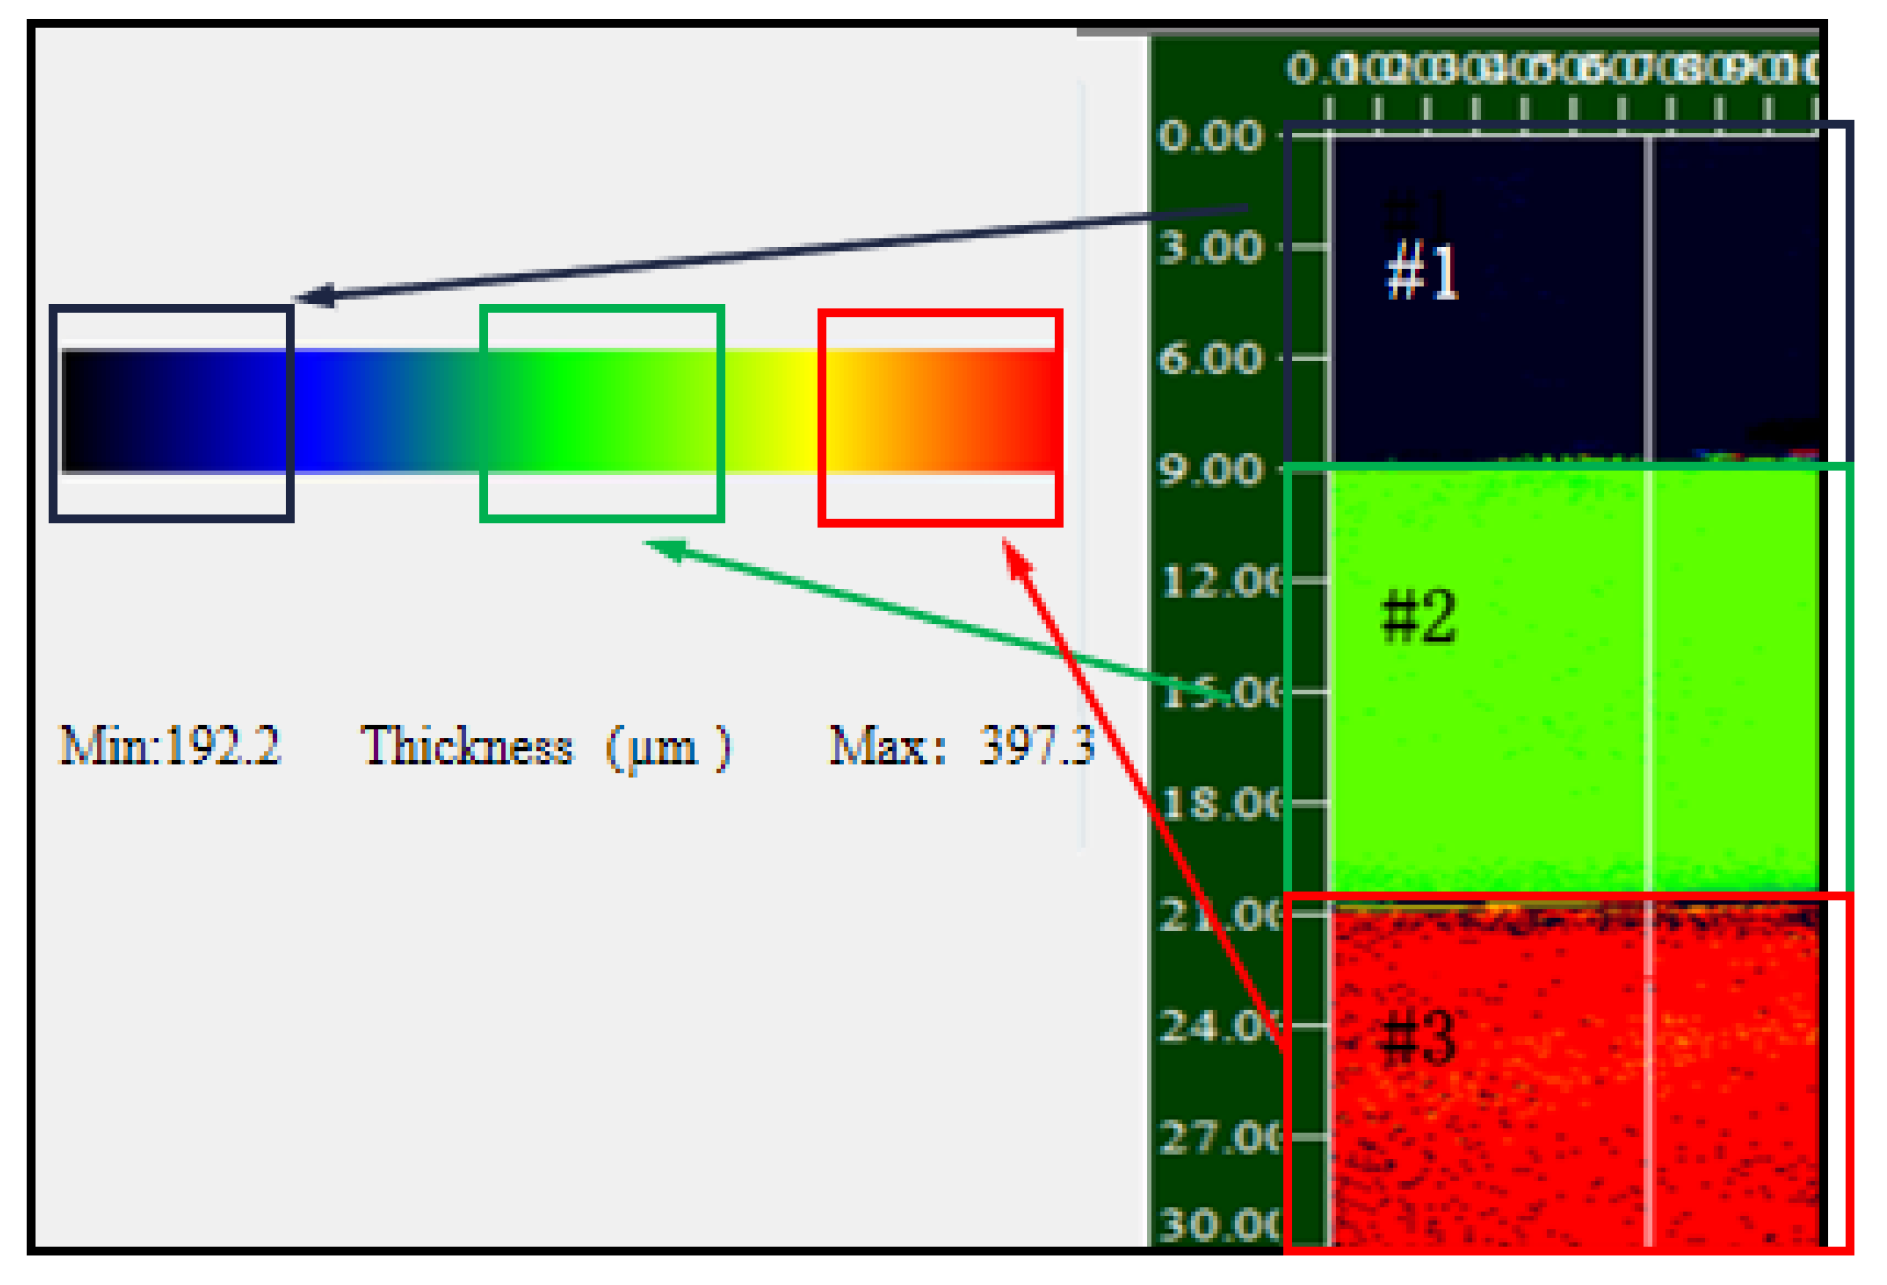
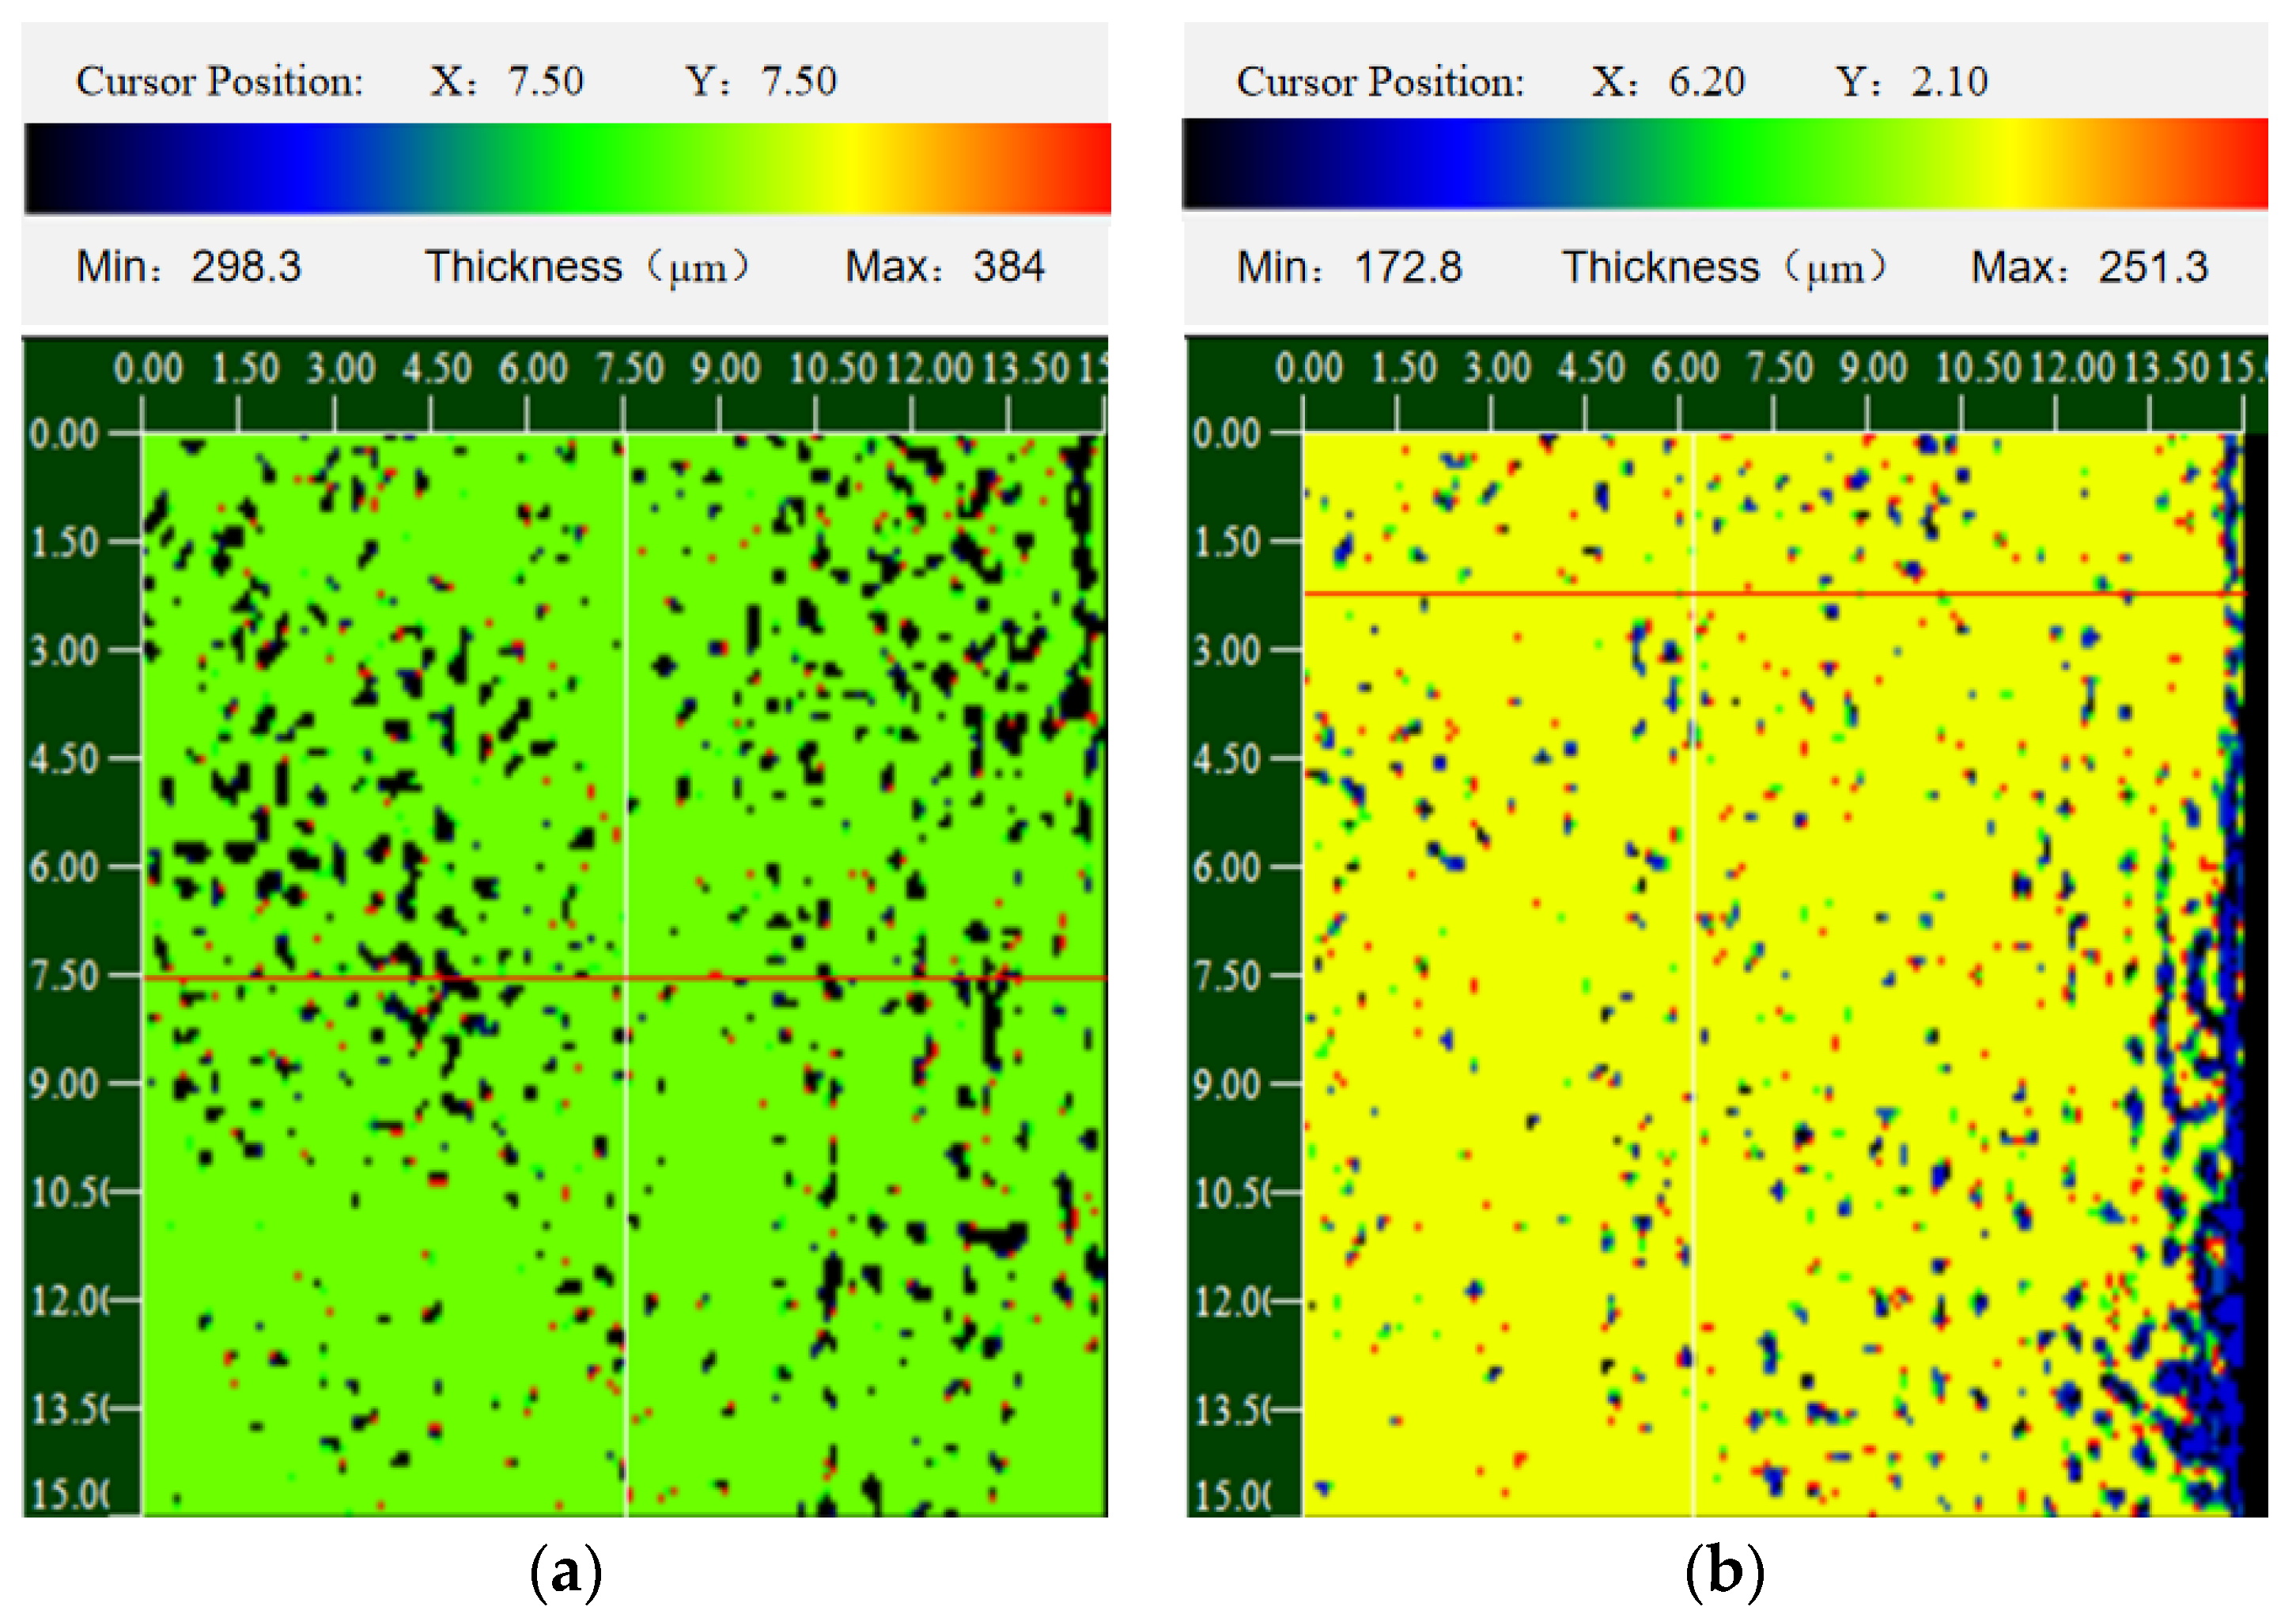
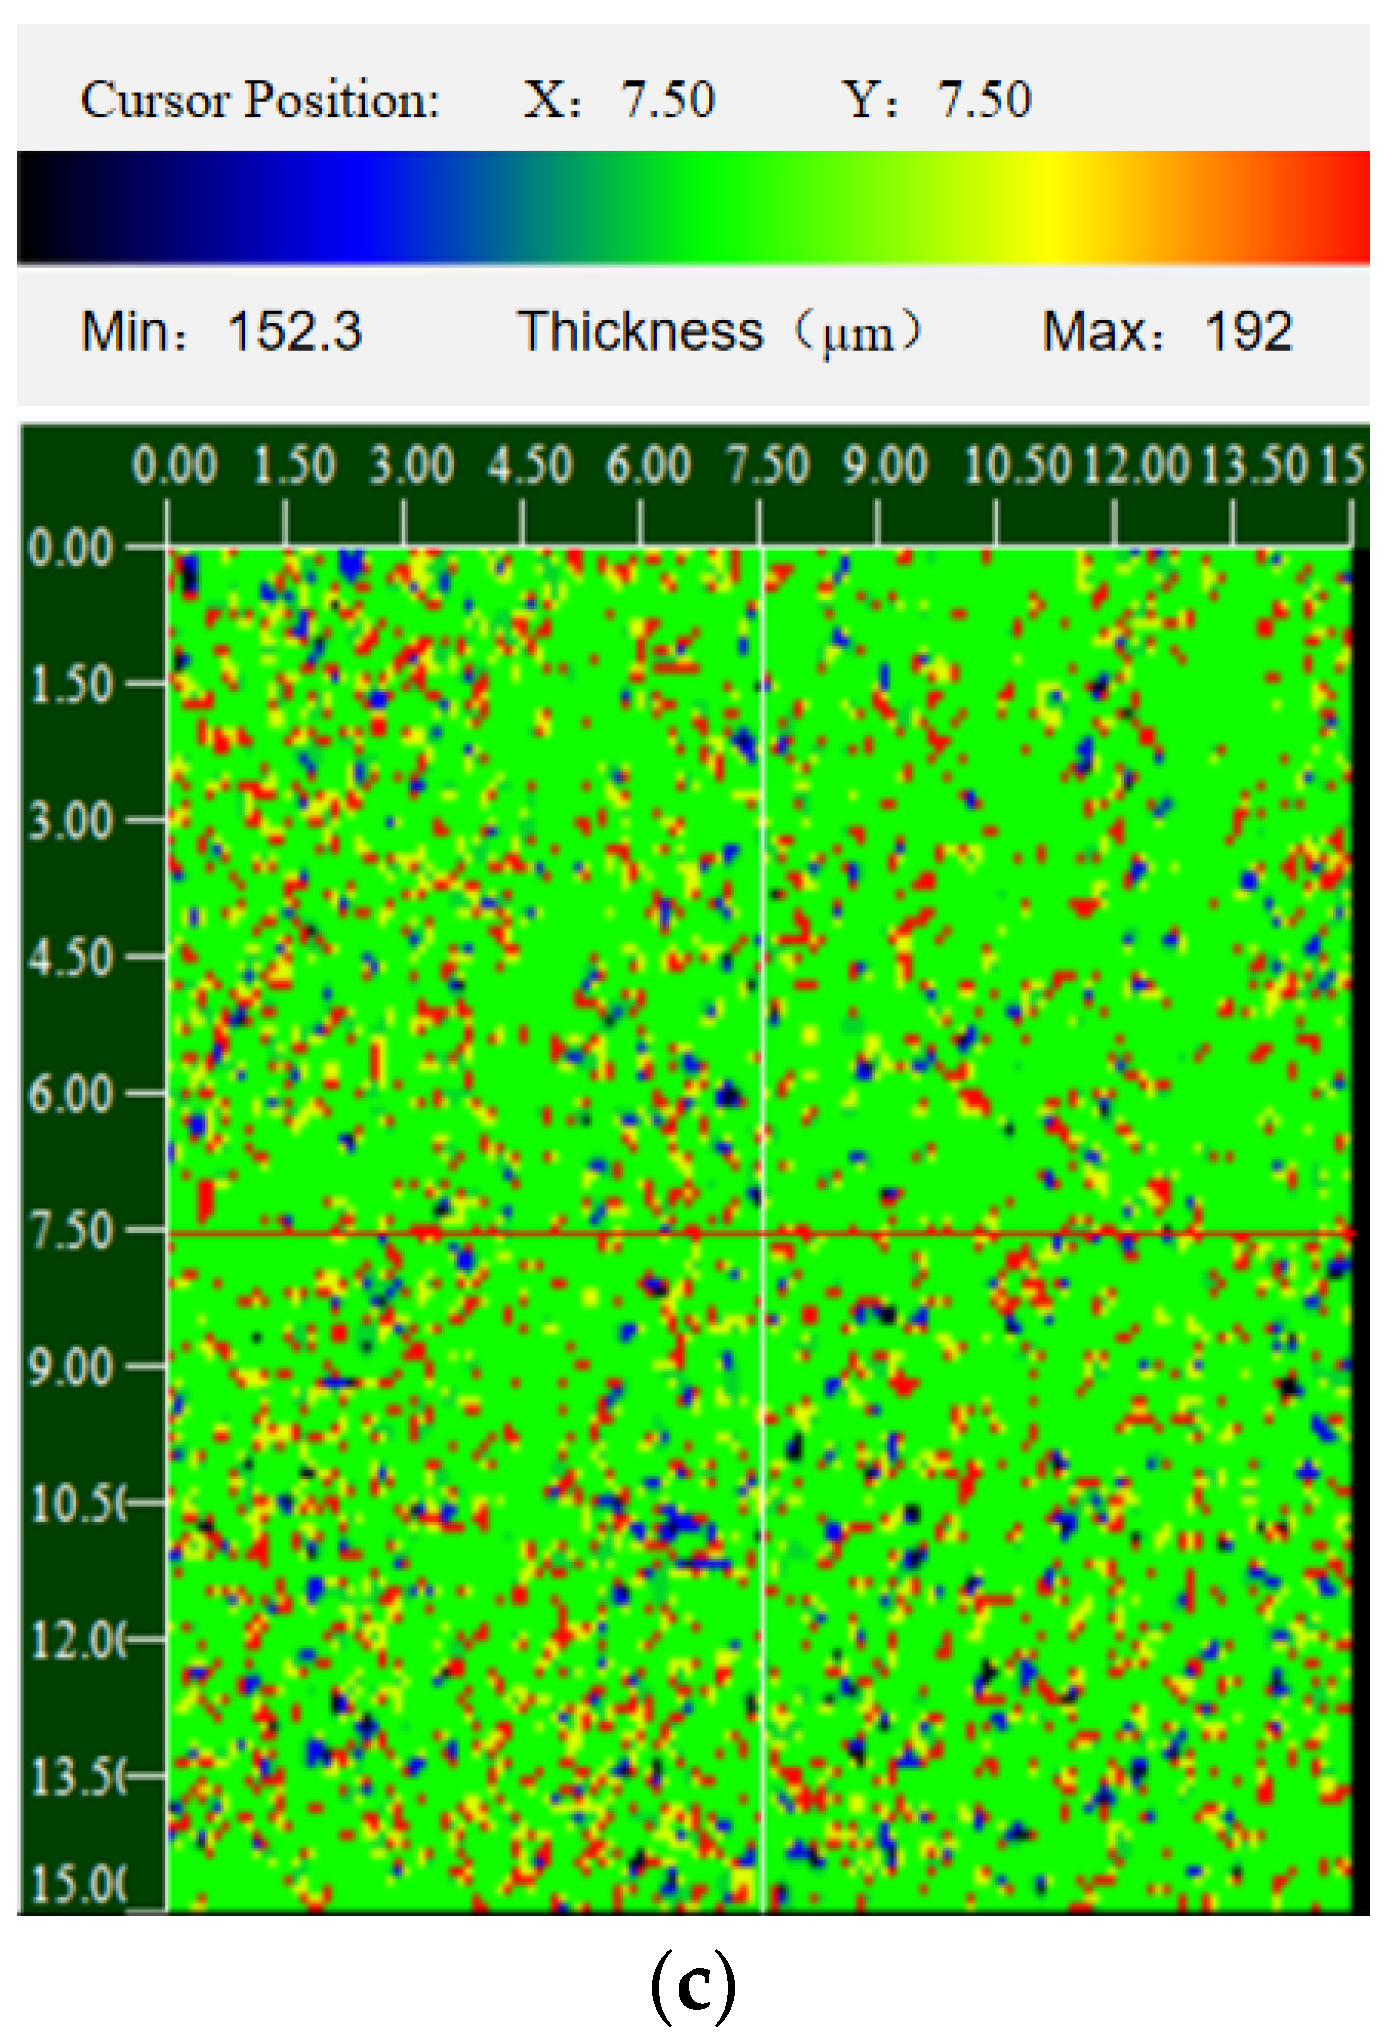
4.3. Evaluation of Homogeneity of Sprayed Coating Thickness

A scanning method for measuring the coating thickness distribution was developed using an ultrasonic scanning microscopy system. Based on the basic reflection C-scan mode and the Welch power spectrum, a thickness measurement method was proposed to form a C-scan image of the coating thickness distribution. The uniform coating specimens #1, #2, and #3 were scanned to obtain the C-scan image of their thickness distribution, as shown in Figure 17. The orange dotted box in the figure displays the maximum and minimum values of thickness in the image (the minimum value of thickness in the image was 192.2, and the maximum value was 397.3), and each thickness value range corresponds to a specific color range. The image of thickness distribution on the right-hand side is clearly divided into three areas: the blue area is the thickness distribution of specimen #1 (the minimum thickness area of the figure), the green area is the thickness distribution of specimen #2, and the red area is the thickness distribution of specimen #3 (the maximum thickness area of the figure). By comparing the thickness value represented by the color value of each region with the measured results in Table 1, it was verified that the imaging method could accurately map the thickness value to the color value. The thickness distribution diagram on the right-hand side of Figure 17 shows the three specimens had fewer colors and concentrated colors, that is, the thickness distribution was more uniform, and only some points had different colors from the surrounding areas, which might have been caused by the binding interface or surface bubbles.
Through the actual test of the above coating, it was verified that this program could realize the C-scan imaging of coating thickness distribution, and on this basis, the uniformity detection requirements could be achieved through the analysis of its thickness variation range and color dispersion. Figure 18a–c shows that there are many colors, indicating that the thickness varied widely and the uniformity was poor, which might have been caused by the plasma spraying method. Thus, this method can be used to visually evaluate the uniformity of coating thicknesses.

5. Conclusions

In conclusion, to realize coating thickness measurement, a corresponding ultrasonic testing system was established. The ultrasonic microscopy system supports a series of high-frequency probes for the detection of thinner spray coating thicknesses. Based on the principle that the ultrasonic wave propagates in the coatings, echoes from the top and bottom interfaces that overlap and interfere were transformed by the Welch power spectrum. The interference phenomena were observed accurately in the amplitude spectra of the echoes. It was experimentally verified that the coating thickness properties could be evaluated by scanning acoustic microscopy. The contrast error was less than 4% with the microscope method. The uniformity of the sprayed coating thickness could be intuitively observed from C-scan images by programming. This experimental system will have wide application prospects in coating measurement and uniformity analysis.

Author Contributions

Conceptualization, C.X. and L.H.; methodology, C.X., L.H. and D.X.; software, C.X. and D.X.; validation, C.X., L.H. and D.X.; writing—original draft preparation, L.H.; writing—review and editing, L.H. and Q.W.; visualization, L.H. and P.M.; supervision, C.X. and D.X.; project administration, C.X.; funding acquisition, C.X. All authors have read and agreed to the published version of the manuscript.

Funding

This work was supported by the National Natural Science Foundation of China (Grant Nos. 51335001 and U1737203), the ultrasonic nondestructive testing and high-energy acoustic beam in-situ control of residual stress distribution in astronautic aluminum alloy structures of weak rigidity.

Conflicts of Interest

The authors declare no conflict of interest.

References

  1. Lu, Z.; Myoung, S.W.; Kim, E.H.; Lee, J.H.; Jung, Y.G. Microstructure Evolution and thermal durability with coating thickness in APS thermal barrier coatings. Mater. Today Proc. 2014, 1, 35–43. [Google Scholar] [CrossRef]
  2. Fang, X.F.; Zhang, G.B.; Feng, X. Performance of TBCs system due to the different thickness of top ceramic layer. Ceram. Int. 2015, 41, 2840–2846. [Google Scholar] [CrossRef]
  3. Moskal, G.; Witala, B.; Rozmyslowska, A. Metallographic preparation of the conventional and new TBC layers. Arch. Mater. Sci. Eng. 2009, 39, 53–60. [Google Scholar]
  4. Li, Y.; Chen, Z.M.; Mao, Y.; Qi, Y. Quantitative evaluation of thermal barrier coating based on eddy current technique. NDT E Int. 2012, 50, 29–35. [Google Scholar]
  5. Ma, Z.Y.; Zhang, W.; Du, P.C.; Zhu, X.P.; Krishnaswanmy, S.; Lin, L.; Lei, M.K. Nondestructive measurement of elastic modulus for thermally sprayed WC-Ni coatings based on acoustic wave mode conversion by small angle incidence. NDT E Int. 2018, 94, 38–46. [Google Scholar]
  6. Stotter, B.; Gresslehner, K.H.; Mayr, G. Estimation of material parameters from pulse phase thermography data. AIP Conf. Proc. 2014, 1581, 1126–1133. [Google Scholar]
  7. Brekhovskikh, L. Wave in Layered Medium, 2nd ed.; Elsevier: Amsterdam, The Netherlands, 1985. [Google Scholar]
  8. Lu, X.M.; Reid, J.M.; Soetanto, K.; Weng, L.; Genis, V. Cepstrum technique for multilayer structure characterization. Ultrason. Symp. 1990, 3, 1571–1574. [Google Scholar]
  9. Lavrentyev, A.I.; Rokhlin, S.I. An ultrasonic method for determination of elastic moduli, density, attenuation and thickness of a polymer coating on stiff plate. Ultrasonic 2001, 39, 42–50. [Google Scholar] [CrossRef]
  10. Haines, N.F.; Bell, J.C.; Mclntyre, P.J. The application of broadband ultrasonic spectroscopy to the study of layered media. J. Acoust. Soc. Am. 1978, 64, 1645–1651. [Google Scholar] [CrossRef]
  11. Zhao, Y.; Lin, L.; Li, X.M.; Lei, M.K. Simultaneous determination of the coating thickness and its longitudinal velocity by ultrasonic nondestructive method. NDT & E Int. 2010, 43, 579–585. [Google Scholar]
  12. Ma, Z.Y.; Luo, Z.B.; Lin, L.; Krishnaswamy, S.; Lei, M.K. Quantitative characterization of the interfacial roughness and thickness of inhomogeneous coatings based on ultrasonic reflection coefficient phase spectrum. NDT E Int. 2019, 102, 16–25. [Google Scholar]
  13. Liu, Z.; Wang, L. Thickness Measurement Technology with Magnitude Spectrum of Pulsed Ultrasound. Meas. Technol. 1999, 5, 6–8. [Google Scholar]
  14. Xue, N.X. Application of MATLAB in Digital Signal Processing; Tsinghua University Press: Beijing, China, 2008. [Google Scholar]
  15. Peter, D.W. The Use of Fast Fourier Transform for the Estimation of Power Spectra: A Method Based on Time Averaging Over Short, Modified Periodo grams. IEEE Trans. Audio Electroacoust. 1967, 15, 70–73. [Google Scholar]
Figure 1. Block diagram of the scanning ultrasonic microscopy system.
Coatings 10 00676 g001
Figure 2. Block diagram of the ultrasonic microscopy system. (a) The movement track of the focused transducer; (b) the image of the testing area, which can be obtained by processing the data collected in C-scan mode.
Coatings 10 00676 g002
Figure 3. Microscopic images of the cross section of YSZ coating specimens: (a) #4; (b) #5; (c) #6.
Coatings 10 00676 g003
Figure 4. The scanning ultrasonic microscopy system.
Coatings 10 00676 g004
Figure 5. Acoustic propagation model of water/coating/substrate.
Coatings 10 00676 g005
Figure 6. Welch method spectrum estimation: (a) stainless steel coating; (b) YSZ coating.
Coatings 10 00676 g006
Figure 7. Schematic diagram of the pulse duration of the 20 MHz probe.
Coatings 10 00676 g007
Figure 8. Time domain figure of echo signal of specimen #1: (a) top surface echo signal; (b) n-time echo signal.
Coatings 10 00676 g008
Figure 9. Time domain figure of echo signal of specimen #2: (a) top surface echo signal; (b) n-time echo signal.
Coatings 10 00676 g009
Figure 10. Time domain figure of echo signal of specimen #3: (a) top surface echo signal; (b) n-time echo signal.
Coatings 10 00676 g010
Figure 11. Welch power spectrum of specimens #1, #2, and #3.
Coatings 10 00676 g011
Figure 12. Schematic diagram of the pulse duration of the 10 MHz probe.
Coatings 10 00676 g012
Figure 13. Time domain figure of echo signal of specimen #4: (a) top surface echo signal; (b) n-time echo signal.
Coatings 10 00676 g013
Figure 14. Time domain figure of echo signal of specimen #5: (a) top surface echo signal; (b) n-time echo signal.
Coatings 10 00676 g014
Figure 15. Time domain figure of echo signal of specimen #6: (a) top surface echo signal; (b) n-time echo signal.
Coatings 10 00676 g015
Figure 16. Welch power spectrum of specimens #4, #5, and #6.
Coatings 10 00676 g016
Figure 17. C-scan images of the testing area of specimens #1, #2, and #3.
Coatings 10 00676 g017
Figure 18. C-scan images of the testing area of specimens: (a) #4; (b) #5; (c) #6.
Coatings 10 00676 g018aCoatings 10 00676 g018b
Table 1. The measurement values of specimens #1, #2, and #3.
Sample
Number
Δ f M a x
( M H z )
Ultrasonic Method
d (μm)
True Value
d (μm)
Error
(%)
114.8196.62001.7
29.8296.93001.0
37.4398.64000.4
Table 2. The measurement values of specimens #4, #5, and #6.
Sample Number Δ f M a x
(MHz)
Ultrasonic Method
d (μm)
Electron Microscope Method
d (μm)
Error
(%)
14.8345.7329.52.7
26.8235.5248.23.7
39.6165.8176.33.9

