Article

Study of the Static and Microwave Magnetic Properties of Nanostructured BaFe12−xTixO19

by
Polina A. Zezyulina
1,*,
Dmitry A. Petrov
1,
Konstantin N. Rozanov
1,
Denis A. Vinnik
2,
Sergey S. Maklakov
1,
Vladimir E. Zhivulin
2,
Andrey Yu. Starikov
2,
Daria P. Sherstyuk
2 and
Santiranjan Shannigrahi
3
1
Institute for Theoretical and Applied Electromagnetics, 125412 Moscow, Russia
2
Laboratory of Single Crystal Growth, South Ural State University, 454080 Chelymabinsk, Russia
3
Institute of Materials Research and Engineering, A*STAR (Agency for Science, Technology and Research), 2 Fusionopolis Way, Innovis, #08-03, Singapore 138634, Singapore
*
Author to whom correspondence should be addressed.
Coatings 2020, 10(8), 789; https://doi.org/10.3390/coatings10080789
Submission received: 13 July 2020 / Revised: 11 August 2020 / Accepted: 12 August 2020 / Published: 14 August 2020
(This article belongs to the Special Issue Functional Nanofilms: From Fundamentals to Applications)

Abstract

:
The effect of Ti substitution on the microwave and magnetostatic properties of nanostructured hexagonal BaFe12−xTixO19 ferrite composites is studied. The microwave permeability is measured in the frequency range of 0.1–22 GHz by a coaxial technique. An analysis of the magnetostatic data is made by the law of approach to saturation. The ferrimagnetic resonance frequencies calculated from the magnetostatic data are consistent with those obtained from the microwave measurements. The natural ferrimagnetic resonance frequencies are located in the frequency range of 15 to 22 GHz, depending on the substitution level x. An increase in the amount of substitution elements results in a low-frequency shift of the ferrimagnetic resonance frequency for samples with x < 1. With x rising from 1 to 2.5, the resonance frequency increases. The results of the study demonstrate that the tailored optimization of the nano-structure of a functional material is a robust tool to fine-tune its microwave magnetic properties. The ferrites under study are promising materials to be applied as functional coatings intended to control electromagnetic interference in microwave devices.

1. Introduction

Magnetic materials with a high microwave permeability are needed in many fields of modern technology, such as high-frequency electronics, electromagnetic compatibility applications, and 5G communications. Generally, the applications of magnetic materials are divided into two categories [1]. The first of these is the energy conversion of electromagnetic fields and high-frequency signal matching—such materials are typically required to have a low loss, especially magnetic, with the real permeability being high. The second category implies materials having a high magnetic loss for applications where the attenuation and absorption of a high-frequency magnetic field is required. However, for both the cases, a typical requirement is low values of permittivity and conductivity.
For the radio frequency and low-frequency part of the microwave range (less than a few hundred MHz), spinel ferrites can meet these requirements. For higher frequencies (above few gigahertz), hexagonal ferrites and composites with ferromagnetic inclusions provide noticeable permeability values. In the frequency range from 10 to 30 GHz, important for 5G applications, hexaferrites and composites with hexaferrite inclusions are promising materials [2].
The manufacturing of coatings to reduce electromagnetic interference in the microwave region implies either plate materials or flexible sheets that can take the desired shape of radiating elements. Composites with hexaferrite inclusions or films based on hexaferrites may be employed for that purpose [3].
Hexaferrite films are advantageous in many respects. Films may be deposited directly on the device surface. The hexagonal symmetry allows texturizing films with the desired configuration: c-axis perpendicular to the film plane, along the film plane, or randomly distributed in the film plane [3,4,5,6]. For the case of composites, the most important factor which defines the effective permeability and permittivity is the shape of the inclusions [7,8,9]. The chemical composition of hexagonal ferrites may provide an additional opportunity to control the magnetic properties of the composites.
For example, M-type hexagonal ferrite BaFe12O19 (BaM ferrite) possesses strong magnetocrystalline uniaxial anisotropy along the c-axis, with the anisotropy field of Ha = 17 kOe and the highest saturation magnetization among hexaferrites, Ms = 380 G [10]. The ferrimagnetic resonance frequency of un-substituted BaFe12O19 is about 50 GHz [11]. A change in the composition of this hexaferrite by replacing iron with other elements leads to a decrease in the anisotropy field and even to a change in the type of anisotropy from the easy axis to the easy plane [11,12,13,14,15].
The operating frequency range for magnetic materials is well known to be limited by the frequency of the Ferromagnetic/Ferrimagnetic Resonance (FMR) fr [16]. For most bulk magnets, including hexaferrites with the easy axis anisotropy type:
f r = γ   H a
where γ = 2.8 MHz/Oe is the gyromagnetic ratio and Ha is the effective magnetic anisotropy field. For hexaferrites with the easy plane anisotropy type, the natural resonance frequency differs from Equation (1) and is given by:
f r = γ H θ H φ
where Hθ and Hφ are the anisotropy fields directed along the c-axis and perpendicularly to the c-axis, respectively. The resonance frequency for hexaferrites with c-axis anisotropy is typically higher than that for the case of the easy plane anisotropy, because the anisotropy field Ha is larger than H θ H φ [17]. From the archived literature, Hθ is about 10 kOe and Hφ is about a few hundred Oersted [10,18].
The substitution of iron ions also affects the saturation magnetization and coercivity [11,12,19]. Therefore, the doping of barium hexaferrite with various ions may be helpful for tailoring the static and dynamic magnetic properties and, consequently, tuning the operating frequency range.
In this study, titanium was chosen as an efficient dopant for barium hexaferrite property modification. Among a huge number of studies of BaM hexaferrites with various substituting elements, titanium-substituted ferrites are not sufficiently investigated. The anisotropy field as a function of the substitution level is given, and the FMR frequency is calculated in [13]; however, there is a lack of data on the microwave properties.
This study focuses on the effect of Ti ion substitution on the magnetic and microwave properties of hexaferrite composites of BaFe12−xTixO19 with x = 0.25 to 2.5. An analysis of the magnetostatic data is made by the law of approach to saturation. The ferrimagnetic resonance frequencies calculated from the magnetostatic data are consistent with those obtained from the microwave measurements. The results demonstrate that the tailored optimization of the nano-structure of a functional material is a robust tool to finetune its microwave magnetic properties.

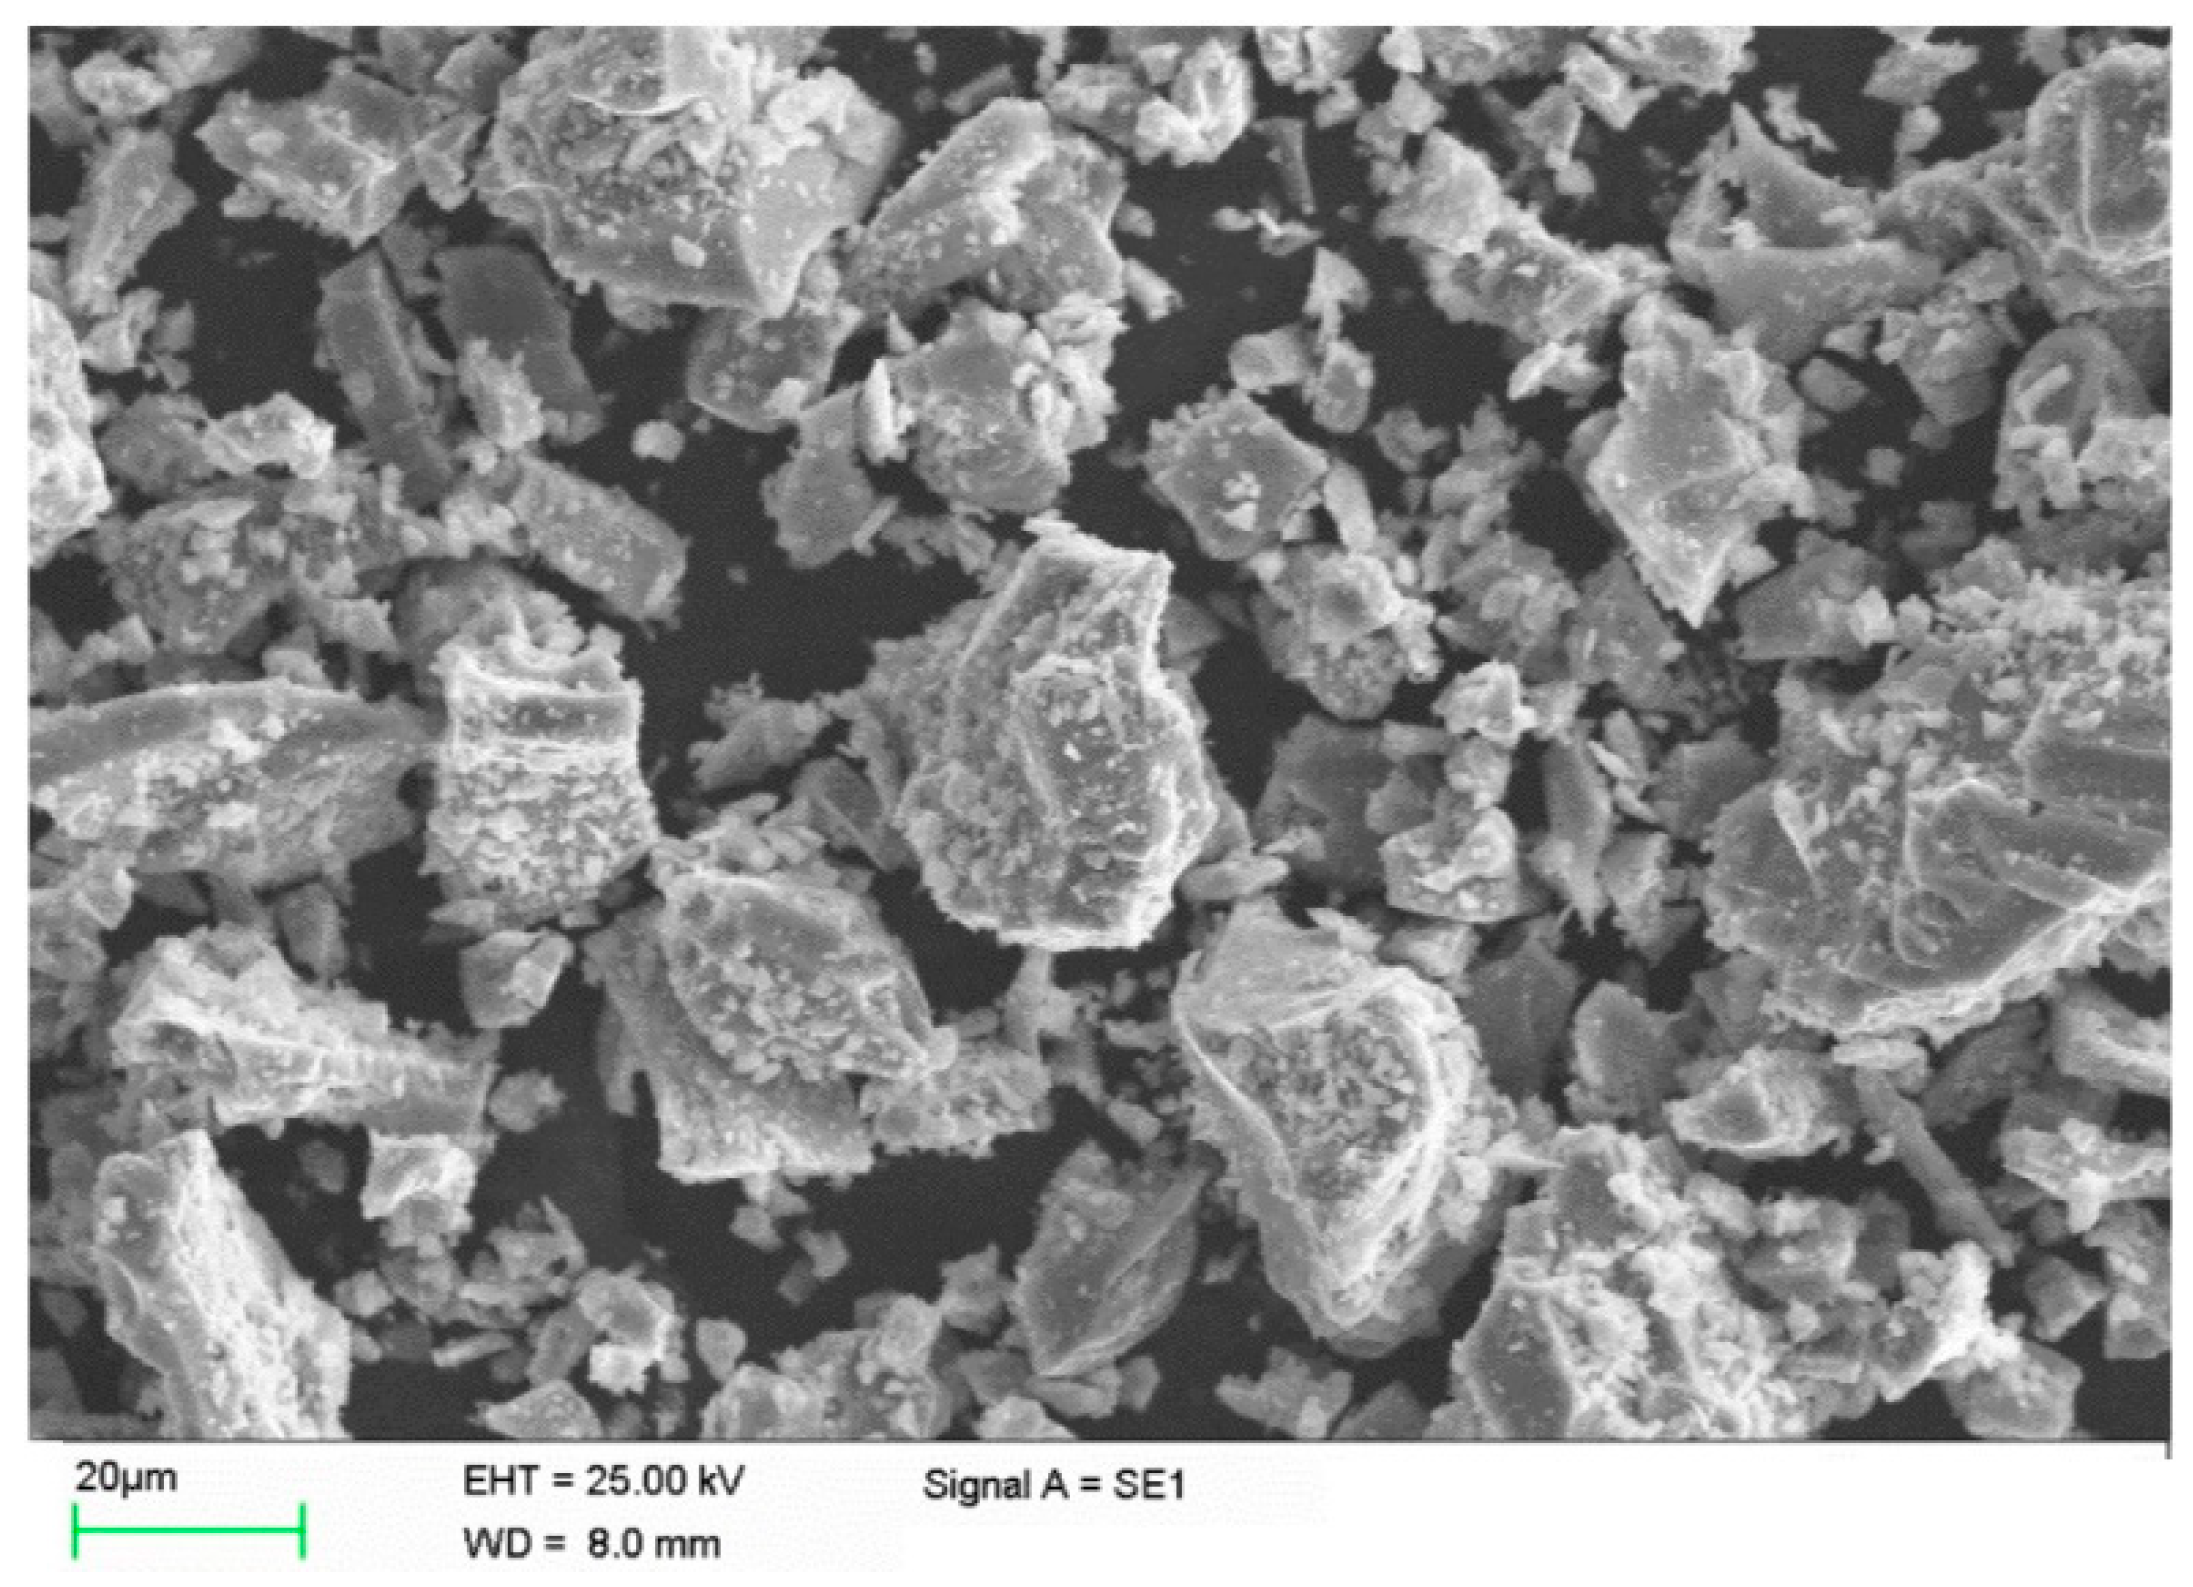
2. Materials and Methods

The stoichiometric amounts 99.0–99.5% of pure oxides and carbonate precursors, Fe2O3, BaCO3, and TiO2, were thoroughly mixed using a ball mill for 2 h in a wet medium, followed by drying in an oven. The dried homogeneous milled powders were compacted into tablets and were sintered at 1400 °C for 5 h. The sintered samples were ground into a fine powder.
The X-ray diffraction of BaFe12−xTixO19 was studied with the use of a Rigaku Ultima IV diffractometer (Rigaku, Tokyo, Japan), with a copper tube Cu Kα (λ = 1.541 Å). X-ray patterns were recorded in the range of angles 2θ from 5° to 90°, with 0.02 increments and at a speed of 2°/min. All the measurements were made at room temperature. The chemical composition of the samples was studied with the use of a JEOL JSM7001F scanning electron microscope (JEOL, Tokyo, Japan) equipped with an INCA X-max 80 energy dispersive X-ray fluorescence analyzer (Oxford Instruments, Abingdon, UK).
A typical SEM image of the milled powder study is shown in Figure 1. The powder particles are of an irregular, stone-like shape. The grain sizes are the same for all the compositions.
The composite samples were prepared by the manual mixing of the BaM ferrite powder with molten paraffin wax. The permittivity and permeability of the samples were measured in the frequency range of 0.1 to 22 GHz using the transmission/reflection (Nicolson-Ross-Weir) technique in a 7/3 coaxial line. The samples for microwave measurements were shaped to fit the coaxial line cross section.
Conventionally, measurements in the 7/3 mm coaxial line are made in the frequency range below 18 GHz. Above this frequency, the TE11 higher mode and other higher-order modes can propagate in an empty coaxial waveguide. However, when a coaxial sample is placed in the waveguide, higher-order modes can emerge at the sample boundary and propagate through the sample with a feasible resonance in the sample length [20]. Similarly, the resonance of the fundamental TEM mode also emerges at a frequency where the sample thickness is equal to an integer multiple of λ/2, where λ is the wavelength. The resonance of the higher-order mode appears on the measured frequency dependence of the complex permittivity and permeability as an additional resonant loss. Therefore, the measured frequency dependences may demonstrate two types of unwanted behavior of higher-order modes, distorting the intrinsic frequency dependence of the complex permittivity and permeability. The first is due to the resonances, which emerge far from the sample in the signal path. The presence of such resonances is independent of the sample in the waveguide. They usually have a high Q-factor due to high conductivity of the waveguide conductors. The second type of unwanted behavior is defined by the sample itself, due to the resonance on its length. In this case, the location depends on the sample permittivity, permeability, and length.
The amplitude of resonances of higher-order modes is difficult to predict; it depends on the coupling of the energy of the TEM mode to a higher order mode. In the ideal case of a homogeneous sample with ideal boundary surfaces, a higher-order mode TE11 will not emerge.
At frequencies far from these resonances, the errors due to the excitation of higher modes are weak, because at frequencies below the critical the higher modes decay quickly, and above the critical their impedance and propagation constant are close to those for the TEM wave. The smaller the sample under study is, the closer the frequency of the resonance will be to the value of the cut-off frequency for the corresponding mode propagating in an empty waveguide [20].
For this reason, the measurements could be made at frequencies above 18 GHz, up to 22 GHz, with great care considered in the interpretation of the measured data. At these frequencies, the magnetic loss peak corresponding to the ferrimagnetic resonance is easily distinguished against the background of the error. Above this range, a complex and poorly interpreted resonant pattern occurs, combining the effects of all the waves propagating in the line.
The volume fraction of the powder was 20% for samples with x from 0.25 to 1.3 and 35% for samples with x ≥ 1.5. The need for a higher concentration of samples with x ≥ 1.5 was related to a decrease in the sensitivity of measurements for samples with a high titanium content. The thickness of all the samples was 2 mm.
The hysteresis loops were measured with a vibrating sample magnetometer (VSM) in the field range of ±15 kOe. The samples for VSM were made in a disc with a diameter of 7 mm, thickness of 1.5 mm and volume fraction of the ferrite less than 2%.
The analysis of the magnetostatic data was made from the law of approach to saturation (LAS) that governed the magnetization M behavior of a polycrystalline magnetic material in high magnetic fields [21]:
M ( H ) = M s ( 1 A H B H 2 ) + χ p H .
The effective magnetic field H is the difference between the external magnetic field and the demagnetization field, Ms is the saturation magnetization of the material, and χp is the high-field susceptibility. Because of very low volume concentration, the fine particles in the paraffin may be considered as isolated particles without magnetic interaction. Therefore, the demagnetizing factor was taken as 1/3 due to the stone-like shape of the particles. The second term in the brackets, A/H, describes the behavior of inhomogeneous ferromagnets and usually vanishes in high fields [17,22]. The third term B/H2 is related to the magnetocrystalline anisotropy. For hexagonal ferrites, B = −Ha2/15, assuming K1 >> K2, where K1 and K2 are the first and second anisotropy constants [21]. The values of Ms and B may be derived by fitting the hysteresis loops with Equation (3), assuming that the fields are high enough and that the second term in the brackets may be neglected.
The coercivity Hc was found from the measured hysteresis loops.
All the microwave and magnetostatic measurements were performed at room temperature.

3. Results and Discussion

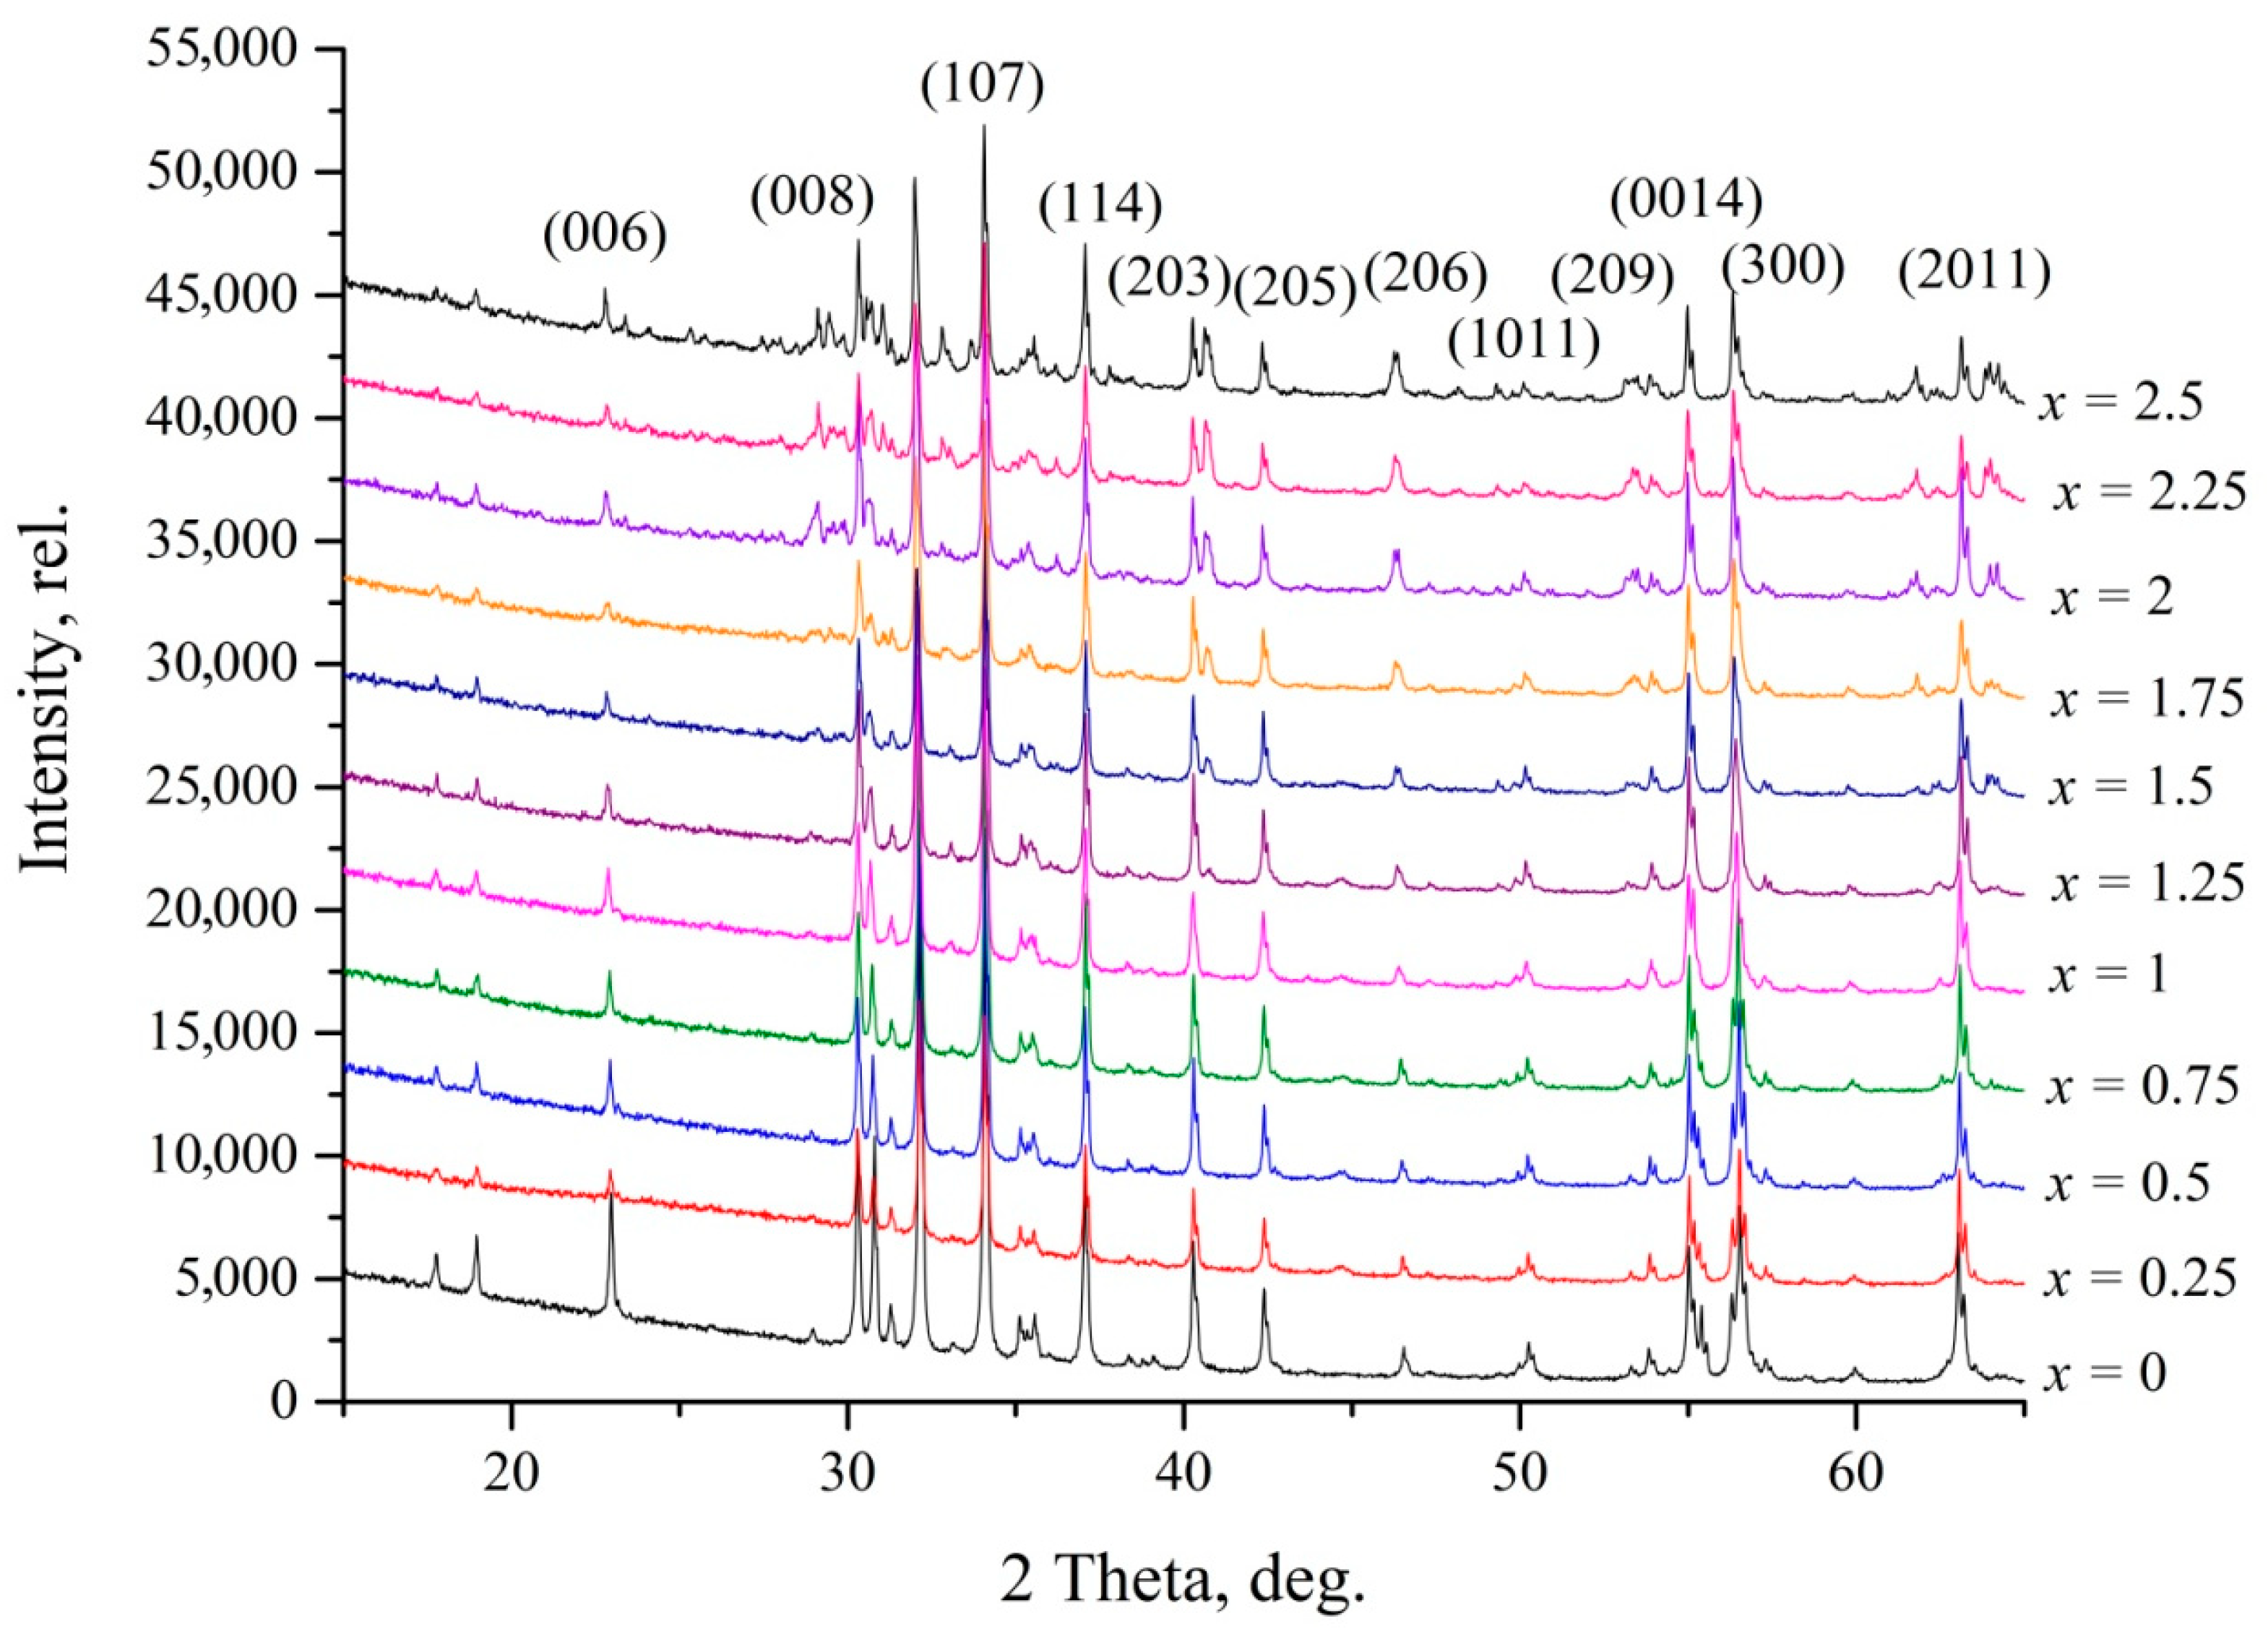
3.1. X-ray Difraction and Chemical Composition

The measured X-ray patterns are shown in Figure 2. A comparison of the obtained data with the diffraction pattern of non-substituted ferrite BaFe12O19 showed that the samples with an x value ranging from 0.25 to 1.5 comprise a single phase. This confirmed that the synthesis of samples was carried out successfully. Samples with x > 1.5 showed the presence of weak additional peaks.
The structural parameters and chemical formulas with the calculated substitution level are listed in Table 1. With x increasing, the lattice parameter a is almost constant, but parameter c increases, because the average radius of Ti4+ (0.627 Å) is larger than that of Fe3+ (0.550 Å) [11]. The cell volume rises with the substitution because of an increase in the c-axis by 0.3%. A similar result was obtained for Co-Zr-substituted BaM ferrite [12], and may indicate that substitution ions preferentially occupy some of the five crystallographic iron sites.
In the magnetoplumbite structure of M-type hexaferrite, Fe ions are known to be distributed in five nonequivalent crystallographic sites: 2a, 12k, 4fVI—octahedral; 4fIV—tetrahedral; 2b—the oxygen environment forms a bipyramidal site [19]. Ions with up-spin are located at the 2a, 12k, and 2b sites, and ions with down-spin are located at the 4fVI and 4fIV sites. As is shown in [23], titanium cations occupy the 12k and 4fVI octahedral positions for Ti concentrations up to x = 0.25. With a substitution level x > 0.25, titanium cations may occupy 4fIV tetrahedral positions, but the octahedral sites are still preferred. Such a distribution of substituting elements should result in a gradual decrease in the saturation magnetization.

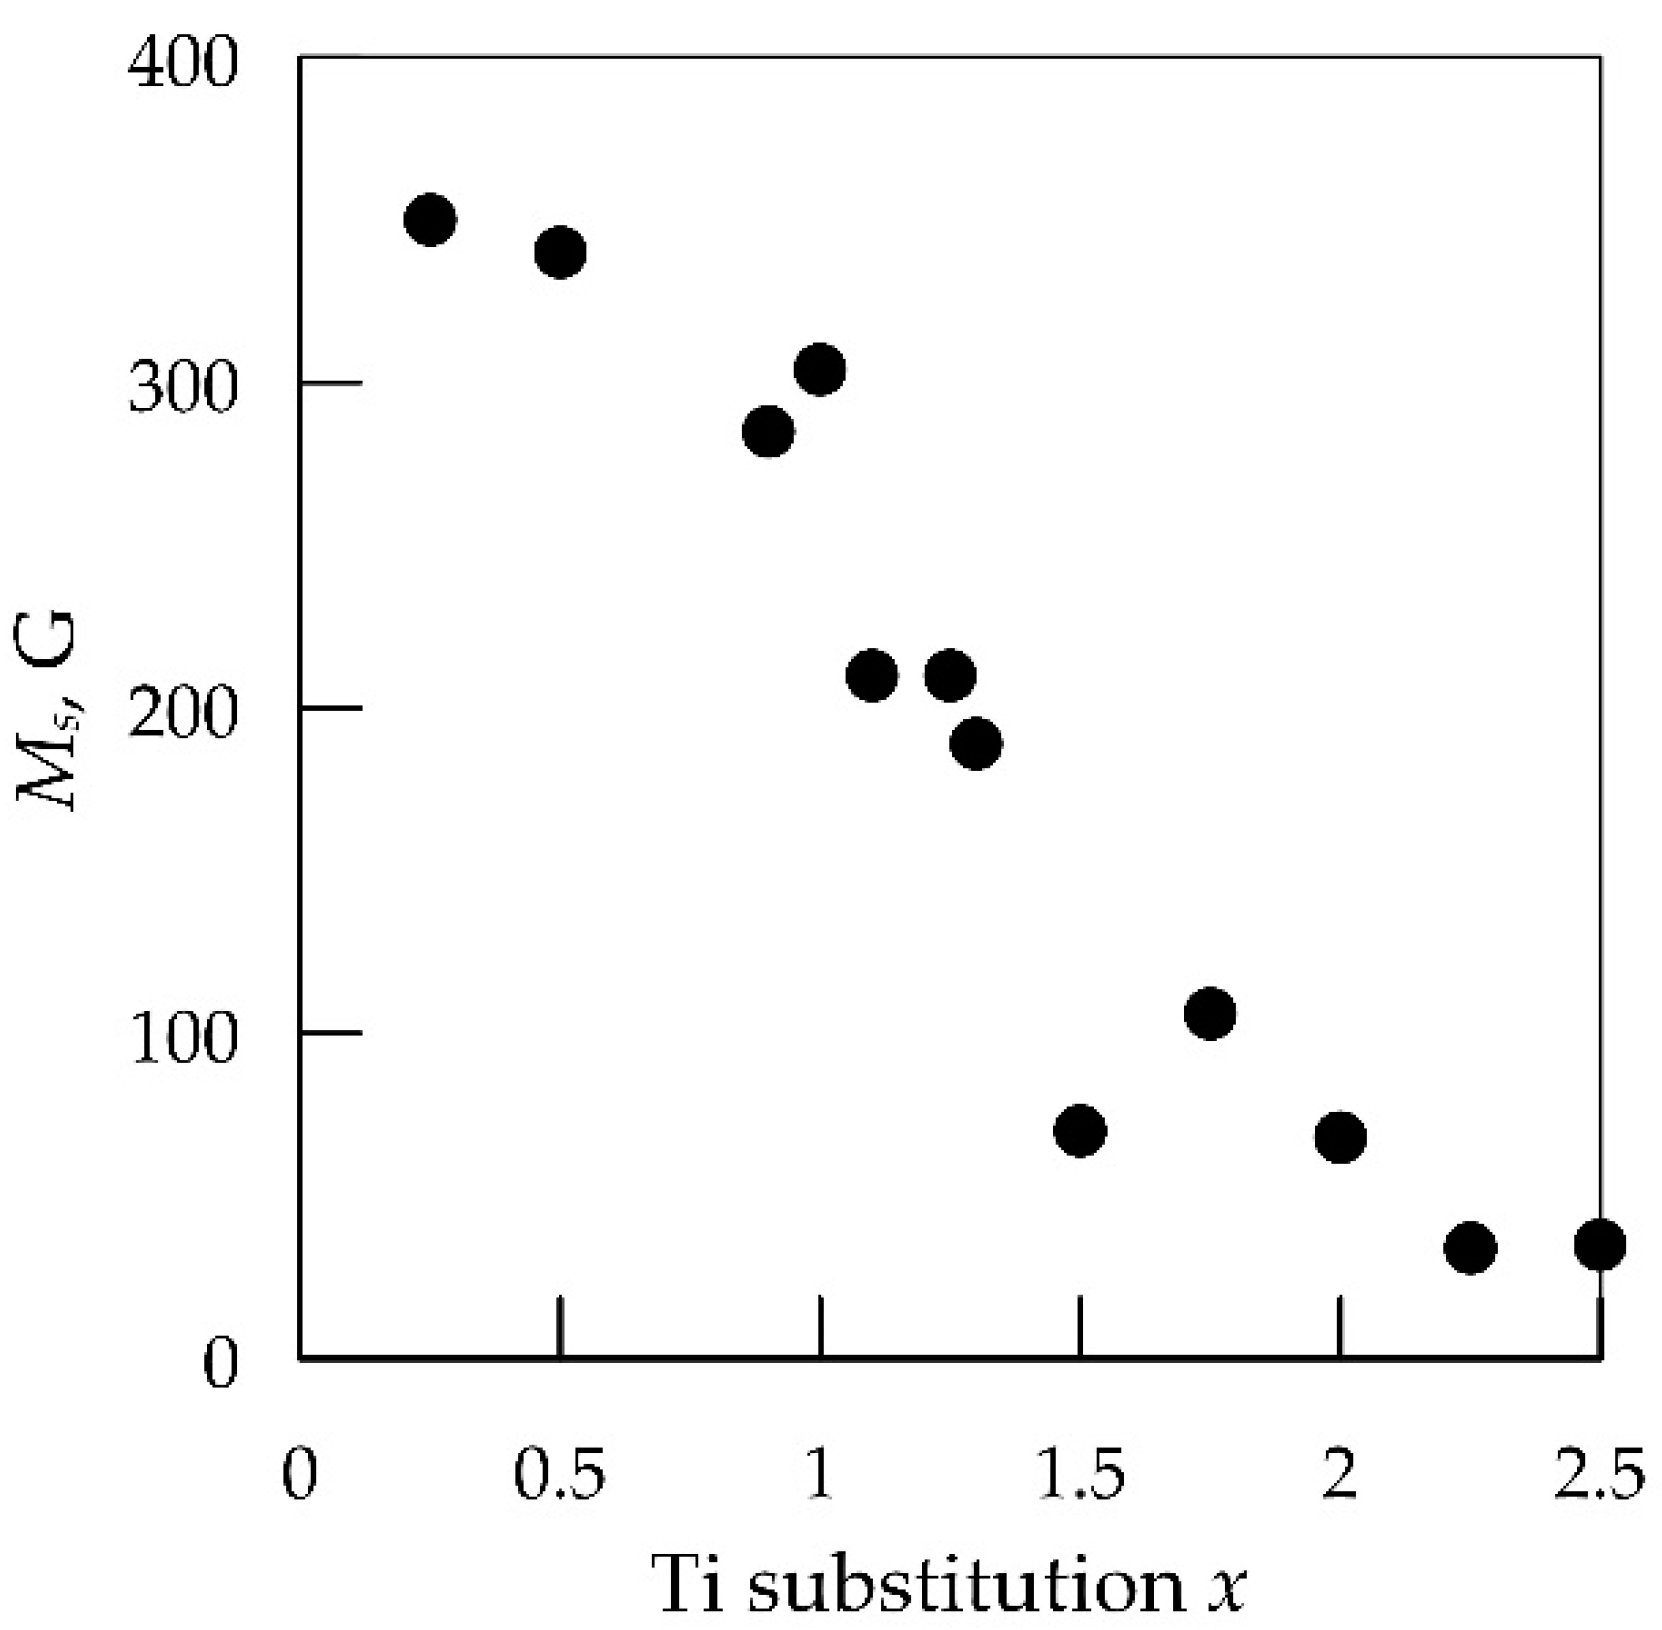
3.2. Magnetic Properties

The measured magnetic hysteresis loops of the composite samples with x = 0.25 and x = 2.5 are shown in Figure 3a. The fitting curves and measured curves in high magnetic fields are shown in Figure 3b,c. They demonstrate good agreement.
The saturation magnetization MS as a function of substitution level x is shown in Figure 4. When the Ti substitution is increased, MS decreases gradually from 350 G for x = 0.25 to 35 G for x = 2.5. This is related to the distribution of substituting ions, as stated above. Single deviations on the graph of saturation magnetization dependence may be associated with an error in determining the concentration of composites due to small values of volume fraction of ferrite particles in the dielectric matrix of composites.
The variation in coercivity Hc with the substitution x is shown in Figure 5. The coercivity rapidly decreases from 218 to 62 Oe, with the x value changing from 0.25 to 1. At higher substitution levels, from x = 1 to 1.5, the coercivity changes slowly, after which it increases again and achieves the value Hc = 80 Oe for x = 2.5.
The anisotropy field dependence derived from LAS is shown in Figure 5 with the black solid line. As the Ti substitution increases from 0.25 to 1, the anisotropy field reduces from 12 kOe to 5.8 kOe almost linearly. The increase in the Ti substitution from 1 to 1.3 does not affect significantly the anisotropy field, but a further increase in x is accompanied by a gradual increase in the anisotropy field. Such behavior of the anisotropy field may be caused by a change in the anisotropy type in the range x from 1 to 1.3. A similar modification of the uniaxial anisotropy to planar anisotropy was observed in BaCoxTixFe12−2xO19 at x > 1.1 [10]. Similarly, the substitution of Fe ions by Co-Zr leads to a change in anisotropy type at x = 1.2 [12]. The observed anisotropy fields for samples with x > 1.3 will be denoted as Hθ further, since they correspond to the anisotropy fields along the c-axis for the easy plane anisotropy type.
The coercivity dependence on the Ti substitution level has a shape that resembles the anisotropy field dependence. This leads to the conclusion that the above qualitative estimation of the anisotropy fields is accurate enough because the value of Hc is closely related to the anisotropy fields [12,24].

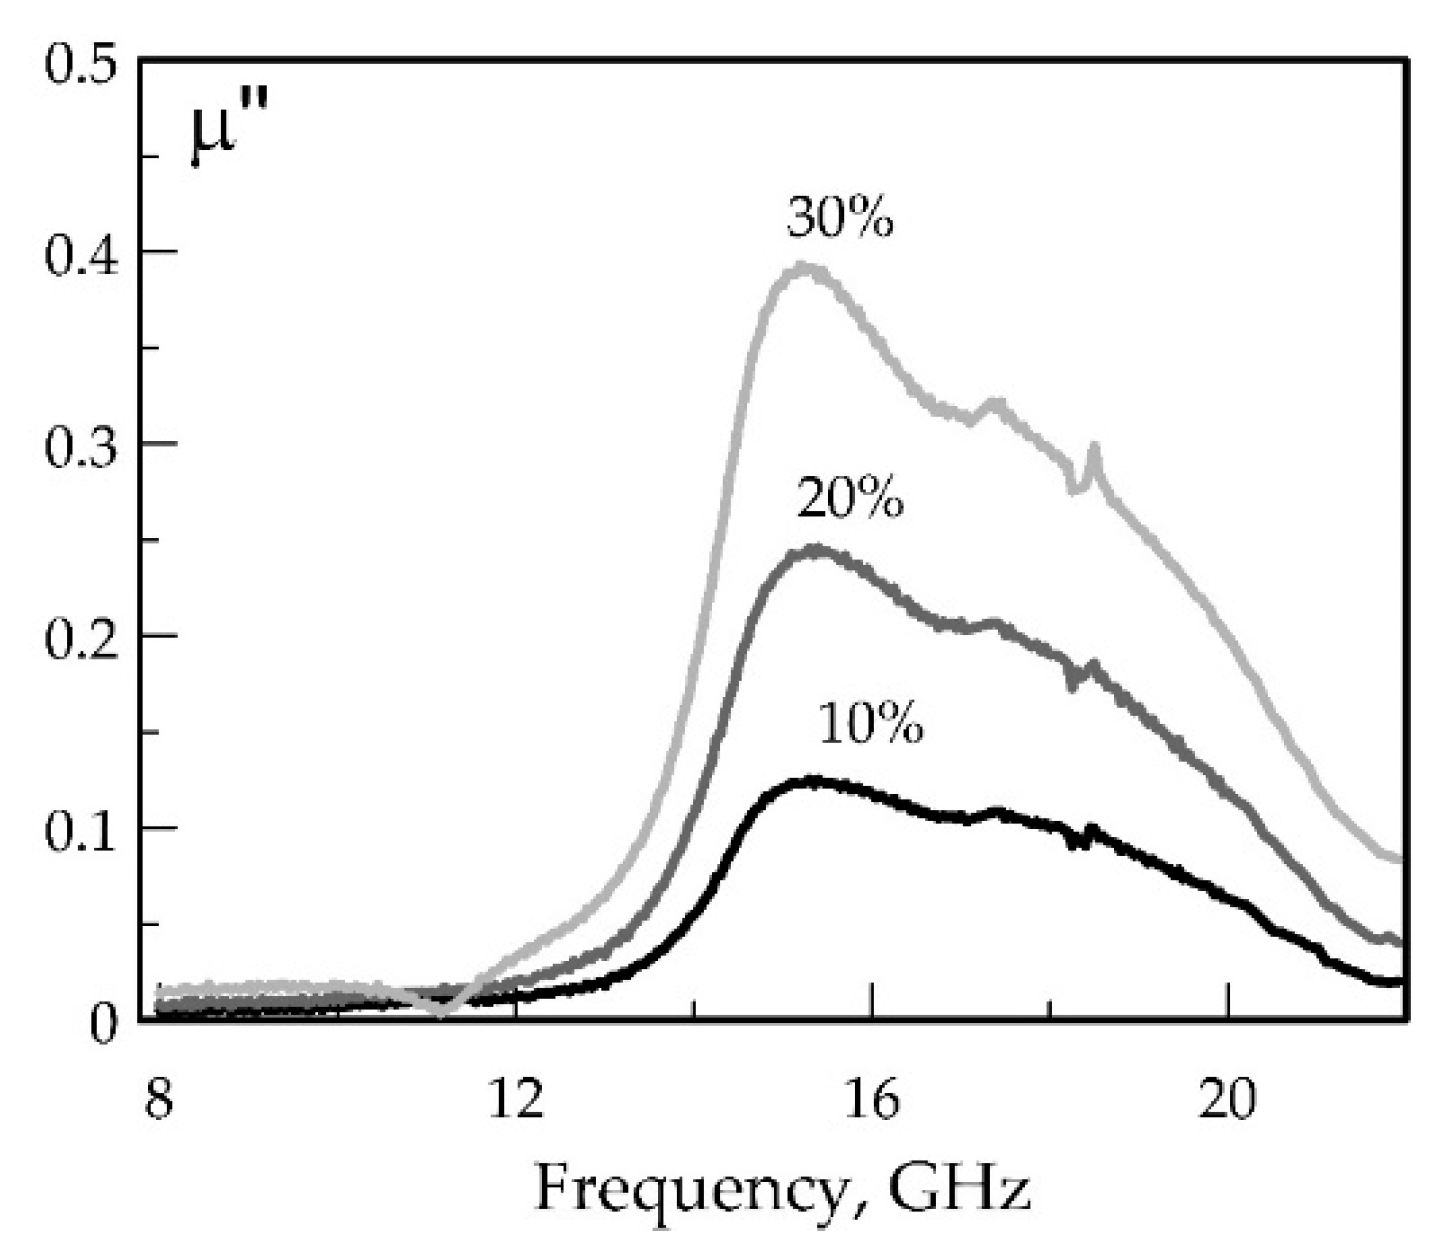
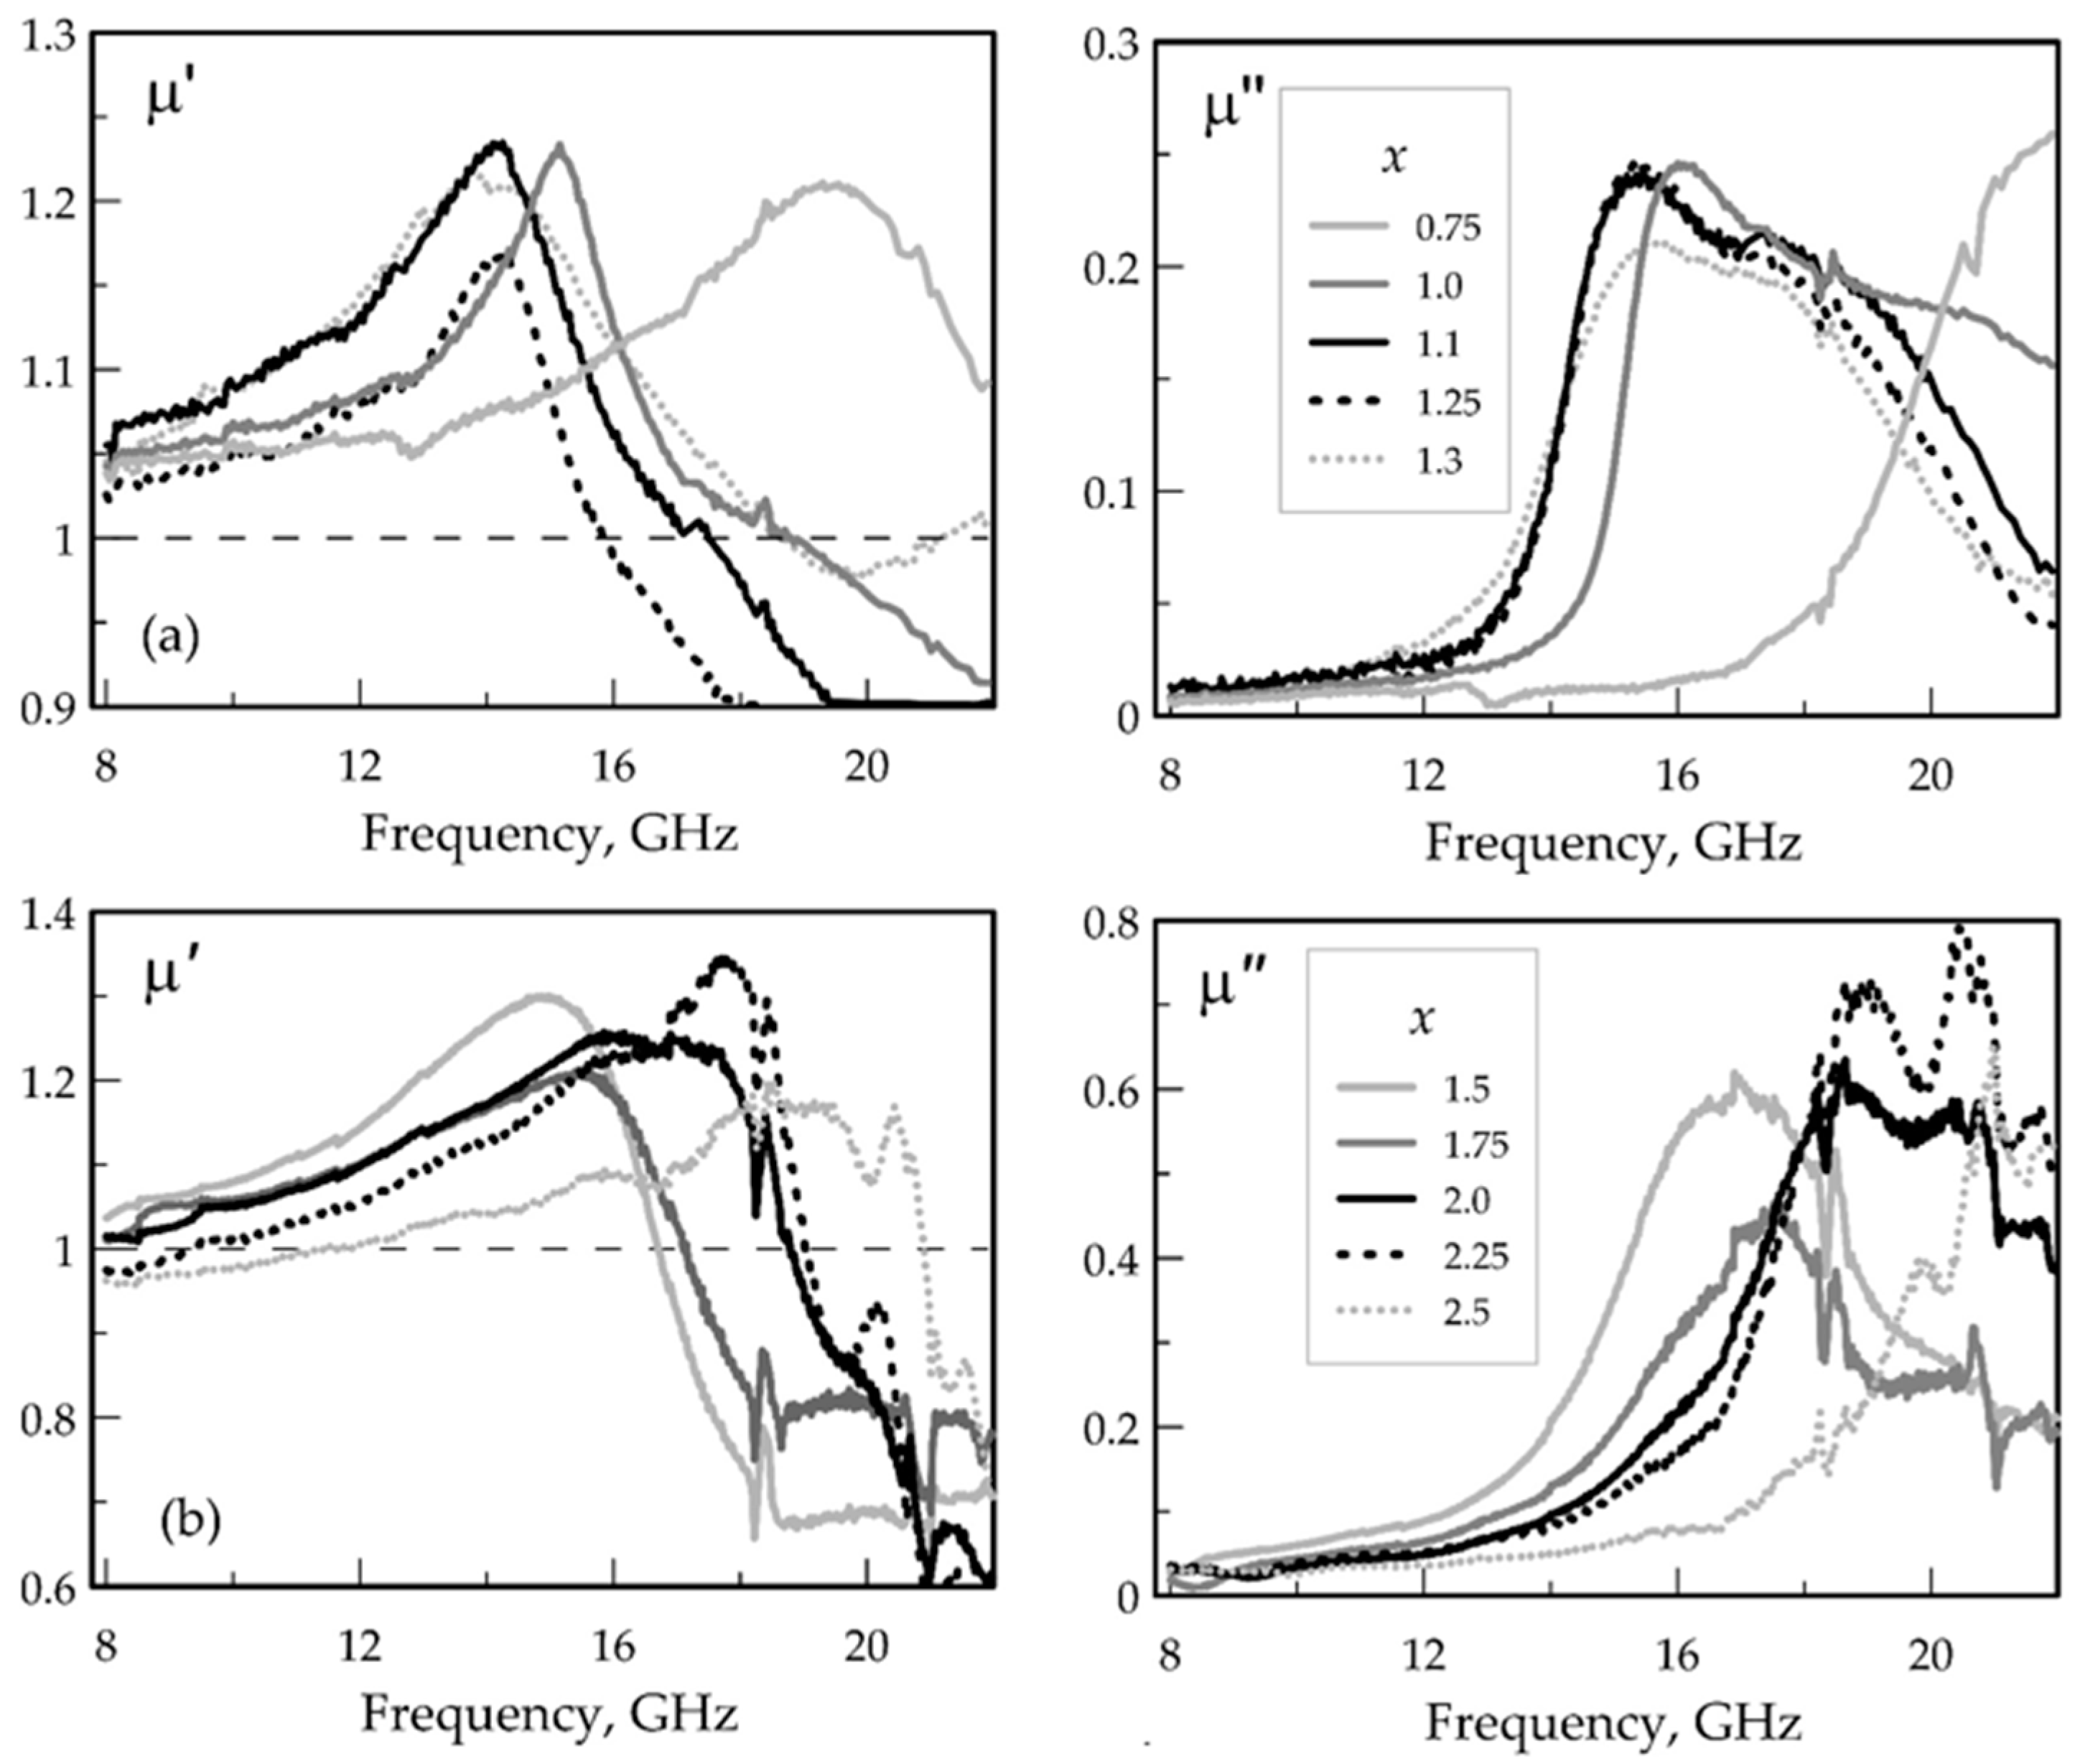
3.3. Microwave Properties

As stated above, two sets of composite samples with different volume concentrations were made for the microwave measurements. In accordance with Snoek’s law [18,25], a strong decrease in the saturation magnetization with an increasing substitution level results in a decrease in the microwave permeability and therefore in a degradation of the measurement method sensitivity. The measured frequency dependence of magnetic loss for samples with x = 1.25 and a different volume fraction of ferrite is shown in Figure 6. An increase in the volume concentration does not lead to a shift in the resonance frequency, so it is acceptable to compare different concentrations.
The measured frequency dependencies of microwave permeability with different substitution levels are shown in Figure 7. It is seen that the permeability exhibits a strong frequency dispersion at frequencies from 12 to 22 GHz, which is attributed to the natural ferrimagnetic resonance. The permittivity of the samples is almost constant, and the dielectric loss is small, so the frequency dependences of permittivity are not presented here. For samples with a volume fraction of 20%, the typical values of permittivity and the dielectric loss tangent are 6 and 0.03, respectively. For samples with a volume fraction of 35%, the permittivity is in the range of 10 to 13, with a loss tangent of 0.09 to 0.08.
The higher-order modes resonances on the sample length lead to the slight distortions at frequencies of 8 GHz and 13 GHz for samples with volume concentrations of 35% and 20%, respectively. The high Q-factor resonances between 18 and 19 GHz, which have the same location for all samples, are attributed to loss in waveguide walls. At higher frequencies, resonant measurement errors are also visible, but their presence does not lead to a large error in determining the peak of magnetic loss, from which the frequency of ferrimagnetic resonance is determined [10].
The black curve in Figure 8 represents the dependence of the FMR frequencies on the Ti substitution. The resonance frequency fr decreases from 22 to 16 GHz with the increase in Ti substitution from x = 0.75 to x = 1. Further, the resonance frequency remains almost constant until x = 1.3, after which it shows a slow growth. The gray solid line in Figure 8 shows the resonance frequency evaluated from the anisotropy field by Equation (1). A clear discrepancy between the two curves is observed for x > 1.3. That may be caused by a modification of the anisotropy type into the easy plane, which makes Equation (1) no more valid. It should also be noted that the assumption K1 >> K2 may not be obeyed at high values of substitution levels, which leads to the overstated values of the anisotropy field yielded by Equation (3). Paper [13] does not report an increase in the anisotropy field for samples with x > 1. This indicates that the increase in the resonance frequency is related to the growth of the anisotropy field Hφ in the hexagonal plane. The anisotropy field Hφ may be estimated from the obtained resonance frequencies and values Hθ by Equation (2). The calculation gives the values for Hφ from 4 to 8 kOe for samples with x from 1.3 to 2.5, which is too high, according to the literature [10,17,18]. It can be concluded that Hθ increases for samples with x >1.3, but comparatively slower, as was shown previously in Figure 5.

4. Conclusions

A set of M-Type hexagonal ferrites BaFe12−xTixO19, with x varying from 0.25 to 2.5, has been investigated. The magnetostatic analysis has shown that the presence of Ti ions induces a substantial decrease in the saturation magnetization. The anisotropy field decreases while the x value increases from 0.25 to 1 and rises with a further increase in x. The coercivity behavior with increasing the value of x resembles the anisotropy field dependence. The change in the magnetostatic properties may be induced by the modification of the anisotropy type from the easy axis to the easy plane.
The microwave properties of the samples are in agreement with the magnetostatic data for x value ranges from 0.25 to 1.3. The natural ferrimagnetic resonance frequencies are located in the frequency range of 15 to 22 GHz depending on x. Based on the microwave and static results, BaFe12−xTixO19 is of potential interest for customized functional coating applications in microwave devices and high-speed electronics.

Author Contributions

Conceptualization, P.A.Z. and D.A.P.; methodology, D.A.P.; formal analysis, K.N.R. and S.S.M.; investigation, P.A.Z., V.E.Z., A.Y.S., and D.P.S.; data curation, K.N.R., D.A.V., and D.A.P.; writing—original draft preparation, P.A.Z. and D.A.P.; writing—review and editing, K.N.R., D.A.P., and S.S.; visualization, P.A.Z.; supervision, K.N.R. All authors have read and agreed to the published version of the manuscript.

Funding

The reported study was partially funded by RFBR, project no. 20-52-53020. In part of the ferrites preparation the work was supported by RFBR, project no. 20-08-00716.

Conflicts of Interest

The authors declare no conflict of interest.

References

  1. Iakubov, I.T.; Lagarkov, A.N.; Osipov, A.V.; Maklakov, S.A.; Rozanov, K.N.; Ryzhikov, I.A.; Starostenko, S.N. A laminate of ferromagnetic films with high effective permeability at high frequencies. AIP Adv. 2014, 4, 107143. [Google Scholar] [CrossRef]
  2. Sai, R.; Shivashankar, S.A.; Yamaguchi, M.; Bhat, N. Magnetic nanoferrites for RF CMOS: Enabling 5G and beyond. Electrochem. Soc. Interface 2017, 26, 71–76. [Google Scholar] [CrossRef] [Green Version]
  3. Harris, V.G.; Geiler, A.; Chen, Y.; Yoon, S.D.; Wu, M.; Yang, A.; Chen, Z.; He, P.; Parimi, P.V.; Zuo, X.; et al. Recent advances in processing and applications of microwave ferrites. J. Magn. Magn. Mater. 2009, 321, 2035–2047. [Google Scholar] [CrossRef]
  4. Harris, V.G. Modern Microwave Ferrites. IEEE Trans. Magn. 2012, 48, 1075–1104. [Google Scholar] [CrossRef]
  5. Yu, Ch.; Sokolov, A.S.; Kulik, P.; Harris, V.G. Stoichiometry, phase, and texture evolution in PLD-grown hexagonal barium ferrite films as a function of laser process parameters. J. Alloy. Compd. 2020, 814, 1–8. [Google Scholar] [CrossRef]
  6. Harris, V.G.; Sokolov, A.S. The self-biased circulator: Ferrite materials design and process considerations. J. Supercond. Nov. Magn. 2019, 32, 97–108. [Google Scholar] [CrossRef]
  7. Lagarkov, A.N.; Rozanov, K.N. High-frequency behavior of magnetic composites. J. Magn. Magn. Mater. 2009, 321, 2082–2092. [Google Scholar] [CrossRef]
  8. Han, M.; Rozanov, K.N.; Zezyulina, P.A.; Wu, Y.-H. Effects of eddy current and dispersion of magnetic anisotropy on the high-frequency permeability of Fe-based nanocomposites. J. Magn. Magn. Mater. 2015, 383, 114–119. [Google Scholar] [CrossRef]
  9. Li, Q.; Chen, Y.; Harris, V.G. Particle-size distribution modified effective medium theory and validation by magneto-dielectric Co-Ti substituted BaM ferrite composites. J. Magn. Magn. Mater. 2018, 453, 44–47. [Google Scholar] [CrossRef]
  10. Smit, J.; Wijn, H.P.J. Ferrites; N.V. Philips’ Gloeilampenfabrieken: Eindhoven, The Netherlands, 1959; pp. 202–287. [Google Scholar]
  11. Pullar, R.C. Hexagonal ferrites: A review of the synthesis, properties and applications of hexaferrite ceramics. Prog. Mater. Sci. 2012, 57, 1191–1334. [Google Scholar] [CrossRef]
  12. Li, Z.W.; Chen, L.F.; Ong, C.K. Studies of static and high-frequency magnetic properties for M-type ferrite BaFe12−2xCoxZrxO19. J Appl. Phys. 2002, 92, 3902–3907. [Google Scholar] [CrossRef] [Green Version]
  13. Sugimoto, S.; Okayama, K.; Ota, H.; Kimura, M.; Yoshida, Y.; Nakamura, H.; Book, D.; Kagotani, T.; Homma, M. Effect of substitutional elements on the natural resonance frequency of barium M-type ferrite. J. Magn. Soc. Jpn. 1999, 23, 611–613. [Google Scholar] [CrossRef] [Green Version]
  14. Yang, A.; Chen, Y.; Chen, Z.; Vittoria, C.; Harris, V.G. Magnetic and atomic structure parameters of Sc-doped barium hexagonal ferrites. J Appl. Phys. 2008, 103, 07E511. [Google Scholar] [CrossRef]
  15. Kong, L.B.; Li, Z.W.; Liu, L.; Huang, R.; Abshinova, M.; Yang, Z.H.; Tang, C.B.; Tan, P.K.; Deng, C.R.; Matitsine, S. Recent progress in some composite materials and structures for specific electromagnetic applications. Int. Mater. Rev. 2013, 58, 203–259. [Google Scholar] [CrossRef]
  16. Kittel, C. On the theory of ferromagnetic resonance absorption. Phys. Rev. 1948, 73, 155–161. [Google Scholar] [CrossRef]
  17. Li, Z.W.; Chen, L.; Ong, C.K. High-frequency magnetic properties of W-type barium–ferrite BaZn2−xCoxFe16O27 composites. J. Appl. Phys. 2003, 94, 5918–5924. [Google Scholar] [CrossRef]
  18. Rozanov, K.N.; Li, Z.W.; Chen, L.F.; Koledintseva, M.Y. Microwave permeability of Co2Z composites. J. Appl. Phys. 2005, 97, 013905. [Google Scholar] [CrossRef]
  19. Trukhanov, A.V.; Trukhanov, S.V.; Kostishyn, V.G.; Panina, L.V.; Korovushkin, V.V.; Turchenko, V.A.; Vinnik, D.A.; Yakovenko, E.S.; Zagorodnii, V.V.; Launetz, V.L.; et al. Correlation of the atomic structure, magnetic properties and microwave characteristics in substituted hexagonal ferrites. J. Magn. Magn. Mater. 2018, 462, 127–135. [Google Scholar] [CrossRef]
  20. Petrov, D.A.; Rozanov, K.N.; Koledintseva, M.Y. Influence of higher-order modes in coaxial waveguide on measurements of material parameters. In Proceedings of the 2018 IEEE Symposium on Electromagnetic Compatibility, Signal Integrity and Power Integrity (EMC, SI & PI), Long Beach, CA, USA, 30 July–3 August 2018; pp. 66–70. [Google Scholar]
  21. Grössinger, R. A critical examination of the law of approach to saturation. I. Fit procedure. Phys. Status Solidi 1981, 66, 665–674. [Google Scholar] [CrossRef]
  22. Han, M.; Ou, Y.; Chen, W.; Deng, L. Magnetic properties of Ba-M-type hexagonal ferrites prepared by the sol–gel method with and without polyethylene glycol added. J. Alloy. Compd. 2009, 474, 185–189. [Google Scholar] [CrossRef]
  23. Vinnik, D.A.; Zhivulin, V.E.; Starikov, A.Y.; Gudkova, S.A.; Trofimov, E.A.; Trukhanov, A.V.; Trukhanov, S.V.; Turchenko, V.A.; Matveev, V.V.; Lahderanta, E.; et al. Influence of titanium substitution on structure, magnetic and electric properties of barium hexaferrites BaFe12−xTixO19. J. Magn. Magn. Mat. 2020, 498, 166117. [Google Scholar] [CrossRef]
  24. Almessiere, M.A.; Slimani, Y.; Baykal, A. Exchange spring magnetic behavior of Sr0.3Ba0.4Pb0.3Fe12O19/(CuFe2O4)x nanocomposites fabricated by a one-pot citrate sol-gel combustion method. J. Alloys Compd. 2018, 762, 389–397. [Google Scholar] [CrossRef]
  25. Adenot, A.L.; Acher, O.; Taffary, T.; Longuet, L. Sum rules on the dynamic permeability of hexagonal ferrites. J. Appl. Phys. 2002, 91, 7601–7603. [Google Scholar] [CrossRef]
Figure 1. SEM micrographs of the powders under study.
Coatings 10 00789 g001
Figure 2. X-ray patterns for BaFe12−xTixO19, with x from 0 to 2.5.
Coatings 10 00789 g002
Figure 3. (a) The measured magnetic hysteresis loops for the composite samples of BaFe12−xTixO19 with x = 0.25 and x = 2.5 are provided to demonstrate the fittings by Equation (3) at the high-field region for samples with (b) x = 0.25 and (c) x = 2.5.
Coatings 10 00789 g003
Figure 4. The saturation magnetization Ms derived from LAS for BaFe12−xTixO19.
Coatings 10 00789 g004
Figure 5. The anisotropy fields Ha calculated from LAS, and coercivity Hc for the composite samples of BaFe12−xTixO19 plotted against the volume fraction. Lines are guides for eyes.
Coatings 10 00789 g005
Figure 6. The measured frequency dependence of magnetic loss for the composite samples of BaFe12−xTixO19 with different volume fractions of ferrite; x = 1.25.
Coatings 10 00789 g006
Figure 7. The measured frequency dependence of permeability for the composite samples of BaFe12−xTixO19: (a) x from 0.75 to 1.3, the volume fraction of the ferrite powder is 20%; (b) x from 1.5 to 2.5, the volume fraction of the ferrite powder is 35%.
Coatings 10 00789 g007
Figure 8. The resonance frequency plotted against the substitution level x. The black dots are measured values, the grey dots are calculated by Equation (1), the lines are guides for the eyes.
Coatings 10 00789 g008
Table 1. Lattice parameters a and c and cell volume V for BaFe12−xTixO19.
Substitution Level xCalculated Brutto Formulaa, Åc, ÅV, Å3
0BaFe12O195.8934(4)23.2031(11)698.01(9)
0.25BaFe11.72Ti0.28O195.8894(3)23.2183(9)697.44(6)
0.5BaFe11.51Ti0.49O195.8888(4)23.2277(14)697.58(9)
0.75BaFe11.26Ti0.74O195.8888(4)23.2546(13)698.39(9)
1BaFe10.98Ti1.02O195.8868(5)23.2769(12)698.58(8)
1.25BaFe10.72Ti1.28O195.8851(4)23.3035(13)698.96(9)
1.5BaFe10.46Ti1.54O195.8855(4)23.3292(12)699.83(8)
1.75BaFe10.28Ti1.72O195.8840(3)23.3128(13)698.98(8)
2BaFe9.83Ti2.17O195.8823(3)23.3415(13)699.45(8)
2.25BaFe9.69Ti2.31O195.8844(4)23.3411(13)699.94(8)
2.5BaFe9.36Ti2.64O195.8842(4)23.3388(15)699.82(9)

