Article

Influence of Laser Cladding Parameters on Microstructure, Microhardness, Chemical Composition, Wear and Corrosion Resistance of Fe–B Composite Coatings Reinforced with B4C and Si Particles

1
Institute of Materials Technology, Faculty of Mechanical Engineering, Poznan University of Technology, ul. Piotrowo 3, 61-138 Poznan, Poland
2
Institue of Materials Science and Engineering, Faculty of Materials Engineering and Technical Physics, Poznan University of Technology, ul. Jana Pawła II 24, 61-138 Poznan, Poland
3
Faculty of Materials Science and Technology in Trnava, Slovak University of Technology in Bratislava, J. Bottu 25, 917 24 Trnava, Slovakia
*
Author to whom correspondence should be addressed.
Coatings 2020, 10(9), 809; https://doi.org/10.3390/coatings10090809
Submission received: 28 July 2020 / Revised: 18 August 2020 / Accepted: 20 August 2020 / Published: 21 August 2020

Abstract

:
The paper presents the study results of a laser cladding process of C45 steel using powder mixtures. The aim of this study was to investigate the microstructure, X-ray diffraction (XRD), chemical composition (EDS), microhardness, corrosion resistance and wear resistance of the newly obtained coatings. Modified coatings were prepared using laser cladding technology. A 1 kW continuous wave Yb:YAG disk laser with a powder feeding system was applied. Two different powder mixtures as well as various laser beam parameters were used. The first powder mixture contained Fe–B, and the second mixture was Fe–B–B4C–Si. Two values of laser beam power (600 and 800 W) and three values of scanning speed (600, 800, and 1000 mm/min) were applied during the studies. As a result of the influence of the laser beam, the zones enriched with modifying elements were obtained. Based on the results of XRD, the presence of phases derived from borides and carbides was found. In all cases analyzed, EDS studies showed that there is an increased content of boron in the dendritic areas, while there is an increased silicon content in interdendritic spaces. The addition of B4C and Si improved properties such as microhardness as well as wear and corrosion resistance. The microhardness of the coating increased from approx. 400 HV to approx. 1100 HV depending on the laser parameters used. The best corrosion resistance was obtained for the Fe–B–B4C–Si coating produced using the highest laser beam scanning speed. An improvement in wear resistance can be seen after wear tests, where the weight loss decreased from about 0.08 g to about 0.05 g.

1. Introduction

Laser cladding is a technological process in which material in the form of powder is deposited on the substrate material [1,2]. The powder and metallic substrate are fused by metallurgical bonding through heat generated by the action of the laser beam. By using various laser beam parameters and selecting different powder materials, the surface can be alloyed or cladded. It is possible to produce coatings containing carbides [3,4,5,6,7,8,9,10] or other hard particles [11,12] in primary and secondary form. Laser cladding has been widely used as one of the surface modification techniques. The main fields of application are the mining, aircraft and automotive industries [13]. In the mining industry, laser cladding is used to produce wear and corrosion-resistant coatings for drilling tools. In the case of the automotive industry, this technology is used, for example, to increase the durability of valves and shafts. The most commonly used coatings produced by the laser cladding process may include nickel-based and iron-based alloy coatings reinforced with different carbides. These types of coatings are characterized by high hardness, and good corrosion and wear resistance, thus they can become an alternative to coatings produced using thermal spraying processes. As a result of the laser beam’s interaction with the substrate material, and by introducing various elements, new and unique properties can be obtained. A number of important properties may be changed or improved, for example microhardness, corrosion resistance and wear resistance [5,10,14,15,16]. Compounds in the form of high-melting phases such as carbides or borides [3,5,7,8,9,10], as well as high-melting elements like chromium or boron [4,15,16,17,18,19], have an important role in the coating microstructure. Boron contributes to improving properties such as microhardness and wear resistance in the case of coatings produced on steel. Research on the influence of this element has been is described in many publications [15,16,17,18,19]. Safonov’s works are widely known among researchers interested in this area. Safonov [17,18] concluded that the addition of a low amount of boron into the melt, which occurs with a small thickness of the coating or in deep melting, leads to the formation of a hypoeutectic microstructure consisting of α eutectic. This eutectic consists of primary dendrites and lamellar boride eutectic. The author also stated that when the laser modification allows one to add a high amount of boron, the remelted zones have a hypereutectic microstructure consisting of primary boride crystals and a eutectic. In paper [17], it was found that by changing laser beam parameters, it is possible to control the phase composition, and coatings can be produced that are characterized by different properties. The coatings produced using a lower laser beam fluence contained mostly Fe2B borides, while with a higher laser beam fluence, non-equilibrium phases appeared as well. Therefore, one can claim that changing the laser processing parameters contributes to the formation of microstructure-containing new phases. As in the work [19], the authors found that cladded coating (containing in this case boron and iron in various proportions, as well as additionally silicon) leads to obtaining a microstructure comprising a fine dispersion of intermetallic phases in α-matrix, and characterized by a good microhardness from 1150 to 1200 VHN. The authors of this paper also showed improved wear and corrosion resistance. However, they note that these properties are significantly affected by output parameters (types of powders and laser parameters). Detailed description concerning the impact of the various laser processing parameters were discussed by the authors [20] for the example of aluminum on AISI 304 stainless steel with high power diode lasers. Researchers found that the depth of the modified surface was mainly influenced by mass flow and scanning speed. Our earlier publication [21] discussed the significant impact of parameter selection in terms of application, e.g., in agriculture. In paper [22], the authors produced B–Si coatings on steel using the laser alloying process, and checked whether the use of these chemical elements may improve the mechanical properties. The B–Si coatings were characterized by properties better than boron coatings and silicon coatings. The authors found that this kind of coating was characterized by microhardness in the range from 1430 to 1870 HV, as well as high wear and corrosion resistance.
In this study, the effect of laser cladding parameters and the composition of the powder mixture, as well as the presence of a B4C phase on the microstructure and selected properties such as the microhardness, phase composition, corrosion resistance and wear resistance of composite coatings produced on medium carbon steel, were analyzed.

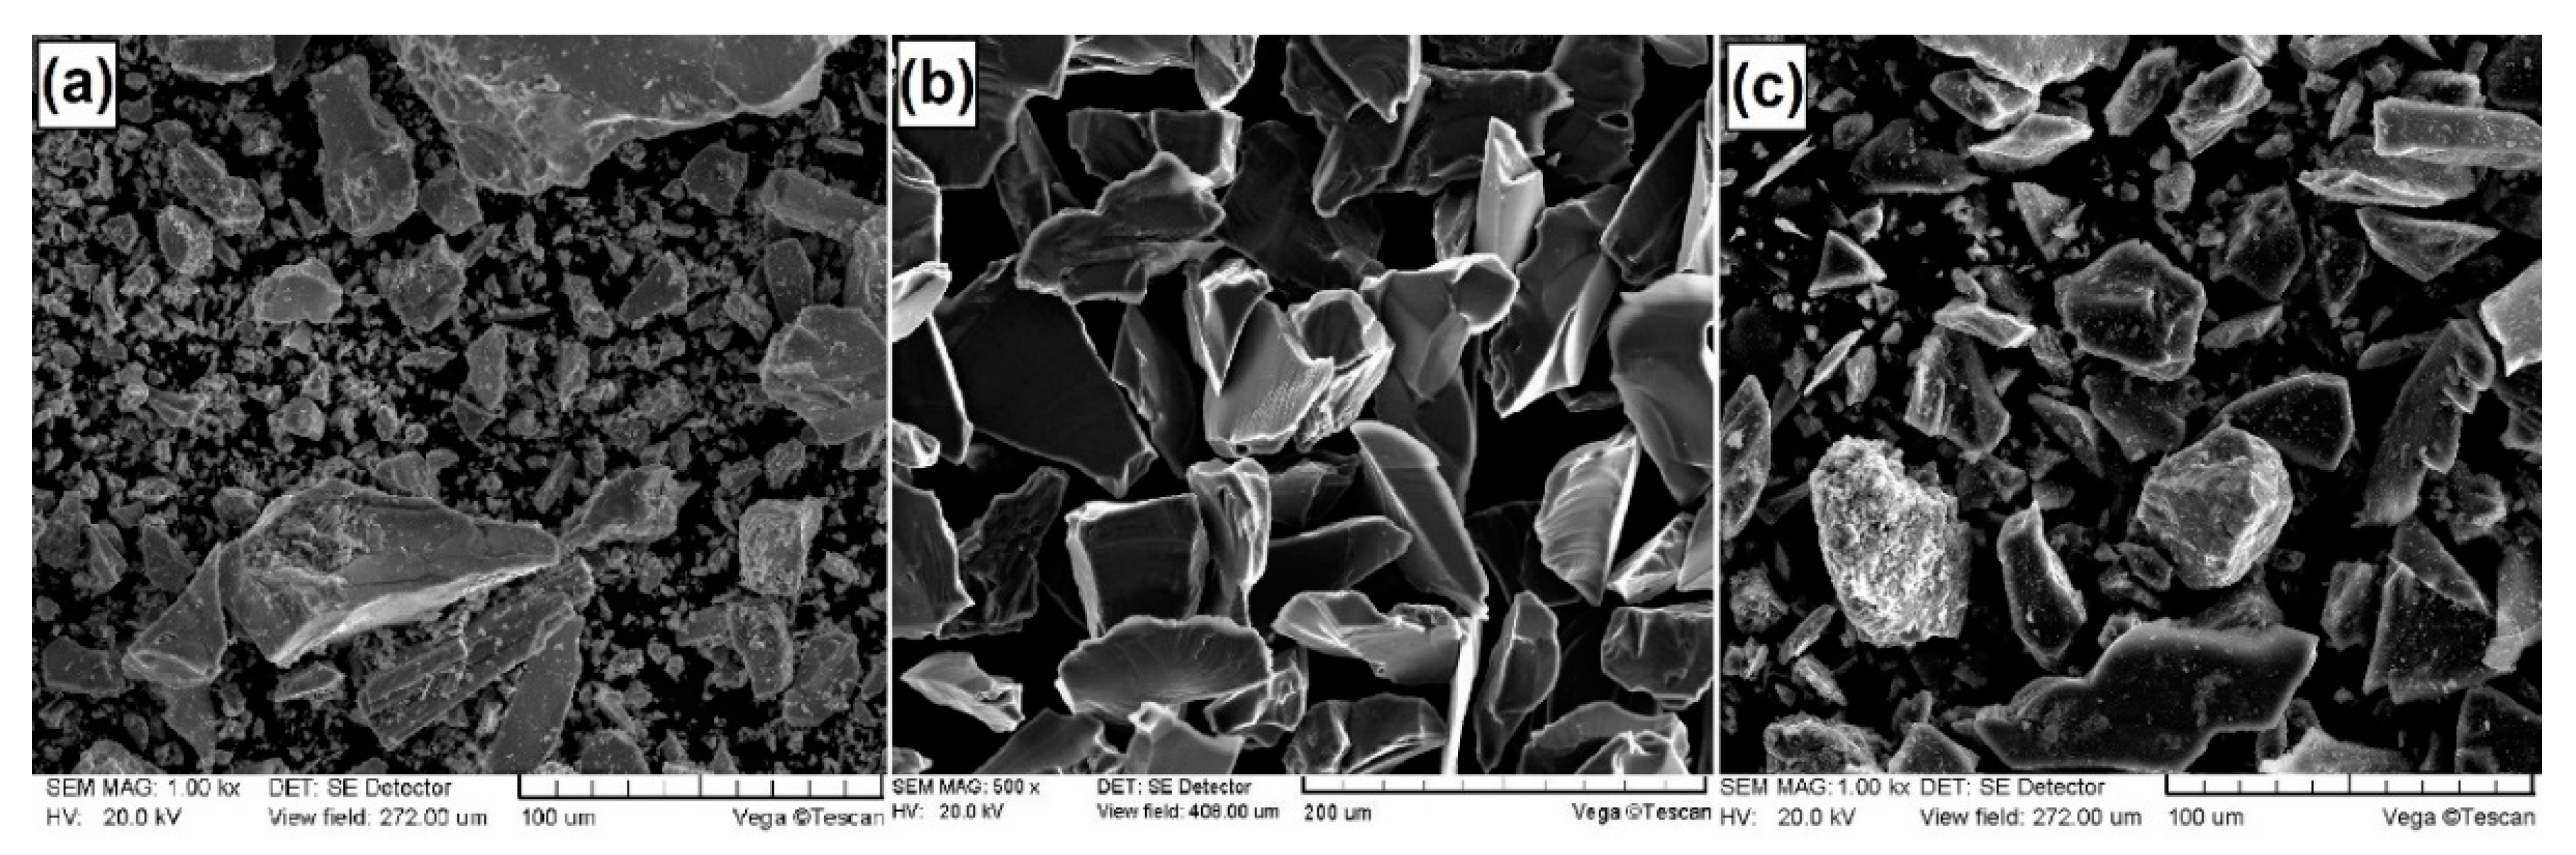
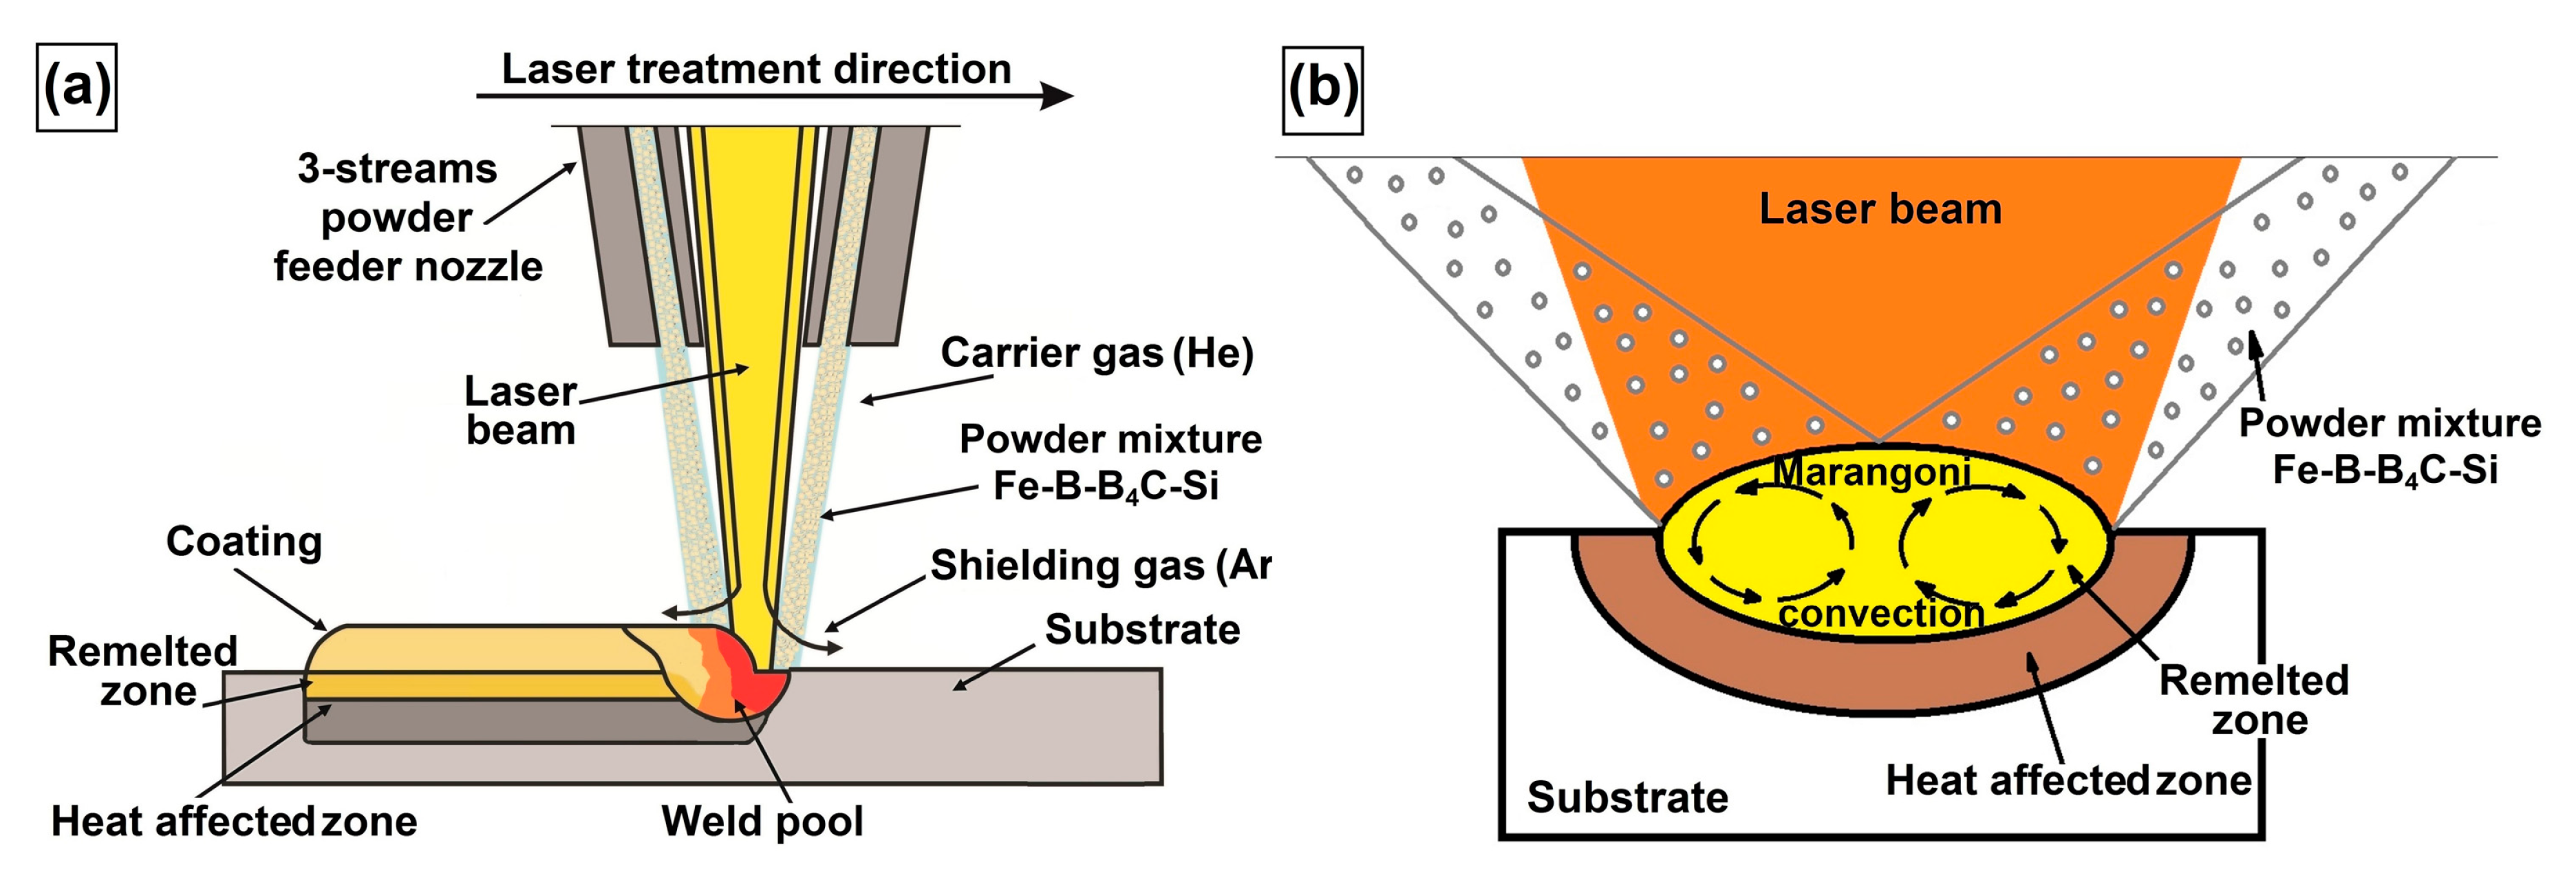
2. Materials and Methods

In this study, the composite coatings were produced on medium-carbon C45 steel specimens with dimensions of 60 mm length, 12 mm width and 4 mm height. The chemical composition of the steel substrate was determined using Solaris CCD Plus (Analytical Instruments Group, Novara, Italy), and is shown in Table 1.
As the coating materials, two powder mixtures were used. The first mixture consisted of typical iron-boron (Fe–B) which is used in steelmaking processes. This powder contains 20 wt.% B, 70 wt.% Fe and 10 wt.% (Si + C + Al). The Fe–B was characterized via technical purity grade. The second mixture contained 75 wt.% Fe–B and 25 wt.% reinforced particles (20% B4C and 5% Si). The purity of Si was 99.99% whereas the purity of B4C was 98.00%. Fe–B powder particles were characterized by irregular and sharp shapes with sizes in the range of 1–120 μm. Hard particles of B4C added to the powder mixture were characterized by sharp shapes with sizes in the range of 100–300 μm. The particles of Si had similar shape to B4C, but their size was in the range of 5–100 μm. The size and morphologies of the powder particles of Fe–B, B4C and Si are shown in Figure 1.
Before the laser modification process, the specimens were polished to obtain uniform surface roughness equal to Ra = 0.63. The specimens, before being placed in the chamber of the laser device, were degreased and cleaned using alcohol and acetone. To produce the first type of coatings commercially available, typical Fe–B from steelmaking processes was used. Before preparation of the second type of coatings, powders of Fe–B with Si and B4C particles were mixed for 3 h using a ball mill. All powder mixtures were dried in the furnace for 2 h at 110 °C. The composite coatings on steel specimens were manufactured using laser cladding technology. All the processes were carried out on a TRUMPF Laser Cell 3008 device (TRUMPF, Ditzingen, Germany). This is 5-axis CNC center equipped with a TruDisk laser of nominal power equal to 1 kW and a 3-streams powder feeding system. The wavelength of the laser was equal to 1030 nm. The nozzle is designed so that all powder streams converge at the same point on the laser beam. The distance between the nozzle tip and substrate was equal to 12 mm, while the angle between nozzle and specimen was 90°. The type of laser used was a Yb:YAG disk laser characterized by a TEM00 mode of circular shape. To precisely direct the powder mixture to the laser beam, a carrier gas (helium) was used, while argon was used as a shielding gas to the avoid oxidation of the materials. The flow rate of both gases was the same and was equal to 8 L/min. The laser beam diameter was equal to 1.6 mm. The overlapping of laser tracks was 55%. This value was used based on literature reports and preliminary experiments. Two laser beam powers were used: 600 and 800 W. Furthermore three scanning speeds of laser beam were applied: 600, 800, and 1000 mm/min. The changes in laser beam power had influence on the power density at which the substrate and powder mixture were remelted. The laser cladding process scheme is shown in Figure 2a. Figure 2b shows a scheme of mixing the coating material and substrate. Table 2 shows the essential production parameters. This will be discussed in more detail further in this paper.
Steel specimens with composite coatings were cut, and next ground using abrasive papers (60, 80, 120, 280, 400, 600, 800, 1000, 1500, and 2000), and finally polished using 0.1 μm Al2O3 paste. After the preparation of cross-sections of the specimens, the etching solution of HCl and HNO3 (in a volume ratio 3:1) was used to reveal the microstructure. Microstructural observations were conducted using Scanning Electron Microscopes VEGA 5135 (TESCAN, Brno, Czech Republic) and MIRA3 (TESCAN, Brno, Czech Republic). The phase identification of composite coatings was carried out with an EMPYREAN X-ray diffractometer equipped with Cu Kα radiation (PANalytical, Malvern, UK). Two theta angles ranged from 20° to 90°. All the tests were conducted under the following conditions: voltage 45 kV, current 40 mA and temperature 25 °C. The chemical compositions of coatings produced were investigated using Ultim® Max energy dispersive spectrometry (EDS) (Oxford Instruments, High Wycombe, UK). The results are presented in the form of point analysis. To determine the microhardness profiles, an FM-810 Vickers microhardness tester (Future-Tech, Kawasaki, Japan) equipped with FT-Zero automatic indentation measuring software was used. The tests were conducted under the load of 100 g (about 0.981 N), and for a loading time of 15 s.
Prior to starting the corrosion resistance tests, all the specimens were polished in order to achieve the same surface roughness (Ra = 1.25). It was necessary to maintain identical conditions in the corrosion tests. The corrosion resistance of the composite coating produced using laser cladding was studied in a 5% solution of NaCl at a constant temperature of 22 °C. The rate of potential change was equal to 0.5 mV/s. The area of research was equal to 50 mm2. Potentiodynamic corrosion studies were performed on an ATLAS 0531 EU & IA potentiostat (Atlas-Sollich, Rębiechowo, Poland). The specimen polarization was carried out in the direction of the anode in the potentials range from −1.5 to 1.5 V. the auxiliary electrode was made of platinum, while the reference electrode was a commercial saturated calomel electrode (SCE). Corrosion tests were conducted and recorded using AtlasCorr and AtlasLab software (version 2.24). Based on the analysis of current curves, the potentiodynamic corrosion and corrosion potential were determined. The corrosion test was conducted in accordance with the PN-EN ISO 17475 standard [23]. The Electrochemical Impedance Spectroscopy (EIS) tests were performed with a 10 mV amplitude perturbation, and within the frequency range from 10−3 to 105 Hz. The electrochemical equivalent circuit presented in Figure 3 was used.
To carry out wear resistance tests an Amsler-type device was applied. In this method, flat specimens with produced coatings have contact with the ring counter-specimen of the tool steel under conditions of dry friction. In this study the counter-specimens were vacuum hardened (>60 HRC). Wear resistance studies were performed using the following parameters: rotation speed of counter-specimen 250 rev./min, load 147 N and duration of friction time 300 min. The contact areas between specimens and counter-specimens were cooled using compressed air at a pressure of 2 bar. A reciprocating compressor equipped with an air preparation system, which prevented the introduction of water drops into the friction area, was used for this purpose. Water is usually found in pneumatic conduits and this could change friction conditions. The mass loss of coatings was measured using the ALJ5004A analytical weight (KERN, Balingen, Germany) with a detection limit of 0.0001 g after every 30 min of friction.

3. Results and Discussion

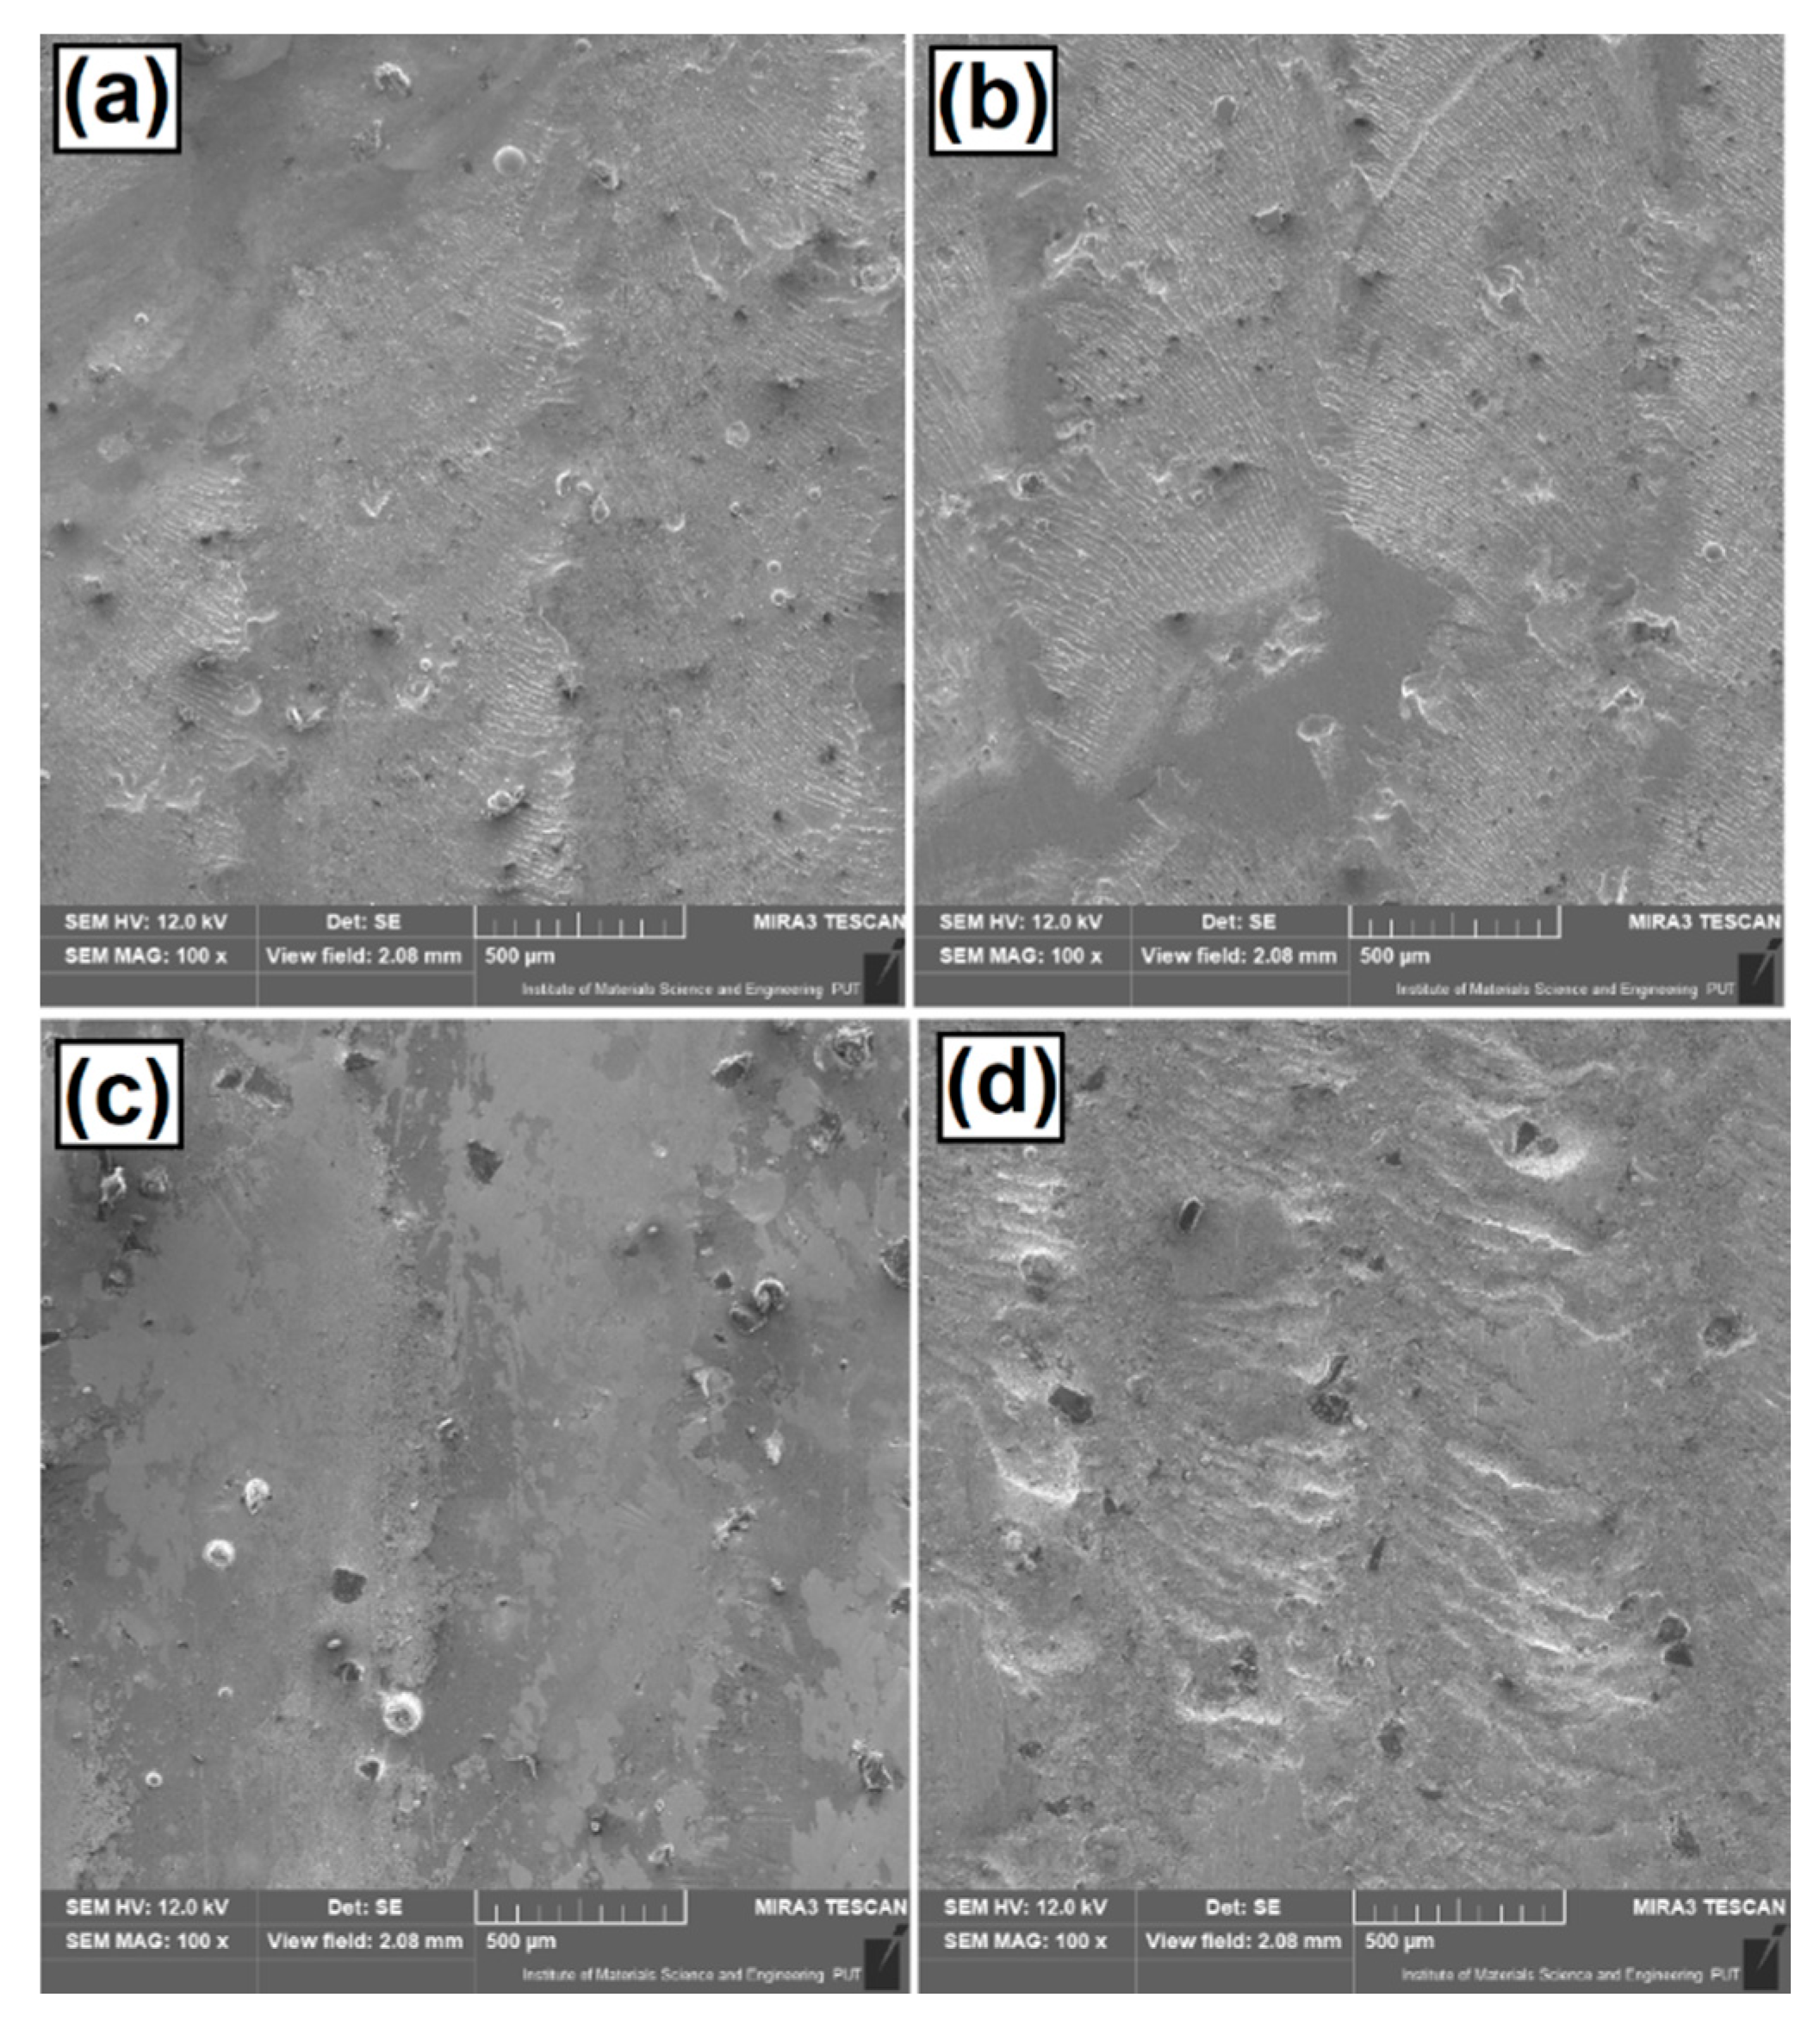
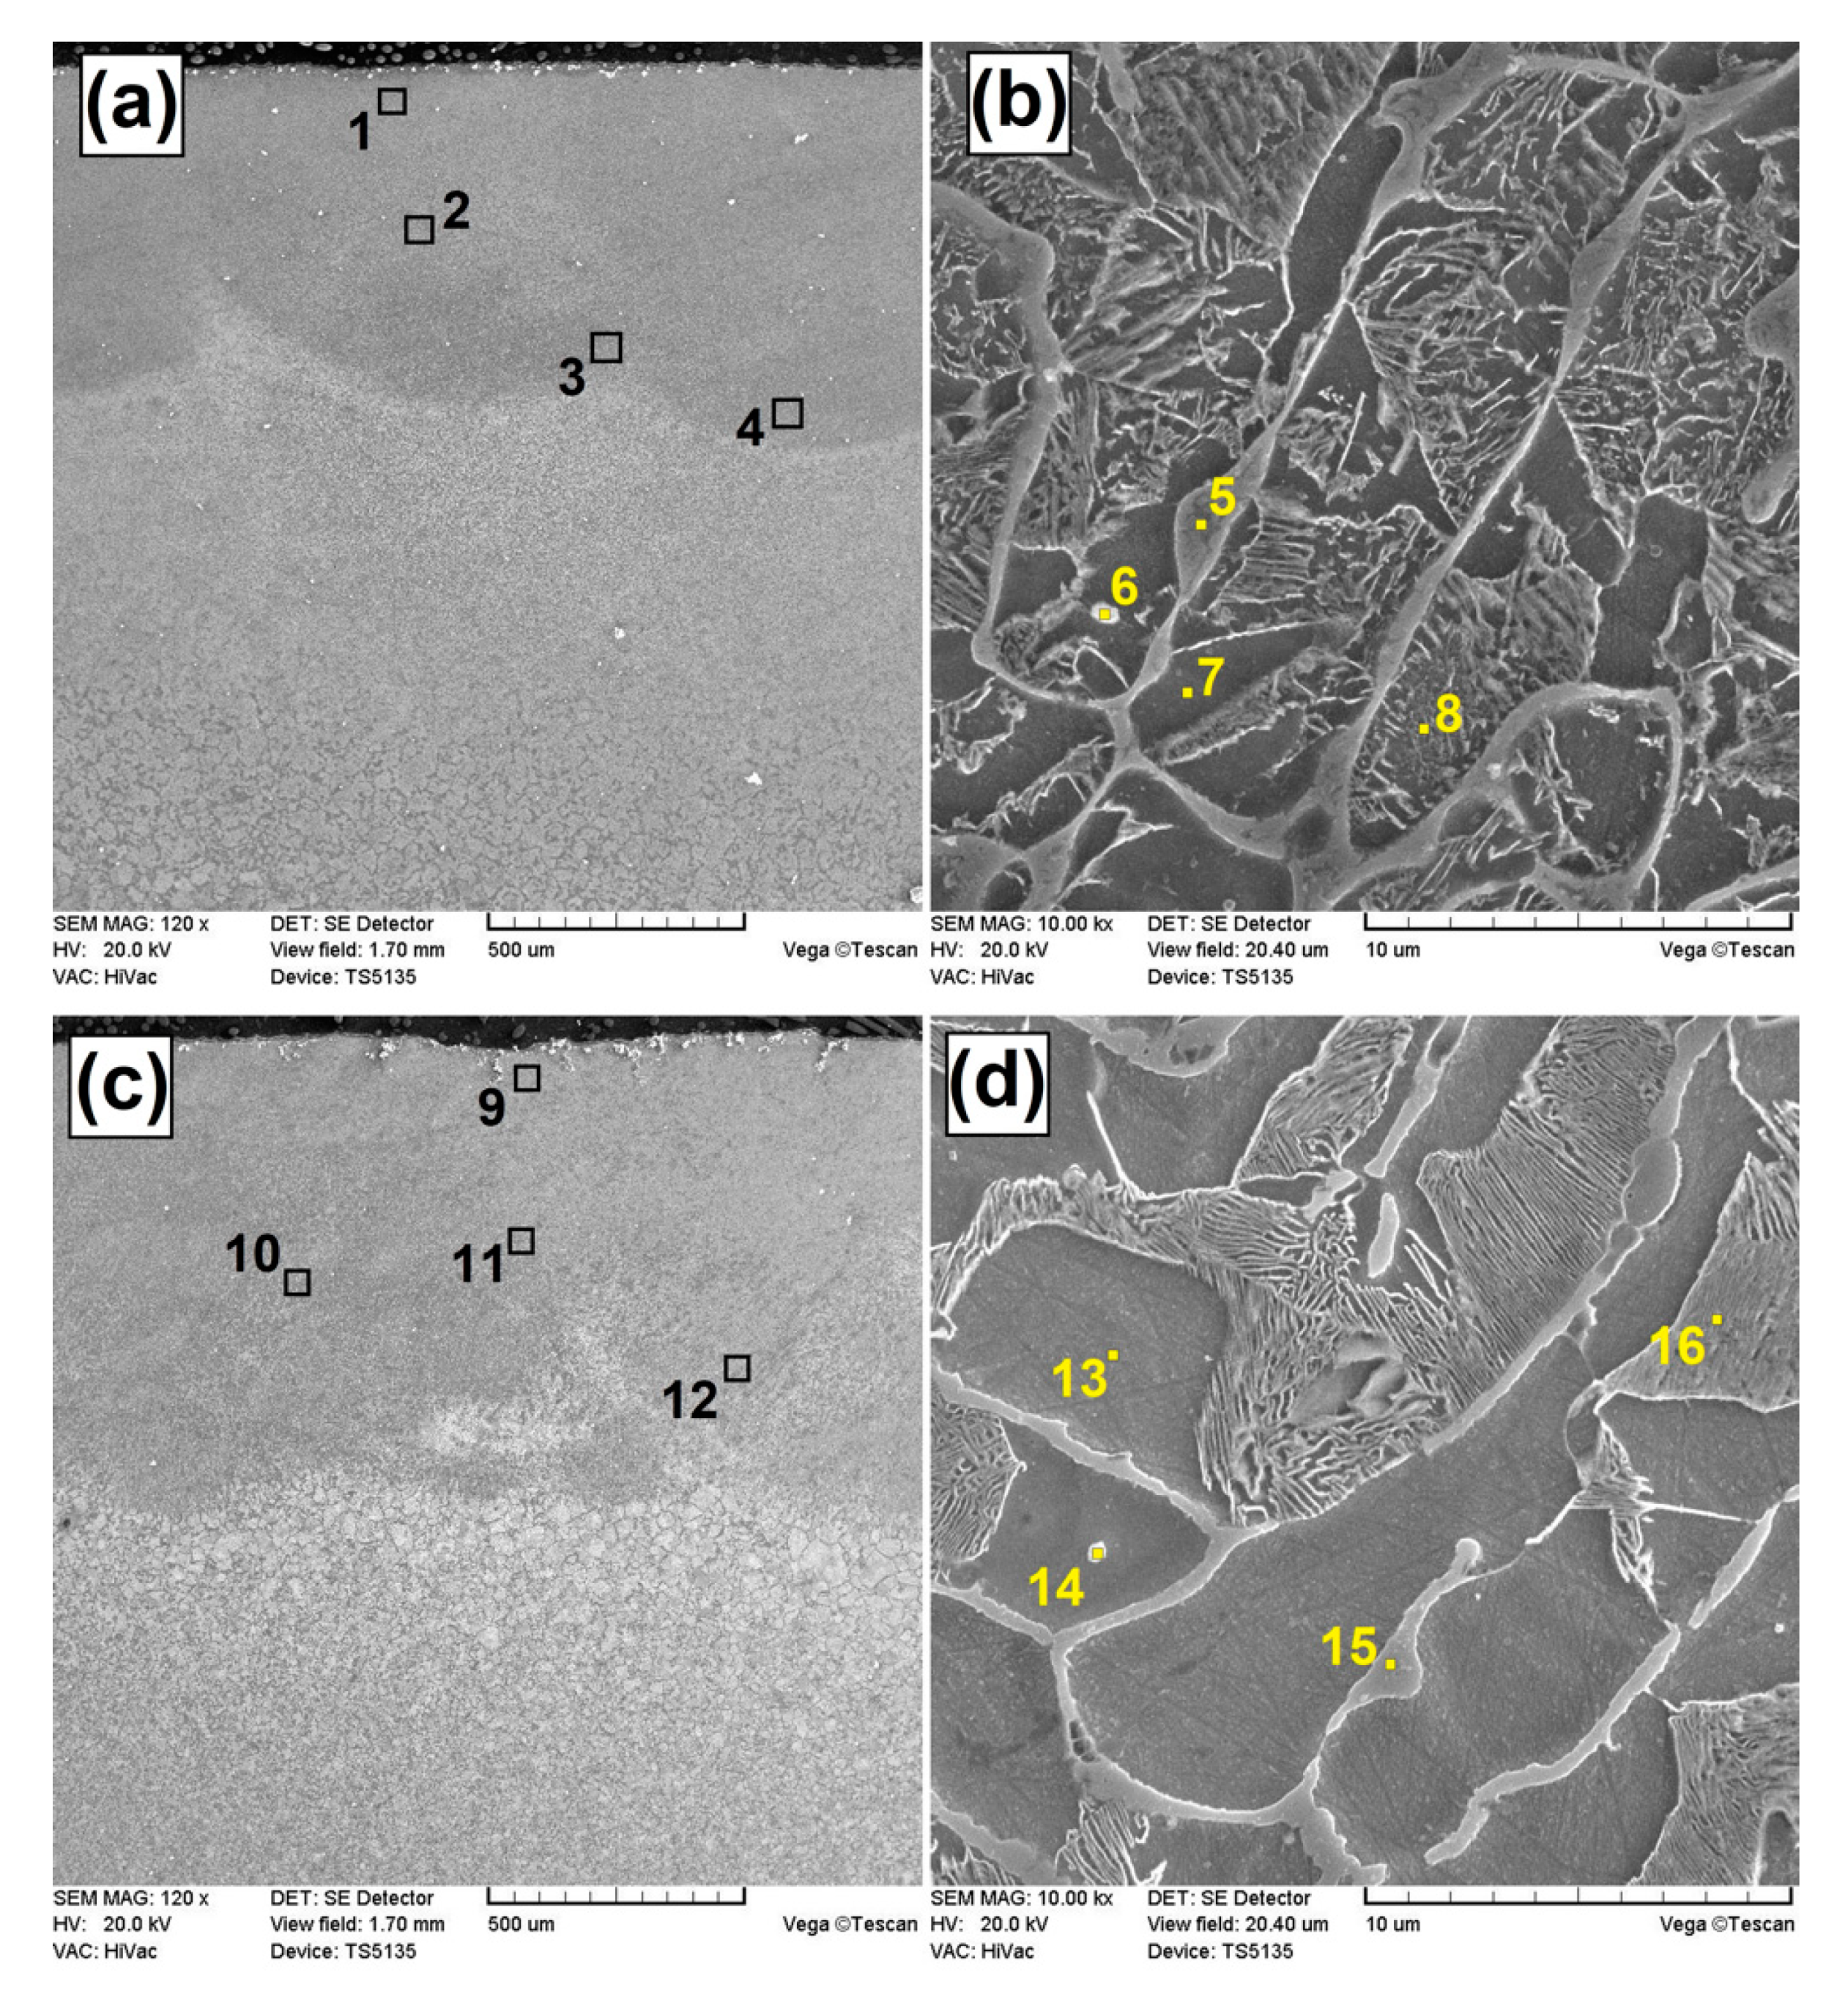
3.1. Microstructure Evaluation

The microstructure of the Fe–B composite coatings produced using laser cladding with powder are shown in Figure 4a–d. In the microstructure of the Fe–B coatings, the remelted zone obtained by the remelting of a steel substrate and powder mixture can be observed. The heat affected zone is also visible. The general view of the laser track microstructure of the Fe–B coating produced using a laser beam power of 600 W and scanning speed 600 mm/min is presented in Figure 4a, while an enlarged part of the remelted zone of this coating is shown in Figure 4b. The microstructure consists of the solid solution of boron in iron, as well as boron eutectics. Figure 4c shows the general view of the laser tracks microstructure of the Fe–B coating produced using the following parameters: 800 W and 600 mm/min. The enlarged area of the remelted zone’s microstructure is presented in Figure 4d. In this case, the amount of fibrous eutectics is reduced due to the processing parameters used. At the borders of the former austenite grains one can clearly see the eutectics and matrix with unclear internal microstructure. It can be seen that laser modification contributed to the formation of a lamellar microstructure in the remelted zone. This is due to the material heating and rapid cooling, which is characteristic of laser processing. The amount of boron in the Fe–B coating produced is reduced with the increase in laser beam power, which is associated with more heat supplied to the steel surface, and hence the production of a larger volume of remelted material during laser cladding.
It can also be seen that the higher laser beam power caused grain growth in the substrate material. This can be related to the cyclic heating/cooling of the specimen, which results in maintaining a high temperature in the region adjacent to the laser melted pool, and thereby in microstructural coarsening. The high temperature favors the grain growth in the upper area of the heat affected zone. At a high laser beam power, the eutectic boron microstructure obtained was frayed and took up a small area. With the increase in laser beam power, the dimensions of the laser tracks increased. For laser beam power equal to 600 W, the average depth of the melted zone was 678 μm, while for power 800 W it was about 891 μm. The heat affected zones were about 1250 and 1450 μm, respectively. The composite coatings produced were composed of a hypoeutectic microstructure that contained primary dendrites, whereas the interdendritic eutectics contained boron. Additionally, lamellar eutectic was found in the interdendritic regions.
The microstructures of the Fe–B–B4C–Si composite coatings produced using laser cladding with powder are shown in Figure 5a–h. These coatings were composed of solid solution and borides eutectic with martensite. As a result of laser cladding with powders, the microstructure on the border between the remelted zone and the heat affected zone was composed of both the coating material and the steel substrate.
The composite coating obtained was characterized by a good metallurgical bonding with the steel substrate. It can be seen that the laser cladding process leads to fluctuations in chemical composition in the liquid phase, so-called turbulence due to the mixing of cladded and the substrate material. As a result of the rapid solidification of the remelted zone, after cooling these turbulences caused heterogeneity in the chemical composition. The mixing of all the ingredients was based on a mechanism called Marangoni convection. The cladded coatings have a negative temperature coefficient of surface tension. When the zone under the laser beam was heated up, the surface tension dropped in the center of the melting pool and the direction of the fluid flow was from the center towards the edges of the melting pool (Figure 2b). In the microstructure of the remelted zone, there occurred a flat solidification front at the border with a non-melted substrate, turning into columnar and dendritic crystals, oriented in the direction of heat dissipation.
In the central part of the remelted zone, where there was a change in the direction of heat removal, the crystals increased almost parallel to the heating direction, so that on the longitudinal ripples they are visible as equiaxial. Because the solidification process was faster at the bottom of the laser track than nearer the surface, the size of the crystals at the bottom was much smaller. In the presented laser cladding method, coatings characterized by a lack of cracks were obtained. Moreover, the use of the laser cladding method contributed to a uniform supply of powder, which together with the simultaneous influence of the laser beam on the substrate and the added powder material resulted in the achievement of a uniform thickness of coating. Figure 5a shows the laser track of Fe–B–B4C–Si coatings produced using 600 W and 600 mm/min. Further specimens were produced using the same laser beam power but with an increased scanning speed of laser beam. Figure 5c,d show the Fe–B–B4C–Si coatings produced using scanning speeds equal to 800 and 1000 mm/min, respectively. It was found that increasing the scanning speed reduces the interaction time of the laser beam with the substrate, and thus causes a reduction in the amount of heat energy absorbed. The depth of the remelted zone in the Fe–B–B4C–Si coatings produced using a laser beam power equal to 600 W changed from about 672 μm (for 600 mm/min) to about 550 μm (for 1000 mm/min). The power density for these specimens was 298.6 W/mm2. Figure 5e–h present images of the cell-dendritic and dendritic microstructure. It should be noted that the silicon introduced during the surface modification by the laser is an element that has a ferrite stabilizing effect, so it accumulates in the ferrite areas. It can be noticed that with the presented parameters, the obtained coatings had a homogeneous microstructure as well as no porosity or cracks. The authors highlight the significant impact of the laser tracks overlapping equal to 55%. This was supported by the analysis of earlier important papers. A detailed study on this subject was conducted by Steen [2,4], who concluded that the best results were obtained with a degree of overlap in the range from 30% to 60%. An important role in the heat transport mechanism in the molten pool is played by convection. It is clear from the papers [1,2,3,4,5] that all the coating materials characterized by high microhardness and low plasticity are particularly exposed to cracking. Therefore, hard particles of boron carbides B4C and silicon Si were added to the Fe–B powder in appropriate amounts. Boron carbides were supposed to ensure the presence of hard phases increasing wear resistance (hardness of B4C is 2800 HV), while silicon was used to promote the formation of a solid-solution microstructure, which was supposed to be a kind of skeleton of the newly formed surface layer. The central area of the laser track contained elongated eutectic colonies oriented perpendicularly to the border with the next laser track or steel substrate. The orientation of the eutectic colonies indicates the heat transfer direction. A characteristic grain growth can be seen on the border zone between successively produced laser tracks. A large variation of crystals orientation in adjacent areas was visible. The microstructure of the laser tracks produced using an 800 W laser beam power and scanning speed equal to 600 mm/min is shown in Figure 5b. Compared to the coating shown in Figure 4c, the depth of the obtained tracks was slightly thicker. The difference in depth of the individual coatings results from the chemical composition of these coatings. Heat is stored differently in the Fe–B coating, and differently in the coating containing B4C and Si, due to the different capacities and thermal conductivities of these materials. The heat capacity of boron carbide is twice that of iron. Silicon also has a higher heat capacity value than iron. When comparing Figure 5a,c,d, the influence of the laser beam scanning speed of the laser on coating thickness can be observed. The increase in scanning speed with a simultaneous constant laser beam power density contributed to the generation of laser tracks with a smaller thickness. At a low scanning speed, the laser tracks had a depth of aprox. 1330 μm, while at a large scanning speed their depth was reduced to aprox. 1115 μm.

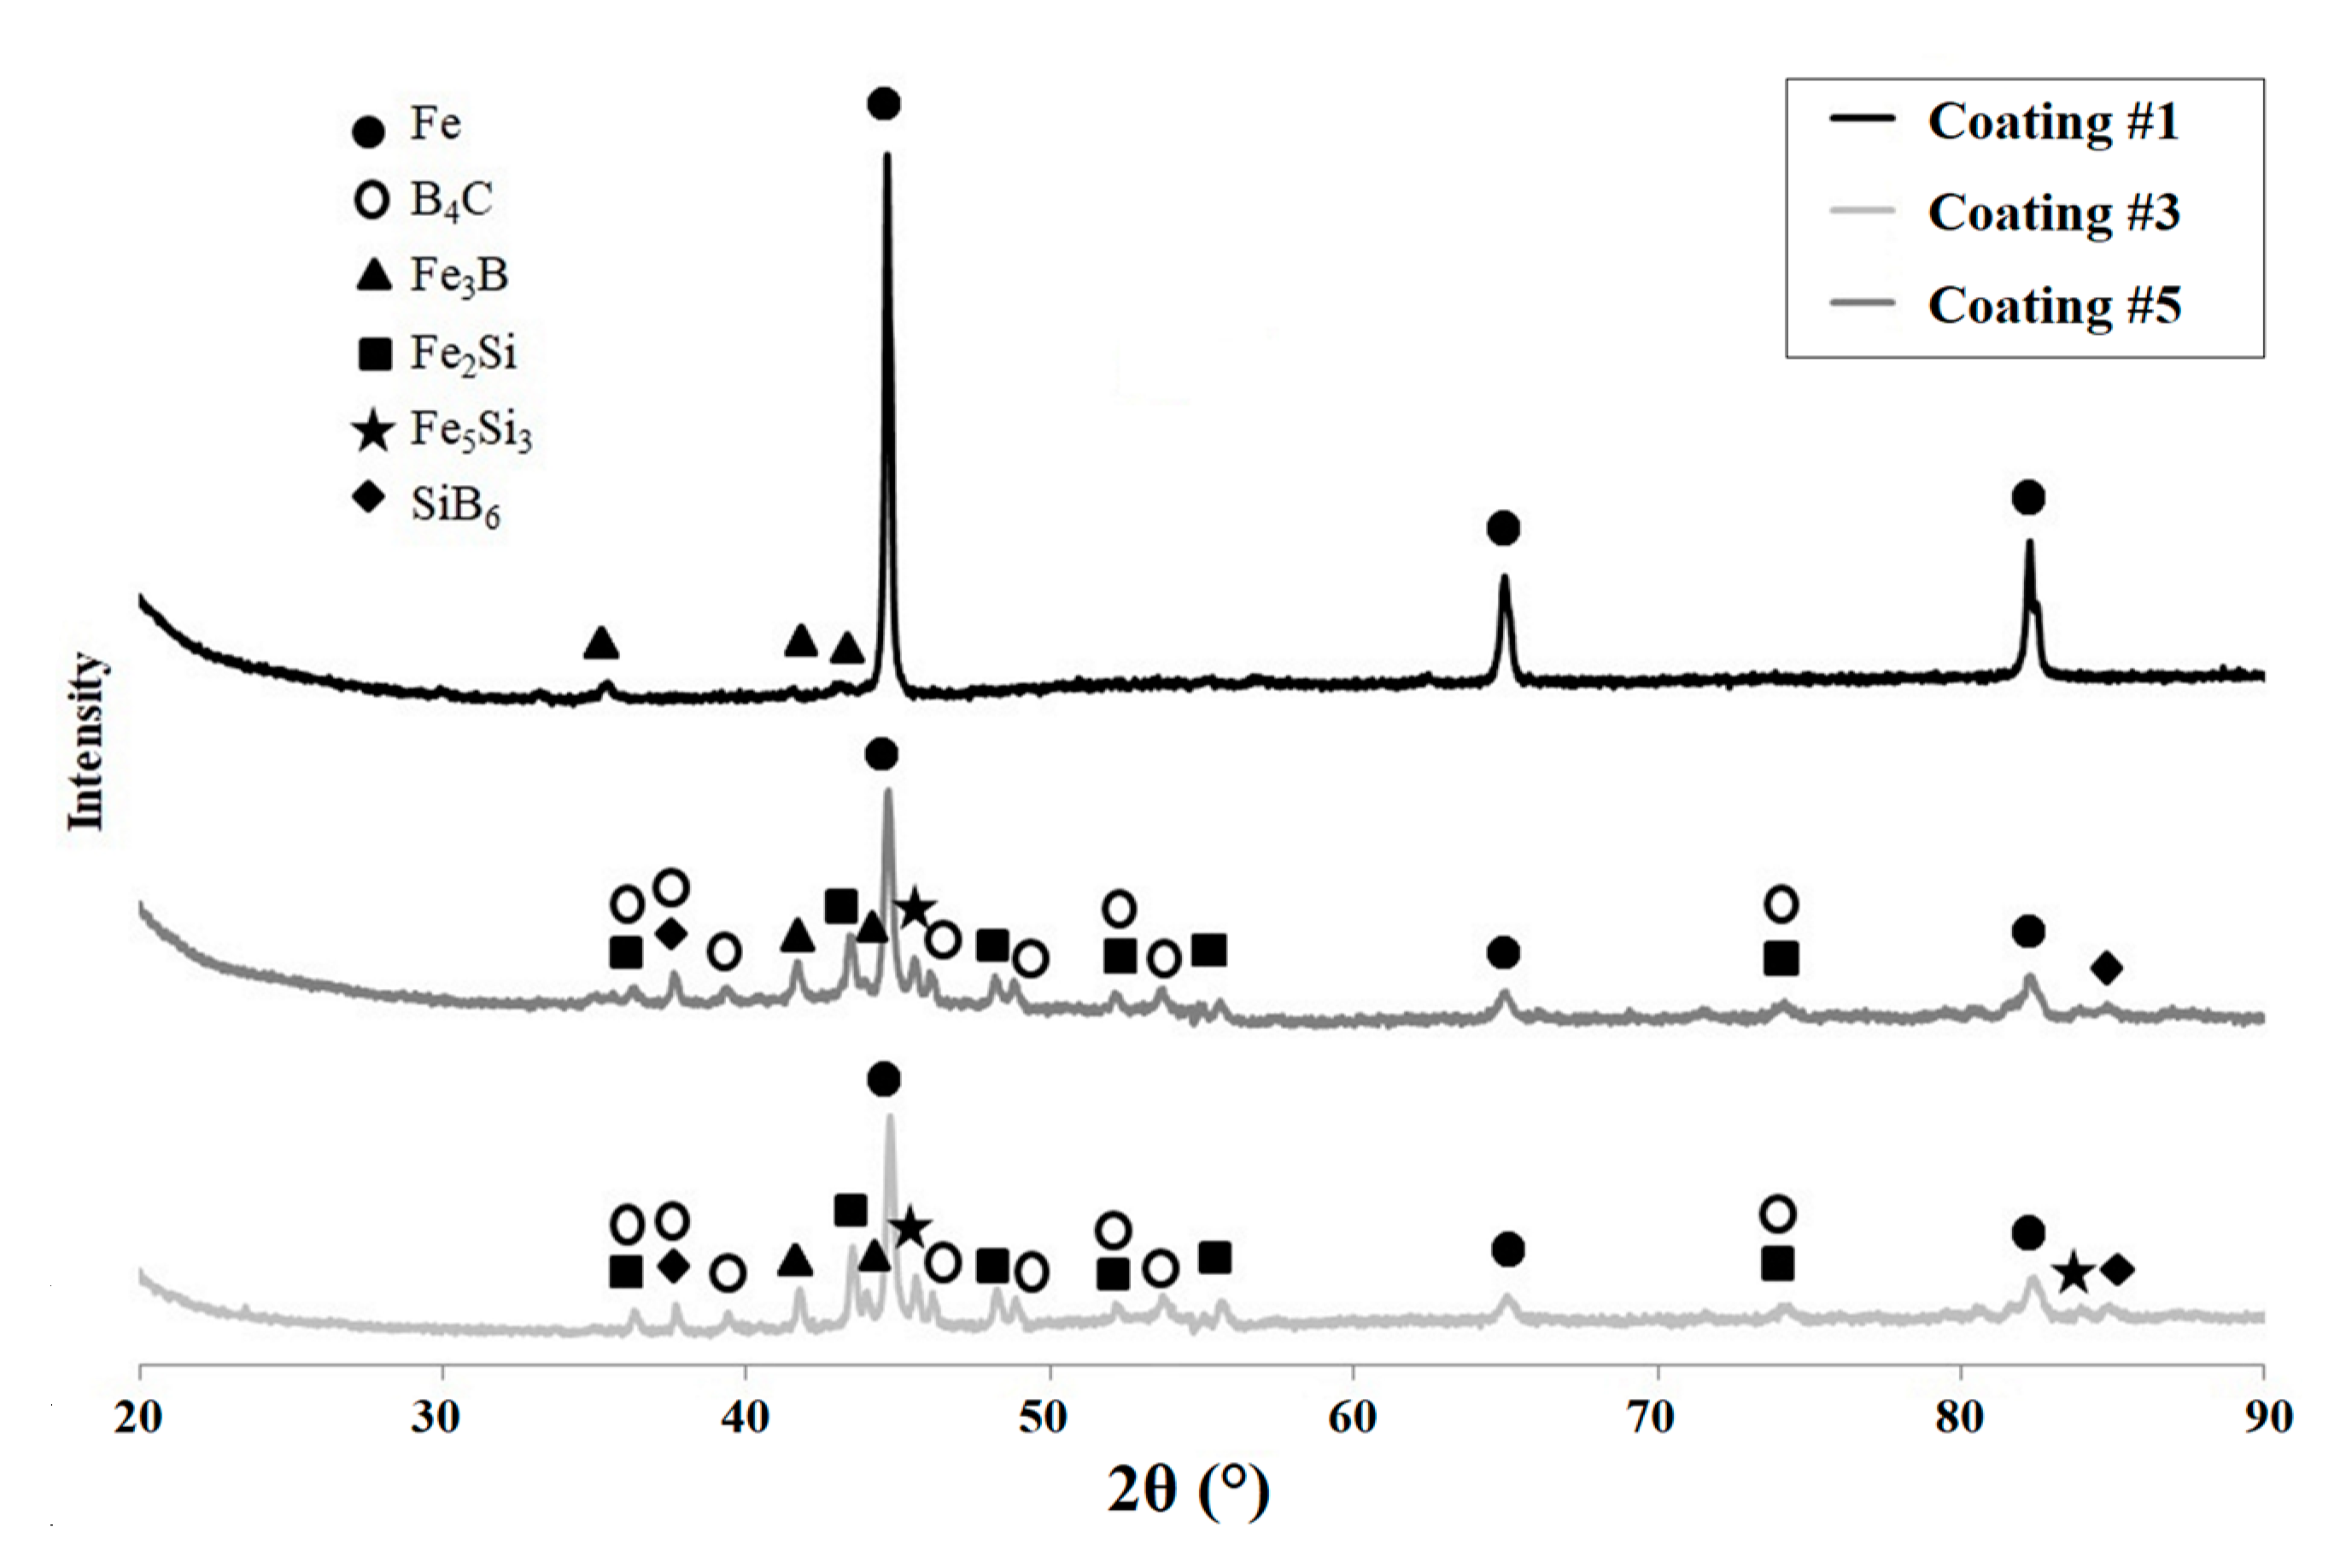
3.2. Phase Composition Analysis

The phase composition of the laser cladded coatings was investigated, and selected results are shown in Figure 6. All the coatings compared were produced using a 600 W laser beam power. In the case of the Fe–B coating produced without hard particles, the presence of a clear peak corresponding to Fe as well as less visible peaks corresponding to iron boride Fe3B phase were found.
In the case of composite coatings produced by the laser cladding method using a powder mixture of Fe–B–B4C–Si, two kinds of coatings with differing scanning speeds of laser beam were obtained. For coatings produced using scanning speeds of both 600 mm/min as well 800 mm/min, the presence of Fe3B, Fe2Si, and Fe5Si3 phases, and peak Fe, were found. The phase of boron carbides B4C was also identified. The intensities of the carbide, silicide and boride phases were relatively small, but they was clearly visible in the XRD spectrum. Different scanning speeds had an influence on the number of phases formed in the coatings. It can be concluded that the change of this parameter, which also affects the time for which the beam is exposed to the material, has some significance. The higher scanning speed reduces the phases intensity. So, most likely, it reduces their share in the coating. The increase in scanning speed also reduces the intensity of the iron-derived peaks, which is caused by the replacement of iron by other elements. One of the phases formed is a silicon hexaboride (SiB6). This kind of ceramics is chemically stable up to high temperatures, and this allows the use of such coatings in extreme operating conditions. Products with coatings containing ceramic phases such as carbides, borides and silicides are characterized by longer life cycle.

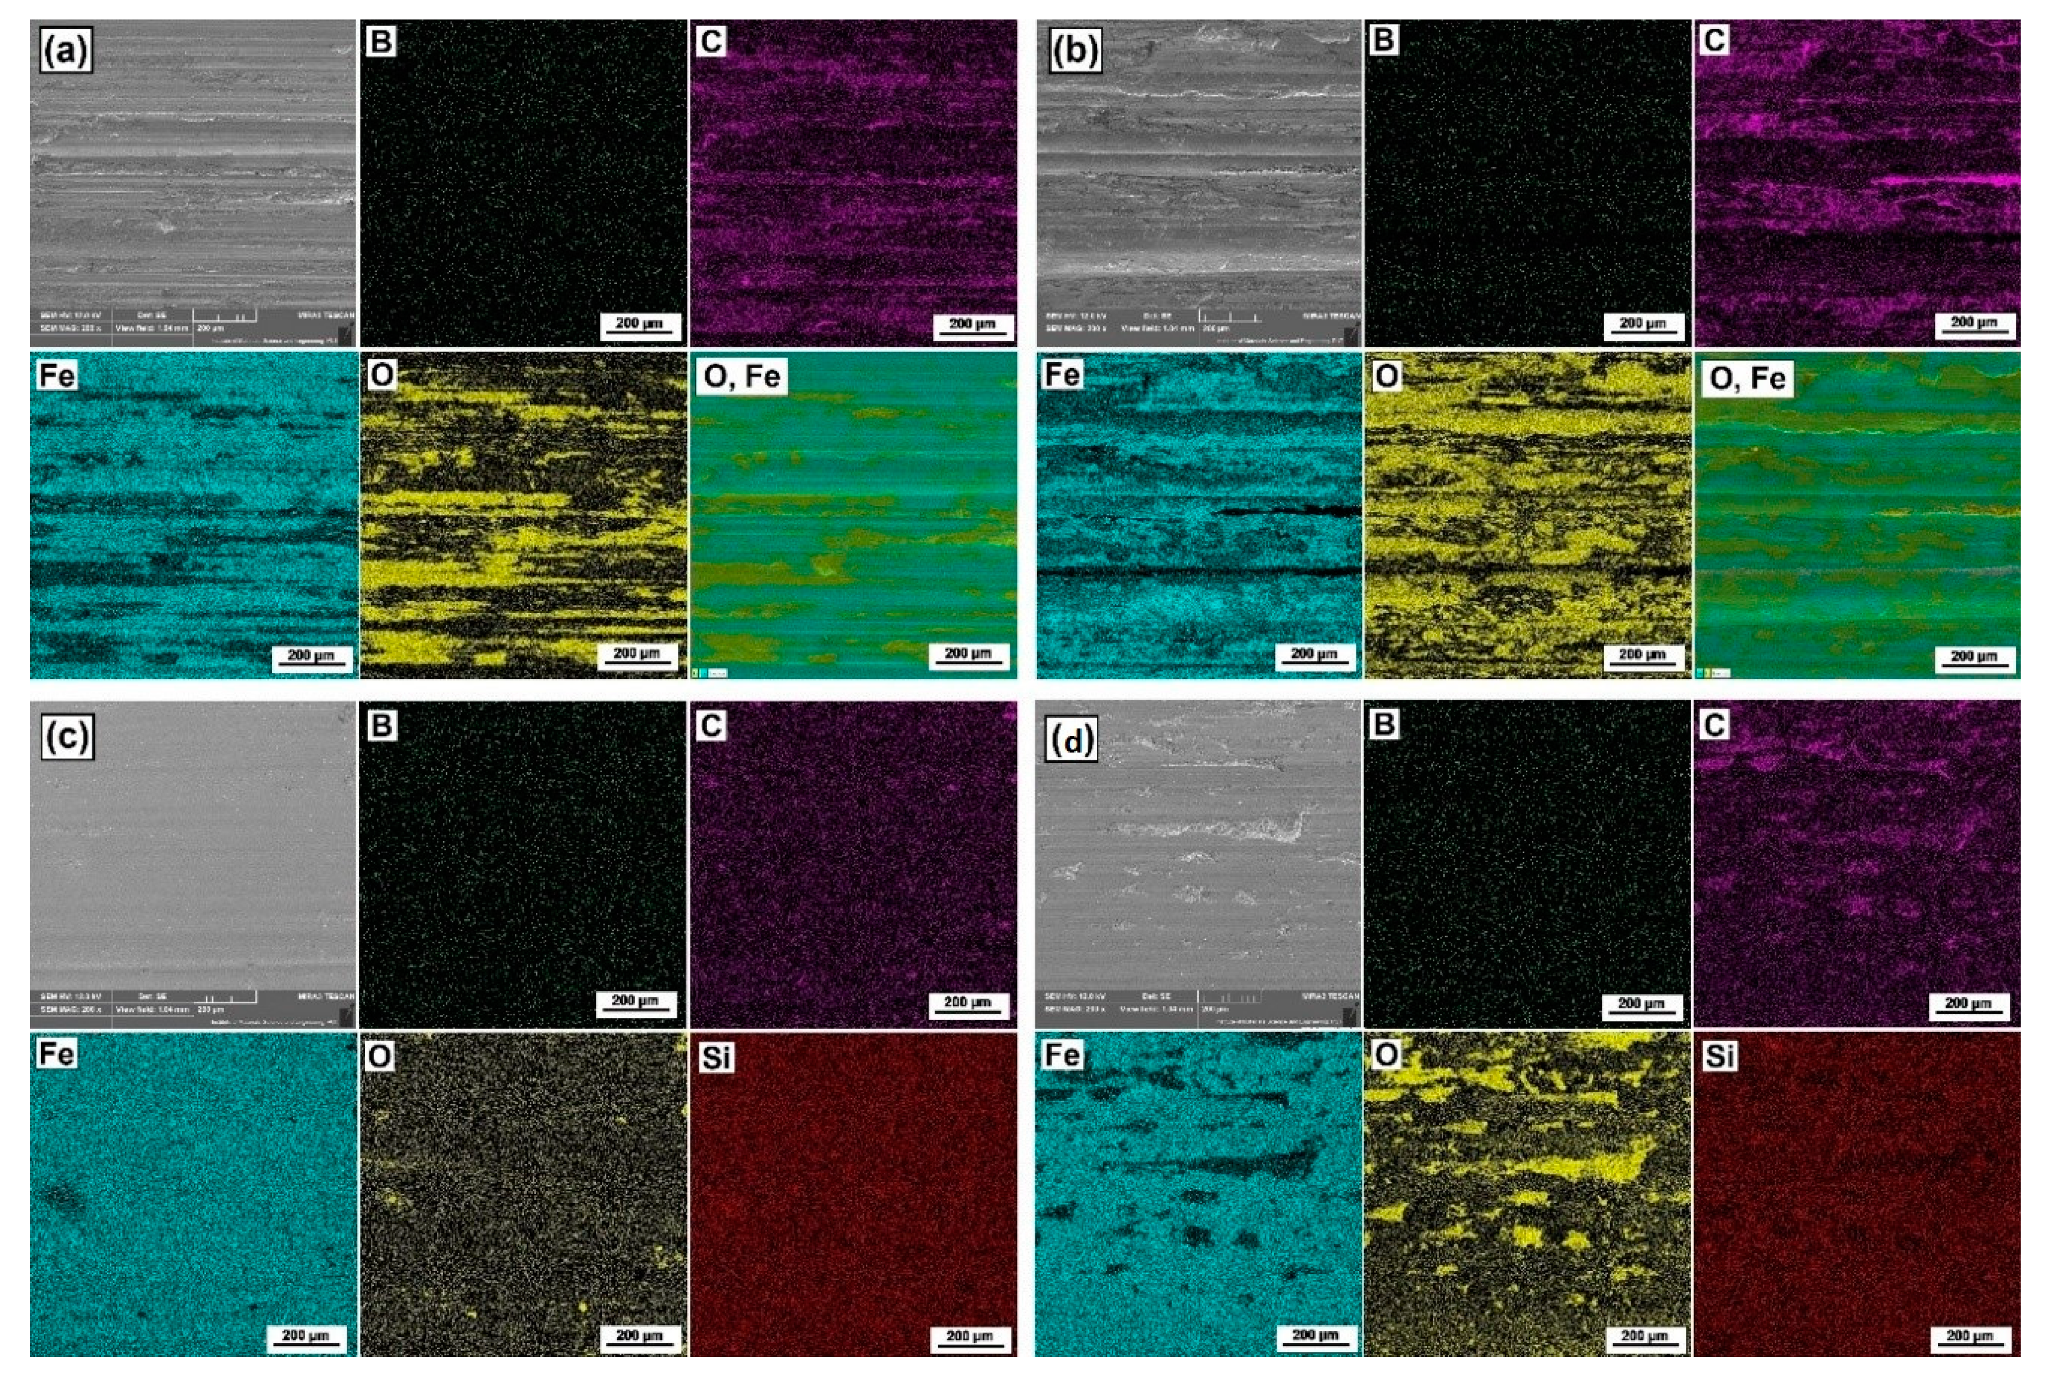
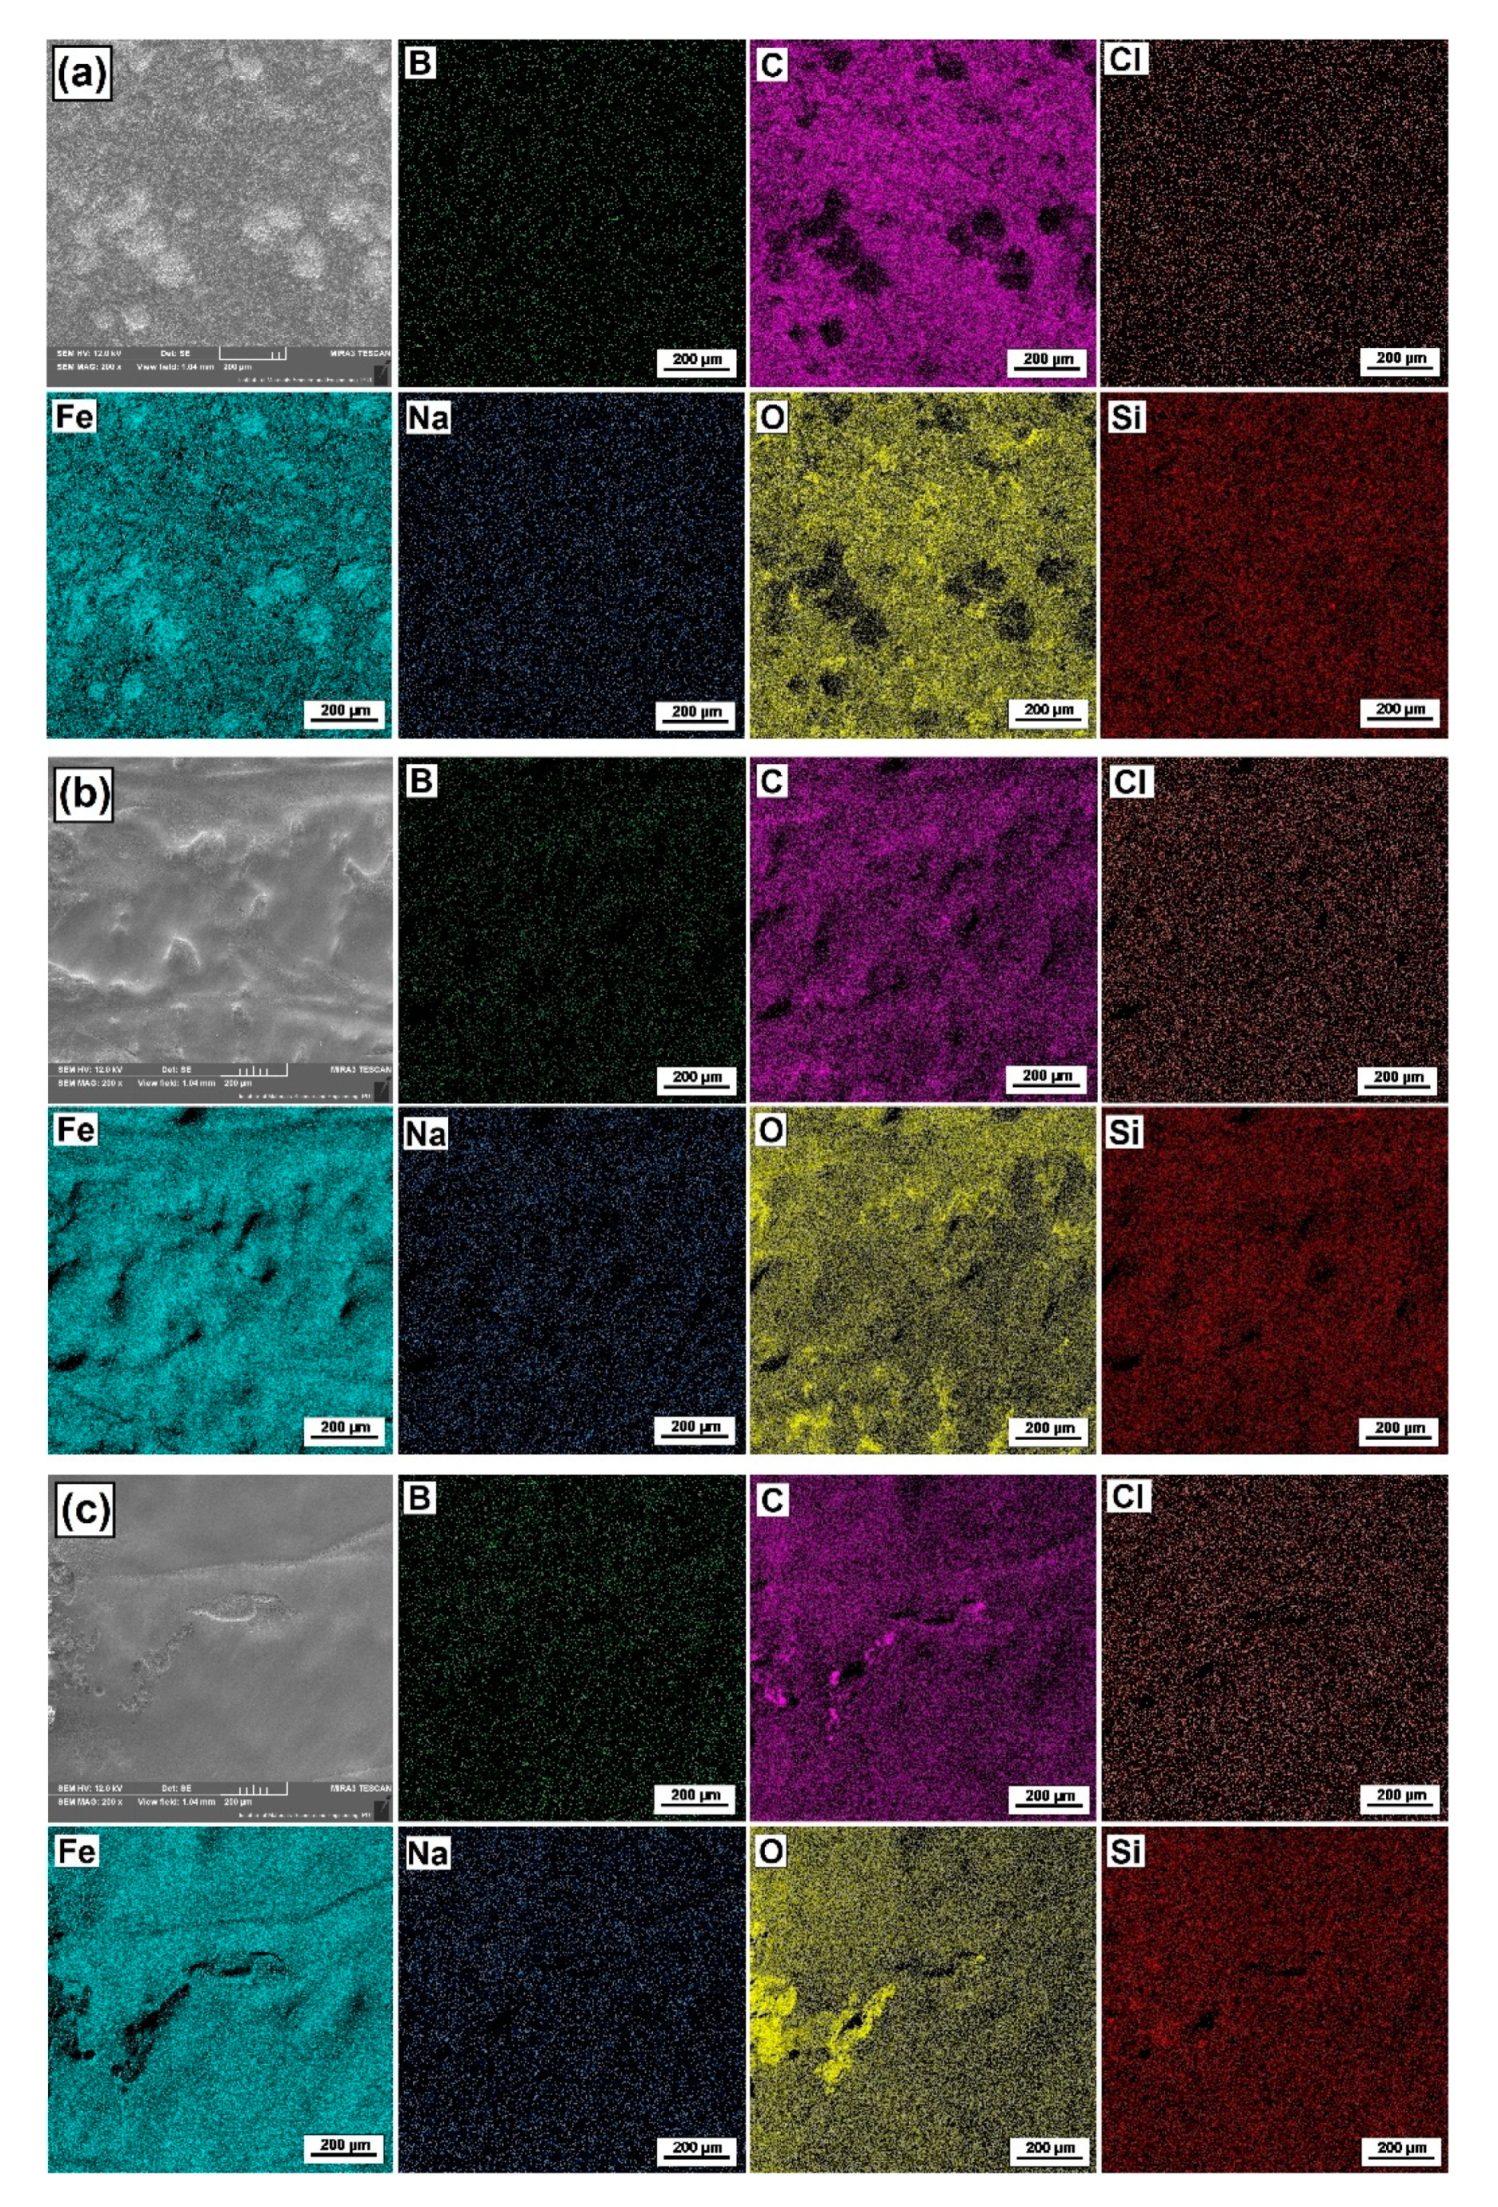
3.3. Chemical Composition Analysis

Table 3 shows the results of Energy Dispersive X-ray Spectroscopy (EDS) tests for the points marked on the microstructure images (Figure 4 and Figure 5). An increased content of boron was found in the upper and middle zones of the laser tracks in the Fe–B coating. The areas with a dendritic microstructure had a slightly increased boron content (Figure 4b, item 5) as opposed to the matrix (Figure 4b, item 7). Increasing the laser beam power during the remelting process caused a reduction in the boron content (Figure 4a point 1 in Table 3, and Figure 4c point 9 in Table 3). In the case of Fe–B–B4C–Si coatings, the percentage content of boron was also increased in the upper and middle zones of the laser track. The amount of boron increased with the decreasing laser beam power as well as with decreasing scanning speed.
For parameters 800 W and 600 mm/min, the boron content oscillated in the range of approx. 2–3 wt.%. On the other hand, reducing the power to 600 W and increasing the scanning speed to 1000 mm/min contributed to the increase of its weight share to about 5%. The silicon content was around 0.5 wt.%.
In the EDS results, carbon is also taken into account, but it can be assumed that the boron and carbon peaks coincide. The EDS method is not entirely sufficient to determine the amount of boron, because the peak-to-background ratio is relatively weak. Boron peaks often coincide with carbon peaks. For this reason, the EDS method was limited to the most important chemical elements that have a significant share in the coating. Similar to the Fe–B coatings, in the Fe–B–B4C–Si coatings the measuring points were also in the area of dendrite occurrence and in eutectic interdendritic spaces. Increased boron content was found in all analyzed cases in dendritic areas. In the interdendritic spaces, increased silicon contents were found. Due to the fact that boron is a light element and its content is distorted by carbon peaks, EDS results are only approximate. The obtained phases were confirmed by XRD method. Most likely as a result of laser remelting, boron cementite Fe3(C, B) was formed, in which part of the carbon was replaced with boron atoms, which is confirmed by the results of the X-ray analysis (Figure 6).

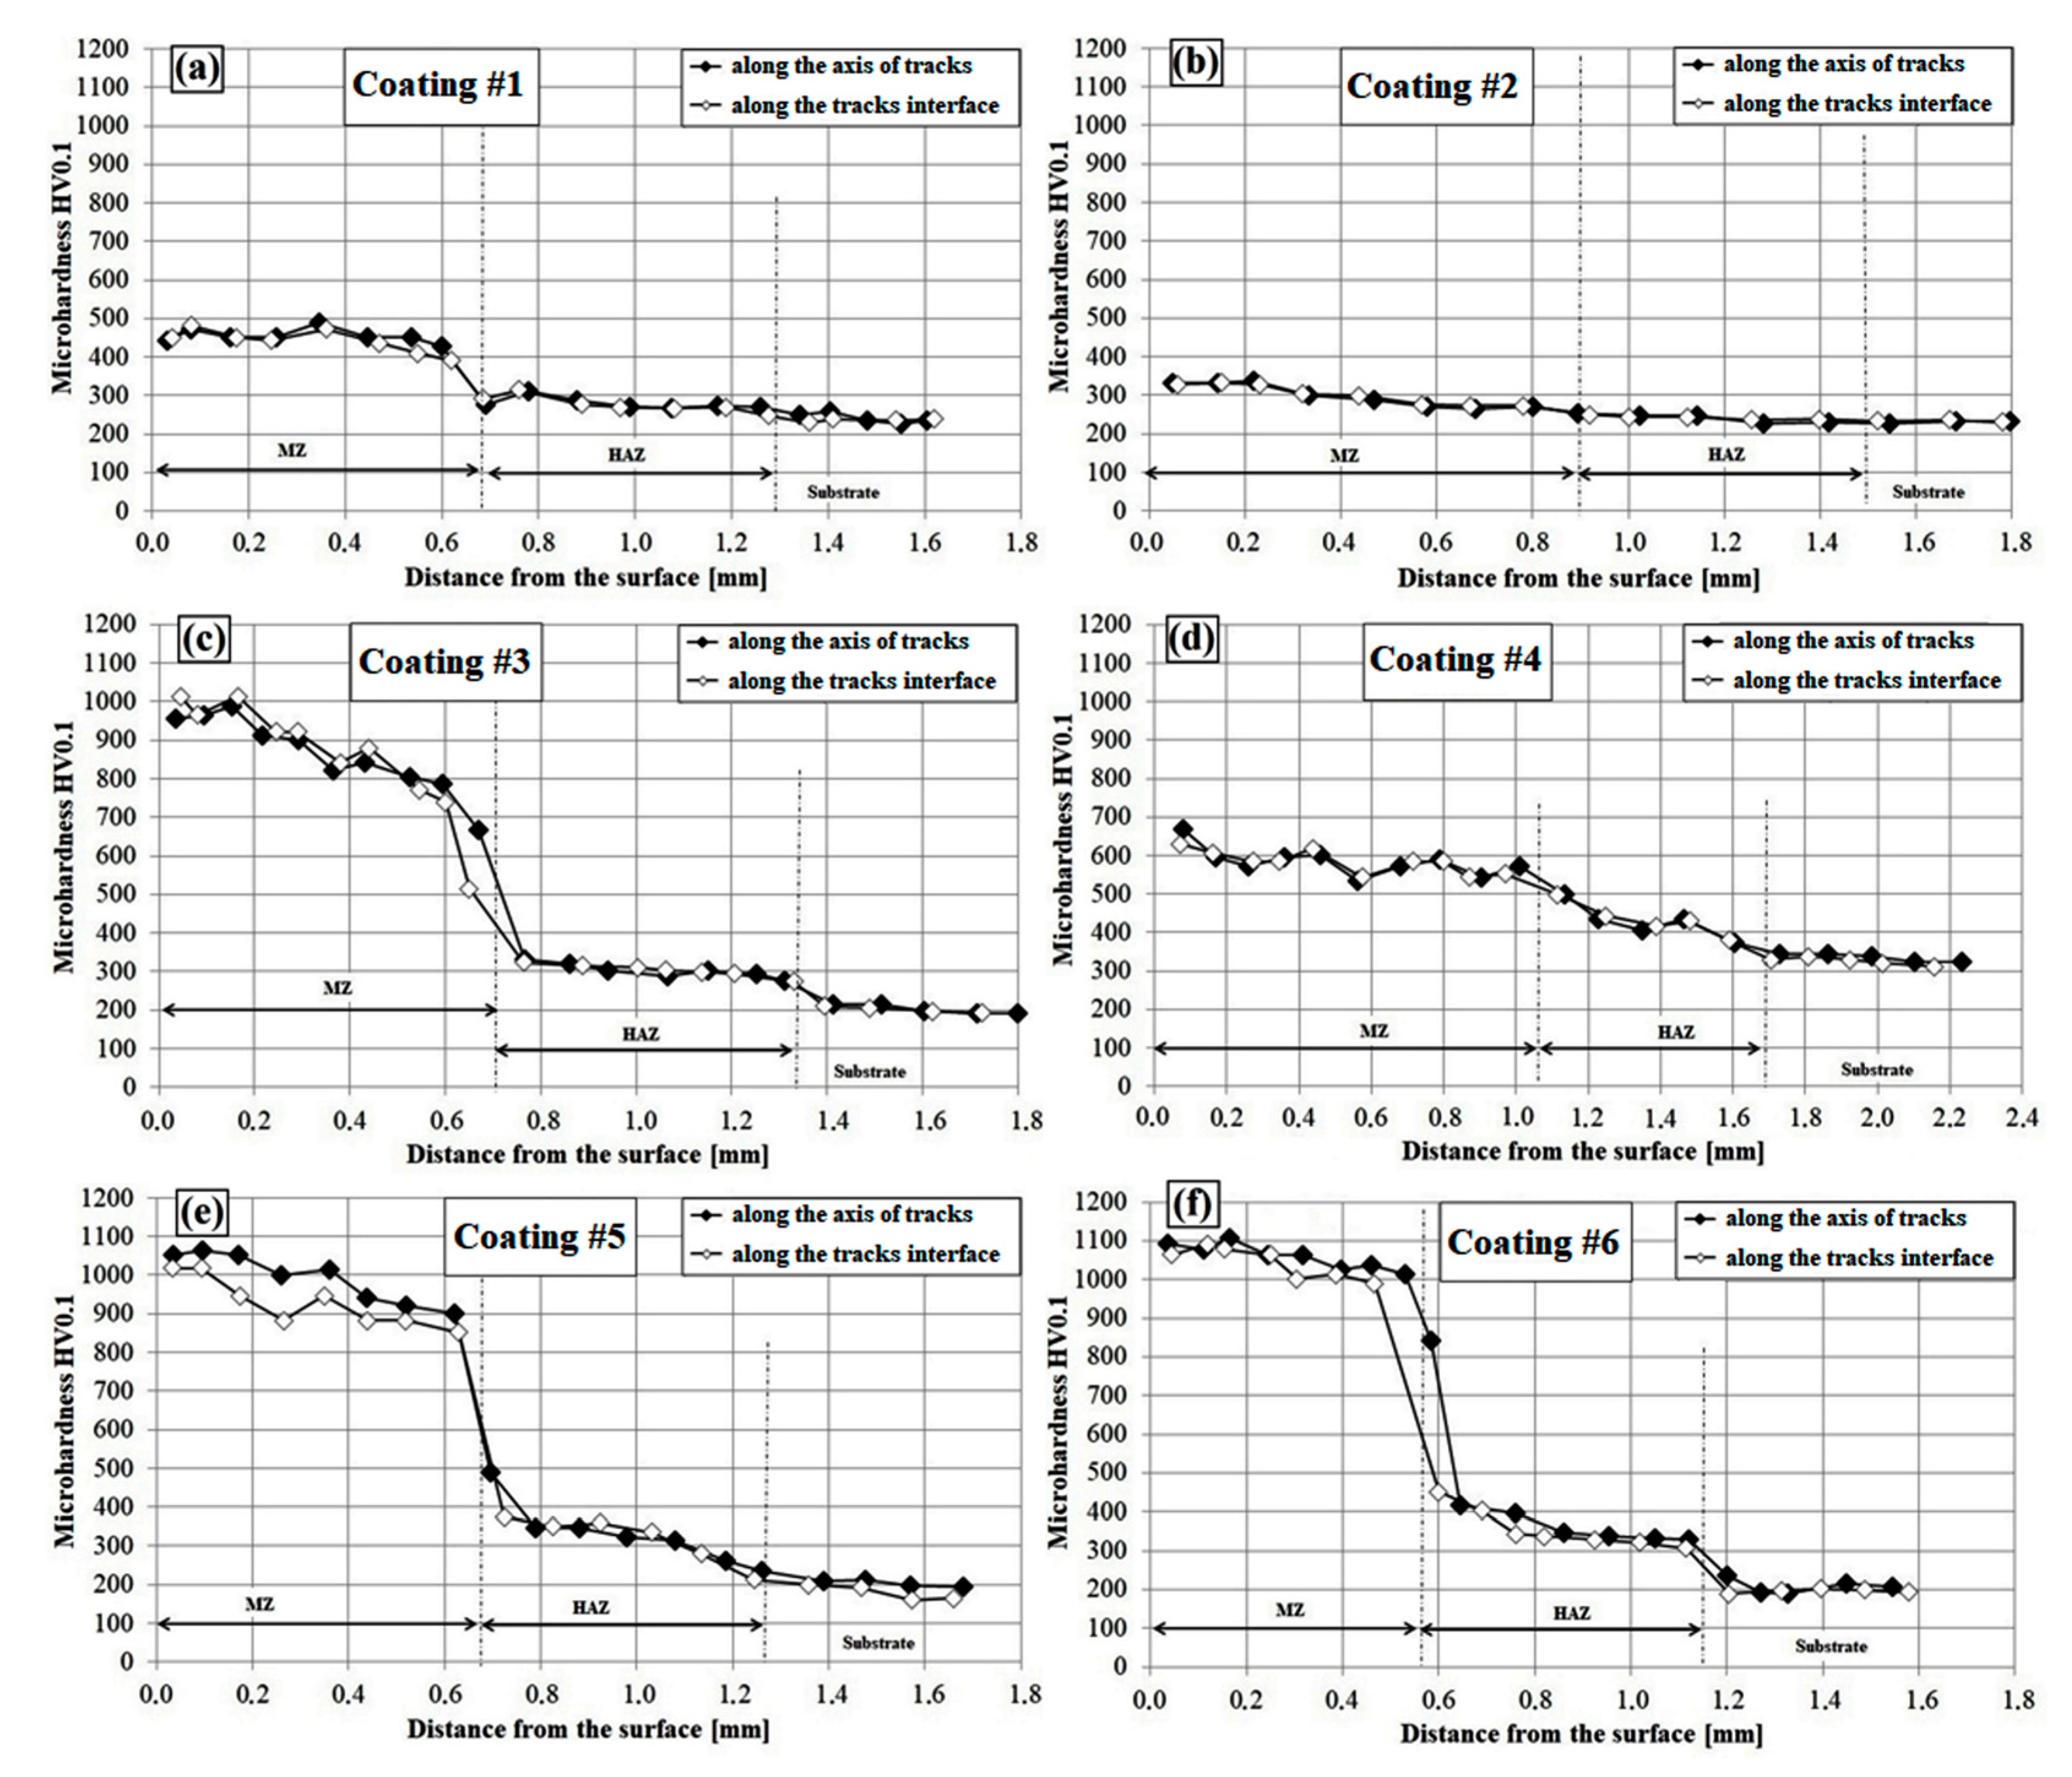
3.4. Microhardness Profiles

The results of the microhardness tests of coatings produced by laser cladding are shown in Figure 7a–f. In all figures showing microhardness profiles, the areas of remelted zone and heat affected zone are marked.
Microhardness was tested both along the laser tracks axis and on the border between each laser track. The relatively small differences between microhardness in the track axis and microhardness on the tracks border may indicate the homogeneity of the produced coatings. The coatings had similar properties over the entire width, and microhardness changes can be seen from surface to substrate in gradient form. The microhardness of the Fe–B coatings produced without hard particles is shown in Figure 7a (for 600 W) and 7b (for 800 W). The maximum microhardness of the remelted zone was about 480 and about 320 HV0.1, respectively. The increase in power density of the laser beam caused a reduction in the remelted zone’s microhardness of more than 100 HV. The heat affected zone of both coatings was similar, and was characterized by a microhardness ranging from 250 to 300 HV0.1. In the case of Fe–B–B4C–Si composite coatings, the microhardness in the remelted zone ranged from about 1100 to about 600 HV0.1. A such, the values of microhardness depended on such parameters of laser cladding as laser beam power and scanning speed, as well as the kind of produced coatings. Based on the results obtained, it was found that the thinner remelted zones resulted in higher microhardnesses (Figure 7f). This is due to a lower share of the steel substrate characterized by low microhardness in the coating produced. Thus, the thinner coatings solidified in a hypereutectic manner, while those that were thicker manifested instead a hypoeutectic microstructure. The final microhardness of the produced coatings containing boron phases resulted from the parameters of the laser beam, and also from the type of the cladded powder mixture. It can be seen that the microstructure of the coatings formed using Fe–B–B4C–Si powder was composed of eutectic with borides and silicides (hypereutectic), and this microhardness was higher than that of the Fe–B coatings. The microhardness in this case was approximately 1100 HV (Figure 7c,e,f). In the case of the Fe–B–B4C–Si composite coatings, the influence of the laser beam on microhardness was also found. Increasing the laser beam power from 600 to 800 W resulted in a reduction of the maximum hardness by over 400 HV. This is the result of a greater heat impact on the material, and thus a greater share of low carbon steel substrate in the produced coating.

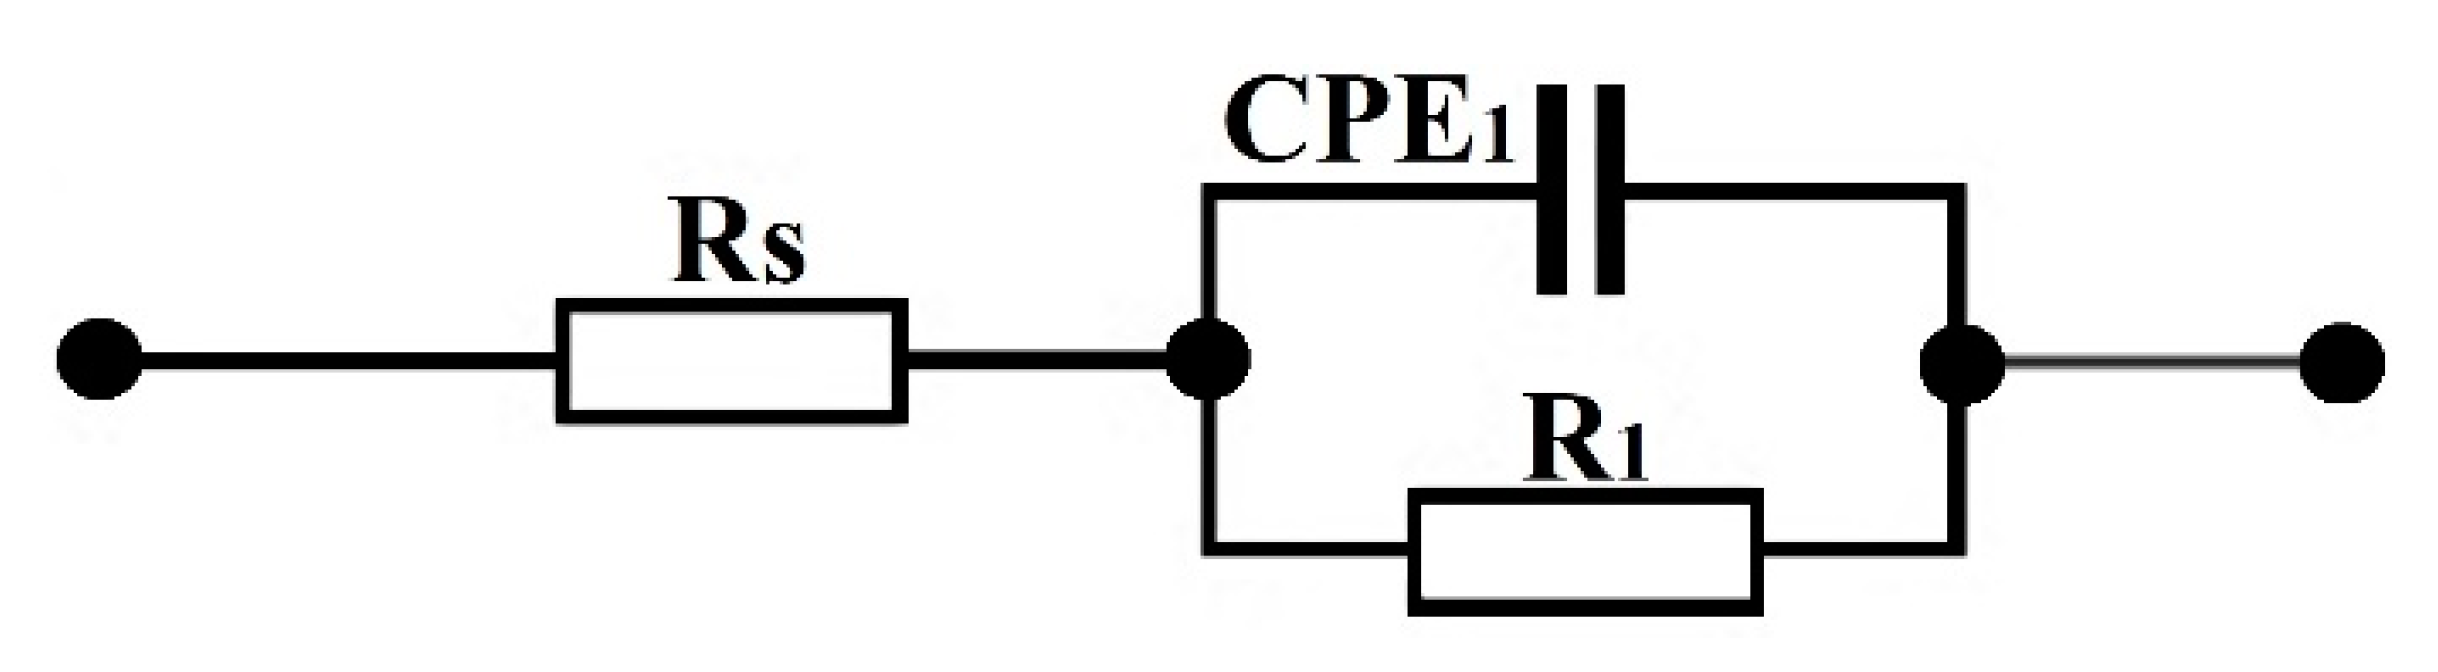
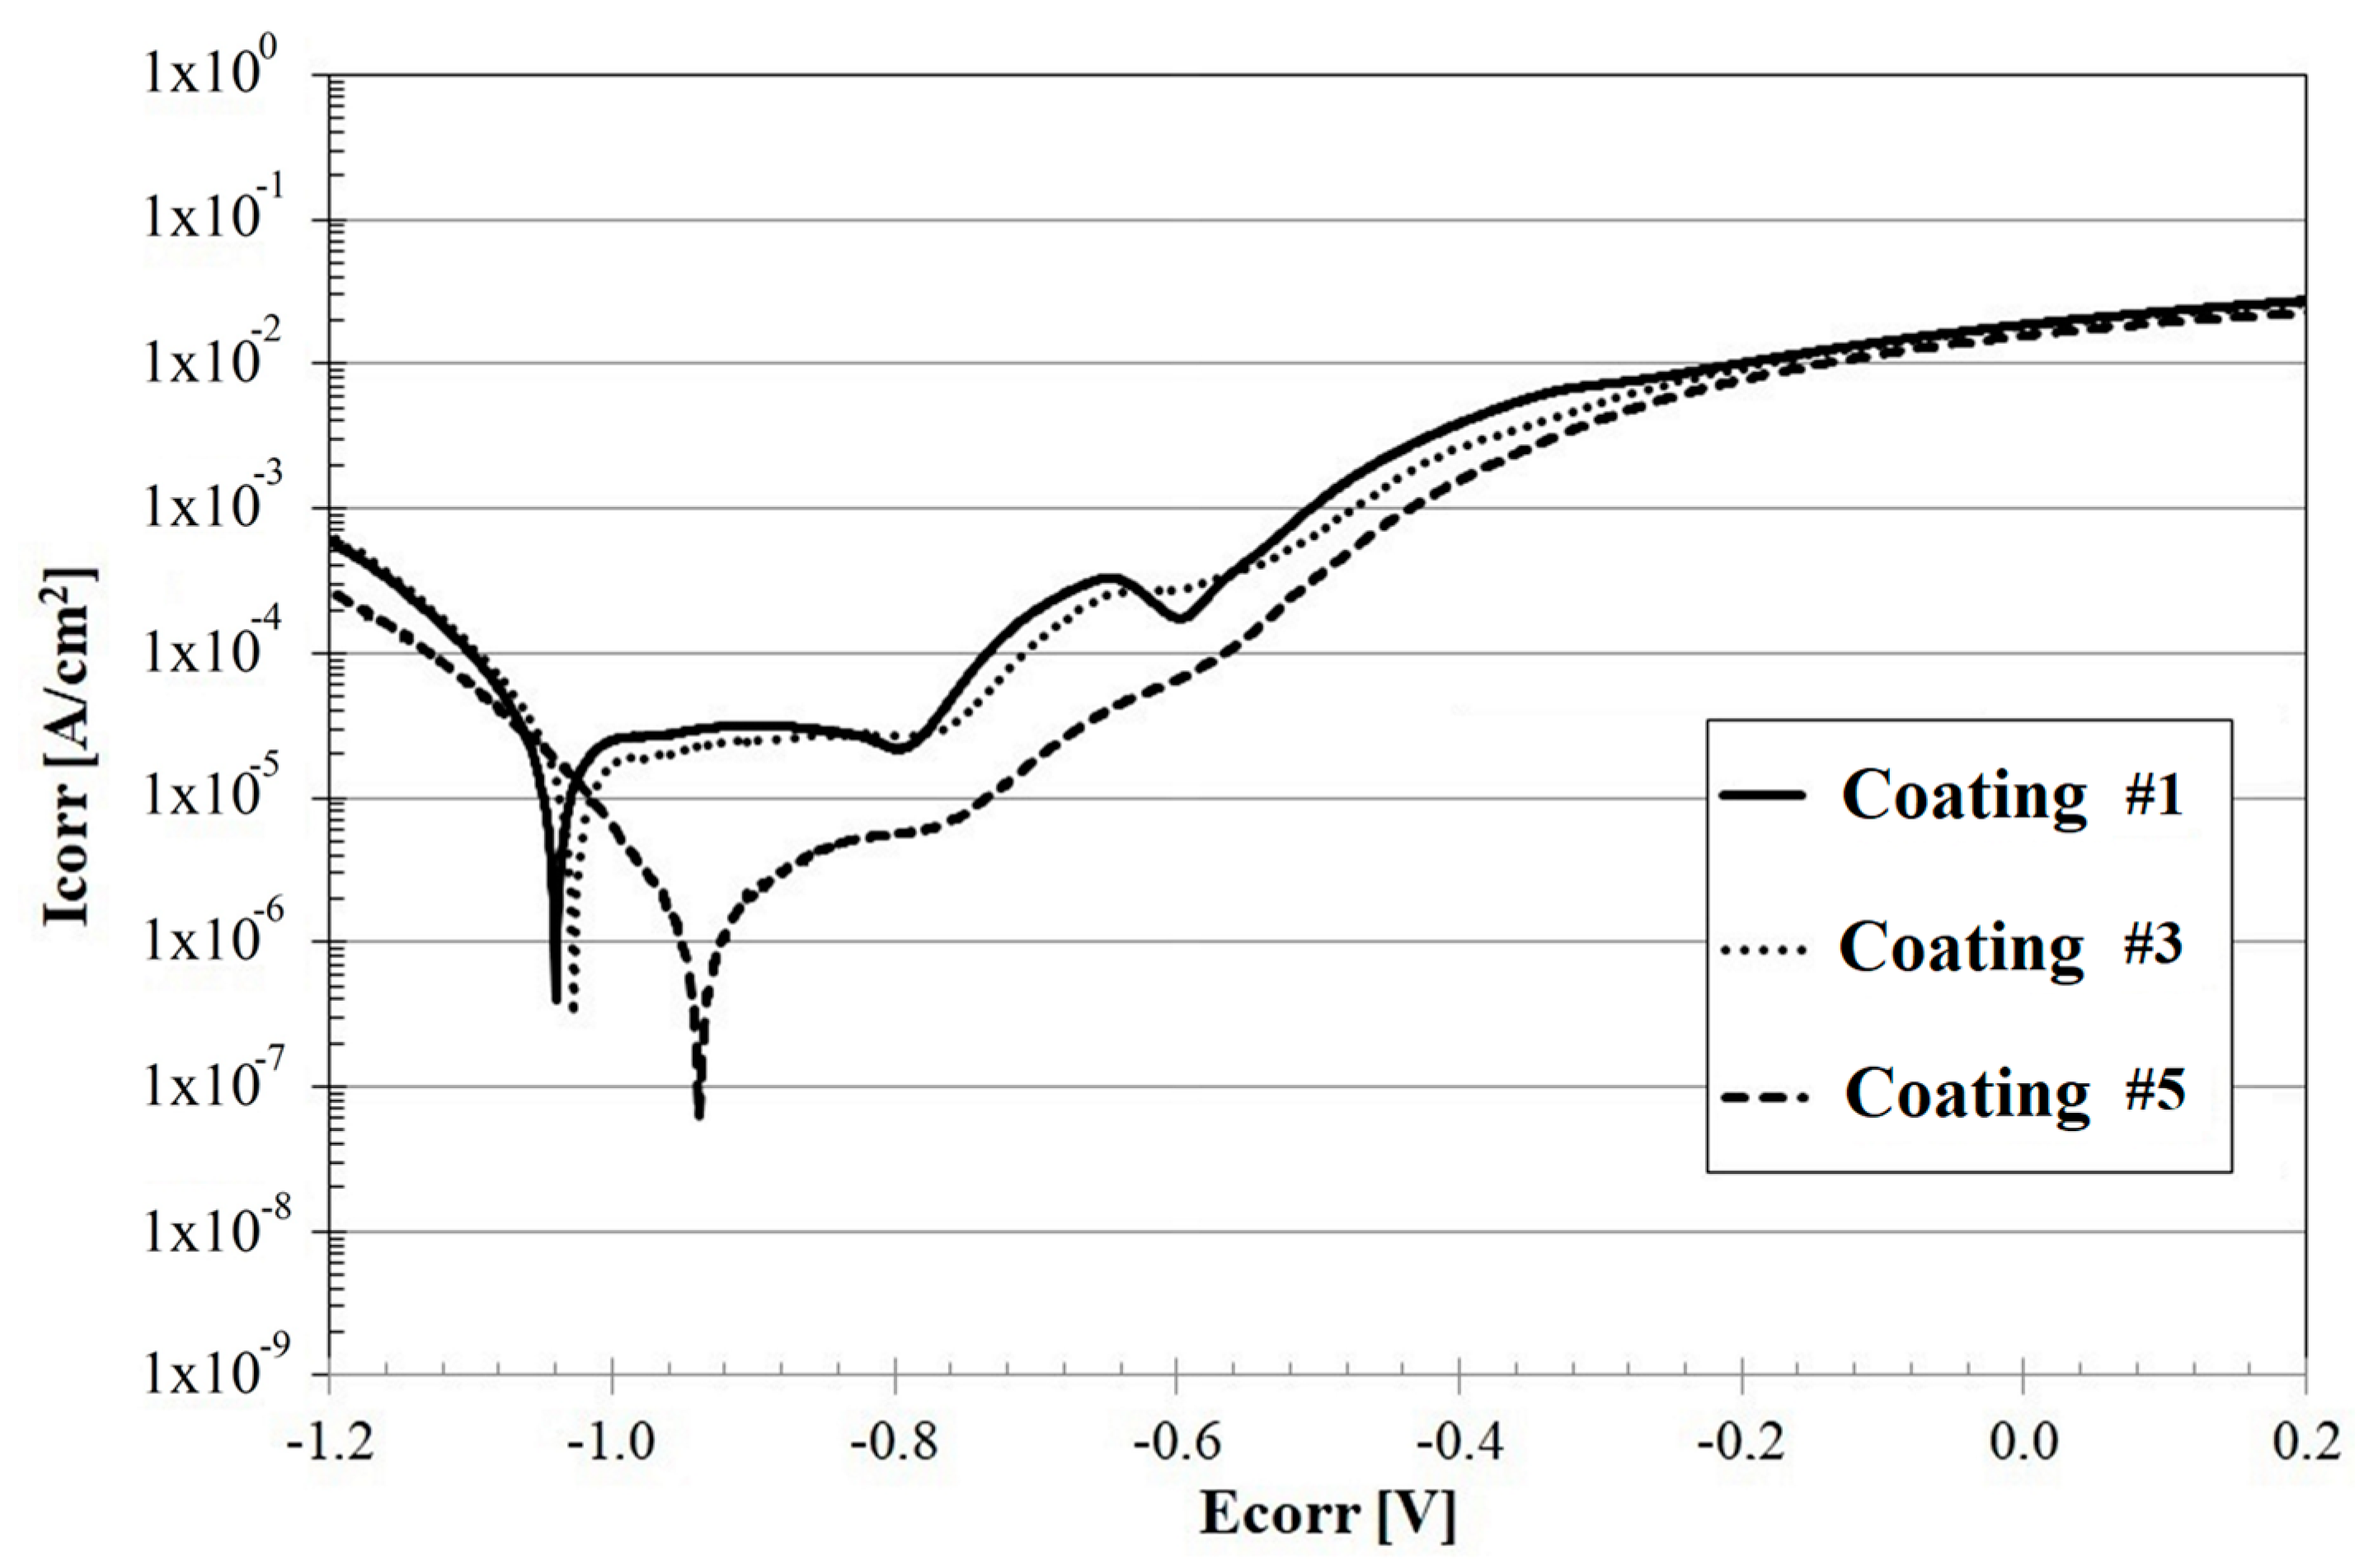
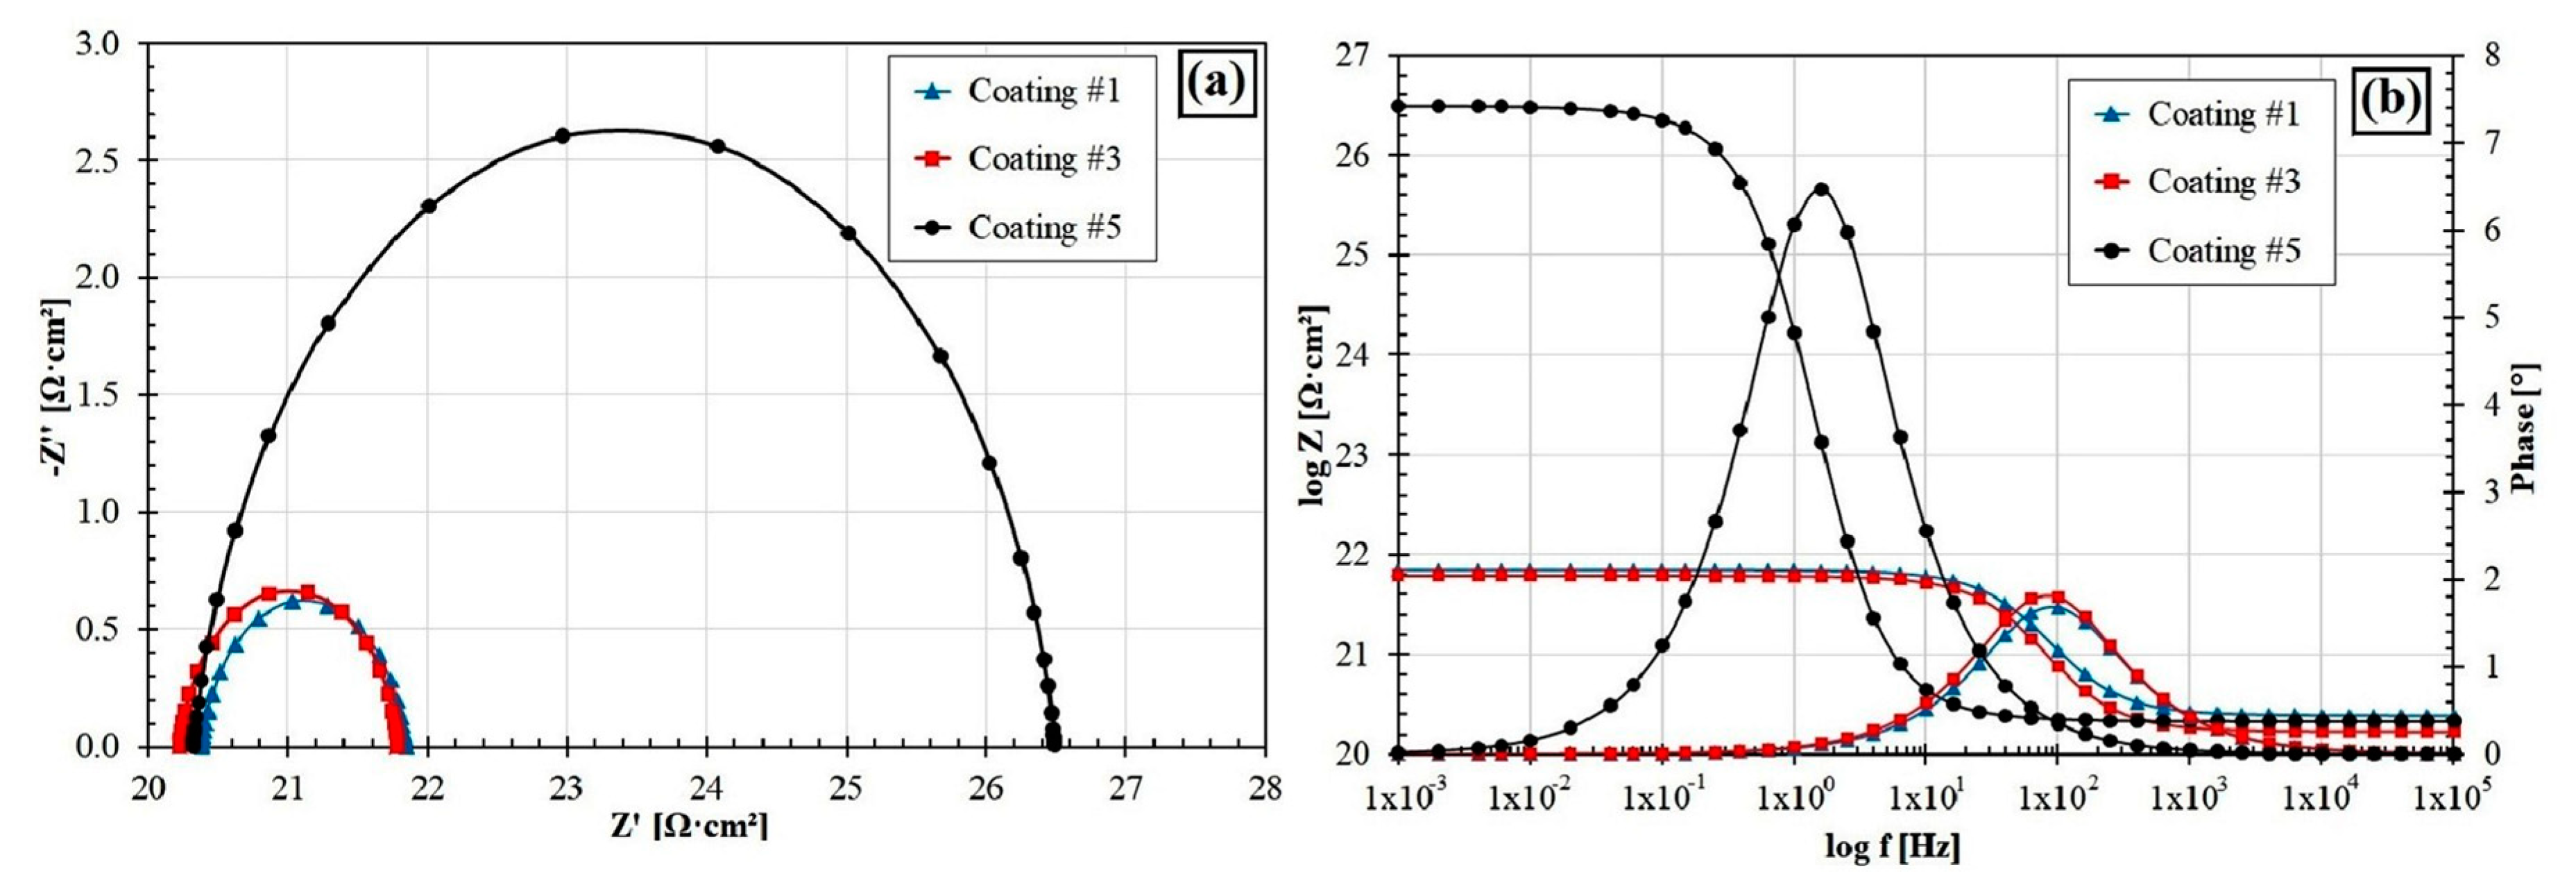
3.5. Corrosion Resistance

The results of the corrosion resistance tests are shown in Figure 8. The current density curves as a function of predetermined potential are presented. The values of the electrochemical parameters were designated based on the analysis of the curves, and are shown in Table 4.
Most frequently, corrosion occurred via electrochemical reactions at the interface between the metal and the electrolyte solution. It is known that corrosion occurs at the rate determined by an equilibrium between opposing electrochemical reactions. The composite coatings produced using a powder mixture of Fe–B–B4C–Si were characterized by good corrosion resistance in comparison to the Fe–B coating, which had the lowest corrosion potential and the highest corrosion current among the tested specimens. It is assumed that when the corrosion curves are shifted towards greater potential and lower corrosion current, then the corrosion resistance increases. In described cases, these conditions are met by a graph generated for a coating produced using a mixture containing boron carbide and silicon, as well as a scanning speed 800 mm/min. This is related, among other things, to the fact that there is a lower substrate content in the tested coating than in the coating produced using a lower scanning speed. The lowest corrosion resistance was found for coating #1. In this case, a decrease in anodic processes rate was observed. A high content of iron in coating #1 and the lower scanning speed of the laser beam resulted in a lower value of the corrosion potential. For coatings #1 and #3, the polarization curves in the cathode area showed similar values. Differences occurred in the anode area of the curves. A rapid increase in the corrosion current density value associated with dissolution of the material surface was visible. When a certain current density value was reached, a plateau was observed. This is related to the formation of corrosion products on the coating, which slow down the corrosion process by creating a barrier that limits the access of the solution to the material. The anodic polarization curve of coating #5 was shifted towards the higher potential values. In this case, a reduction in the corrosion current density by one order of magnitude was observed. This indicates the protective function of coating #5. In the initial phase, an increase in the value of the corrosion current was visible, but the process was slower than in the case of coatings #1 and #3.
Electrochemical impedance spectroscopy diagrams are presented in Figure 9. The amplitude-phase characteristic in the form of Niquist plots is semicircular (Figure 9a). The larger diameter of the semicircle indicates a higher electric current resistance at the interface between the coating and solution. This proves the highest corrosion resistance of coating #5. The smallest diameter of the semicircle indicates the lowest corrosion resistance (coating #1).
This is confirmed by the anodic polarization results. The EIS results confirm the significant influence of the coating properties on the corrosion resistance. Presentation of the impedance results in the form of a Bode plot allows us to track the changes of the impedance in a wide frequency range. The obtained Bode plots have similar shapes for all coatings tested (Figure 9b). They are symmetrical and have one maximum located in the low frequency range. The highest value of the impedance modulus was obtained for coating #5. This means that a layer of corrosion products forming on the specimen effectively protects the coating against further degradation. The lowest value of the impedance modulus was obtained for coating #1. For coating #3, the impedance modulus is close to that of coating #1. A comparison of the Bode plots of coating #5 with coatings #1 and #3 shows that the value of the total impedance modulus increased by almost one order of magnitude. It was found that this kind of coating significantly increases corrosion resistance.In addition, it should be noted that the addition of silicon also has a positive effect on corrosion resistance. For example, this element is added to steel as one of the important components that influence corrosion resistance. The surface condition and EDS mappings results of the specimens after corrosion tests are shown in Figure 10. The most visible corrosion effects are shown in Figure 10a, and this figure corresponds to the coating produced using Fe–B powder without reinforcing phases. The corrosion pits that cover large areas of tested specimen are clearly visible. The entire analyzed surface is covered with oxide products, and an increased iron content was found in the corrosive pits. The components of the NaCl solution were also taken into account in the EDS mapping. However, no increased presence of either Na or Cl was found. The silicon content in the corrosive pits was lower than in other areas. Applying reinforcement particles in the form of Si and B4C, in addition to improving the mechanical properties, improved the corrosion resistance of the tested coatings.

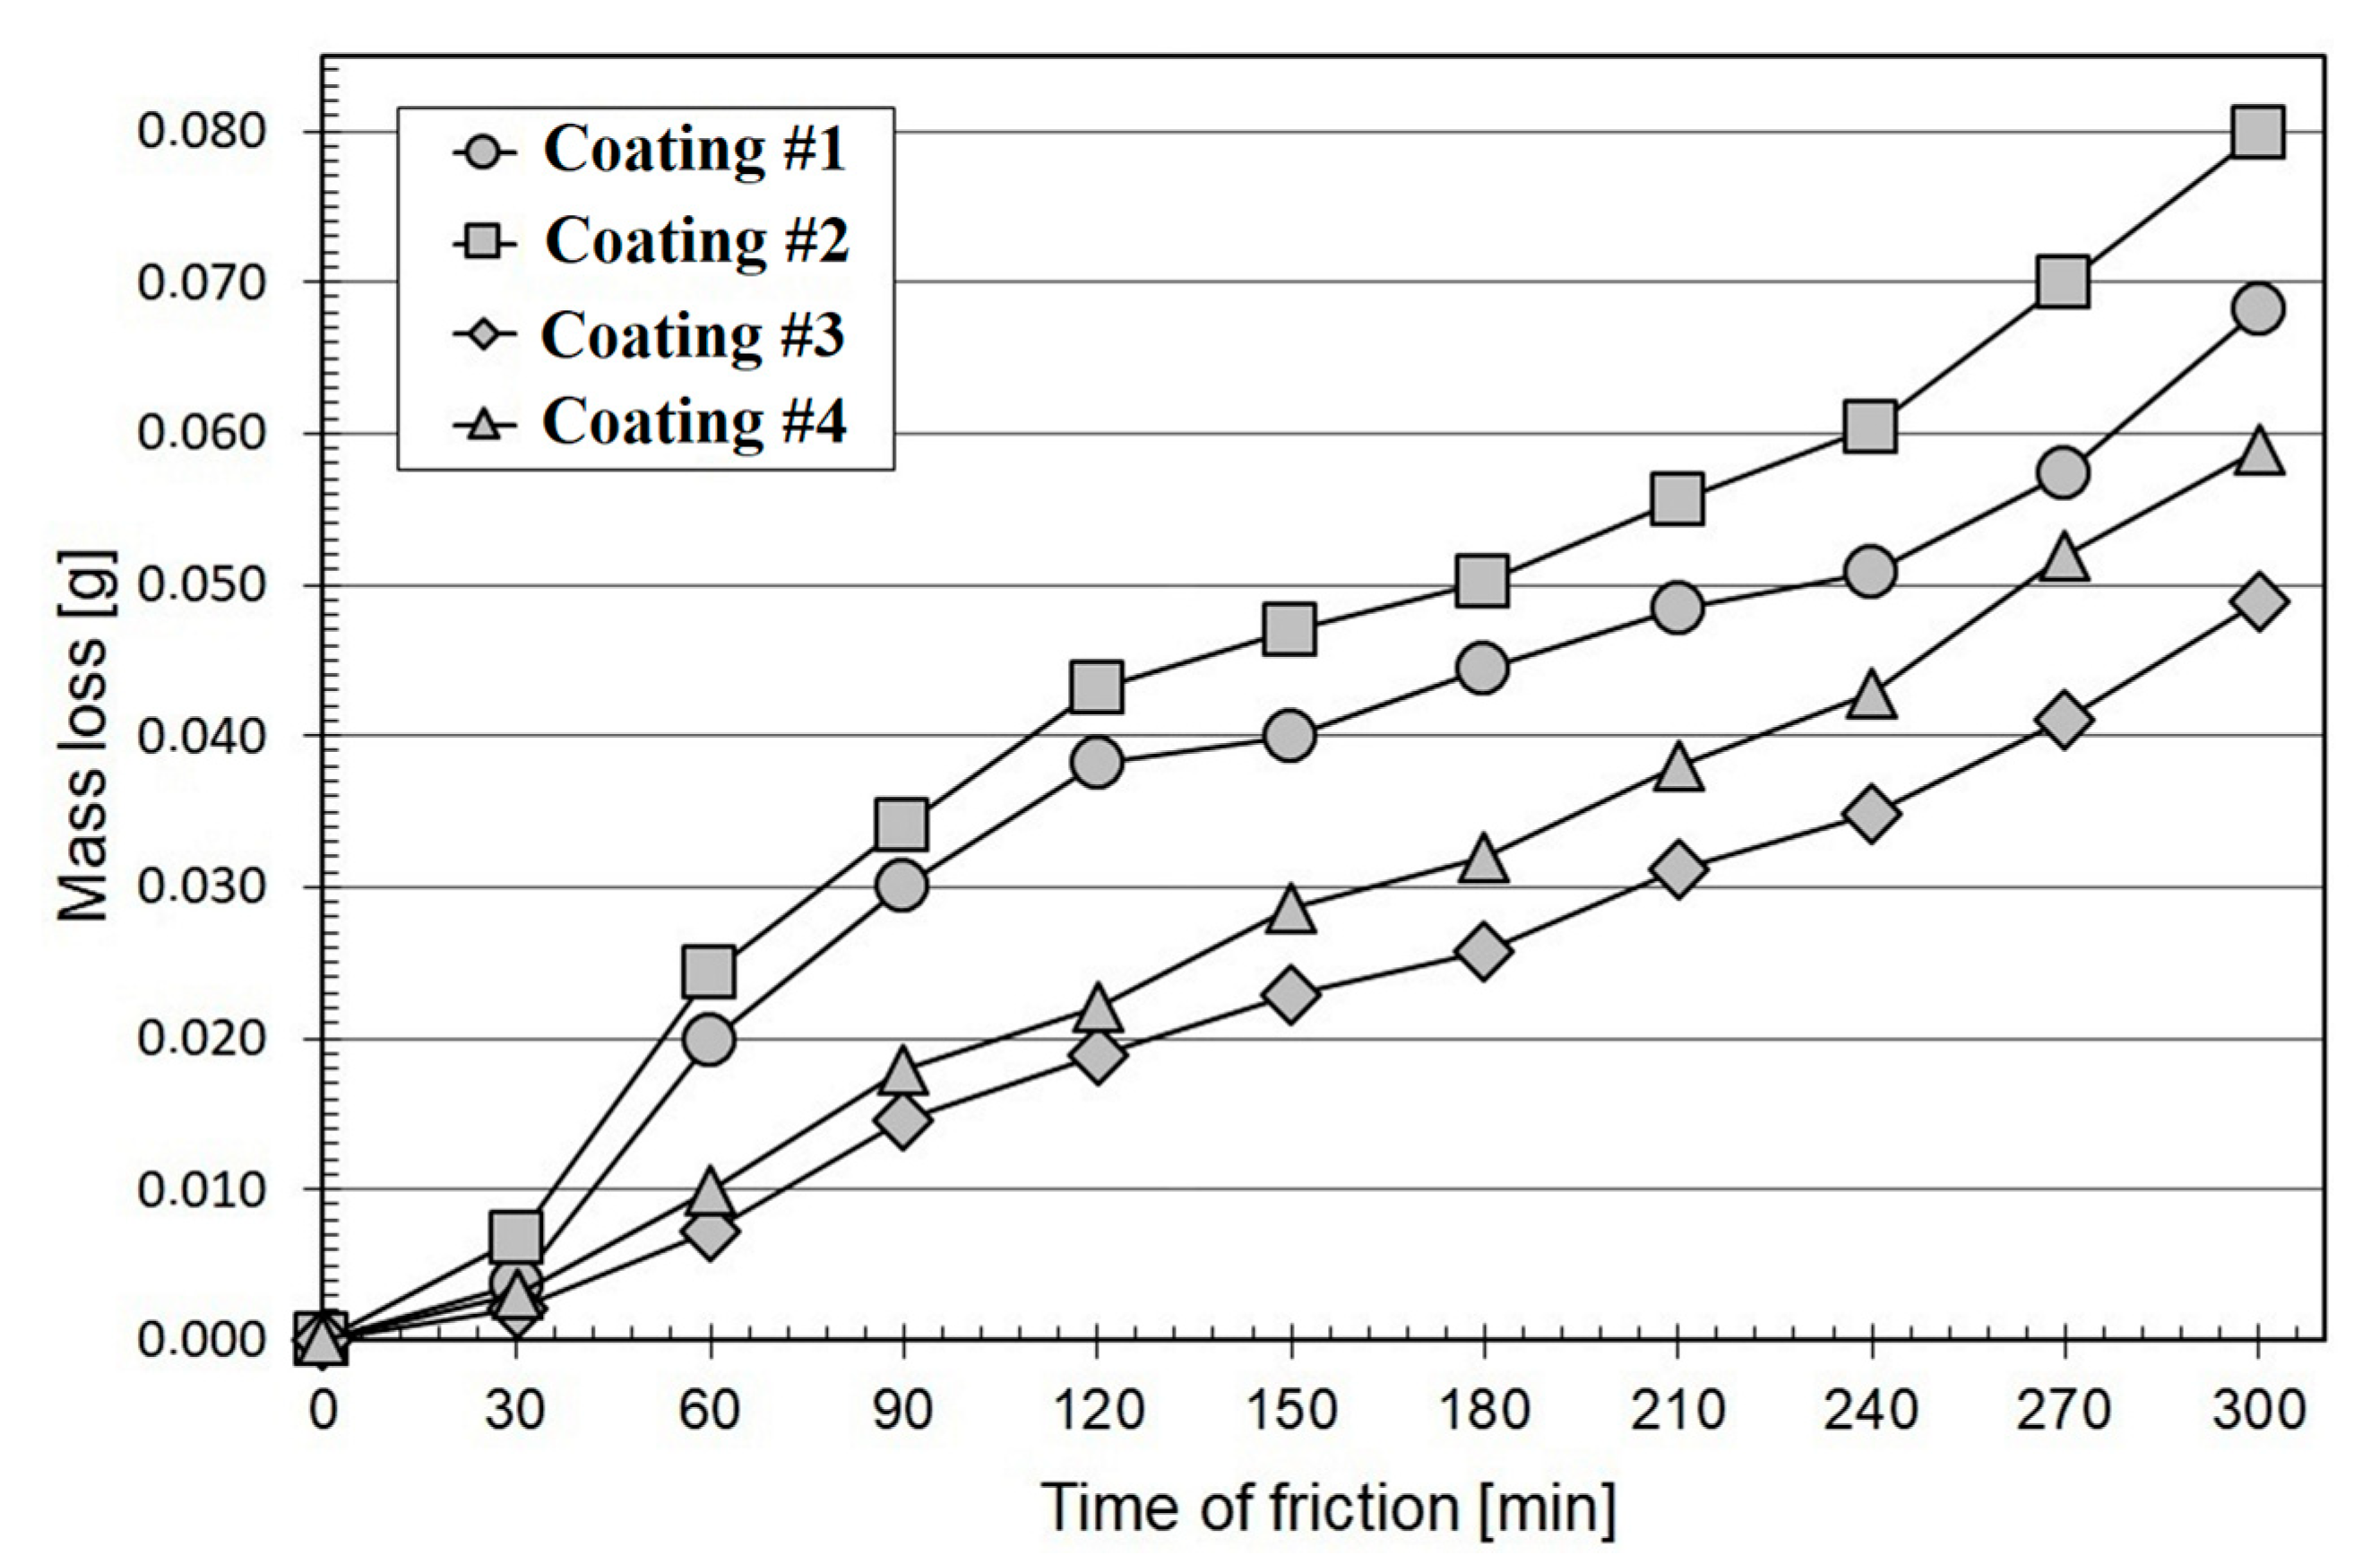
3.6. Wear Resistance

Figure 11 shows the results of wear tests of produced Fe–B coatings and Fe–B–B4C–Si composite coatings under dry friction conditions. It was found that Fe–B coatings without added hard particles were characterized by lower wear resistance. It is possible to relate wear resistance to the results of microhardness. Undoubtedly, laser beam power had a large influence on the wear tests results. Increasing this parameter caused a better mixing of the coating material with the substrate. Thus, the proportion of iron in the produced coating was increased, at the same time reducing its properties such as microhardness. Initially, for each of the specimens, a sudden mass loss was achieved. This was related to the lapping process. The coatings produced using laser processing technology usually have a greater surface roughness, which makes their initial wear stage quite large. The highest wear resistance (and thus the smallest weight loss) was achieved with the layers of powder mixture. There is a dependence: the higher the laser beam power, the greater the mass loss. The use of a lower laser beam power affects the achievement of greater wear resistance, and for such a coating after 5 h tests the mass loss is approx. 0.05 g. The use of a higher laser beam power increases the mass loss to approx. 0.06 g.
The largest mass loss occurred after laser cladding with Fe–B powder, where with the increase of the laser beam power the mass loss increased from approx. 0.07 to 0.08 g after a cycle of 5 h. This is, as already mentioned, associated with the lack of hard boron carbide particles in the coating. It was found that microcutting was the dominant destruction process in all analyzed cases. This situation occurs when, in the coating, there are phases with a significant hardness difference. Here, hard particles or microparticles act like an abrasive. The signs of wear (microcutting) observed after wear tests were generally parallel, in accordance with the direction of movement of the counter-specimen. Taking into account the weight loss as well as the microhardness results of the analyzed coatings, a proportional relationship between them can be noticed. The higher the microhardness of the coating, the smaller the mass loss observed, and thus it can be concluded that the increase of microhardness caused this increase in wear resistance. Figure 12 shows the specimen surfaces of Fe–B and Fe–B–B4C–Si coatings before wear resistance tests. Figure 13 shows the surface of a specimen after wear testing, as well as EDS mapping for individual coatings. In the case of the coatings shown in Figure 13a,b, characteristic traces of abrasive wear with grooving are visible. In the areas of the resulting grooves, an increased content of oxidation products is visible. Figure 13c,d shows the surface of the specimen after wear testing and mapping for Fe–B–B4C–Si coatings. It can be seen that the surfaces after friction of the Fe–B–B4C–Si coatings produced using 600 W and 600 mm/min parameters have better wear resistance than the specimen produced using a higher laser beam power (800 W). The obtained results should be related to the microhardness of these coatings, whereby the coating from Figure 13c had one of the highest microhardness values (approx. 1000 HV0.1).

4. Conclusions

As a result of the laser cladding process using both Fe–B and Fe–B–B4C–Si, new and interesting coatings consisting of three areas (remelted zone, heat affected zone and steel substrate) were obtained. In the remelted zone of the Fe–B–B4C–Si coatings, depending on the laser beam parameters, two areas can be distinguished. First—enriched in silicides and borides (hypereutectic area); and second—containing a lower amount of silicides and borides (hypoeutectic area). Depending on the laser beam parameters and powder mixture used, the borides Fe3B, the silicides Fe2Si and Fe5Si3 and the boron carbide B4C, as well as iron phases, were detected in the cladded zone. The laser cladding process causes the formation of a very fine microstructure, consisting of primary dendrites and eutectics (in the case of thicker remelted zones), as well as primary silicideborides surrounded by eutectics (in the case of thinner remelted zones). The addition of silicon Si and boron carbide B4C to ferro-alloy (Fe–B) improves microhardness, and increases its value from approx. 400 HV to approx. 1100 HV. The increase in laser beam power results in a decrease in microhardness, from 480 HV to 320 HV and from 1100 HV to 600 HV, respectively for the Fe–B and Fe–B–B4C–Si coatings. As a result of laser cladding using the Fe–B–B4C–Si powder mixture, an increase in the corrosion resistance of the analyzed specimens was found, especially for the scanning speed of 800 mm/min, where the proportion of introduced boron compounds was significant. In addition, increased wear resistance was found. The mass loss after 5 h of the experiment was two times lower due to the use of appropriate laser cladding process parameters and powder mixtures containing B4C and Si. Based on the conducted research, it was considered that the best laser cladding parameters were obtained by using a powder mixture of Fe–B enriched with B4C and Si particles. The most favorable properties are obtained using a laser beam power of 600 W and a scanning speed in the range of 600–800 mm/min. These parameters used may contribute to obtaining an even thickness of laser coating with a uniform microstructure enriched in boride and silicon phases. Furthermore, the obtained laser coating has a high microhardness of up to 1100 HV, with good wear resistance and corrosion resistance.

Author Contributions

Conceptualization, D.B. and A.B.; methodology, D.B. and A.B.; investigation, D.B., A.B., A.P., and P.J.; writing—original draft preparation, D.B., A.B., and P.J.; writing—review and editing, D.B., A.B., and P.J.; visualization, D.B. and A.B. All authors have read and agreed to the published version of the manuscript.

Funding

The presented research results, were funded with grants for education allocated by the Ministry of Science and Higher Education in Poland.

Conflicts of Interest

The authors declare no conflict of interest.

References

  1. Toyserkani, E.; Khajepour, A.; Corbin, S. Laser Cladding, 1st ed.; Taylor & Francis Group: London, UK, 2005. [Google Scholar]
  2. Steen, W.M.; Mazumder, J. Laser Material Processing, 4th ed.; Springer: London, UK, 2010. [Google Scholar]
  3. Farahmand, P.; Liu, S.; Zhang, Z.; Kovacevic, R. Laser cladding assisted by induction heating of Ni–WC composite enhanced by nano-WC and La2O3. Ceram. Int. 2014, 40, 15421–15438. [Google Scholar] [CrossRef]
  4. Bartkowski, D.; Młynarczak, A.; Piasecki, A.; Dudziak, B.; Gościański, M.; Bartkowska, A. Microstructure, microhardness and corrosion resistance of Stellite-6 coatings reinforced with WC particles using laser cladding. Opt. Laser Technol. 2015, 68, 191–201. [Google Scholar] [CrossRef]
  5. Smurov, I. Laser cladding and laser assisted direct manufacturing. Surf. Coat. Technol. 2008, 202, 4496–4502. [Google Scholar] [CrossRef]
  6. Paul, C.P.; Alemohammad, H.; Toyserkani, E.; Khajepour, A.; Corbin, S. Cladding of WC–12Co on low carbon steel using a pulsed Nd:YAG laser. Mater. Sci. Eng. A 2007, 464, 170–176. [Google Scholar] [CrossRef]
  7. Fomin, V.M.; Golyshev, A.A.; Malikov, A.G.; Orishich, A.M.; Filippov, A.A.; Ryashin, N.S. Optimization of laser cladding of cold spray coatings with B4C and Ni powders. In Proceedings of the AIP Conference 1909, Tomsk, Russia, 9–13 October 2017; p. 020054. [Google Scholar]
  8. Davydova, A.; Domashenkov, A.; Sova, A.; Movtchan, I.; Bertrand, P.; Desplanques, N.; Peillon, N.; Saunier, S.; Desrayaud, C.; Bucher, S.; et al. Selective laser melting of boron carbide particles coated by a cobalt-based metal layer. J. Mater. Process. Technol. 2016, 229, 361–366. [Google Scholar] [CrossRef]
  9. Saravanan, M.; Senthilkumar, P.; Channankaiah, D. Wear resistance improvement of a laser cladded B4C–NiCr on mild steel. IJIRST 2016, 2, 157–160. [Google Scholar]
  10. Guo, C.; Zhou, J.; Chen, J.; Zhao, J.; Yu, Y.; Zhou, H. High temperature wear resistance of laser cladding NiCrBSi and NiCrBSi/WC–Ni composite coating. Wear 2011, 270, 492–498. [Google Scholar] [CrossRef]
  11. Lin, W.C.; Chen, C. Characteristics of thin surface layers of cobalt-based alloys deposited by laser cladding. Surf. Coat. Technol. 2006, 200, 4557–4563. [Google Scholar] [CrossRef]
  12. Wang, Y.; Zhao, S.; Gao, W.; Zhou, C.; Liu, F.; Lin, X. Microstructure and properties of laser cladding FeCrBSi composite powder coatings with higher Cr content. J. Mater. Process. Technol. 2014, 214, 899–905. [Google Scholar] [CrossRef]
  13. Verwimp, J.; Rombouts, M.; Geerinckx, E.; Motmans, F. Applications of laser cladded WC-based wear resistant coatings. Phys. Procedia 2011, 12, 330–337. [Google Scholar] [CrossRef] [Green Version]
  14. Davis, J.R. Surface Engineering for Corrosion and Wear Resistance, 1st ed.; ASM International: Geauga County, OH, USA, 2001. [Google Scholar]
  15. Bartkowska, A.; Pertek, A. Laser production of B–Ni complex layers. Surf. Coat. Technol. 2014, 248, 23–29. [Google Scholar] [CrossRef]
  16. Bartkowska, A.; Jurči, P.; Hudáková, M.; Bartkowski, D.; Kusý, M.; Przestacki, D. The influence of the laser beam fluence on change in microstructure, microhardness and phase composition of FeB–Fe2B surface layers produced on Vanadis-6 steel. Arch. Metall. Mater. 2018, 63, 791–800. [Google Scholar]
  17. Safonov, A.N. Special features of boronizing iron and steel using a continuous-wave CO2 laser. Metal. Sci. Heat Treat. 1998, 40, 6–10. [Google Scholar] [CrossRef]
  18. Safonov, A.N. Microstructure of nickel-chromium-boron-silicon alloys deposited by laser radiation. J. Weld. Int. 1992, 4, 304–307. [Google Scholar] [CrossRef]
  19. Manna, I.; Dutta Majumdar, J.; Ramesh Chandra, B.; Nayak, S.; Dahotre, N.B. Laser surface cladding of Fe–B–C, Fe–B–Si and Fe–BC–Si–Al–C on plain carbon steel. Surf. Coat. Technol. 2006, 201, 434–440. [Google Scholar] [CrossRef]
  20. Riveiro, A.; Mejías, A.; Lusquiños, F.; del Val, J.; Coomesaña, R.; Pardo, J.; Pou, J. Laser cladding of aluminium on AISI 304 stainless steel with high-power diode lasers. Surf. Coat. Technol. 2014, 253, 214–220. [Google Scholar] [CrossRef]
  21. Bartkowski, D.; Kinal, G. Microstructure and wear resistance of Stellite-6/WC MMC coatings produced by laser cladding using Yb:YAG disk laser. Int. J. Refract. Met. Hard Mater. 2016, 58, 157–164. [Google Scholar] [CrossRef]
  22. Bartkowski, D.; Bartkowska, A.; Popławski, M.; Przestacki, D. Microstructure, microhardness, corrosion and wear resistance of B, Si and B–Si coatings produced on C45 steel using laser processing. Metals 2020, 10, 792. [Google Scholar] [CrossRef]
  23. PN-EN ISO 17475: 2010. Polish Standardization Committee Website. Available online: https://sklep.pkn.pl/pn-en-iso-17475-2010p.html (accessed on 20 August 2020).
Figure 1. Size and morphologies of powders particles: (a) Fe–B; (b) B4C; (c) Si.
Coatings 10 00809 g001
Figure 2. Scheme of: (a) producing Fe–B–B4C–Si composite coatings using laser cladding process; (b) Marangoni convection—phenomenon causing the mixing of the substrate components with the coating components.
Coatings 10 00809 g002
Figure 3. Electrochemical equivalent circuit: Rs—solution resistance between the specimen and the reference electrode, R1—charge transfer resistance, CPE1—double layer capacitance.
Coatings 10 00809 g003
Figure 4. Microstructure of Fe–B coatings: (a) laser tracks of specimen #1; (b) remelted zone of specimen #1; (c) laser tracks of specimen #2; (d) remelted zone of specimen #2 (specimen numbers in accordance with Table 2).
Coatings 10 00809 g004
Figure 5. Microstructure of Fe–B–B4C–Si coatings: (a) laser tracks of #3; (b) laser tracks of specimen #4; (c) laser tracks of specimen #5; (d) laser tracks of specimen #6; (e) remelted zone of specimen #3; (f) remelted zone of specimen #4; (g) remelted zone of specimen #5; (h) remelted zone of specimen #6 (specimens numbers in accordance with Table 2).
Coatings 10 00809 g005
Figure 6. X-ray diffraction of Fe–B and Fe–B–B4C–Si composite coatings (specimen numbers in accordance with Table 2).
Coatings 10 00809 g006
Figure 7. Microhardness profiles of C45 steel with Fe–B and Fe–B–B4C–Si composite coatings obtained by laser cladding technology using different laser parameters: (a) coating #1; (b) coating #2; (c) coating #3; (d) coating #4; (e) coating #5; (f) coating #6. (specimen numbers in accordance with Table 2).
Coatings 10 00809 g007
Figure 8. Potentiodynamic curves for Fe–B and Fe–B–B4C–Si composite coatings produced by the laser cladding method (specimen numbers in accordance with Table 2).
Coatings 10 00809 g008
Figure 9. Electrochemical Impedance Spectroscopy diagrams of produced coatings: (a) Nyquist plots, (b) Bode plots (specimen numbers in accordance with Table 2).
Coatings 10 00809 g009
Figure 10. Surface condition and EDS mappings results of produced composite coatings after corrosion tests: (a) Fe–B coating (#1 laser beam parameters); (b) Fe–B–B4C–Si coating (#3 laser beam parameters); (c) Fe–B–B4C–Si coating (#5 laser beam parameters); (specimens numbers in accordance with Table 2).
Coatings 10 00809 g010
Figure 11. Wear resistant of produced Fe–B coatings and Fe–B–B4C–Si produced using the same scanning speed of laser beam equal to 600 mm/min and different laser beam power.
Coatings 10 00809 g011
Figure 12. Surface conditions before wear resistance test: (a) Fe–B coating (#1 laser beam parameters); (b) Fe–B coating (#2 laser beam parameters); (c) Fe–B–B4C–Si coating (#3 laser beam parameters); (d) Fe–B–B4C–Si coating (#4 laser beam parameters); (specimens numbers in accordance with Table 2).
Coatings 10 00809 g012
Figure 13. Surface conditions after wear resistance tests: (a) Fe–B coating (#1 laser beam parameters); (b) Fe–B coating (#2 laser beam parameters); (c) Fe–B–B4C–Si coating (#3 laser beam parameters); (d) Fe–B–B4C–Si coating (#4 laser beam parameters); (specimens numbers in accordance with Table 2).
Coatings 10 00809 g013
Table 1. Chemical composition of C45 steel used (wt.%).
CMnSiPSCrNiMoCu
0.460.710.210.0110.0090.070.080.020.24
Table 2. Parameters of laser cladding process.
Specimen NumberType of CoatingLaser Beam Power (W)Laser Beam Scanning Speed (mm/min)Laser Beam Power Density (W/mm2)
#1Fe–B600600298.6
#2Fe–B800600398.0
#3Fe–B–B4C–Si600600298.6
#4Fe–B–B4C–Si800600398.0
#5Fe–B–B4C–Si600800298.6
#6Fe–B–B4C–Si6001000298.6
Table 3. Results of EDS point analysis of produced coatings marked in Figure 4 and Figure 5.
CoatingPlace of MeasurementFe
[±0.1 wt.%]
B
[±0.1 wt.%]
Si
[±0.1 wt.%]
C
[±0.1 wt.%]
FeB
600 W
600 mm/min
(#1)
194.80.6-4.6
295.10.5-4.4
395.30.3-4.4
494.90.4-4.7
594.11.1-4.8
696.40.0-3.6
796.00.0-4.0
897.20.5-2.2
FeB
800 W
600 mm/min
(#2)
995.60.1-4.4
1095.30.3-4.5
1195.10.5-4.4
1295.40.1-4.6
1396.80.0-3.2
1496.70.0-3.3
1596.20.0-3.8
1695.50.0-4.5
Fe–B–B4C–Si
600 W
600 mm/min
(#3)
1790.14.20.55.3
1890.14.30.55.1
1992.41.90.55.2
2092.51.70.45.5
2192.80.71.45.1
2293.70.01.25.0
2389.94.90.44.9
2489.74.80.64.9
Fe–B–B4C–Si
800 W
600 mm/min
(#4)
2592.12.80.54.6
2691.93.00.54.6
2793.21.60.54.7
2891.22.90.65.3
2994.20.00.94.9
3088.75.50.35.5
3191.10.20.78.0
3289.24.90.85.1
Fe–B–B4C–Si
600 W
800 mm/min
(#5)
3392.91.80.45.0
3489.55.10.45.0
3590.04.70.44.8
3690.64.30.44.8
3790.24.70.44.7
3895.60.11.13.2
3995.50.11.23.2
4090.14.80.44.6
Fe–B–B4C–Si
600 W
1000 mm/min
(#6)
4193.71.00.35.0
4289.64.80.35.3
4388.45.40.35.8
4490.04.80.35.0
4588.75.20.35.8
4693.00.90.75.3
4788.85.10.35.8
4893.50.50.65.4
Table 4. Corrosion current and corrosion potential of C45 steel specimens with Fe–B and Fe–B–B4C–Si composite coatings produced using laser cladding method.
Coating TypeCurrent Icorr (A·cm2)Potential Ecorr (V)
Fe–B (600 W, 600 mm/min) (#1)8.47 × 10⁻⁶−1.04 × 100
Fe–B–B4C–Si (600 W, 600 mm/min) (#3)7.56 × 10⁻⁶−1.03 × 100
Fe–B–B4C–Si (600 W, 800 mm/min) (#5)8.84 × 10⁻⁷−9.39 × 10⁻¹

