Article

Improving the Adsorption Performance of Loofah Sponge towards Methylene Blue by Coating Ca2+ Crosslinked Sodium Alginate Layers on Its Fiber Surface

School of Materials Science and Engineering, Lanzhou Jiaotong University, Lanzhou 730070, China
*
Author to whom correspondence should be addressed.
Coatings 2020, 10(9), 814; https://doi.org/10.3390/coatings10090814
Submission received: 20 July 2020 / Revised: 18 August 2020 / Accepted: 20 August 2020 / Published: 24 August 2020

Abstract

:
In this study, natural polymer sodium alginate (SA) was covered with high active carboxyl groups on the loofah sponge (LS) fiber surface to improve the adsorption ability of LS. The SA was covered on the LS fiber surface (LS@SA) through simple soaking in SA solution and then in situ hardening in Ca2+ solution. The influence of SA consistency on the SA loading ratio was estimated. The obtained LS@SA adsorbents were employed to absorb methylene blue (MB) from the water. The effects of various experimental parameters on the adsorption capacity of the LS@SA adsorbents were studied using a batch adsorption technique. Results indicated that the SA was successfully covered on the LS fiber surface and the SA loading rate increased with increasing SA concentration. The SA layer covering the LS fiber surface provided the LS@SA adsorbents with higher adsorption capacity towards MB than the original LS due to the high density of carboxyl groups on the SA molecular chain. In the adsorption process, the LS@SA adsorbents were pH dependent. The results also indicate that the LS@SA adsorbents have better reusability.

1. Introduction

An increase in the release of various dyes in the environment has drawn widespread concern because of the development of the printing and dyeing industry [1,2]. Most of the dyes are harmful to living things [3]. As one of the most common dyes, cationic methylene blue (MB) has been used in many fields, such as the dye industry, medicine, pharmaceutics and analytical chemistry [4,5]. Therefore, the removal of MB from wastewater via simple methods is attracting increasing research interest [6,7,8]. The removal of MB from wastewater could be achieved through various methods [9]. Amongst them, adsorption is the most promising method due to some of its advantages, such as simplicity in design and operation, low cost and environmental friendliness [10,11]. Biomass adsorbents, such as wheat shells, cashew nut shells, coconut husk, rice husk, tobacco dust and palm fruit fiber, are currently employed to eliminate MB from aqueous solutions [12,13,14,15]. However, these biomass adsorbents often have low adsorption capacities and rates [16]. Therefore, considerable demand exists to develop biomass adsorbent materials with rapid adsorption rates, high recycling rates and high adsorption capacity.
Loofah sponge (LS), the fruit of Luffacy lindrica, mainly consists of cellulose, lignin and a small amount of hemicellulose. It is a physically strong, rigid and highly porous matrix with an interconnected netting-like 3D structure [17,18]. It could be applied as a biodegradable material in some fields [19,20,21]. Researchers have used LS as an adsorbent to remove contaminants from wastewater. For instance, Tang et al. [22] employed loofah fiber as an adsorbent to remove Cu(II) from wastewater. The adsorption of loofah fibers towards Cu(II) is dependent on pH, and the Langmuir isotherm model could fit it better than the Freundlich isotherm model. Demir et al. [23] used loofah fiber to remove MB dye from wastewater, and the results showed an MB adsorption capacity of 49 mg/g. However, due to the lack of high active groups, the adsorption capacity of pure LS towards contaminants is relatively low, which limits its practical application.
Several methods have been recently developed to modify LS and improve its adsorption capacity. For instance, Wang et al. [24] grafted poly (N-hydroxymethyl acrylamide) to loofah fibers as adsorbents for the removal of Cd2+ and acid blue 25. The functionalized loofah fibers exhibit high capacity and qualify for practical application. Liu et al. [25] also grafted acrylic acid to loofah fiber. The enhanced adsorption of the obtained composite is highly effective in the removal of Cu(II), Ni(II) and Ce(III) from wastewater. However, this graft method has some disadvantages, such as environmental unfriendliness, high cost and a complex preparation process. Therefore, finding a low-cost, environmentally friendly and simple modification method is important for expanding the application of LS-based adsorbents.
Surface coating effectively improves the adsorption capacity of adsorbents with low adsorption capacity. Huang et al. [26] used polyethyleneimine and tannin coats on SiO2 microspheres and applied the composite to remove Cu2+ from wastewater, and the composites showed a 2.4-fold increase in adsorption capacity. Jawad et al. [27] immobilized a crosslinked chitosan-epichlorohydrin thin layer onto glass plate via a direct casting technique for the removal of reactive orange 16. The cationic groups on the chitosan molecular chain endowed the composites with the ability to interact with anionic dye orange 16.
Sodium alginate (SA), a type of natural polysaccharide, is used to remove cationic dyes from the aqueous solution owing to the high content of carboxyl groups in its molecule chain as chelating sites [28,29,30]. Previous works have demonstrated that SA has a high adsorption capacity for MB [31,32]. SA could be simply dissolved in water and cured by calcium ion crosslinking [33,34]. As natural polymer hydrophilic materials, LS and SA possess good interface binding ability; previous research has confirmed that there is strong hydrogen bonding between SA and cellulose [35,36]. On the other hand, SA consists of β-d-mannuronic acid (M) and α-l-guluronic acid (G) [33]. Ca2+ can interact ionically with G blocks of the SA chain to form the 3D network which is called the “Eggbox” model [33,34]. The crosslinking and hardening process of calcium ions can prevent the dissolution of SA in water, which can increase its practical application in wastewater treatment [34]. Thus, SA may be an ideal modified material for improving the dye adsorption properties of LS-based materials.
In this work, the adsorption ability of LS was improved by covering the SA with a highly active carboxyl group on the LS fiber surface. The SA was immobilized on the LS fiber surface via simple soaking in SA solution and then in situ hardening in Ca2+ solution. The obtained LS-SA composite (LS@SA) adsorbents were applied to remove MB from the water. The effects of various parameters, such as contact time, pH of the solution and MB concentration, affecting the adsorption capacity were studied.

2. Materials and Methods

2.1. Materials

SA powder was obtained from Sinopharm Chemical Reagent Co., Ltd. (Shanghai, China). The molar weight is around 120,000 g/mol. The ratio M/G is 65/35. LS was purchased from Cixi Nanyuan Loofah Co., Ltd. (Cixi, China). MB, calcium chloride (CaCl2) and hydrochloric acid (HCl) were commercially available.

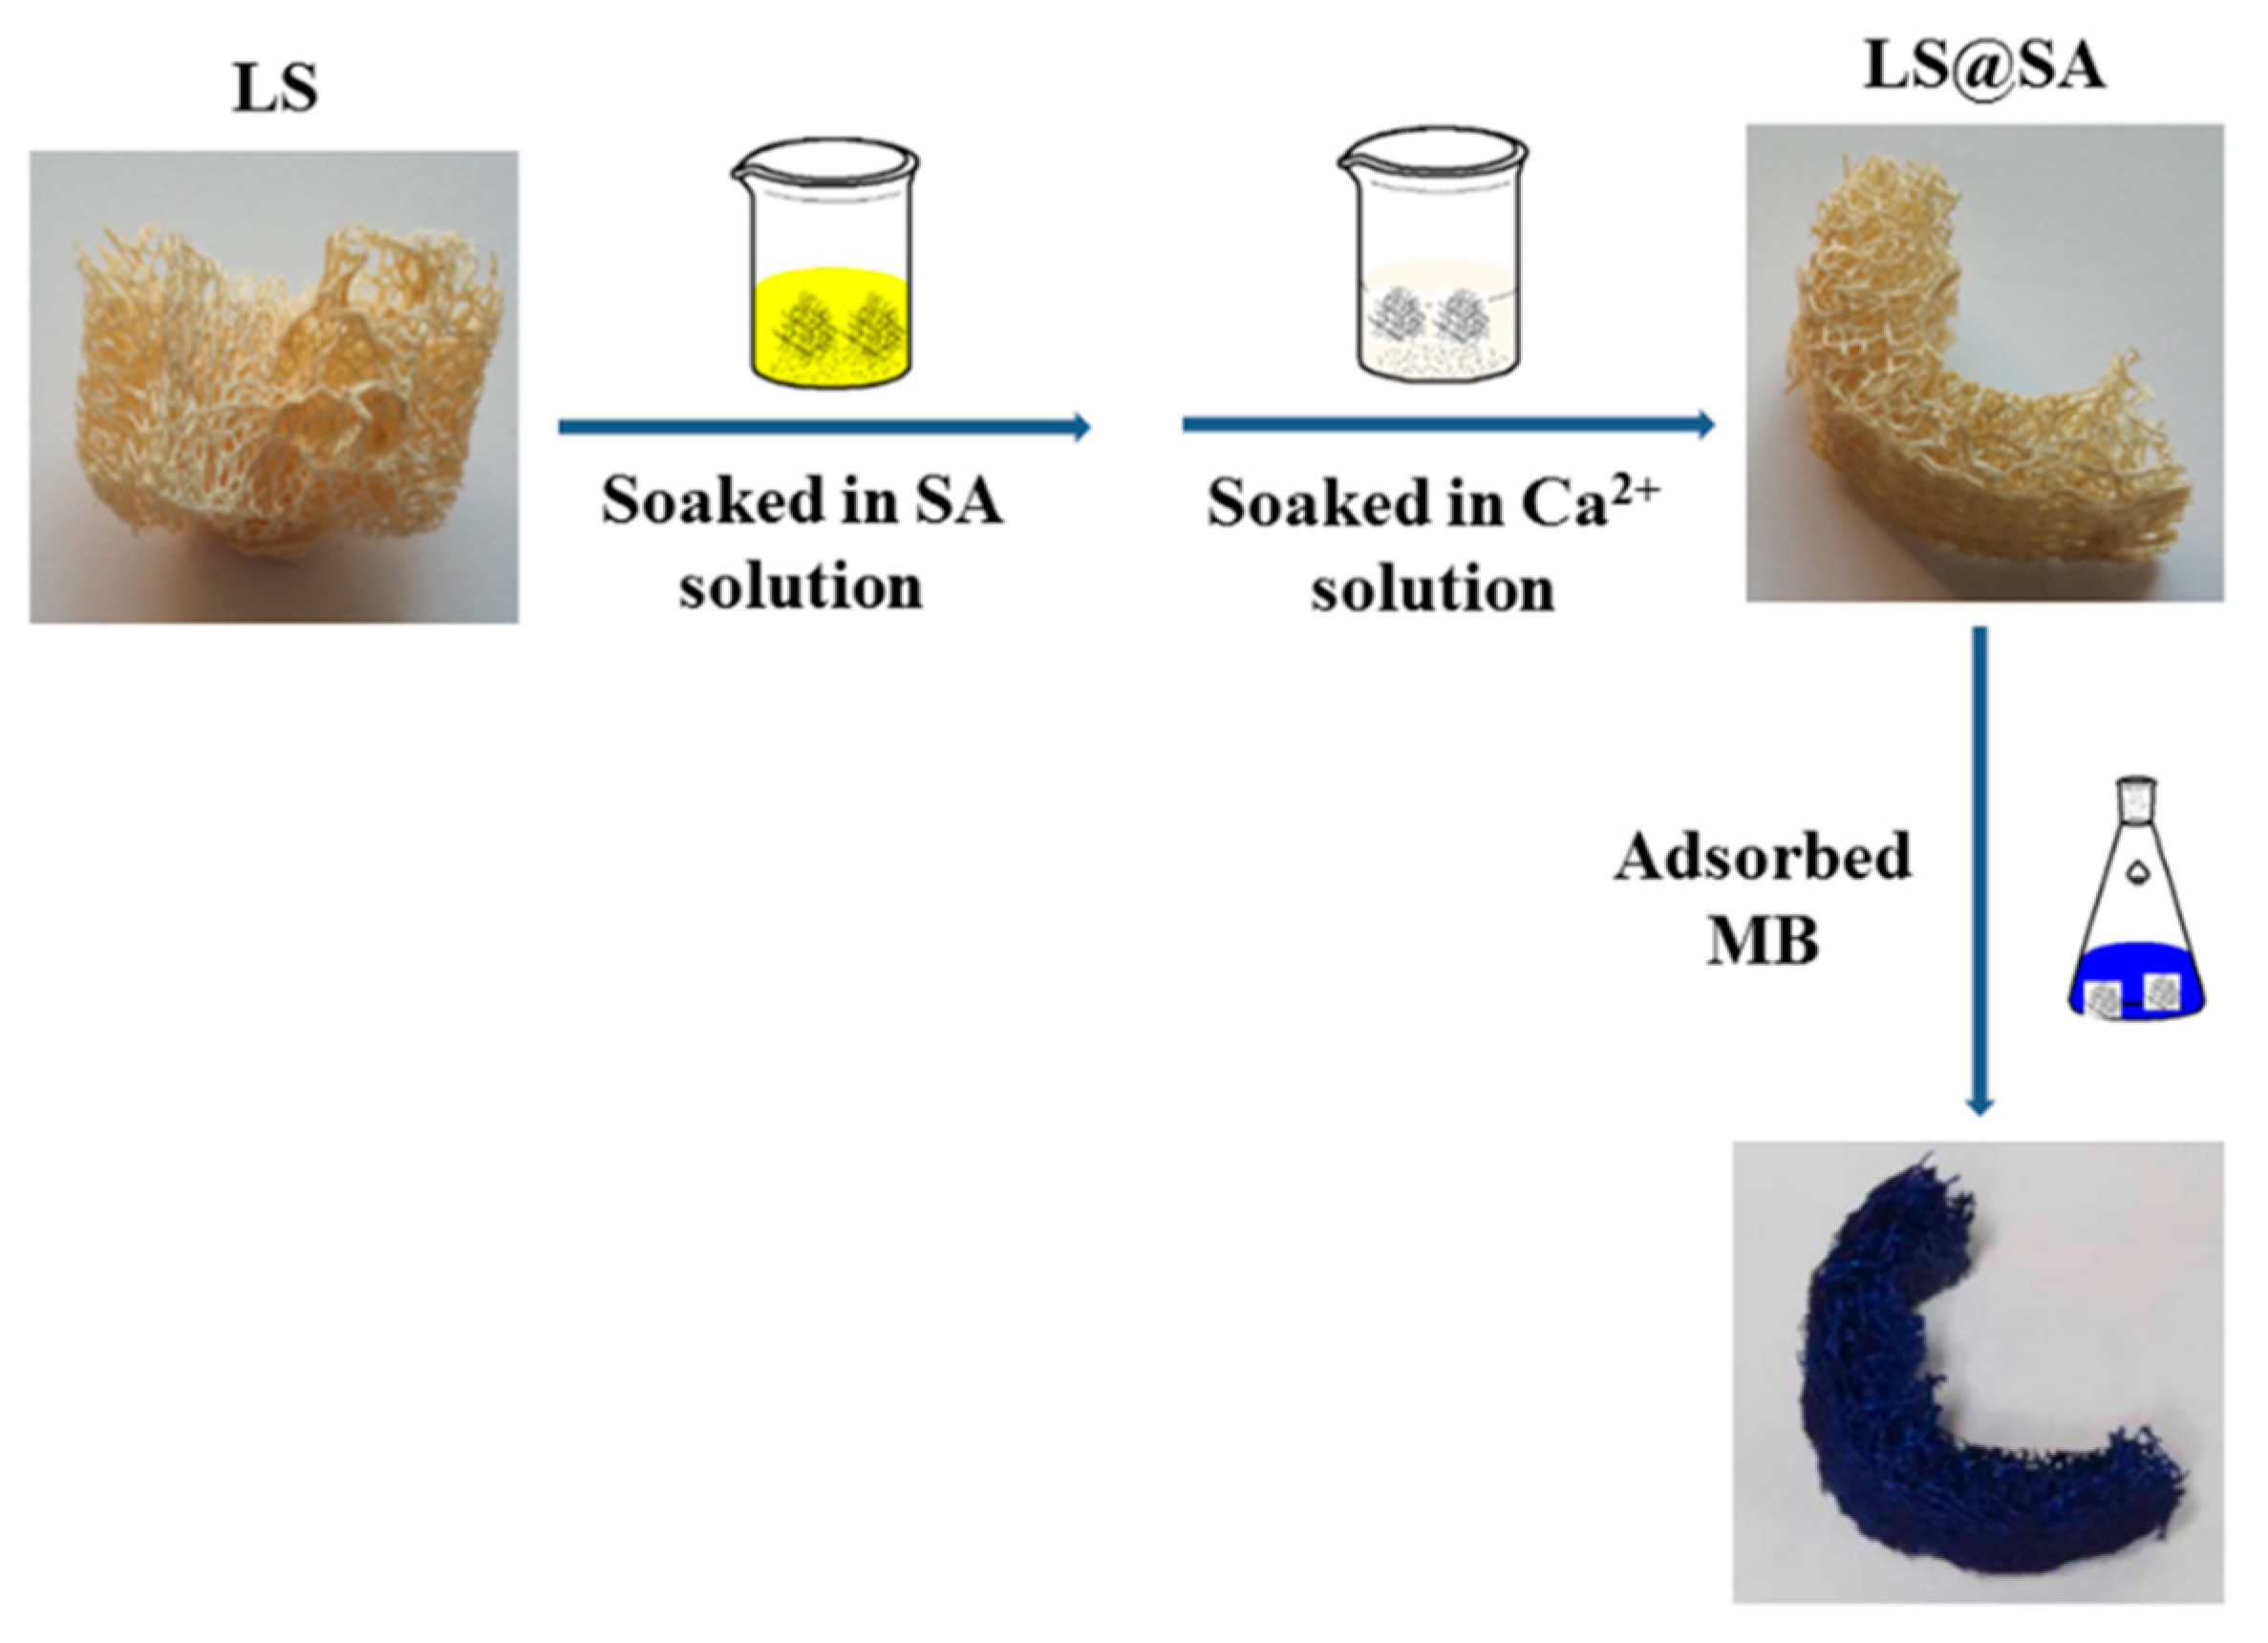
2.2. Preparation of LS@SA Adsorbents

SA solutions with various concentrations (0.5%, 1.0%, 1.5% and 2.0%) were obtained through dissolving SA in distilled water under mechanical stirring for 24 h. A 5% CaCl2 solution was obtained through dissolving CaCl2 in distilled water. Commercially available LS was cut with scissors to cuboids of 0.5 cm × 1 cm × 2 cm, which were rinsed with distilled water for 24 h. After this, 1.0 g drying LS cuboids were dipped in 200 mL of four types of SA solution separately for 24 h. After this, LS cuboids were taken from the SA solutions and suspended on a rope for 12 h to remove the excess SA solution. The obtained SA covered LS cuboids were immersed in CaCl2 solution to crosslink SA for 12 h. After being washed with distilled water, the Ca2+ crosslinked, SA covered LS cuboids were dried at 70 °C to acquire LS@SA adsorbents. The obtained LS@SA adsorbents handled with different SA concentrations (0.5%, 1.0%, 1.5% and 2.0%) were denoted as [email protected], [email protected], [email protected] and [email protected], respectively. The neat LS was denoted as LS@SA-0. The weight of LS before and after SA load was determined, and then the loading rate of four types of LS@SA composites was measured by the weight method. Averages of three measurements of each sample were reported in this study.

2.3. Characterization

The infrared spectra of selected samples were measured by a Fourier transform infrared spectroscopy (FT-IR) spectrophotometer (Thermo Nicolet, iS10, Thermo Fisher, Waltham, MA, USA) under the attenuated total reflectance (ATR) model at 4000–500 cm−1. The morphologies of selected LS@SA adsorbents were studied by field emission scanning electron microscopy (FE-SEM, JEOL JSM-6701F, Japan Electron Optics Limited, Tokyo, Japan).

2.4. MB Sorption Studies

Adsorption experiments were determined by batch process. The LS@SA adsorbent (0.05 g) was mixed with MB solution (25 mL), shaking in a thermostatic shaker bath (THZ-98A) with 200 rpm at 30 °C, and other conditions are given in the figure caption. The concentrations of MB solution were evaluated by UV–Vis spectra (N4, INESA Group Co., Ltd., Shanghai, China) at 662 nm. The influence of pH on MB adsorption was determined by adjusting solutions of MB (500 mg/L) to different pH values (2.0–10.0) by a pH meter. The adsorption kinetic experiments were conducted by investigating adsorption capacities for MB from MB solution (500 mg/L) at scheduled time intervals. For determining the adsorption isotherms, LS@SA adsorbents were added with various initial concentrations of MB solutions (50–2500 mg/L). The adsorption capacity (q) of the LS@SA adsorbents for MB was determined by the following equation:
q = [V (C0C)]/m
where C0 is the initial concentration of MB solution. C is the MB concentration after adsorbing process. V is the volume of MB solution (25 mL in this study) and m is the mass of the LS@SA adsorbents (0.05 g in this study).

2.5. Evaluation of Reusability and Degradation of [email protected]

To study the reusability of the adsorbent, MB-loaded neat LS and [email protected] sample was mixed with 0.10 mol·L−1 HCl solution (25 mL) with stirring for 1 h. The desorbed samples were collected and washed several times to remove the HCl. After drying, the desorbed samples were used to adsorb the MB again. These consecutive adsorption–desorption processes were conducted 7 times.
To evaluate the degradation rate of the [email protected], the samples were weighed (M0) first and mixed with 0.10 mol·L−1 HCl solution (25 mL) with stirring for 1 h. Then, the degraded [email protected] samples were washed several times. After drying, the obtained samples were weighed again (Mx). The consecutive degradation–drying process was conducted 7 times. The degradation rates of corresponding degradation times were evaluated by the following equation:
Degradation rate (%) = [M0Mx)]/M0 × 100

3. Results

3.1. Preparation Process of LS@SA
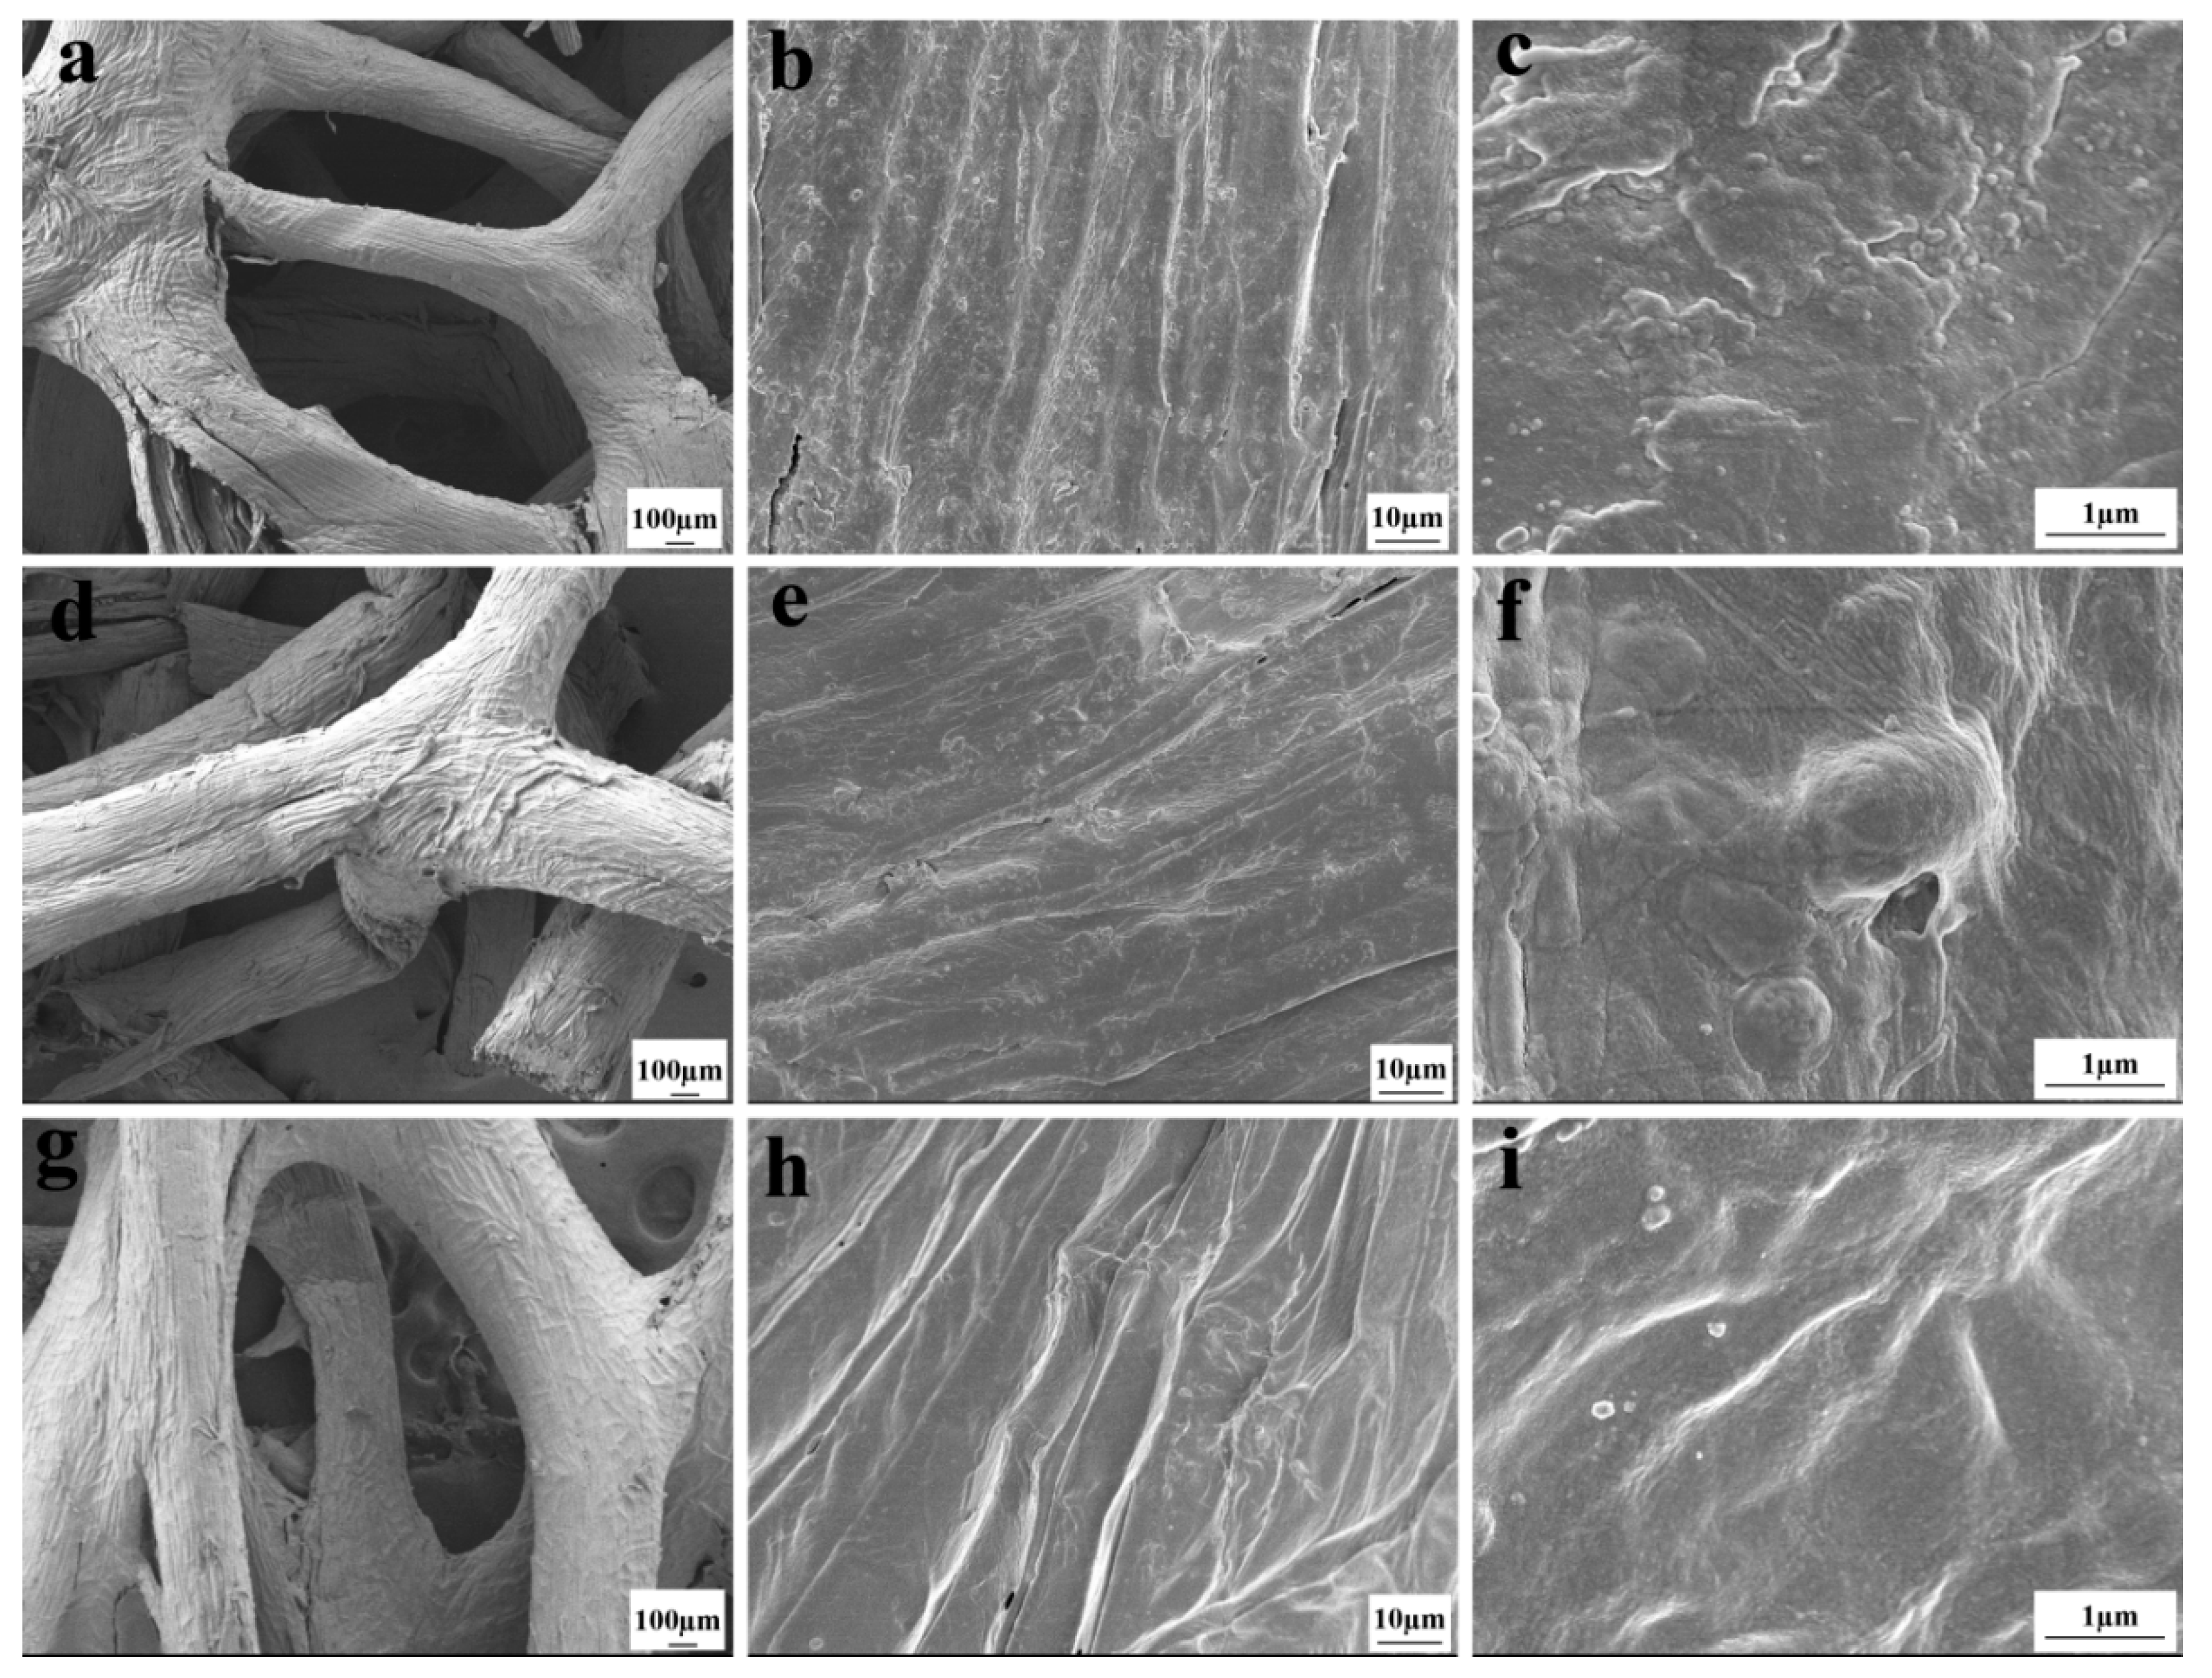
Figure 1 shows the fabrication process of LS@SA and the appearance of one integral originated LS. The slight yellow LS displayed a porous structure. The LS was composed of a 3D interconnected fibrous framework and showed pore sizes above 1 mm, and the diameter of the LS fiber was above 300 μm [24]. The existence of hydroxyl groups of the LS fiber made the adherence of hydrophilic SA to its surface easy. After MB was loaded on it, the colour of LS@SA changed from slightly yellow to blue, corresponding to the colour of the MB molecule.

3.2. SEM Analysis

FE-SEM was used to study the micromorphology of the selected samples, and the obtained images are shown in Figure 2. The LS fiber surface clearly showed an ordered micron-sized groove structure, which was beneficial for the adhesion and deposition of SA. After modification, the groove on the LS fiber surface became shallow, which proved the successful deposition of Ca2+ crosslinked SA on the LS fiber surface. After the magnification was increased, the fiber surface showed the presence of a Ca2+ crosslinked SA layer. When the magnification was further increased, the surface of the original LS fiber was clean [24], and the modified fiber surface exhibited a dense structure. This dense structure of Ca2+ crosslinked SA was similar to the surface structure of crosslinked SA described in previous reports [37].

3.3. SA Loading Rate on LS
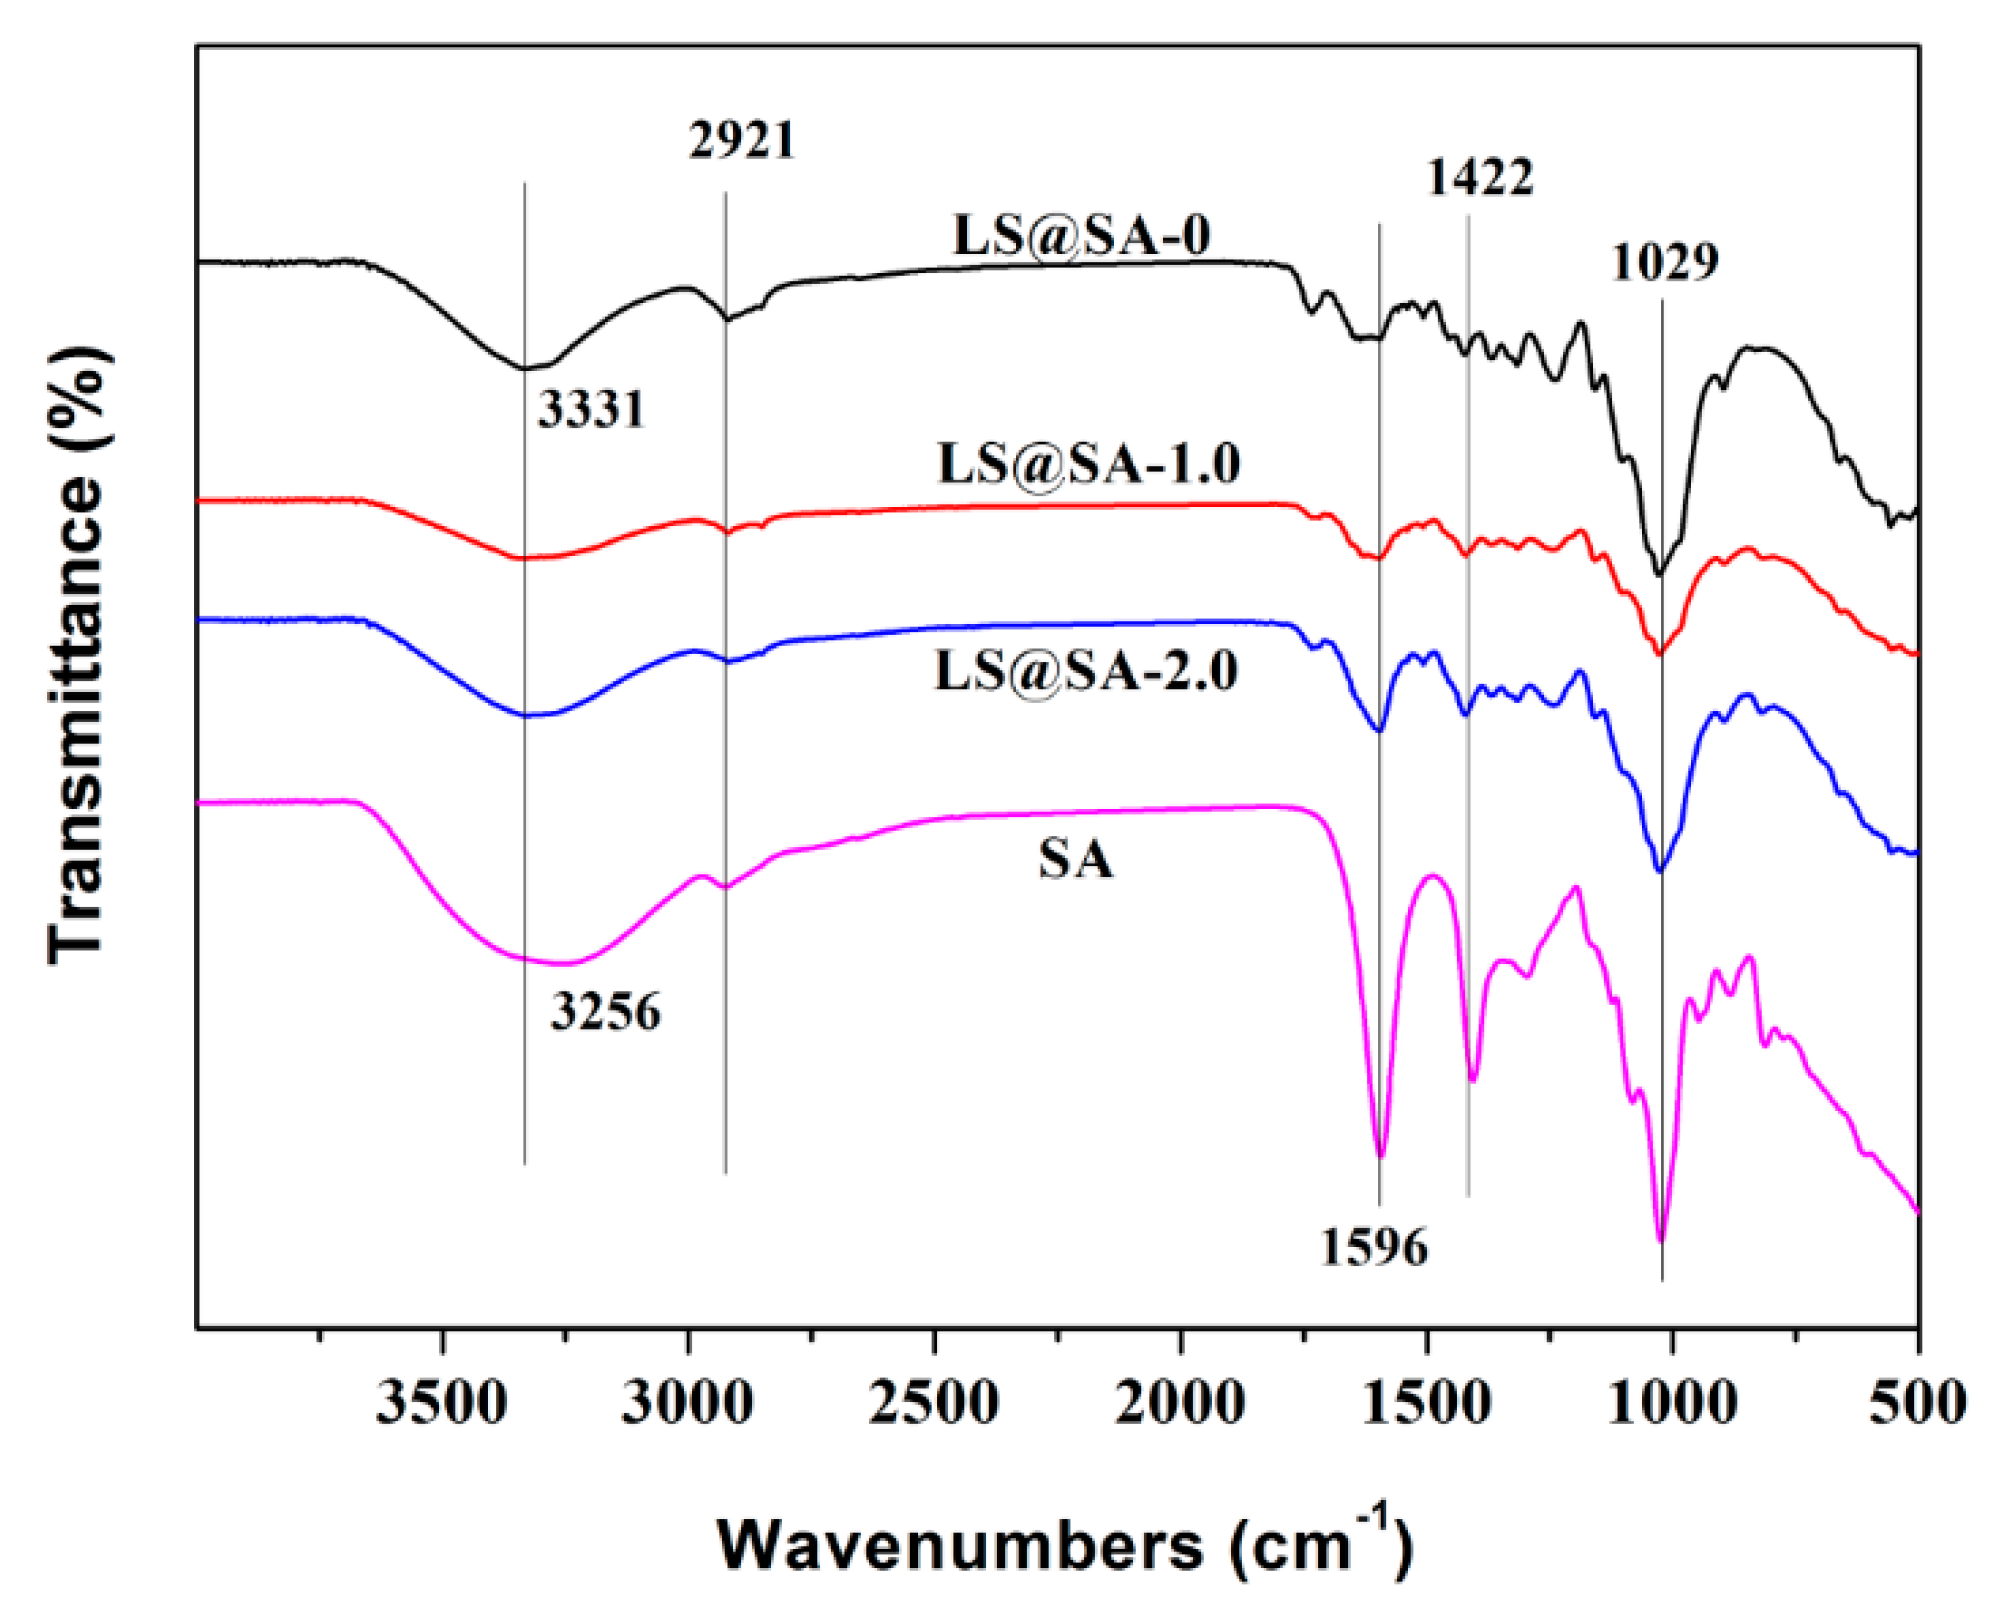
The loading amount of SA on LS is the most important factor to determine the final performance of the composite adsorbents. The result of the SA loading rate on the LS surface is shown in Figure 3. The loading rate of SA on LS increased with increasing SA concentration, mainly because the viscosity of SA increased with the increase in SA concentration, thus increasing the retention of SA on the LS surface. Given the existence of abundant carboxyl and hydroxyl groups in the SA molecular chain, the increase in SA loading rate increased the adsorption capacity of the composite adsorbent towards MB.

3.4. FTIR Analysis

FTIR was applied in order to study the selected samples and the results are shown in Figure 4. A characteristic peak at 2921 cm−1 was seen in the three samples due to C–H stretching [38]. The peaks observed in the three samples at approximately 1029 cm−1, which are familiar to various polysaccharides, can be attributed to the coupling of the C–O stretching group [37]. The neat LS and SA showed a broad peak at 3331 and 3256 cm−1, respectively, which was attributed to the stretching of hydroxyl (O–H) groups [39,40]. The peak at 1595 cm−1, which can be observed in the neat SA and [email protected] composite, corresponded to the asymmetric stretching peak of carboxyl groups on the SA [41]. These appearances confirmed that the SA was successfully coated on the LS fiber surface, which was consistent with the SEM images.

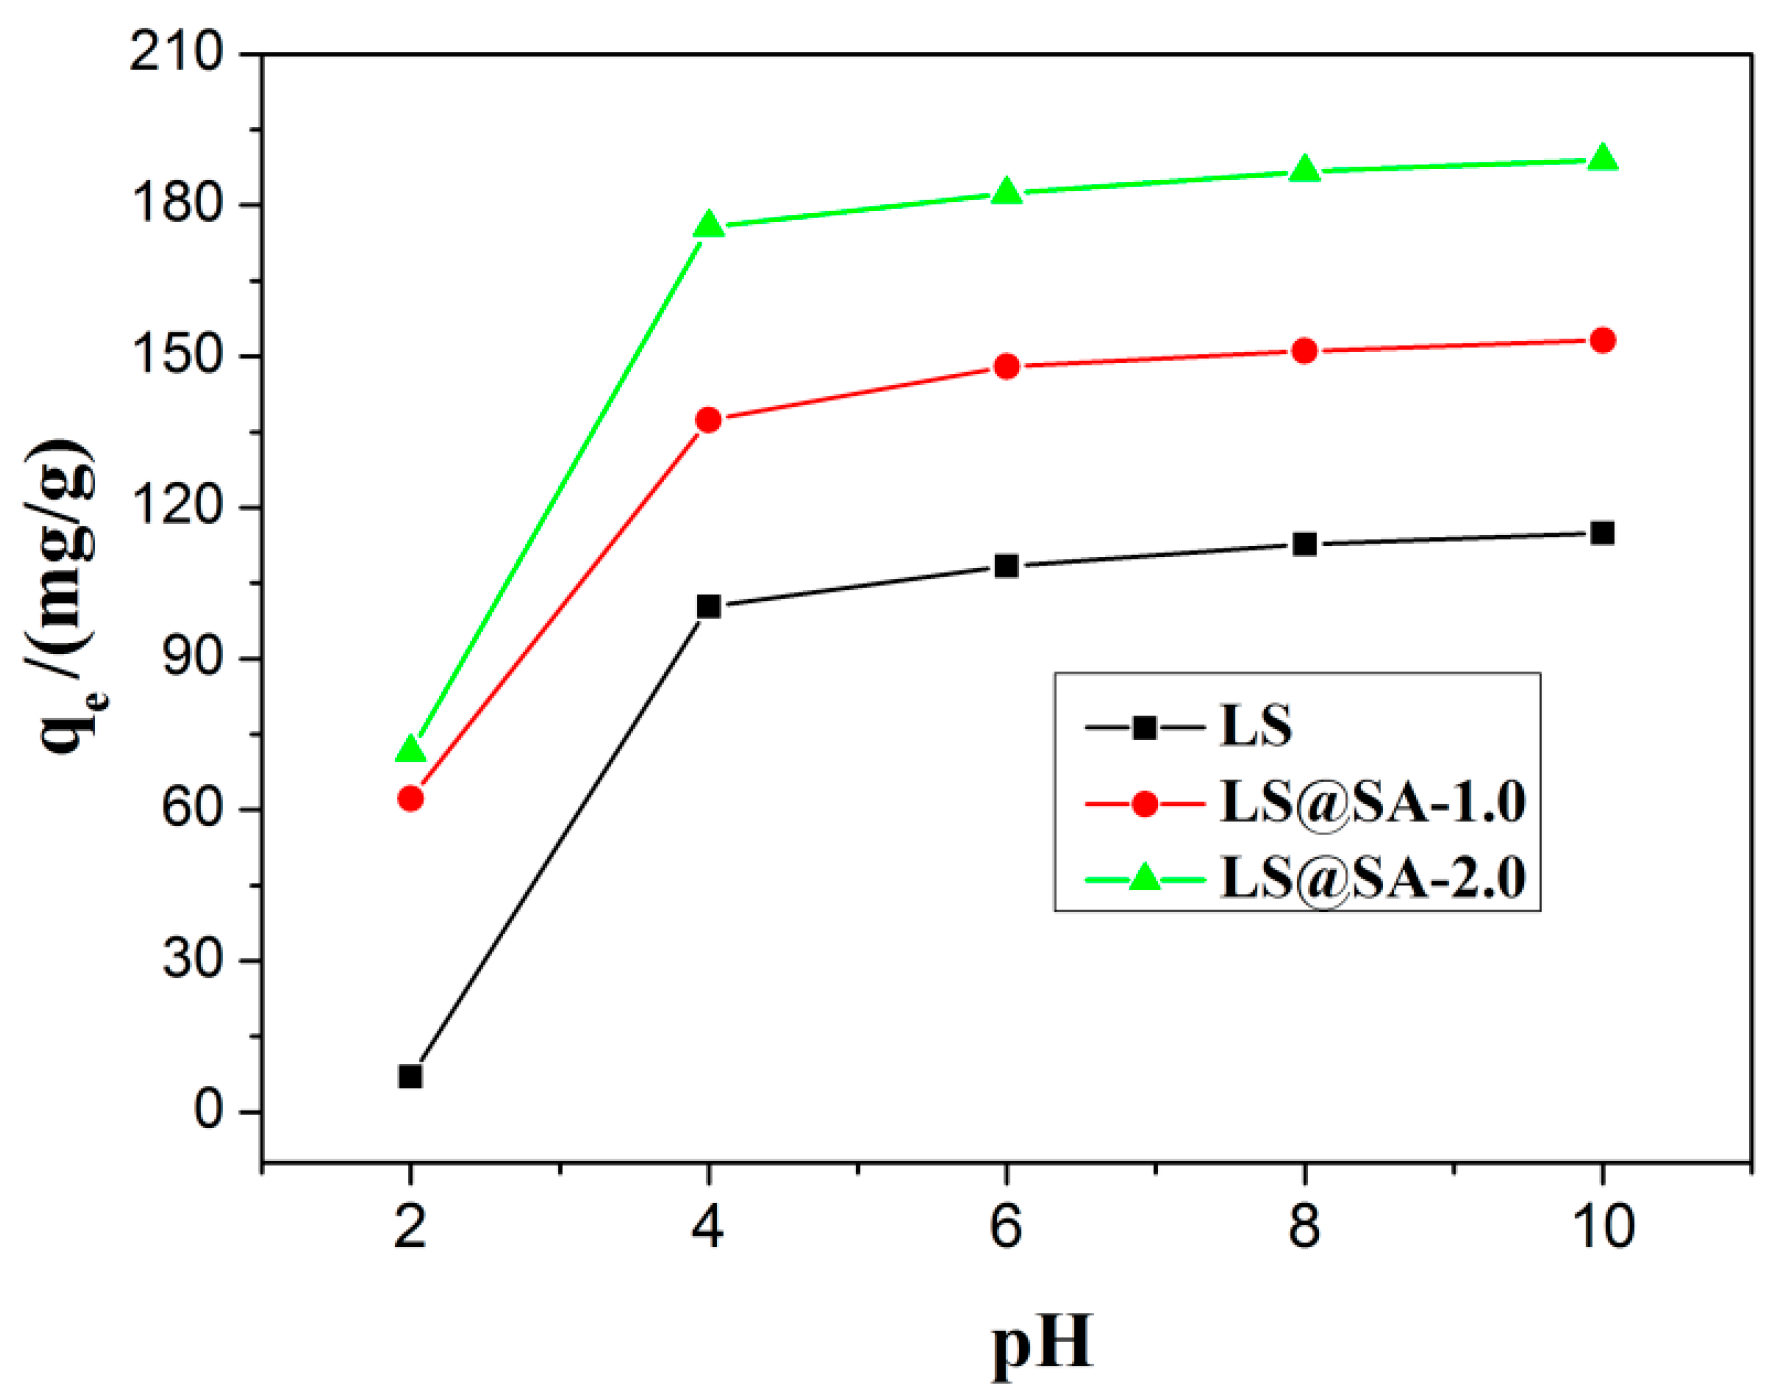
3.5. Effect of pH on MB Adsorption

In this study, the effect of pH on the adsorption of MB onto the three selected adsorbents was evaluated in the pH range of 2–10. Figure 5 displays the effect of initial pH on the adsorption capacity of the MB solution. The adsorption capacities of the three types of adsorbents increased fiercely from 7.04 to 100.39 mg/g (LS@SA-0), 62.23 to 137.38 mg/g ([email protected]) and 71.48 to 175.69 mg/g ([email protected]) when the pH value of the MB solution increased from 2.0 to 4.0. When the pH values were above 6, the adsorption capacities of the three types of adsorbents were only slightly influanced by pH value. The tendency of the adsorption capacity of adsorbents to increase with the increasing of pH value of the MB solution could be due to the following reason: at lower pH values, the competitive adsorption between H+ and MB molecules for the same interactive adsorption sites (mainly –COO) was due to the decreased adsorption capacity of the adsorbents [9]. As the pH values of the MB solutions increased above 4, the –COOH groups present along the SA chains began to ionize and yield –COO groups, which acted as strong binding sites for positively charged MB molecules.

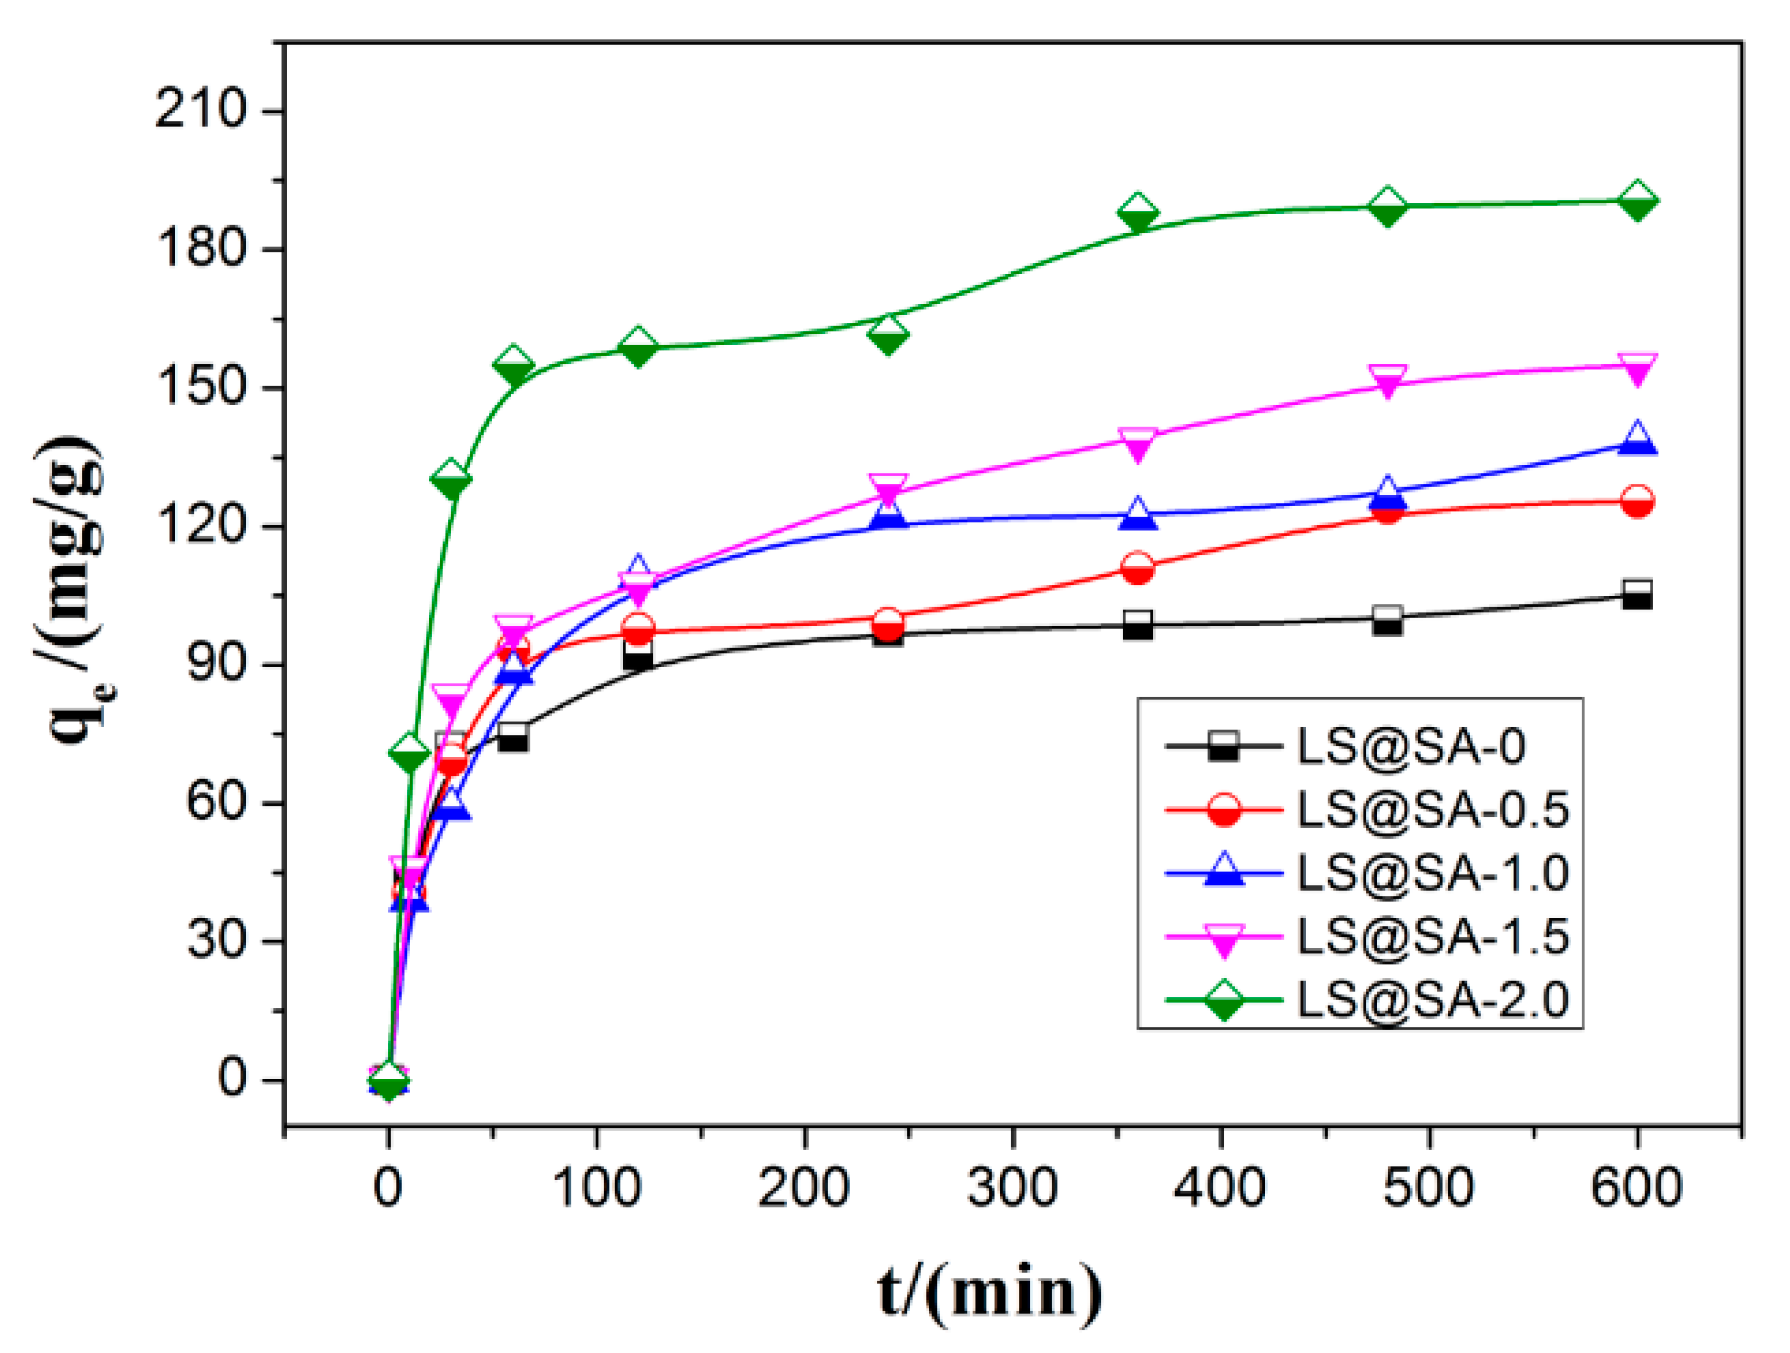
3.6. Adsorption Kinetics

The results of MB adsorption on the originated LS and the four types of LS@SA adsorbents are displayed in Figure 6. The uptake capacity of MB for all adsorbents rapidly increased within 60 min and then changed slightly until 120 min due to the LS high connectivity structure, and the MB molecule could quickly reach the adsorption site of the adsorbents. After 120 min, the adsorption capacity of LS@SA-0 slightly changed with the increase in time to 600 min, whilst the adsorption capacity of the four types of LS@SA adsorbents increased to a certain extent with prolonged time. During the adsorption of MB on the SA layer of LS@SA adsorbents, MB needed to penetrate through the surface layer to the inside, this needing longer adsorption time. Therefore, an adsorption experiment time of 600 min to reach adsorption isotherms was chosen in this study.
The pseudo-first order and the pseudo-second order kinetic models were utilized to test the experimental data and clarify the mechanism of MB adsorption on the LS@SA adsorbents. The pseudo-first order kinetic model has been extensively applied in order to forecast adsorption kinetics [42], and its linear form could be described as follows:
log ( q e   q t   ) =   log q e   k 1 2.303   t
The pseudo-second order kinetic model is as follows [41]:
t q t =   1 k 2 q e 2 +   t q e  
where qe (mg g−1) and qt (mg g−1) denote the amounts of the MB adsorbed at equilibrium and at time t, respectively; k1 (min−1) denotes the rate constant of pseudo-first order adsorption, and k2 (g·mg−1·min−1) denotes the rate constant of the pseudo-second order adsorption. The correlation coefficients (R) and the rate constants (k1 and k2) obtained from the plot of experiment data are listed in Table 1.
The R2 values for the pseudo-second order kinetic model were above 0.99, and the calculated q2e values were closer to the experimental qexp values than those from the pseudo first-order kinetic model, indicating that this model could well describe the removal of MB by the LS@SA adsorbents.

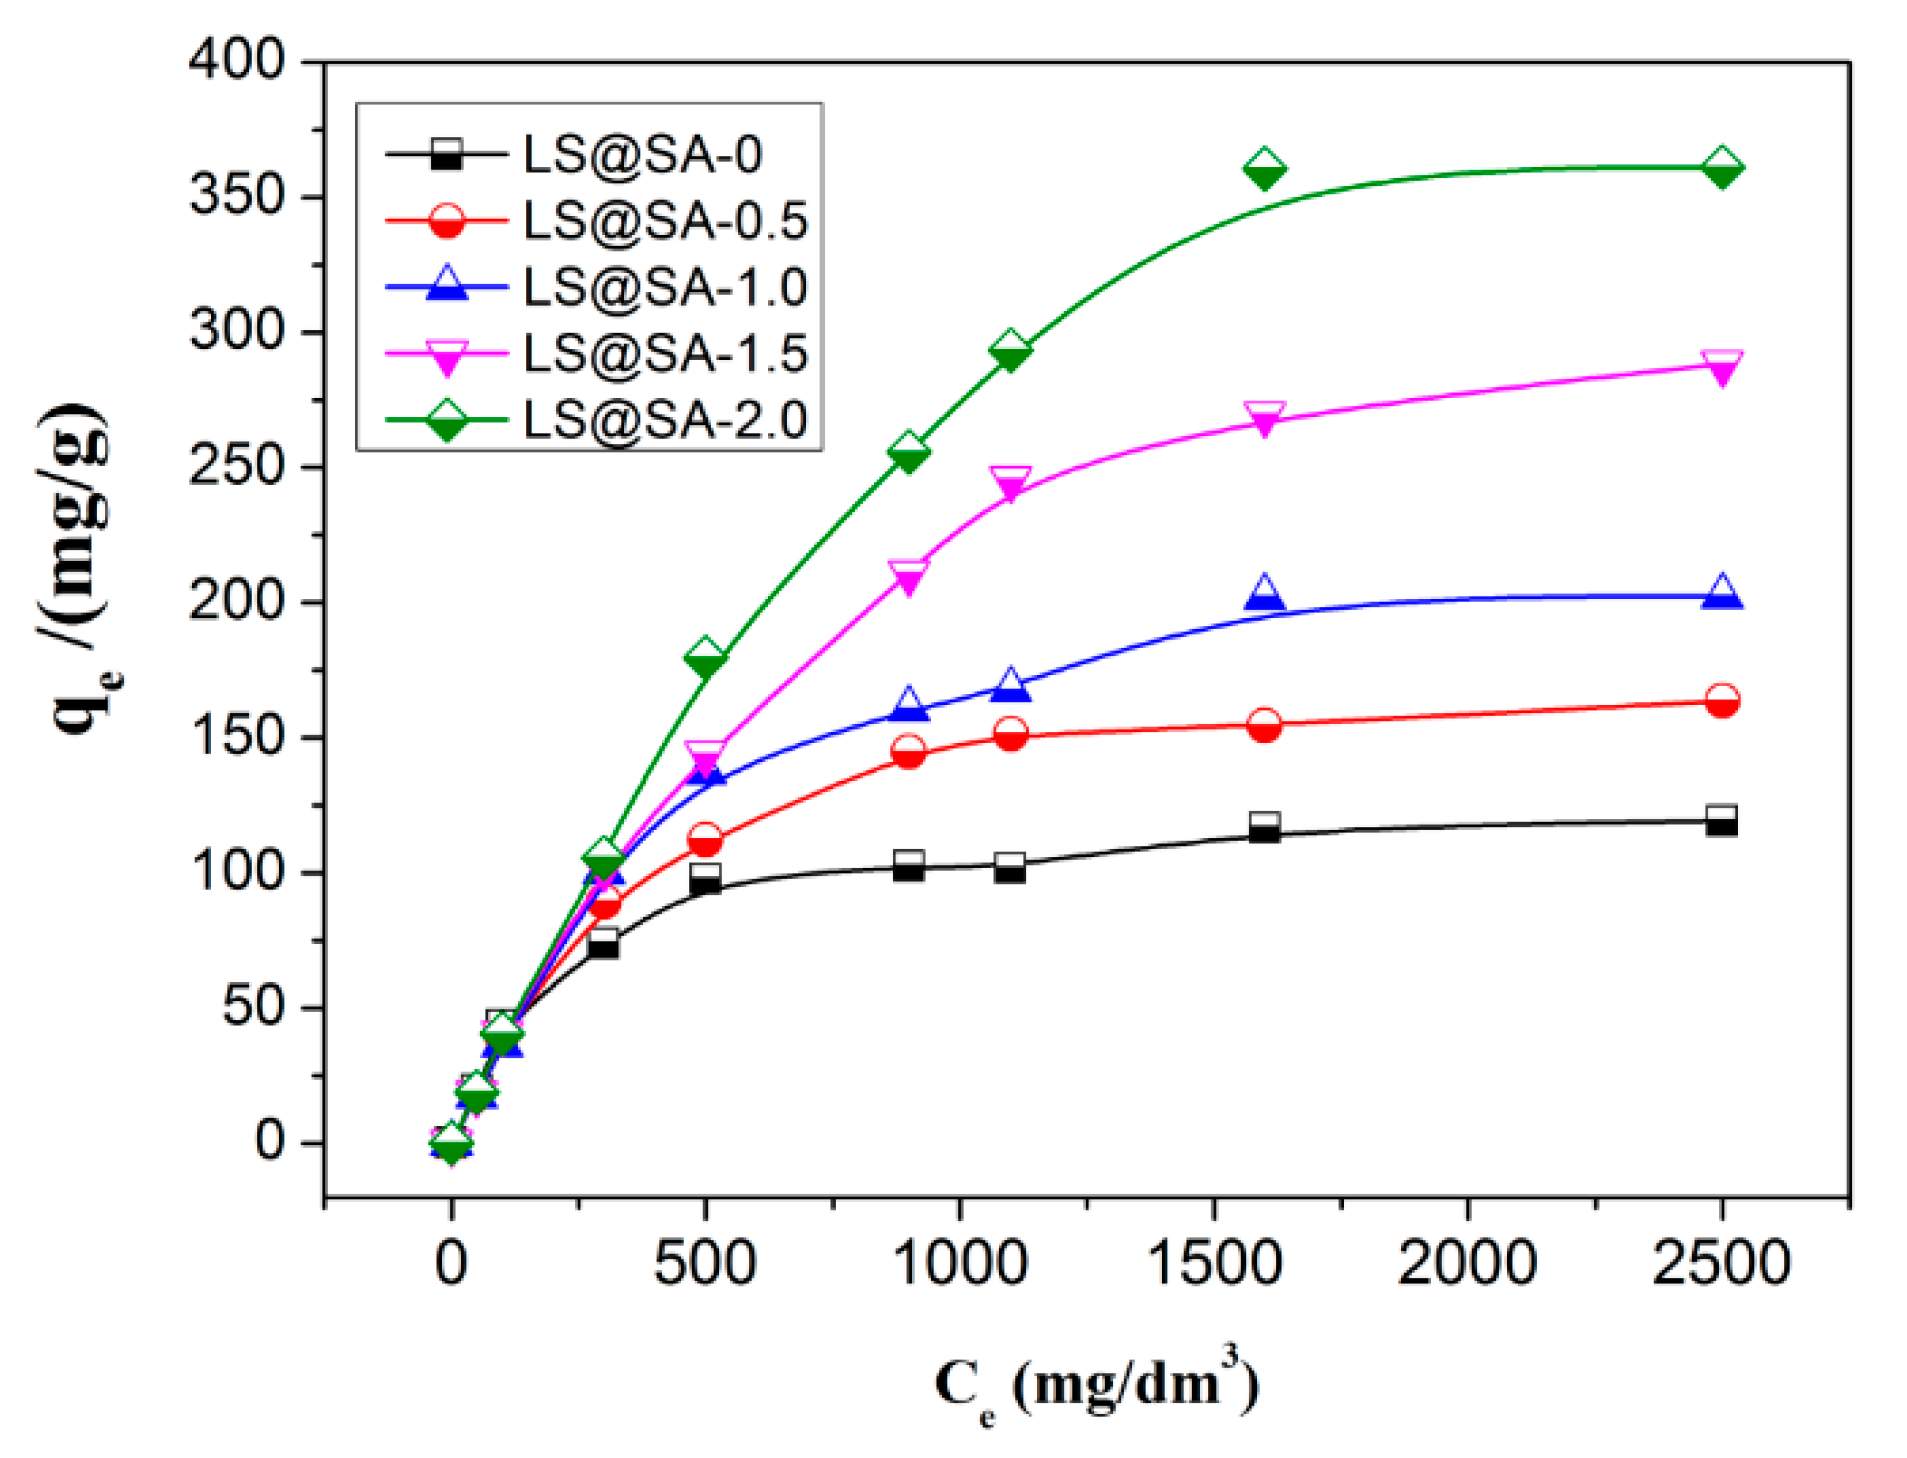
3.7. Adsorption Isotherm

The adsorption isotherms of MB onto LS@SA adsorbents were studied under the initial concentration range of MB of 50–2500 mg/L, and the obtained results are shown in Figure 7. The adsorption capacity of LS@SA-0 increased sharply with the concentration of MB increasing from 50 to 300 mg/g and then increased slowly with the concentration of MB increasing from 300 to 500 mg/g. This finding showed that the adsorption almost reached equilibrium. As for [email protected] and [email protected], the adsorption capacity increased sharply with the concentration of MB increasing from 50 to 900 mg/g and then increased slowly to reach equilibrium. However, for adsorbents ([email protected] and [email protected]) with relatively high SA loading, the adsorption capacity increased sharply with the concentration of MB increasing from 50 to 1100 mg/g and then increased slowly to reach equilibrium. In addition, the obtained results revealed that the equilibrium capacity of LS@SA adsorbents increased with the increase in SA loading on the LS, which was mainly due to the carboxyl groups on the SA chain.
Amongst several isotherm equations used by researchers to describe the sorption characteristics of adsorbents, the Langmuir and Freundlich isotherms were chosen to fit the experimental data. The Langmuir model assumes that the adsorbents possess a homogeneous structure in which all adsorption sites are equivalent. In mathematical form, this model is represented as follows [43]:
C e q e =   1 q max b +   C e q max  
where qe represents the equilibrium adsorption capacity of MB on LS@SA adsorbents (mg/g), Ce denotes the equilibrium MB concentration (mg/L), qmax denotes the monolayer adsorption capacity of the adsorbent, and b represents the Langmuir adsorption constant (L/mg).
The Freundlich model is valid for the heterogeneous system described by a heterogeneity factor of 1/n, which represents reversible adsorption. In mathematical form, this model is represented as follows [42]:
log q e =   1 n   log C e +   log K
where qe represents the amount of MB adsorbed at equilibrium (mg/g), Ce is the final MB concentration at equilibrium (mg/L), K is the Freundlich isotherm constant (L/g) and 1/n is the heterogeneity factor. The Langmuir and Freundlich parameters obtained from the plot of the experimental data are listed in Table 2. The Langmuir equation fitted better than the Freundlich equation for all the five types of adsorbents at the concentration range studied, indicating the monolayer coverage of MB on the surface of LS@SA adsorbents.
Other adsorbents reported by previous studies were used to compare with the LS@SA sample in this study. It can be seen from Table S1 (shown in the Supplementary Materials) that the [email protected] developed in this study has higher adsorption capacity (qm1) than the other adsorbents developed in previous works. Especially when compared with other natural fibers, the equilibrium adsorption capacity of [email protected] is high. This indicates the advantage of the surface coating method, and this behavior can be ascribed to the carboxyl groups on SA chain.

3.8. Recycling of LS@SA adsorbent

A qualified adsorbent must also possess perfect reusability for environmental and economic concerns. In this study, HCl solution (0.10 M) was chosen as the desorption reagent to remove the MB from the absorbed neat LS and [email protected] sample. Repeated adsorption-desorption cycles were conducted seven times to examine the reuse value of samples. The result is shown in Figure 8. As for the neat LS sample, the adsorption capacity of MB on it decreased slightly, changing over the course of the seven cycles. However, the adsorption capacity of MB on [email protected] decreased rapidly in the first two cycles and slightly changed in the later five cycles. This behavior could be partly attributed to the protonation of carboxylate groups on the [email protected] under stronger acid conditions in the desorption process [44], thereby easily weakening the interaction between carboxylate and MB. On the other hand, the [email protected] could be degraded slightly after desorption by the HCl solution. The degradation of [email protected] samples was performed seven times and the results are shown in Figure S1 (shown in the Supplementary Materials). It is clear that the degradation rate changed rapidly in the first two cycles and slightly varied in the later cycles. This could be due to the fact that the SA dissolved in the HCl solution. The degradation of [email protected] samples is another reason for the decrease in the adsorption capacity of [email protected] towards MB. After seven adsorption–desorption cycles, the adsorption capacity of [email protected] for MB decreased from 180.3 to 124.1 mg/g, which was approximately 70% of the initial adsorption capacity. Consequently, the LS@SA adsorbent could be considered as a reusable absorbent.

4. Conclusions

In this work, SA was successfully covered on the LS surface via a simple method. A series of LS@SA composites was prepared and employed as adsorbents to remove MB from wastewater. The adsorption studies on MB indicated that the adsorption capacity was significantly enhanced after covering the SA on the LS fiber, owing to the carboxyl groups on the SA molecular chain. The adsorption capacities of LS@SA composites increased with the increasing of pH value. The kinetic process was well represented by the pseudo-second order kinetic model. The experimental data were more suited to the Langmuir isotherm equation, indicating that MB adsorption occurred on the LS@SA composites through monolayer adsorption. After nine adsorption–desorption cycles, the removal efficiency of MB could retain approximately 70% of the initial adsorption capacity. Combining these outstanding properties, LS@SA composites have great potential to be applied as environmentally friendly and economical adsorbents.

Supplementary Materials

The following are available online at https://www.mdpi.com/2079-6412/10/9/814/s1, Table S1: Comparison of the maximal adsorption capacities of MB on different adsorbents, Figure S1: Effect of the degradation times on the degradation ratio of [email protected].

Author Contributions

Conceptualization, D.H.; data curation, X.G.; formal analysis, H.S.; investigation, Q.Q.; resources, X.Q.; writing—original draft, X.Q.; writing—review and editing, D.H. All authors have read and agreed to the published version of the manuscript.

Funding

This research was funded by the Science and Technology Major Project of the Gansu Province, China (No. 18ZD2GD014).

Conflicts of Interest

The authors declare no conflict of interest.

References

  1. Gupta, V.K.; Suhas. Application of low-cost adsorbents for dye removal—A review. J. Environ. Manag. 2009, 9, 2313–2342. [Google Scholar] [CrossRef] [PubMed]
  2. Qu, J.; Li, Q.; Luo, C.; Cheng, J.; Hou, X. Characterization of flake boron nitride prepared from the low temperature combustion synthesized precursor and its application for dye adsorption. Coatings 2018, 8, 214. [Google Scholar] [CrossRef] [Green Version]
  3. Kumar, S.; Krishnakumar, B.; Sobral, A.; Koh, J. Bio-based (chitosan/PVA/ZnO) nanocomposites film: Thermally stable and photoluminescence material for removal of organic dye. Carbohydr. Polym. 2019, 205, 559–564. [Google Scholar] [CrossRef] [PubMed]
  4. Ma, P.; Wang, S.; Wang, T.; Wu, J.; Xing, X.; Zhang, X. Effect of bifunctional acid on the porosity improvement of biomass-derived activated carbon for methylene blue adsorption. Environ. Sci. Pollut. Res. Int. 2019, 26, 30119–30129. [Google Scholar] [CrossRef] [PubMed]
  5. Liu, C.; Omer, A.M.; Ouyang, X.K. Adsorptive removal of cationic methylene blue dye using carboxymethyl cellulose/k-carrageenan/activated montmorillonite composite beads: Isotherm and kinetic studies. Int. J. Biol. Macromol. 2018, 106, 823–833. [Google Scholar] [CrossRef] [PubMed]
  6. Jodeh, S.; Hamed, O.; Melhem, A.; Salghi, R.; Jodeh, D.; Azzaoui, K.; Benmassaoud, Y.; Murtada, K. Magnetic nanocellulose from olive industry solid waste for the effective removal of methylene blue from wastewater. Environ. Sci. Pollut. Res. Int. 2018, 25, 22060–22074. [Google Scholar] [CrossRef] [PubMed]
  7. Makhado, E.; Pandey, S.; Nomngongo, P.N.; Ramontja, J. Preparation and characterization of xanthan gum-cl-poly(acrylic acid)/o-MWCNTs hydrogel nanocomposite as highly effective re-usable adsorbent for removal of methylene blue from aqueous solutions. J. Colloid Interface Sci. 2018, 513, 700–714. [Google Scholar] [CrossRef]
  8. Chen, B.; Cao, Y.; Zhao, H.; Long, F.; Feng, X.; Li, J.; Pan, X. A novel Fe(3+)-stabilized magnetic polydopamine composite for enhanced selective adsorption and separation of Methylene blue from complex wastewater. J. Hazard. Mater. 2020, 392, 122263. [Google Scholar] [CrossRef]
  9. Nasrullah, A.; Bhat, A.H.; Naeem, A.; Isa, M.H.; Danish, M. High surface area mesoporous activated carbon-alginate beads for efficient removal of methylene blue. Int. J. Biol. Macromol. 2018, 107, 1792–1799. [Google Scholar] [CrossRef]
  10. Zhang, P.; O’Connor, D.; Wang, Y.; Jiang, L.; Xia, T.; Wang, L.; Tsang, D.C.W.; Ok, Y.S.; Hou, D. A green biochar/iron oxide composite for methylene blue removal. J. Hazard. Mater. 2020, 384, 121286. [Google Scholar] [CrossRef] [PubMed]
  11. Cheng, J.; Zhan, C.; Wu, J.; Cui, Z.; Si, J.; Wang, Q.; Peng, X.; Turng, L.S. Highly efficient removal of methylene blue dye from an aqueous solution using cellulose acetate nanofibrous membranes modified by polydopamine. ACS Omega 2020, 5, 5389–5400. [Google Scholar] [CrossRef] [PubMed]
  12. Jain, N.; Basniwal, R.K.; Suman; Srivastava, A.K.; Jain, V.K. Reusable nanomaterial and plant biomass composites for the removal of Methylene Blue from water. Environ. Technol. 2010, 31, 755–760. [Google Scholar] [CrossRef] [PubMed]
  13. Sarat Chandra, T.; Mudliar, S.N.; Vidyashankar, S.; Mukherji, S.; Sarada, R.; Krishnamurthi, K.; Chauhan, V.S. Defatted algal biomass as a non-conventional low-cost adsorbent: Surface characterization and methylene blue adsorption characteristics. Bioresour. Technol. 2015, 184, 395–404. [Google Scholar] [CrossRef] [PubMed]
  14. Amin, M.T.; Alazba, A.A.; Shafiq, M. Comparative study for adsorption of methylene blue dye on biochar derived from orange peel and banana biomass in aqueous solutions. Environ. Monit. Assess. 2019, 191, 735. [Google Scholar] [CrossRef]
  15. Liu, Z.; Tian, D.; Hu, J.; Shen, F.; Long, L.; Zhang, Y.; Yang, G.; Zeng, Y.; Zhang, J.; He, J.; et al. Functionalizing bottom ash from biomass power plant for removing methylene blue from aqueous solution. Sci. Total. Environ. 2018, 634, 760–768. [Google Scholar] [CrossRef]
  16. Bediako, J.K.; Sarkar, A.K.; Lin, S.; Zhao, Y.; Song, M.H.; Choi, J.W.; Cho, C.W.; Yun, Y.S. Characterization of the residual biochemical components of sequentially extracted banana peel biomasses and their environmental remediation applications. Waste. Manag. 2019, 89, 141–153. [Google Scholar] [CrossRef]
  17. Zhang, J.; Yang, J.; Tian, Q.; Liang, X.; Zhu, Y.; Sand, W.; Li, F.; Ma, C.; Liu, Y.; Yang, B. Durability and performance of loofah sponge as carrier for wastewater treatment with high ammonium. Water Environ. Res. 2019, 91, 581–587. [Google Scholar] [CrossRef] [PubMed]
  18. Saudagar, P.S.; Shaligram, N.S.; Singhal, R.S. Immobilization of Streptomyces clavuligerus on loofah sponge for the production of clavulanic acid. Bioresour. Technol. 2008, 99, 2250–2253. [Google Scholar] [CrossRef] [PubMed]
  19. Dzionek, A.; Wojcieszynska, D.; Adamczyk-Habrajska, M.; Guzik, U. Enhanced degradation of naproxen by immobilization of bacillus thuringiensis B1(2015b) on loofah sponge. Molecules 2020, 25, 872. [Google Scholar] [CrossRef] [Green Version]
  20. Gu, X.; Tong, C.J.; Rehman, S.; Liu, L.M.; Hou, Y.; Zhang, S. Multifunctional nitrogen-doped loofah sponge carbon blocking layer for high-performance rechargeable lithium batteries. ACS Appl. Mater. Interfaces 2016, 8, 15991–16001. [Google Scholar] [CrossRef]
  21. Tuncel, U.; Turan, A.; Markoc, F.; Erkorkmaz, U.; Elmas, C.; Kostakoglu, N. Loofah sponge as an interface dressing material in negative pressure wound therapy: Results of an in vivo study. Ostomy Wound Manag. 2014, 60, 37–45. [Google Scholar] [PubMed]
  22. Tang, X.; Zhang, Q.; Liu, Z.; Pan, K.; Dong, Y.; Li, Y. Removal of Cu (II) by loofah fibers as a natural and low-cost adsorbent from aqueous solutions. J. Mol. Liq. 2014, 199, 401–407. [Google Scholar] [CrossRef]
  23. Demir, H.; Top, A.; Balkose, D.; Ulku, S. Dye adsorption behavior of Luffa cylindrica fibers. J. Hazard. Mater. 2008, 153, 389–394. [Google Scholar] [CrossRef] [PubMed] [Green Version]
  24. Liu, C.; Yan, C.; Luo, W.; Li, X.; Ge, W.; Zhou, S. Simple preparation and enhanced adsorption properties of loofah fiber adsorbent by ultraviolet radiation graft. Mater. Lett. 2015, 157, 303–306. [Google Scholar] [CrossRef]
  25. Wang, J.; Wei, J. Functionalization of loofah fibers via surface-initiated AGET ATRP for synergic adsorption of multiple pollutants from water. Mater. Lett. 2018, 210, 214–217. [Google Scholar] [CrossRef]
  26. Huang, Q.; Liu, M.; Zhao, J.; Chen, J.; Zeng, G.; Huang, H.; Tian, J.; Wen, Y.; Zhang, X.; Wei, Y. Facile preparation of polyethylenimine-tannins coated SiO2 hybrid materials for Cu2+ removal. Appl. Surf. Sci. 2018, 427, 535–544. [Google Scholar] [CrossRef]
  27. Jawad, A.H.; Azharul Islam, M.; Hameed, B.H. Cross-linked chitosan thin film coated onto glass plate as an effective adsorbent for adsorption of reactive orange 16. Int. J. Biol. Macromol. 2017, 95, 743–749. [Google Scholar] [CrossRef]
  28. Boukhalfa, N.; Boutahala, M.; Djebri, N.; Idris, A. Kinetics, thermodynamics, equilibrium isotherms, and reusability studies of cationic dye adsorption by magnetic alginate/oxidized multiwalled carbon nanotubes composites. Int. J. Biol. Macromol. 2019, 123, 539–548. [Google Scholar] [CrossRef]
  29. Ohemeng-Boahen, G.; Sewu, D.D.; Woo, S.H. Preparation and characterization of alginate-kelp biochar composite hydrogel bead for dye removal. Environ. Sci. Pollut. Res. Int. 2019, 26, 33030–33042. [Google Scholar] [CrossRef]
  30. Vecino, X.; Devesa-Rey, R.; Cruz, J.M.; Moldes, A.B. Study of the physical properties of calcium alginate hydrogel beads containing vineyard pruning waste for dye removal. Carbohydr. Polym. 2015, 115, 129–138. [Google Scholar] [CrossRef]
  31. Asadi, S.; Eris, S.; Azizian, S. Alginate-based hydrogel beads as a biocompatible and efficient adsorbent for dye removal from aqueous solutions. ACS Omega 2018, 3, 15140–15148. [Google Scholar] [CrossRef] [PubMed]
  32. Pettignano, A.; Tanchoux, N.; Cacciaguerra, T.; Vincent, T.; Bernardi, L.; Guibal, E.; Quignard, F. Sodium and acidic alginate foams with hierarchical porosity: Preparation, characterization and efficiency as a dye adsorbent. Carbohydr. Polym. 2017, 178, 78–85. [Google Scholar] [CrossRef] [PubMed]
  33. Wang, B.; Gao, B.; Wan, Y. Entrapment of ball-milled biochar in Ca-alginate beads for the removal of aqueous Cd (II). J. Ind. Eng. Chem. 2018, 61, 161–168. [Google Scholar] [CrossRef] [PubMed]
  34. Shu, B.; Wu, S.; Dong, L.; Wang, Q.; Liu, Q. Microfluidic synthesis of Ca-alginate microcapsules for self-healing of bituminous binder. Materials 2018, 11, 630. [Google Scholar] [CrossRef] [Green Version]
  35. Huq, T.; Salmieri, S.; Khan, A.; Khan, R.A.; Le Tien, C.; Riedl, B.; Fraschini, C.; Bouchard, J.; Uribe-Calderon, J.; Kamal, M.R.; et al. Nanocrystalline cellulose (NCC) reinforced alginate based biodegradable nanocomposite film. Carbohydr. Polym. 2012, 90, 1757–1763. [Google Scholar] [CrossRef] [PubMed]
  36. Phisalaphong, M.; Suwanmajo, T.; Tammarate, P. Synthesis and characterization of bacterial cellulose/alginate blend membranes. J. Appl. Polym. Sci. 2008, 107, 3419–3424. [Google Scholar] [CrossRef]
  37. Gopalakannan, V.; Viswanathan, N. Synthesis of magnetic alginate hybrid beads for efficient chromium (VI) removal. Int. J. Biol. Macromol. 2015, 72, 862–867. [Google Scholar] [CrossRef]
  38. Mohammadi, A.; Daemi, H.; Barikani, M. Fast removal of malachite green dye using novel superparamagnetic sodium alginate-coated Fe3O4 nanoparticles. Int. J. Biol. Macromol. 2014, 69, 447–455. [Google Scholar] [CrossRef]
  39. Chiew, C.S.C.; Poh, P.E.; Pasbakhsh, P.; Tey, B.T.; Yeoh, H.K.; Chan, E.S. Physicochemical characterization of halloysite/alginate bionanocomposite hydrogel. Appl. Clay Sci. 2014, 101, 444–454. [Google Scholar] [CrossRef]
  40. Ren, H.; Gao, Z.; Wu, D.; Jiang, J.; Sun, Y.; Luo, C. Efficient Pb (II) removal using sodium alginate–carboxymethyl cellulose gel beads: Preparation, characterization, and adsorption mechanism. Carbohydr. Polym. 2016, 137, 402–409. [Google Scholar] [CrossRef]
  41. Li, J.; Ma, J.; Chen, S.; Huang, Y.; He, J. Adsorption of lysozyme by alginate/graphene oxide composite beads with enhanced stability and mechanical property. Mater. Sci. Eng. C Mater. Biol. Appl. 2018, 89, 25–32. [Google Scholar] [CrossRef] [PubMed]
  42. Sun, J.; Chen, Y.; Yu, H.; Yan, L.; Du, B.; Pei, Z. Removal of Cu(2+), Cd(2+) and Pb(2+) from aqueous solutions by magnetic alginate microsphere based on Fe3O4/MgAl-layered double hydroxide. J. Colloid Interface Sci. 2018. [Google Scholar] [CrossRef] [PubMed]
  43. Algothmi, W.M.; Bandaru, N.M.; Yu, Y.; Shapter, J.G.; Ellis, A.V. Alginate-graphene oxide hybrid gel beads: An efficient copper adsorbent material. J. Colloid Interface Sci. 2013, 397, 32–38. [Google Scholar] [CrossRef] [PubMed]
  44. Wang, Y.; Feng, Y.; Zhang, X.F.; Zhang, X.; Jiang, J.; Yao, J. Alginate-based attapulgite foams as efficient and recyclable adsorbents for the removal of heavy metals. J. Colloid Interface Sci. 2018, 514, 190–198. [Google Scholar] [CrossRef] [PubMed]
Figure 1. Schematic illustration of the forming mechanism of LS@SA composite.
Coatings 10 00814 g001
Figure 2. SEM images of LS@SA-0 (ac), [email protected] (df) and [email protected] (gi).
Coatings 10 00814 g002
Figure 3. Effect of SA concentration on SA loading rate on LS.
Coatings 10 00814 g003
Figure 4. FTIR spectra of selected samples.
Coatings 10 00814 g004
Figure 5. Effect of pH on the adsorption capacity of adsorbents MB. Adsorption experiments, C0: 500 mg/L; pH range: 2.0–10; equilibrium time: 600 min.
Coatings 10 00814 g005
Figure 6. Effect of contact time on the adsorption capacity of adsorbents for MB. Adsorption experiments, C0: 500 mg/L; pH: 6.50.
Coatings 10 00814 g006
Figure 7. Effect of the MB concentration of solution on the adsorption capacity of adsorbents. Adsorption experiments, pH: 6.50; and equilibrium time: 600 min.
Coatings 10 00814 g007
Figure 8. Relationship between the time for reuse and the adsorption capacity for MB. Adsorption experiments, C0: 500 mg/L; pH: 6.50; equilibrium time: 600 min.
Coatings 10 00814 g008
Table 1. Estimated adsorption kinetic parameters for MB adsorption.
SamplesPseudo-First Order Model
qexp
(mg/g)
q1e
(mg/g)
k1
(min−1)
R2
LS@SA-0105.23100.8112.540.9750
[email protected]125.49118.6219.440.9852
[email protected]138.27126.9023.570.9563
[email protected]154.99143.0621.490.9814
[email protected]190.66191.2016.660.9845
SamplesPseudo-Second Order Model
q2e
mg/g
K2 × 104
g/(mg min)
h
mg/(g min)
R2
LS@SA-0106.044.815.410.9982
[email protected]129.372.193.670.9898
[email protected]141.041.893.760.9949
[email protected]162.341.453.820.9935
[email protected]196.462.238.590.9963
Table 2. Langmuir and Freundlich constants and correlation coefficients associated with adsorption isotherms of MB onto LS@SA adsorbents.
SamplesLangmuir ModelFreundlich Model
qe
mg/g
qm
mg/g
KL
L/mg
R2KF
(mg/g)(L/mg)1/n
nR2
LS@SA-0116.69121.950.01230.996115.223.470.8788
[email protected]163.66169.490.00930.99929.702.480.8968
[email protected]202.11217.390.00660.99587.842.150.8848
[email protected]288.42322.580.00200.99707.001.870.9348
[email protected]360.63416.670.00480.99576.561.690.9327

