Article

Influence of Different Electrolyte Additives and Structural Characteristics of Plasma Electrolytic Oxidation Coatings on AZ31 Magnesium Alloy

1
State Key Laboratory of Metastable Materials Science and Technology, College of Materials Science and Engineering, Yanshan University, Qinhuangdao 066004, China
2
School of Material Science and Engineering, Beijing Institute of Technology, Beijing 100081, China
3
National Key Laboratory of Science and Technology on Material under Shock and Impact, Beijing 100081, China
4
Tianjin Pacific Driveline Technology Ltd., Tianjin 300462, China
5
Zhejiang Geely Automobile Ltd., Ningbo 315800, China
6
Chongqing Institute of Green and Intelligent Technology, Chinese Academy of Sciences, Chongqing 400714, China
7
College of Mechanical Engineering, Yanshan University, Qinhuangdao 066004, China
*
Author to whom correspondence should be addressed.
Coatings 2020, 10(9), 817; https://doi.org/10.3390/coatings10090817
Submission received: 28 July 2020 / Revised: 13 August 2020 / Accepted: 21 August 2020 / Published: 24 August 2020
(This article belongs to the Special Issue Corrosion Science and Surface Engineering)

Abstract

:
Coatings prepared by different electrolyte additives were investigated on AZ31 magnesium alloy by plasma electrolytic oxidation. In this study, scanning electron microscopy, energy-dispersive X-ray spectroscopy and X-ray diffraction analysis were employed to assess the morphologies, chemical and phase compositions of the plasma electrolytic oxidation (PEO) coatings, respectively. Furthermore, electrochemical impedance spectroscopy was used to evaluate the corrosion behavior of the composite coating. The investigation of the effect of electrolyte additives in the base electrolyte showed that the PEO specimens exhibit different surface and cross-sectional morphologies, and phase compositions. The results showed that SiO32− was conducive to the growth of the ceramic layer, and the ceramic layer developing in the electrolyte which contained AlO2 showed a typical double-layer structure. The corrosion resistance of coating formed in a phosphate bath was higher than that of the coating formed in silicate bath and coating formed in an aluminate bath. Moreover, the corrosion resistance of the coating formed in the fluoride bath was the highest.

1. Introduction

Magnesium alloys represent some of the most promising metals for lightweight industry application, due to their low density and high strength/weight ratio, excellent machining and recycling abilities [1,2]. However, due to the poor corrosion resistance of magnesium alloys, there are many restrictions in applications [3,4,5,6]. In addition, the corrosion behavior of magnesium alloys is also affected by metal impurities during the manufacturing process. Kainer et al. [7], Asada et al. [8], and Inoue et al. [9] investigated the influence of impurities on corrosion in magnesium alloys, and reported that the content of Fe, Ni, or Cu beyond a specific tolerance limit leads to a rapid exacerbation in corrosion resistance. Considerable research has been carried out with regard to the relationship between microstructure and corrosion for Mg-Al-Zn (AZ) alloys [10,11,12]. Among many surface treatments that have been applied on magnesium alloys for improving their wear and corrosion resistance for magnesium alloys, plasma electrolytic oxidation (PEO), also called micro-arc oxidation (MAO), is an environmentally friendly technology for surface treatment [13,14,15,16,17].
Many factors have focused on improving the corrosion resistance of magnesium alloys by the PEO process, such as electrical parameters, electrolyte composition, PEO time, temperature, and sample pretreatment [18,19,20]. Specifically, the electrolyte composition affects the ceramic layer of the PEO sample. In many studies, mixed electrolyte components are used as the basic electrolyte, and the investigated components are added to the basic electrolyte, while the electrolyte composition explored in this way is interfered with by the external factors and the physical and chemical properties of additives are affected by each other [20,21]. Therefore, in order to investigate the effect of different electrolyte components on the PEO samples, the electrolyte components should be simplified as much as possible.
This study focused on the effects of different PEO electrolyte additives on the corrosion resistance of PEO samples. With an alkaline basic electrolyte, the same molar concentration is used for different anions, and the cations are Na+. Common basic electrolyte, silicate electrolyte, phosphate electrolyte, aluminate electrolyte and phosphate electrolyte are all used in this research. The electrolyte components are (1) 0.1 mol/L NaAlO2 + 0.1 mol/L NaOH; (2) 0.1 mol/L Na2SiO3 + 0.1 mol/L NaOH; (3) 0.1 mol/L Na3PO4 + 0.1 mol/L NaOH; (4) 0.1 mol/L NaF + 0.1 mol/L NaOH; the samples obtained were named Al-coating, Si-coating, P-coating, and F-coating, respectively.

2. Materials and Methods

Prior to the PEO process, the AZ31 magnesium alloy with the size of 15 mm × 15 mm × 1 mm (Al 3.0~3.2%, Zn 0.8~1.2%, Mn 0.2%, balance Mg) was grounded up to 3000 grit, then washed with distilled water, degreased ultrasonically in acetone and dried in room temperature air. A home-made treatment device for PEO process consists of a high power supply unit (WH-1A), a stainless steel container that also serves as the counter electrode, a stirrer and an electrolyte cooling system, the samples are served as the anode. The samples were treated under a pulsed AC electrical source with a duty ratio of 50% and a frequency of 50 Hz under a current density of 2.2 A/dm2 for 10 min.
Scanning electron microscopy (SEM, Hitachi S-4800, Japan) was employed to observe the surface and cross-section morphologies of the coatings and energy-dispersive spectroscopy (EDS) attached to SEM was used to detect the chemical composition of PEO coatings. In order to analyze the phase composition of the PEO coatings, X-ray diffraction (XRD, D/MAX-rB) with Cu Kα radiation at 40 kV and 100 mA device was used between 10° and 80° angles by 2°/min rate.
Electrochemical impedance spectroscopy (EIS) tests were measured using a CHI660E Electrochemical Workstation, to evaluate the electrochemical corrosion behavior of the PEO coatings. The impedance spectra were all recorded from a start frequency of 105 Hz to an end frequency of 10−2 Hz with an AC signal amplitude of 5 mV in the distilled water doped with 0.1 M NaCl aqueous solution. An exposed area of 0.5 cm2 of the test sample was kept in contact with the test solution. Before performing the electrochemical tests, all the samples were exposed to the test solution for 0.5 h to attain a stable open circuit potential. The corrosion cell consists of a saturated calomel electrode (SCE) as the reference electrode, a platinum foil as the counter electrode. The obtained EIS data were analyzed by equivalent circuit modeling using ZSimpwin software.

3. Results

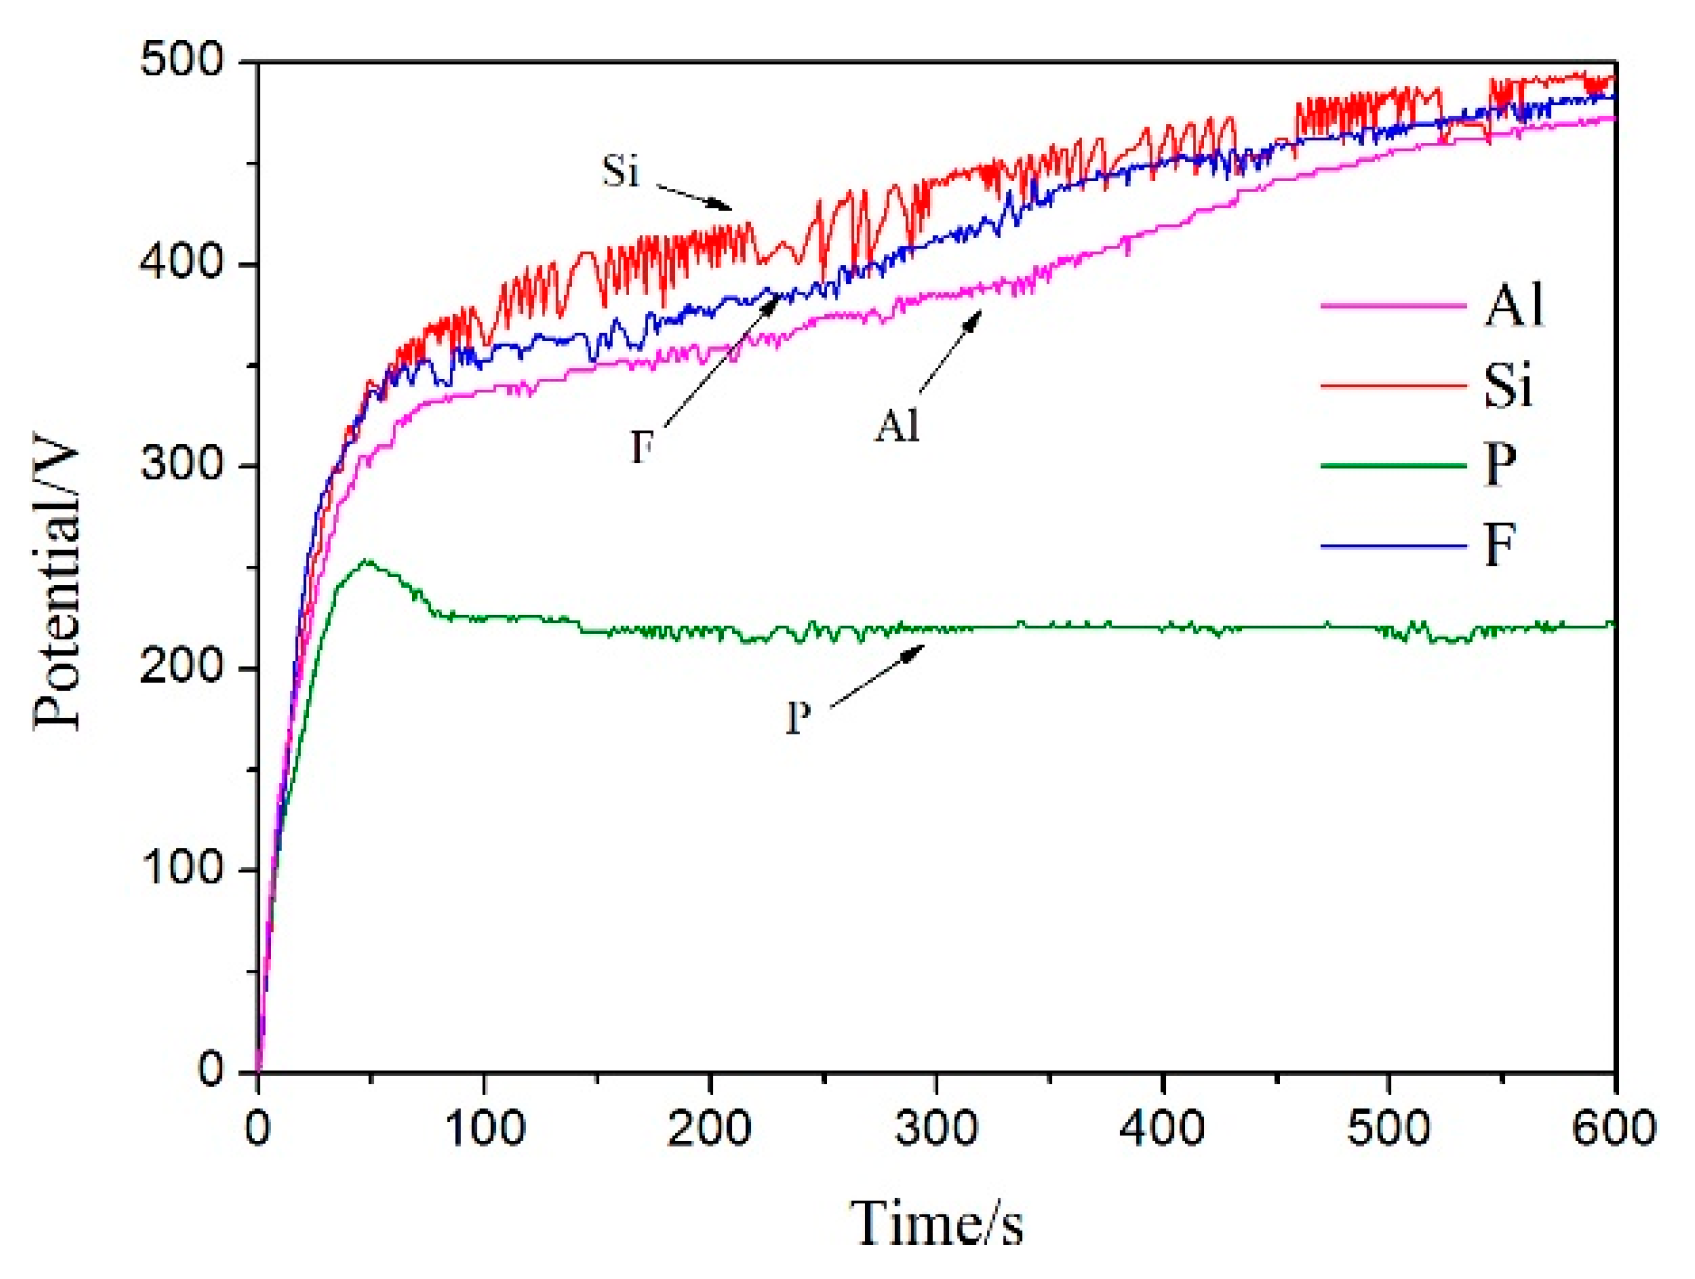
3.1. Effect of Different Electrolyte Components on PEO Voltage

Figure 1 shows the variation in the curves of different electrolyte voltages with time during the PEO process. The voltage change trend shows that Si-coating has the highest voltage, followed by F-coating and then by Al-coating, and P-coating has the lowest voltage. The P-coating voltage decreases when the PEO time reaches about 60 s. The different voltage–time curves shown are mainly dependent on the chemical nature of the anions in different electrolytes.
At the same PEO time, the thickness of Si-coating is the largest, so a higher breakdown voltage is required, and therefore the voltage of Si-coating is the highest, indicating that the silicate electrolyte is beneficial to the rapid growth of the ceramic layer. It can be seen from Figure 1 that the voltage curve of the Si-coating has the largest fluctuation, which is mainly due to the uneven growth of Si-coating. This corresponds to the breakdown discharge is mainly carried out at the weak points.
The voltage–time curves of F-coating and Al-coating showed roughly the same trend. The voltage in the early stage increased rapidly, before slowing down, and finally, the rate of voltage increase increased until the end. The rapid voltage rise phase corresponds to the process of rapid formation and breakdown of the AZ31 magnesium alloy passivation film. The slower voltage rise rate indicates that the growth rate of the ceramic layer is slower. The rapid voltage rise in the later period is mainly related to the recrystallization in the PEO ceramic layer [22]. The voltage drop phenomenon of the P-coating at around 60 s is mainly related to the slower growth rate of the PEO sample ceramic layer. The growth rate of the ceramic layer is lower than the voltage increase rate, so the voltage drop phenomenon occurs. It can be seen from the voltage–time curve of the P-coating in Figure 1 that the voltage fluctuation reduces during the entire PEO process, which is mainly due to the more uniform growth of the P-coating ceramic layer and the discharge breakdown occurring uniformly on the sample surface.

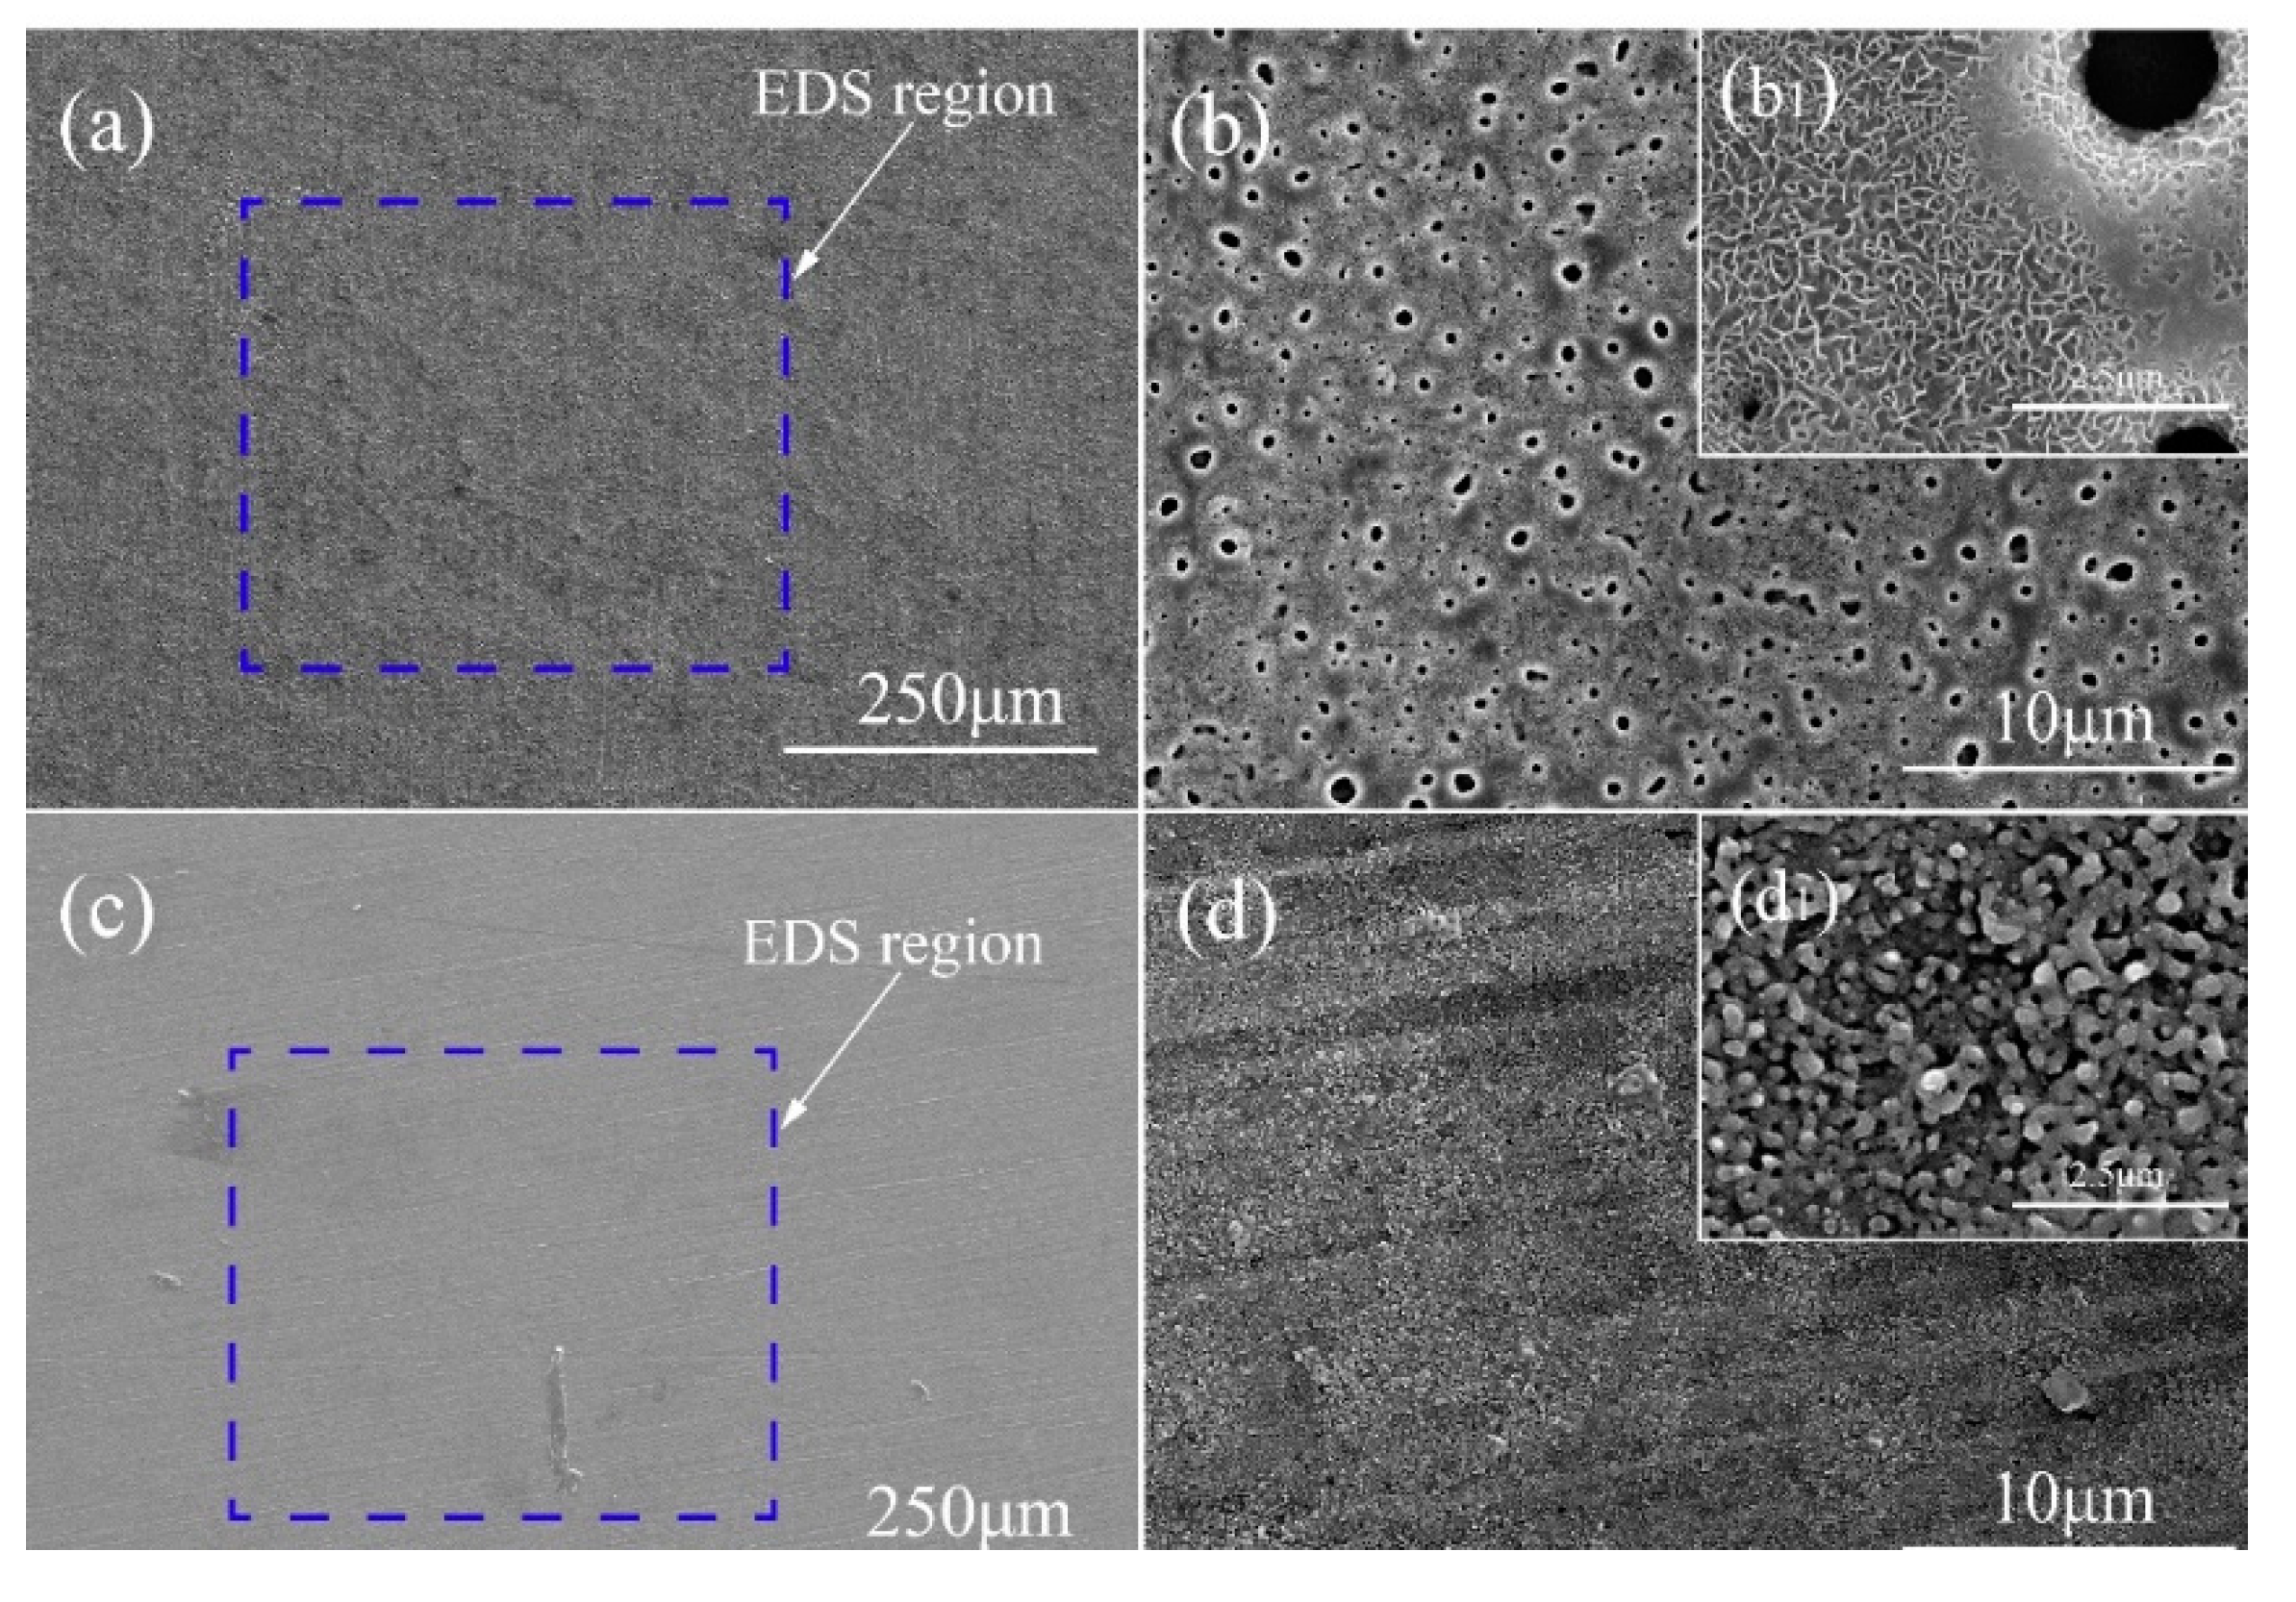
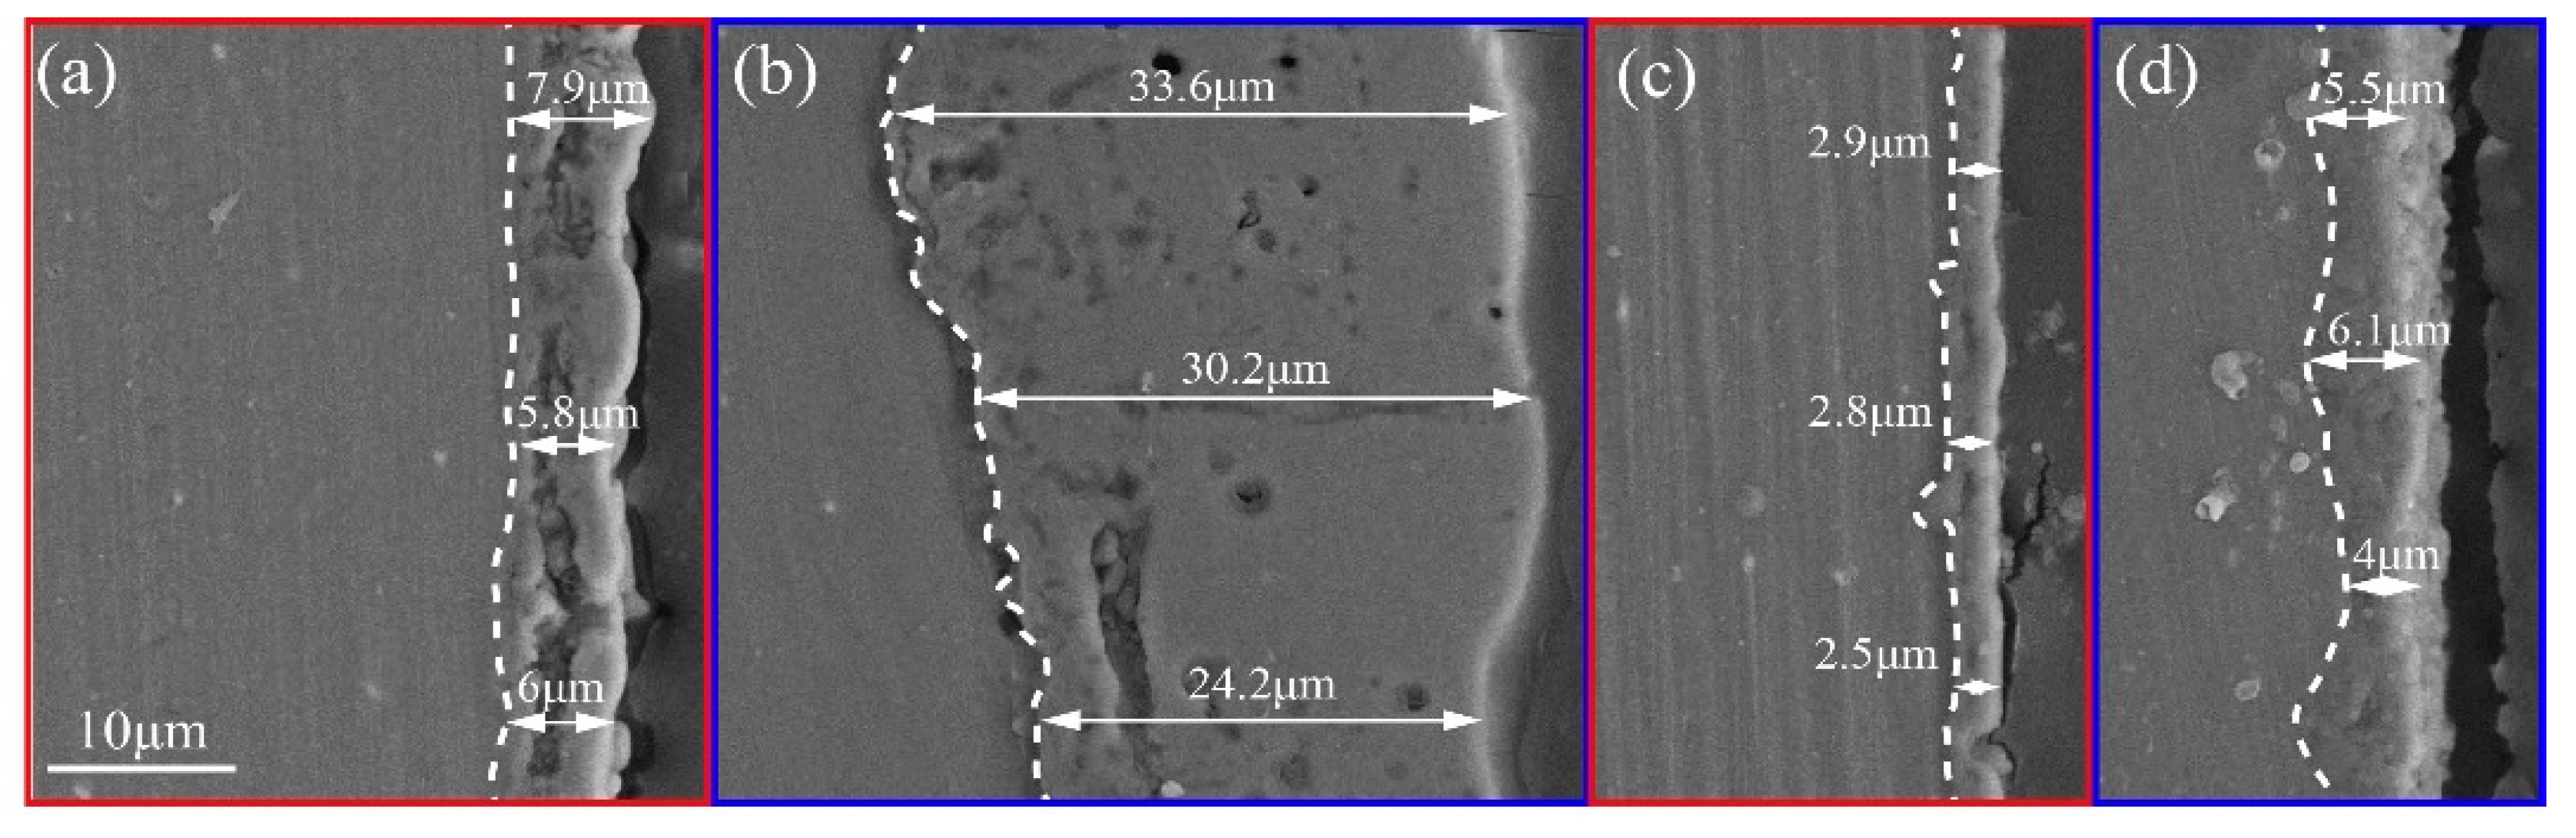
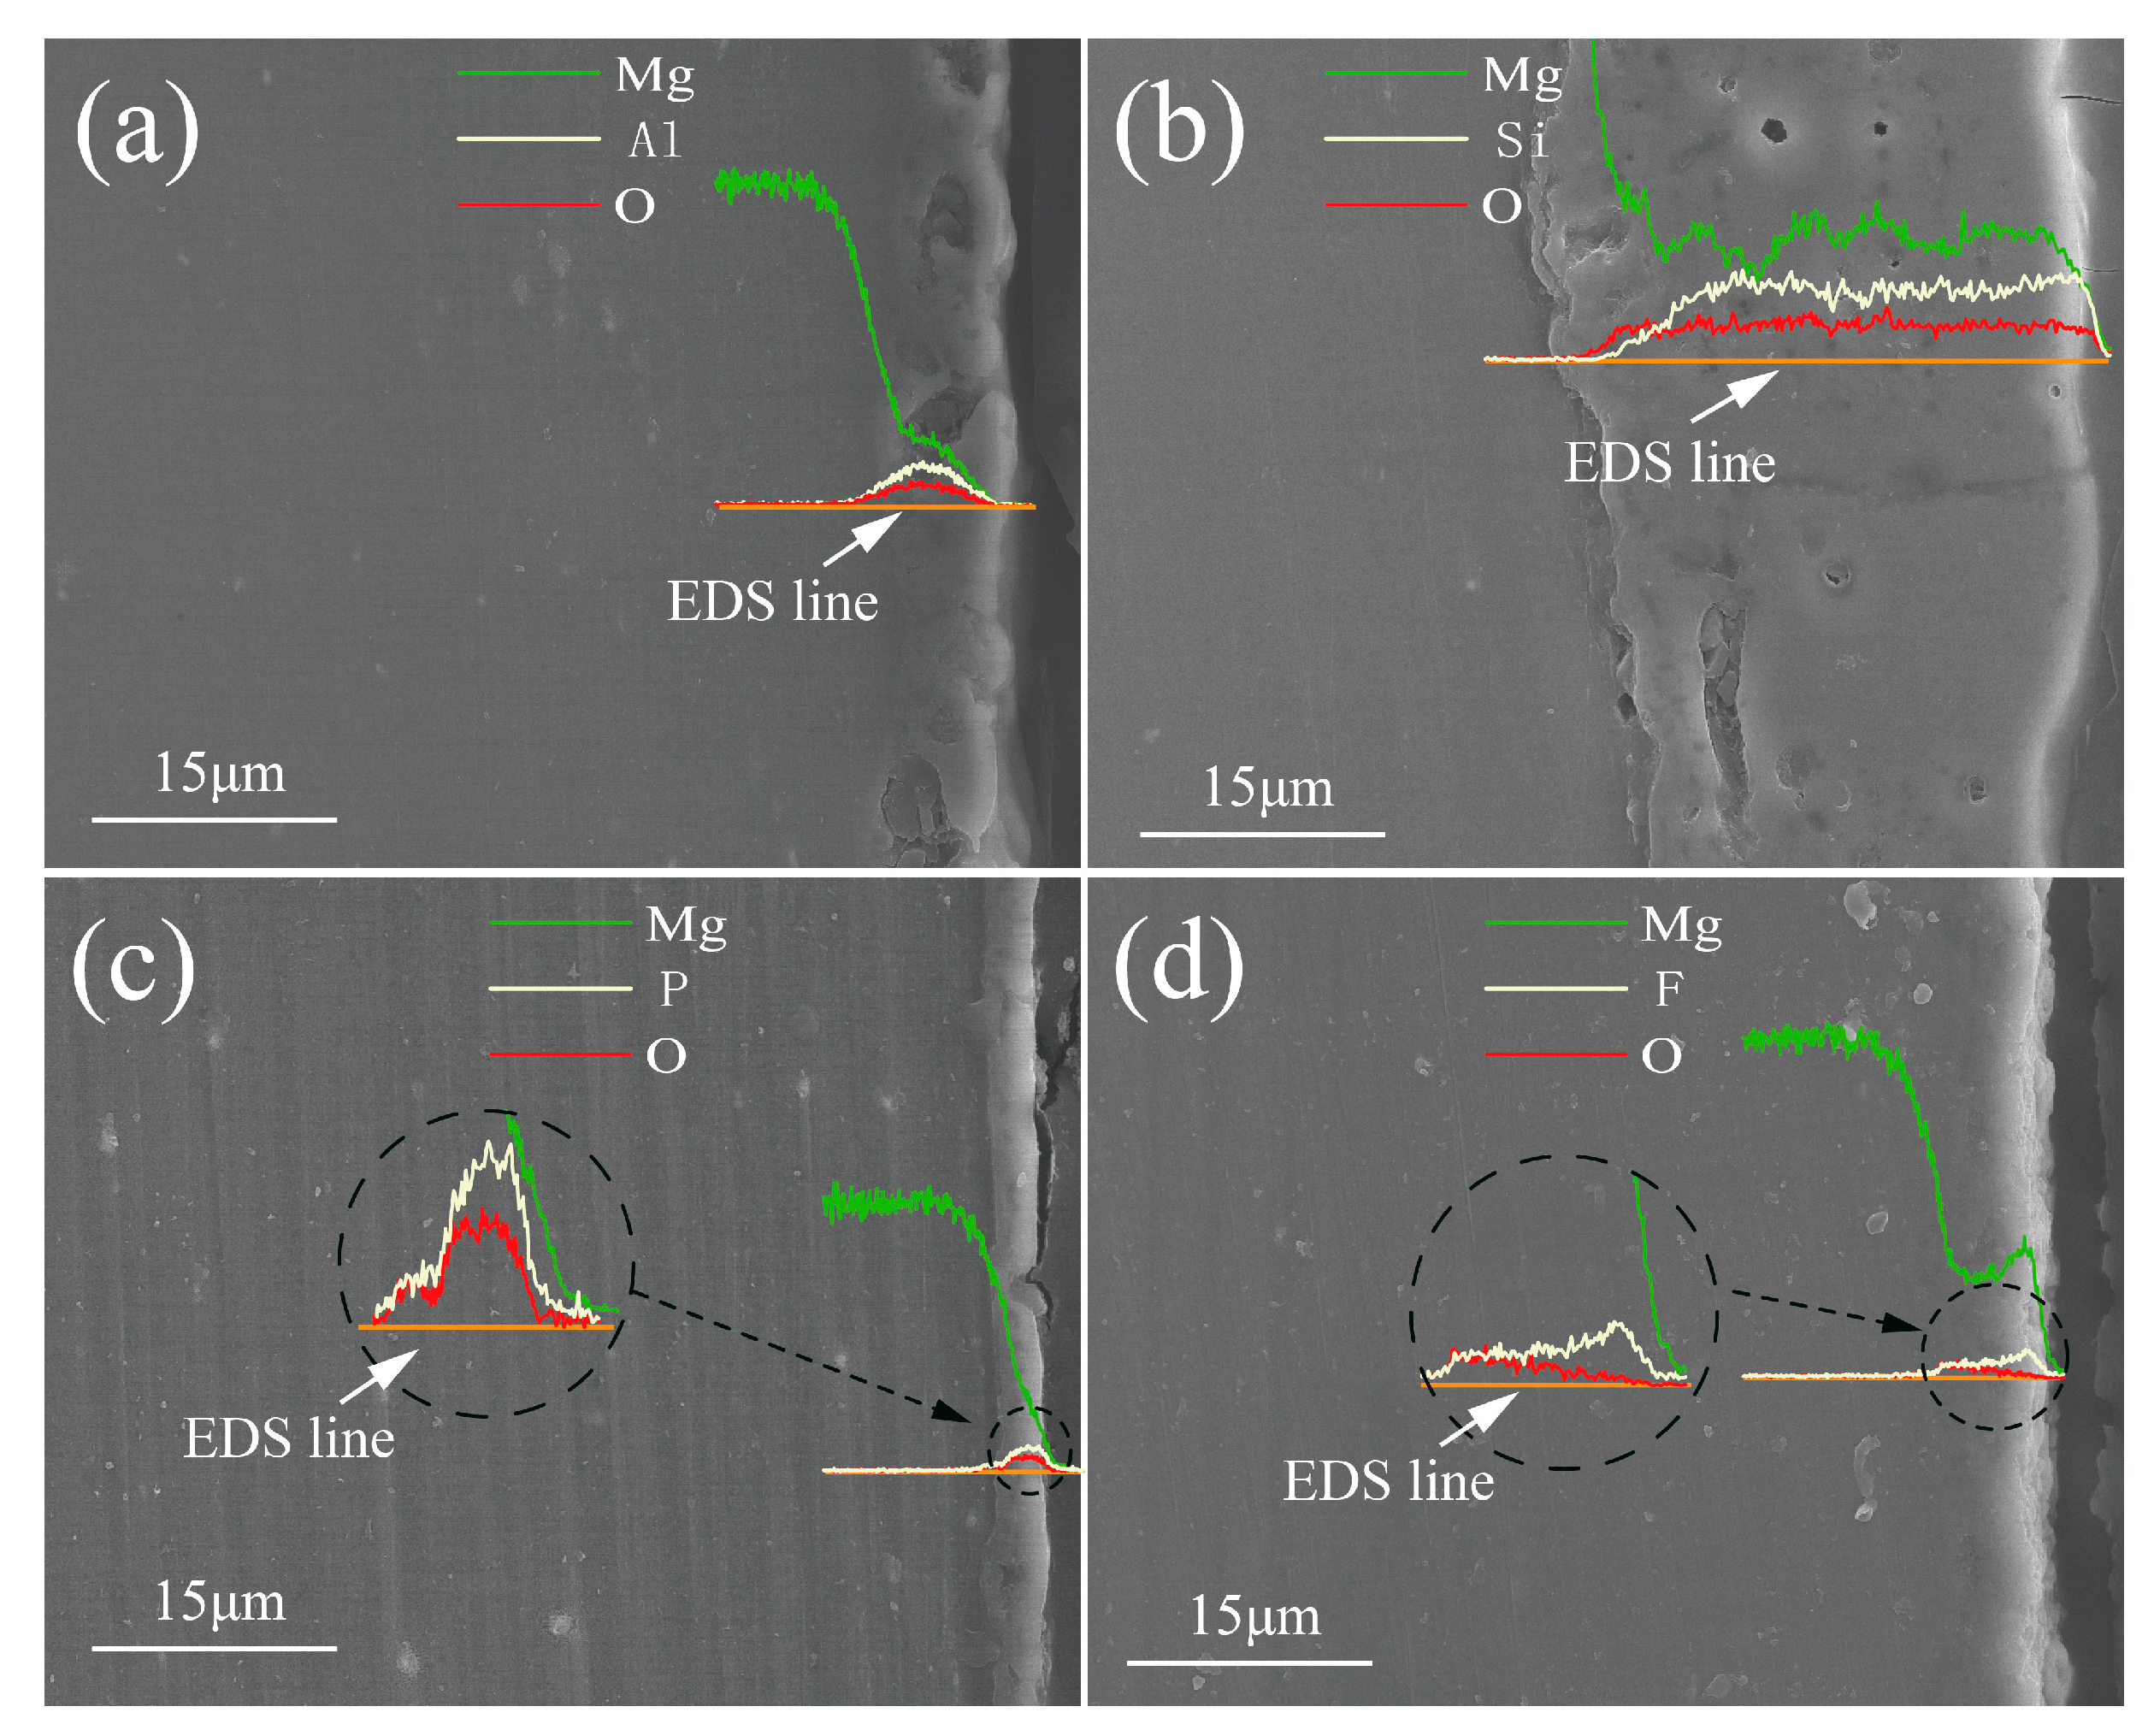
3.2. Morphologies and Elemental Composition of the PEO Coatings

Figure 2 and Figure 3 show the surface morphology of the PEO sample of the AZ31 magnesium alloy in different electrolyte compositions. From the lower-magnification images in Figure 2 (Figure 2a,c), it can be seen that the surface of Al-coating and Si-coating is rough, and the roughness of Si-coating greatly corresponds to the fluctuations of the voltage–time curve. It can be seen from the high-magnification images of the samples in Figure 2 (Figure 2b,d) that the Al-coating surface is composed of many discharge holes and “pie-shaped” discharge products, and the formation of the products is due to the material erupting through the holes and cooling and accumulating around the discharge holes during the PEO process. There is a large number of holes and cracks on the surface of Si-coating, and the holes on the surface of Si-coating tend to accumulate at certain weak locations. The surface morphology of Al-coating and Si-coating are the typical morphologies of PEO samples.
It can be seen from the lower-magnification images in Figure 3 (Figure 3a,c) that the surfaces of P-coating and F-coating are smoother, and the roughness is significantly lower than that of Al-coating and Si-coating. The lower roughness indicates that the sample surface is more uniform during the discharge process, and exhibits the full discharge characteristics. From the high-magnification images in Figure 3b, it can be seen that uniform discharge holes are distributed on the surface of the P-coating, and there is no clear accumulation of discharge products on the surface of the P-coating. In a further magnified image (Figure 3(b1)), it can be seen that the surface of the P-coated sample is composed of many “filamentous” discharge products, and the filamentous products around the discharge holes are significantly reduced, which is mainly related to the violent discharge around the discharge holes. The discharge is more intense, and this causes the discharge products to recrystallize and form connected discharge products. It can be seen from the high-magnification image (Figure 3d) that the typical PEO discharge surface morphology did not appear yet on the surface of the sample F-coating. From a further magnified image (Figure 3(d1)), it can be seen that the F-coating surface is composed of many densely arranged “granular” discharge products, and the denser discharge products contribute to the improvement of the corrosion resistance of the sample.
Figure 4 shows the cross-sectional morphology of the PEO sample of AZ31 magnesium alloy in different electrolytes. It can be seen that the cross-sectional morphology of the PEO samples in different electrolytes is clearly different, and the thickness is in the following order: Si-coating > Al-coating > F-coating > P-coating The thickness of the Si-coating layer is 4–5 times that of the Al-coating layer, and the thickness of the thinnest P-coating layer is 2.5–2.9 µm. The height of the voltage–time curve corresponds to the coating layer thickness: the greater the thickness, the greater the breakdown voltage required. For example, the largest and smallest Si-coating and P-coating thickness values, respectively, correspond to the highest and lowest voltage–time curves, respectively.
Figure 5 shows the atomic percentage contents of each element on the surface of the PEO sample in Figure 2a,c (low- and high-magnification images, respectively, of Al-coating and Si-coating) and Figure 3a,c (low- and high-magnification images, respectively, of P-coating and F-coating). It can be seen that the relative atomic percentage content of elements in the oxygen element and additives gradually decreases in the order of Si > Al > P > and F, while the relative atomic percentage content of the Mg element gradually increases. The relative atomic percentage content of the oxygen element and the additive element is relatively high, indicating that the additive anion in the electrolyte participates in the PEO reaction to form a ceramic layer at a high rate. An analysis of the anion atomic percentage content of each coating additive shows that the Si element in Si-coating has the highest relative atomic percentage content, indicating that SiO32− is most likely to participate in the PEO reaction. At the same time, the corresponding Si-coating voltage curve is higher, which indicates that SiO32− is more likely to participate in the formation of the ceramic layer. On the other hand, the F element has the lowest relative atomic percentage content in the F-coating, indicating that it is more difficult for F to participate in the PEO reaction.
The EDS line-scan results in Figure 6 showed that the main elements in the coatings are additive element, magnesium and oxygen. It can be seen from Figure 6 that the concentration of additive elements gradually decreased from coatings towards the substrate in the inner layer, which is related to the gradually difficult of additive element to enter the substrate [23,24]. The aluminum and oxygen in the Al-coating are mainly distributed between the inner layer and the outer layer, which might be proved that the AlO2 ions participate in the reactions in the microarc discharge channel and enrich between the inner layer and the outer layer, corresponding to the cross-sectional morphology of Al-coating which exist more holes and cracks [25,26]. It can be seen from Figure 6b that the silicon content in the outer region is higher than that in the inner region of the coatings, the reason is that the formation of Si-containing insoluble gels will increase the migrating diffificulty of SiO32− towards the coating interior [27]. Figure 6c shows that the phosphorus and oxygen in the P-coating present a stepped distribution in the ceramic layer, that is, the content of phosphorus and oxygen between the inner layer and the outer layer is higher than the content in the inner layer, and the content of outer layer is lowest. The phenomenon of stepped distribution may related to the strong activity of phosphate and easier enter into the matrix [28,29,30]. Figure 6d shows that the fluorine in the F-coating is mainly distributed in the outer layer, while the oxygen is mainly distributed in the inner layer. The fluoride may mainly distributed in the outer layer of the sample, and the oxide may mainly distributed in the inner layer of the ceramic layer, respectively. The accumulation of the fluoride in the outer layer has a great effect on improving the corrosion resistance [31].

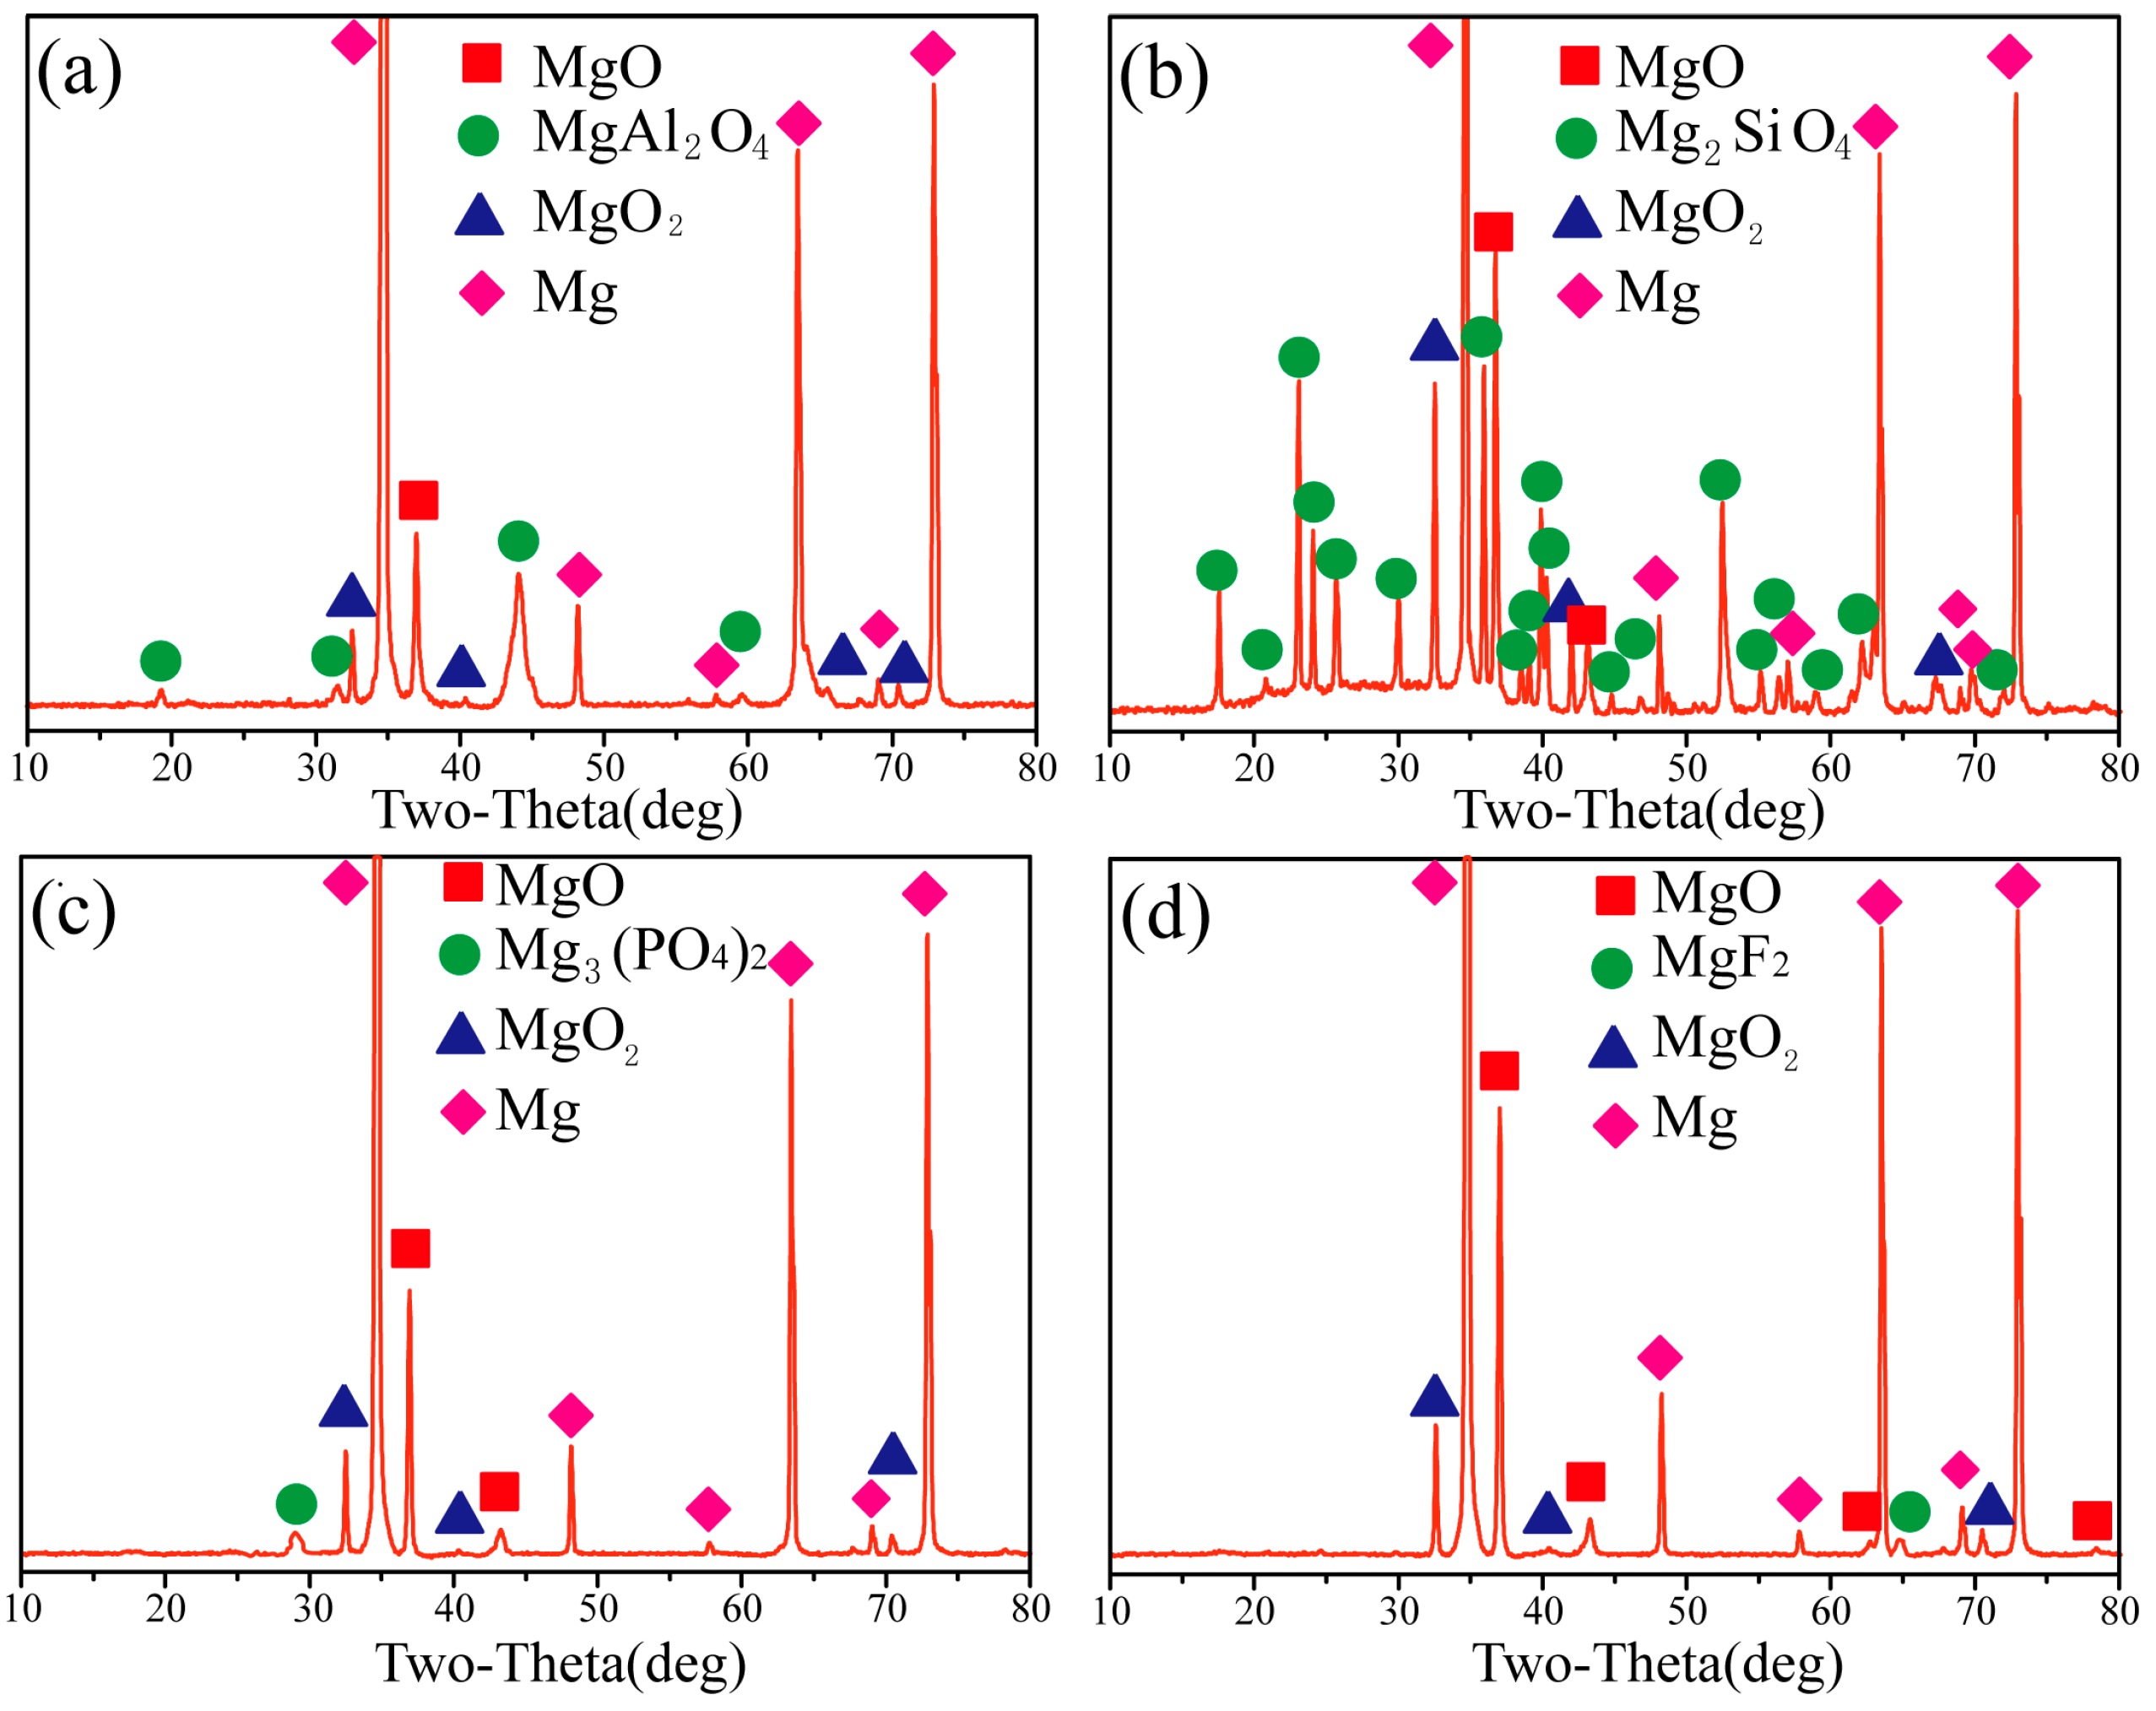
3.3. Phase Composition of the PEO Coatings

Figure 7 shows the XRD diffraction pattern of the PEO samples of each AZ31 magnesium alloy sample in different electrolytes. Comparing the Powder Diffraction File (PDF) card identified that the phases of the ceramic layers formed by different electrolytes are different, but they all contain MgO (file 77-2364, ICDD-PDF database) and MgO2 (file 76-1363, ICDD-PDF database) [32]. The formation of MgO and MgO2 is a result of the reaction between the magnesium alloy matrix and OH in the electrolyte. The phases in the ceramic layers obtained by different electrolytes are MgAl2O4 (file 77-0438, ICDD-PDF database) in Al-coating, Mg2SiO4 (file 78-1372, ICDD-PDF database) in Si-coating, Mg3(PO4)2 (file 88-0413, ICDD-PDF database)in P-coating, MgF2 (file 41-1443, ICDD-PDF database) in F-coating. This is the result of the different effects of the anions contained in different electrolytes. In addition, it can also be seen that the peak intensity of the phases formed by the anion element contained in each additive in the PEO ceramic layer also differs. Further, in Si-coating (Figure 7b), the peak intensity of Mg2SiO4 is strong, which may be due to the large thickness of Si-coating; for the thinner Al-coating and F-coating, the peak intensity corresponding Mg3(PO4)2 and MgF2 are relatively weak, however, they are apparently detected. The relative peak intensity of the phase in the coating is related not only to the thickness of the coating but also to the activity of the components in the electrolyte involved in the PEO. The higher Mg2SiO4 peak intensity in Si-coating is related to the formation of the ceramic layer that facilitates the participation of SiO32−.

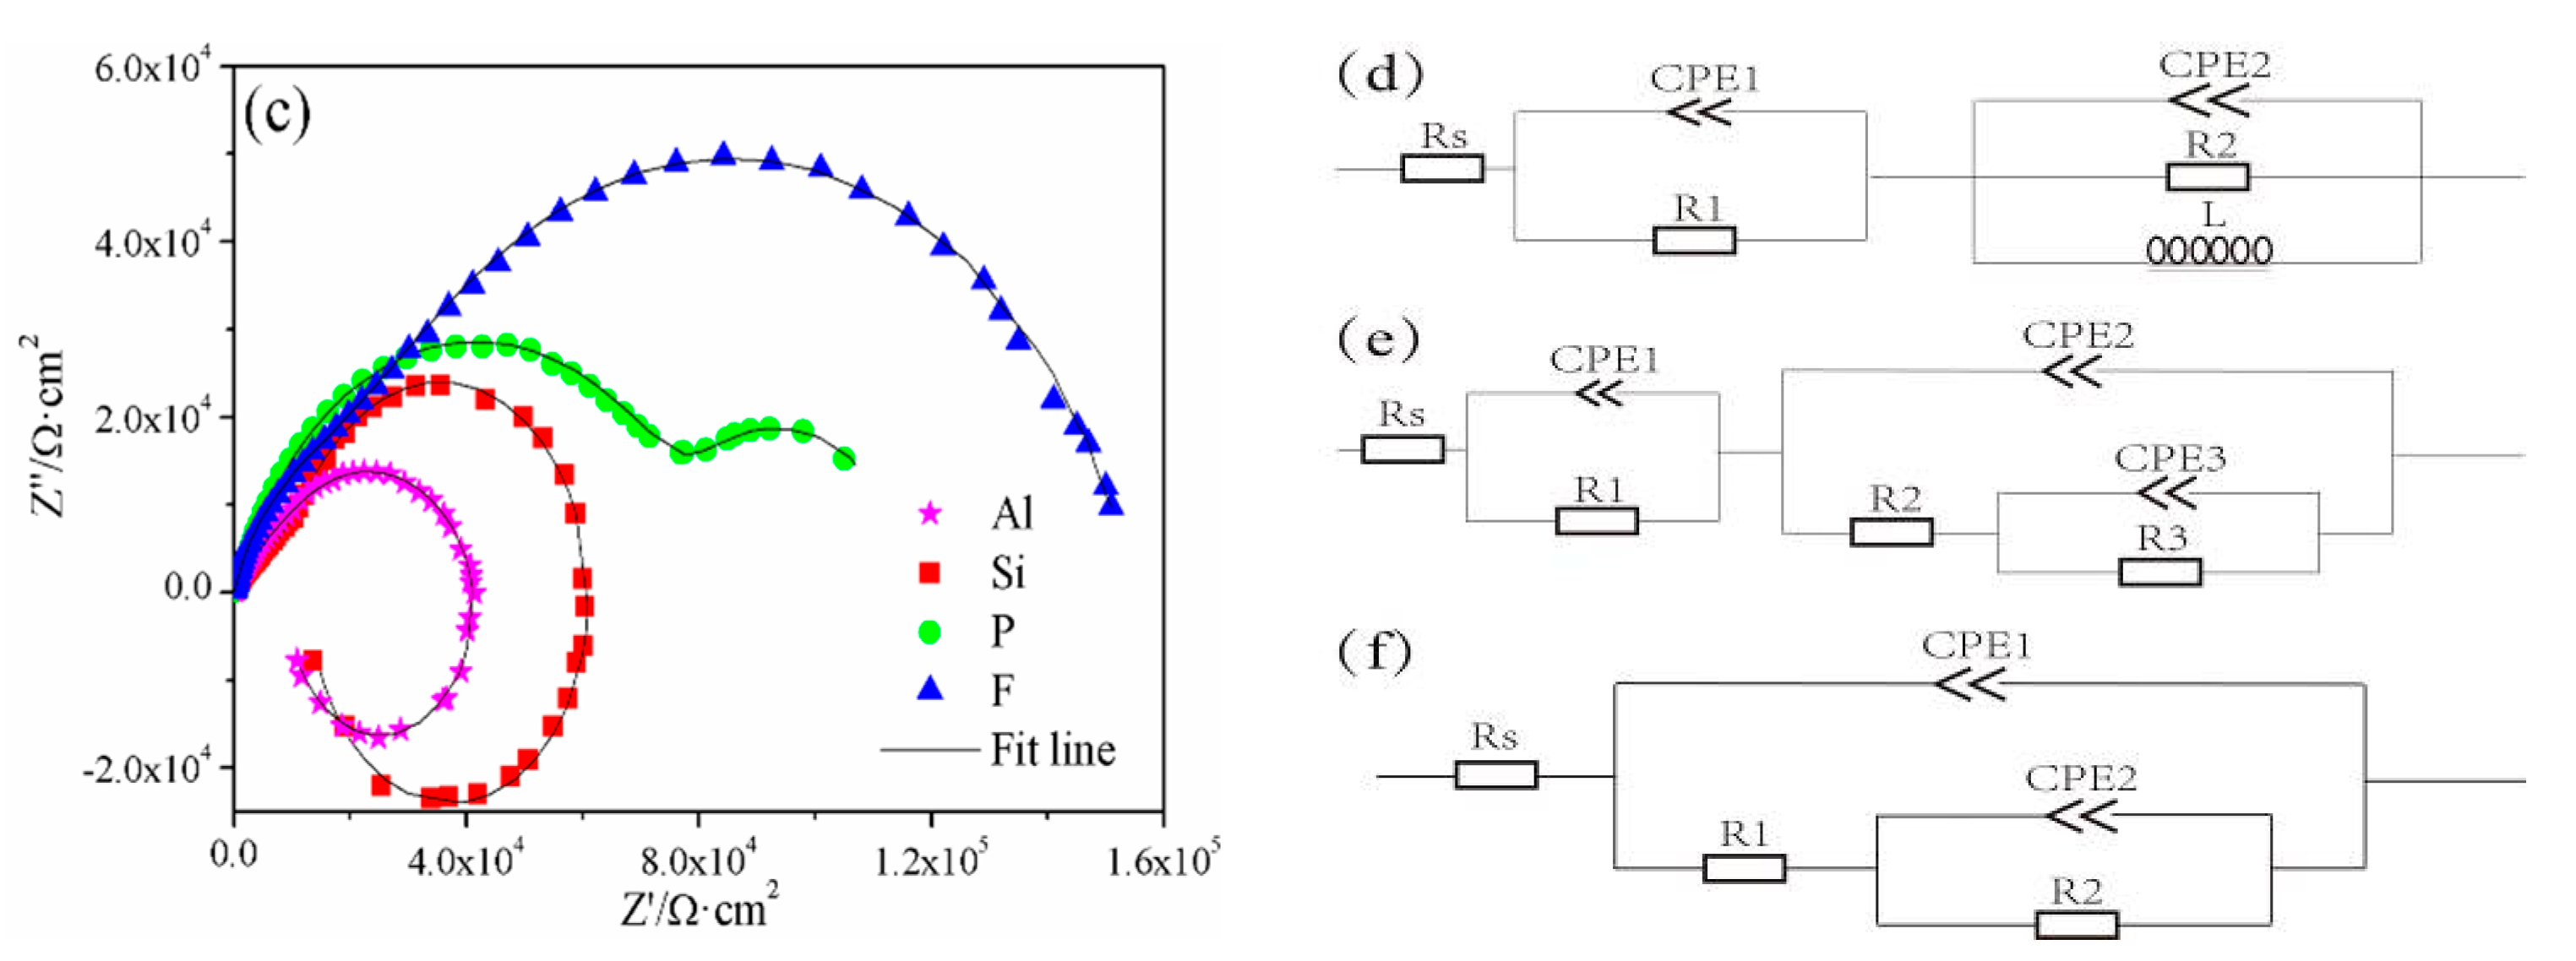
3.4. EIS Analysis of the PEO Coatings

The frequency–response characteristics of the PEO coatings were studied by conducting EIS tests over the samples in 0.1 M NaCl aqueous solution. Figure 8a–c show the Nyquist and Bode plots of the PEO-coated samples, respectively. The impedance data were best-fitted to the appropriate equivalent circuit model, Figure 8d–f are corresponding equivalent circuits of different coatings, Figure 8d equivalent circuit Rs(CPE1R1)(CPE2R2L) is the equivalent circuit of Al-coating and Si-coating, Figure 8e The equivalent circuit Rs(CPE1R1)(CPE2(R2(CPE3R3))) is the P-coating equivalent circuit, and Figure 8f the equivalent circuit Rs(CPE1(R1(CPE2R2))) is the F-coating Combined equivalent circuit, the parameters of each component of the equivalent circuit are shown in Table 1.
Three circuit connections, (CPE1R1), (CPE2R2) and (CPE3R3) are associated with three time constants. Rs is the resistance of the solution between the working and reference electrodes; CPE1 and R1 are the outer layer capacitance and resistance, respectively; CPE2 and R2 are the inner layer capacitance and resistance, respectively; and CPE3 and R3 are the double-layer capacitance and charge–transfer resistance, L in the equivalent circuit represents the negative loop of the Nyquist curve, respectively. Further, the choice of the suitable equivalent circuit was selected using various combinations of these elements and the circuit which best fit the experimental curve [33,34]. Here, a constant phase element (CPE) which reflects the surface distribution activity, roughness of the coating surface, electrode porosity, and distribution of current and potential on the electrode, is used [35,36]. ZCPE, the impedance of CPE is defined as [37]: Z CPE = [ Q ( j ω ) n ] 1 , where Q is the constant of the CPE element, jω is the complex variable for sinusoidal perturbations with ω = 2πf, and n is the exponent of CPE with values between −1 and 1.
The evolution of calculated values of the circuit elements (R1, CPE1, R2, CPE2, L, R3 and CPE3) with exposure time is represented in Table 1. Based on the EIS and morphology results above, the corrosion behaviors of the PEO coating for different electrolyte additives can be understood as described in the references [38,39,40].
Table 1 shows the parameter values of the equivalent circuit components of the AC impedance of the PEO samples obtained from different electrolytes. It can be seen that the fitting circuit parameters of different PEO samples are different. The R2 values of Al-coating and Si-coating are greater than the R1 value, indicating that the resistance value of the inner layer of the PEO sample is larger than that of the outer layer; the cross-sectional view shows many discharge holes and cracks in the outer layer of Al-coating and Si-coating, while the inner layer has fewer holes and cracks due to the more severe discharge. The inner layer has an important effect on the corrosion resistance of the sample. From the analysis of the two coating capacitance values (CPE) of Al-coating and Si-coating, it can be seen that the outer-layer capacitance value is not much different from the inner-layer capacitance value, indicating that the test liquid ions reach the interface between the inner and outer layers through holes and cracks. The inner layer and the outer layer of the ceramic layer exhibit the same ion adsorption capacity, so the capacitance values do not substantially differ. P-coating characteristics differ from those of the above two coatings, mainly showing that the value of R1 is larger and the value of CPE1 is smaller; that is, the outer layer has a larger resistance, and the capacitance value is smaller, indicating that in P-coating, the layer has a substantial impact on the corrosion resistance. From the parameters of the F-coating AC impedance, it can be seen that the resistance of the inner layer of the F-coating is much greater than the resistance of the outer layer. However, the cross-sectional line scan of the F-coating sample shows that MgF2 is mainly distributed in the outer layer of the ceramic layer. Further, the stability of MgF2 is higher than that of MgO, so the resistance of the inner layer of the F-coating is greater than the resistance of the outer layer. This can be explained as follows: the outer layer of the sample blocks the test liquid, making it difficult for the test liquid to enter the ceramic layer. Thus, the higher resistance of the inner layer of the F-coating results in greater protection.

4. Conclusions

In this study, the effects of electrolytes with different additives on the corrosion resistance and structural characteristics of PEO samples are analyzed by investigating the surface, cross-sectional morphology, elemental distribution of the surface and cross-sectional morphologies, phase compositions, and electrochemical studies. The experimental results show the following:
  • It can be seen that the Al-coating and Si-coating have the typical characteristics of PEO coating, such as discharge products, micropores and cracks. Filamentous and granular discharge products formed on the surface of Al-coating and Si-coating, respectively.
  • The ceramic layer formed by AlO2 exhibits the typical double-layer structure and SiO32− is more likely to participate in the formation of the PEO ceramic layer. The P-coating and F-coating show thin thicknesses but with high density.
  • The results showed that the additives directly affect the distribution of elements and the formation of phases. However, MgO and MgO2 constitute the common phases in the coatings; particularly, the phases MgAl2O4, Mg2SiO4, Mg3(PO4)2 and MgF2, resulted from the Al-coating, Si-coating, P-coating and F-coating, respectively. In addition, Mg2SiO4 and MgF2 are mainly distributed in the outer layer, while MgAl2O4 and Mg3(PO4)2 are mainly distributed in the inner layer of the coatings.
  • Although F-coating has a lesser coating thickness compared to Al-coating and Si-coating, the higher resistance of the inner layer is favorable for improving the corrosion resistance. Moreover, the results of the outer layer and charge–transfer resistance indicated that the corrosion resistance of the P-coating is similarly outstanding. On the other hand, Si-coating and Al-coating, which have higher coating thickness, showed lower corrosion resistance than F-coating and P-coating, which can be attributed to their more severe discharge cracks and holes.

Author Contributions

Experimental design and manuscript writing, Z.H. and R.W.; Microstructure and elemental composition analysis, X.L.; Phase detection and manuscript editing, D.W.; EIS data collection, H.Z.; V-t data collection and analysis, X.S.; Theoretical direction, D.S. and D.L. All authors have read and agreed to the published version of the manuscript.

Funding

This research was funded by National Natural Science Foundation of China (No. 51671167) and Hebei Province Natural Science Foundation of China (No.A2015203348).

Conflicts of Interest

The authors declare no conflict of interest.

References

  1. Mordike, B.; Ebert, T. Magnesium: Properties-applications-potential. Mater. Sci. Eng. A-Struct. Mater. Prop. Microstruct. Process. 2001, 302, 37–45. [Google Scholar] [CrossRef]
  2. Calado, L.M.; Taryba, M.G.; Morozov, Y.; Carmezim, M.J.; Fátima Montemor, M. Novel smart and self-healing cerium phosphate-based corrosion inhibitor for AZ31 magnesium alloy. Corros. Sci. 2020, 170, 108648. [Google Scholar] [CrossRef]
  3. Chaharmahali, R.; Fattah-Alhosseini, A.; Esfahani, H. Increasing the in-vitro corrosion resistance of AZ31B-Mg alloy via coating with hydroxyapatite using plasma electrolytic oxidation. Asian Ceram. Soc. 2020, 8, 39–49. [Google Scholar] [CrossRef]
  4. Song, G.-L.; Xu, Z. Effect of microstructure evolution on corrosion of different crystal surfaces of AZ31 Mg alloy in a chloride containing solution. Corros. Sci. 2012, 54, 97–105. [Google Scholar] [CrossRef]
  5. Song, G.-L.; Xu, Z. The surface, microstructure and corrosion of magnesium alloy AZ31 sheet. Electrochim. Acta 2010, 55, 4148–4461. [Google Scholar] [CrossRef]
  6. Song, G.-L. Effect of tin modification on corrosion of AM70 magnesium alloy. Electrochim. Acta 2009, 51, 2063–2070. [Google Scholar] [CrossRef]
  7. Liu, L.J.; Schlesinger, M. Corrosion of magnesium and its alloys. Corros. Sci. 2009, 51, 1733–1737. [Google Scholar] [CrossRef]
  8. Asada, H.; Komori, S.; Aoki, K.; Aoyama, K. Study on the high purity and Iron-Free magnesium and its alloys. J. Jpn. Inst. Light Met. 1958, 8, 65–73. [Google Scholar] [CrossRef] [Green Version]
  9. Inoue, M.; Iwai, M.; Matuzawa, K.; Kamado, S.; Kojima, Y. Effect of impurities on corrosion behavior of pure magnesium in salt water environment. J. Jpn. Inst. Light Met. 1998, 48, 257–262. [Google Scholar] [CrossRef] [Green Version]
  10. Nam, N.D.; Bian, M.Z.; Forsyth, M.; Seter, M. Effect of calcium oxide on the corrosion behaviour of AZ91 magnesium alloy. Corros. Sci. 2012, 64, 263–271. [Google Scholar] [CrossRef]
  11. Pu, Z.; Song, G.-L.; Yang, S.; Outeiro, J.C.; Dillon, O.W., Jr. Grain refined and basal textured surface produced by burnishing for improved corrosion performance of AZ31B Mg alloy. Corros. Sci. 2012, 57, 192–201. [Google Scholar] [CrossRef]
  12. Krawiec, H.; Stanek, S.; Vignal, V.; Lelito, J.; Suchy, J.S. The use of microcapillary techniques to study the corrosion resistance of AZ91 magnesium alloy at the microscale. Corros. Sci. 2011, 53, 3108–3113. [Google Scholar] [CrossRef]
  13. Gray, J.; Luan, B. Protective coatings on magnesium and its alloys-a critical review. J. Alloy. Compd. 2002, 336, 88–113. [Google Scholar] [CrossRef]
  14. Yerokhin, A.; Nie, X.; Leyland, A.; Matthews, A.; Dowey, S. Plasma electrolysis for surface engineering. Surf. Coat. Technol. 1999, 122, 73–93. [Google Scholar] [CrossRef]
  15. Blawert, C.; Dietzel, W.; Ghali, E.; Song, G. Anodizing treatments for magnesium alloys and their effect on corrosion resistance in various environments. Adv. Eng. Mater. 2006, 8, 511–533. [Google Scholar] [CrossRef]
  16. Gupta, P.; Tenhundfeld, G.; Daigle, E.; Ryabkov, D. Electrolytic plasma technology: Science and engineering-An overview. Surf. Coat. Technol. 2007, 201, 8746–8760. [Google Scholar] [CrossRef]
  17. Steinbeck, C.; Han, Y.; Kuhn, S.; Horlacher, O.; Luttmann, E.; Willighagen, E. The Chemistry Development Kit (CDK): An open-source Java library for chemo-and bioinformatics. J. Chem. Inf. Comp. Sci. 2003, 43, 493–500. [Google Scholar] [CrossRef] [Green Version]
  18. Ma, H.; Li, D.; Liu, C.; Huang, Z.; He, D.; Yan, Q. An investigation of (NaPO3)6 effects and mechanisms during micro-arc oxidation of AZ31 magnesium alloy. Surf. Coat. Technol. 2015, 266, 151–159. [Google Scholar] [CrossRef]
  19. Zhang, P.; Nie, X.; Northwood, D. Influence of coating thickness on the galvanic corrosion properties of Mg oxide in an engine coolant. Surf. Coat. Technol. 2009, 203, 3271–3277. [Google Scholar] [CrossRef]
  20. Ghasemi, A.; Raja, V.; Blawert, C.; Dietzel, W.; Kainer, K. Study of the structure and corrosion behavior of PEO coatings on AM50 magnesium alloy by electrochemical impedance spectroscopy. Surf. Coat. Technol. 2008, 202, 3513–3518. [Google Scholar] [CrossRef] [Green Version]
  21. Ghasemi, A.; Raja, V.; Blawert, C.; Dietzel, W.; Kainer, K. The role of anions in the formation and corrosion resistance of the plasma electrolytic oxidation coatings. Surf. Coat. Technol. 2010, 204, 1469–1478. [Google Scholar] [CrossRef] [Green Version]
  22. Snizhko, L.; Yerokhin, A.; Pilkington, A.; Gurevina, N.; Misnyankin, D.; Leyland, A.; Matthews, A. Anodic processes in plasma electrolytic oxidation of aluminium in alkaline solutions. Electrochim. Acta 2004, 49, 2085–2095. [Google Scholar] [CrossRef]
  23. Wang, H.-M.; Chen, Z.-H.; Li, L.-L. Corrosion resistance and microstructure characteristics of plasma electrolytic oxidation coatings formed on AZ31 magnesium alloy. Surf. Eng. 2010, 26, 385–391. [Google Scholar] [CrossRef]
  24. Zhang, R.-F.; Zhang, S.-F.; Xiang, J.H. Influence of sodium silicate concentration on properties of micro arc oxidation coatings formed on AZ91HP magnesium alloys. Surf. Coat. Technol. 2012, 206, 5072–5079. [Google Scholar] [CrossRef]
  25. Li, X.-X.; Liu, X.-Y.; Luan, B.L. Corrosion and wear properties of PEO coatings formed on AM60B alloy in NaAlO2 electrolytes. Appl. Surf. Sci. 2011, 257, 9135–9141. [Google Scholar] [CrossRef]
  26. Cao, F.-H.; Cao, J.-L.; Zhang, Z. Plasma electrolytic oxidation of AZ91D magnesium alloy with different additives and its corrosion behavior. Mater. Corros. 2007, 58, 696–703. [Google Scholar] [CrossRef]
  27. Chen, D.; Wang, R.-Q.; Huang, Z.-Q. Evolution processes of the corrosion behavior and structural characteristics of plasma electrolytic oxidation coatings on AZ31 magnesium alloy. Appl. Surf. Sci. 2018, 434, 326–335. [Google Scholar] [CrossRef]
  28. Durdu, S.; Usta, M. Characterization and mechanical properties of coatings on magnesium by micro arc oxidation. Appl. Surf. Sci. 2012, 261, 774–782. [Google Scholar] [CrossRef]
  29. Da Forno, A.; Bestetti, M. Effect of the electrolytic solution composition on the performance of micro-arc anodic oxidation films formed on AM60B magnesium alloy. Surf. Coat. Technol. 2010, 205, 1783–1788. [Google Scholar] [CrossRef]
  30. Zhang, R.-F.; Xiong, G.-Y.; Hu, C.-Y. Comparison of coating properties obtained by MAO on magnesium alloys in silicate and phytic acid electrolytes. Curr. Appl. Phys. 2010, 10, 255–259. [Google Scholar] [CrossRef]
  31. Wang, L.; Chen, L.; Yan, Z. Effect of potassium fluoride on structure and corrosion resistance of plasma electrolytic oxidation films formed on AZ31 magnesium alloy. J. Alloys Compd. 2009, 480, 469–474. [Google Scholar] [CrossRef]
  32. JCPDS-International Centre for Diffraction Data. Version 2.14. 1987–1994. Available online: http://www.icdd.com/ (accessed on 10 August 2020).
  33. Du, K.; Guo, X.; Guo, Q.; Wang, Y.; Wang, F.; Tian, Y. Effect of PEO coating microstructure on corrosion of Al 2024. J. Electrochem. Soc. 2012, 159, C597–C606. [Google Scholar] [CrossRef]
  34. Nocedal, J.; Wright, S.J. Springer series in operations research. In Numerical Optimization; Springer: New York, NY, USA, 1999. [Google Scholar] [CrossRef] [Green Version]
  35. Hussein, R.; Zhang, P.; Nie, X.; Xia, Y.; Northwood, D. The effect of current mode and discharge type on the corrosion resistance of plasma electrolytic oxidation (PEO) coated magnesium alloy AJ62. Surf. Coat. Technol. 2011, 206, 1990–1997. [Google Scholar] [CrossRef] [Green Version]
  36. Zhang, X.; Yao, Z.; Jiang, Z.; Zhang, Y.; Liu, X. Investigation of the plasma electrolytic oxidation of Ti6Al4V under single-pulse power supply. Corros. Sci. 2011, 53, 2253–2262. [Google Scholar] [CrossRef]
  37. Yao, Z.; Jiang, Z.; Xin, S.; Sun, X.; Wu, X. Electrochemical impedance spectroscopy of ceramic coatings on Ti-6Al-4V by micro-plasma oxidation. Electrochim. Acta 2005, 50, 3273–3279. [Google Scholar] [CrossRef]
  38. Zhang, Z.-Q.; Zeng, R.-C.; Lin, G.-G.; Wang, L.; Chen, X.-B.; Chen, D.-C. Corrosion resistance of self-cleaning silane/polypropylene composite coatings on magnesium alloy AZ31. J. Mater. Sci. Technol. 2020, 41, 43–55. [Google Scholar] [CrossRef]
  39. Chung, S.; Cheng, J.; Chiou, S.; Shih, H. EIS behavior of anodized zinc in chloride environments. Corros. Sci. 2000, 42, 1249–1268. [Google Scholar] [CrossRef]
  40. Xia, S.; Yue, R.; Rateick, R.; Birss, V. Electrochemical studies of AC/DC anodized Mg alloy in NaCl solution. J. Electrochem. Soc. 2004, 151, B179–B187. [Google Scholar] [CrossRef]
Figure 1. Voltage vs. time plots.
Coatings 10 00817 g001
Figure 2. Morphologies of plasma electrolytic oxidation (PEO)-coated AZ31 magnesium alloy. (a) Surface morphologies of Al-coating, (b) enlargement of framed region in (a), (c) surface morphologies of Si-coating, (d) enlargement of framed region in (c).
Coatings 10 00817 g002
Figure 3. Morphologies of PEO-coated AZ31 magnesium alloy. (a) Surface morphologies of P-coating, (b) enlargement of framed region in (a), (c) surface morphologies of F-coating, (d) enlargement of framed region in (c).
Coatings 10 00817 g003
Figure 4. Cross-sectional morphologies of PEO-coated AZ31 magnesium alloy. (a) Al-coating, (b) Si-coating, (c) P-coating, (d) F-coating.
Coatings 10 00817 g004
Figure 5. Chemical compositions of PEO-coated AZ31 magnesium alloy. Energy-dispersive spectroscopy (EDS) spectrum of framed region in Figure 2a,b and Figure 3a,b.
Coatings 10 00817 g005
Figure 6. Elements linear scanning analysis of the PEO coatings. (a) Al-coating, (b) Si-coating, (c) P-coating, (d) F-coating.
Coatings 10 00817 g006
Figure 7. X-ray diffraction (XRD) spectra of PEO coatings. (a) Al-coating, (b) Si-coating, (c) P-coating, (d) F-coating.
Coatings 10 00817 g007
Figure 8. Electrochemical impedance spectra of the PEO-coated samples (a,b) Bode plots; (c) Nyquist plots; (df) the equivalent circuit employed to fit the spectra.
Coatings 10 00817 g008aCoatings 10 00817 g008b
Table 1. Evolution of calculated values of the equivalent circuit elements in Figure 8.
SamplesR1
(kΩ·cm2)
CPE1
(S cm−2 s−n)
n1R2
(kΩ·cm2)
CPE2
(S cm−2 s−n)
n2L
(×105 ·H·cm2)
R3
(kΩ·cm2)
CPE3
(S cm−2 s−n)
n3
Al-coating8.892.080.6432.871.210.831.47------
Si-coating12.981.840.6248.391.340.961.45------
P-coating79.420.390.780.934.830.54--35.780.200.98
F-coating38.080.140.82121.90.560.74--------

