1. Introduction
Since the eighties, Cr martensitic steels with controlled impurity contents have drawn the attention of engineers and materials scientists for replacing austenitic stainless steels in structural applications in future nuclear fusion reactors [
1,
2,
3]. Reduced activation martensitic steels (RAMS) have been developed by substituting alloying elements such as Mo, Nb, Ni, and Co, which cause long-lived transmutation nuclides, with other elements, e.g., W, Ta, and V, leading to relatively short-lived transmutation nuclides. A review of the work done from early stages of RAMS to their more recent qualification for reactor design codes is reported in [
4]. A lot of research has been devoted to investigating topics such as activation, swelling, embrittlement, and creep resistance because the microstructural and mechanical stability at high temperature and under neutron irradiation is of utmost importance for this application.
The influence of austenitization temperature on martensitic transformation [
5,
6] and the effects of tempering on texture evolution [
7], micro-strains [
8,
9], and ductile to brittle transition temperature (DBTT) [
10] have been carefully studied by examining different RAMS. One of the critical issues in the use of the martensitic steels is the embrittlement induced by heat treatments because martensite decomposes into a Cr-rich α’ and a Cr-poor α phase with consequent progressive hardening and deterioration of fracture toughness [
11]. Such phenomenon depends on the Cr content of the alloy and strengthening increases with the size of α’ zones [
12].
Since Cr segregation affects many physical phenomena occurring in Fe-Cr or Fe-Cr-C alloys which have different industrial applications, the physical mechanisms and precursor stages are extensively studied. Li et al. [
13] investigated by means of atom probe tomography (APT) the C-Cr co-segregation at grain boundaries and found a concentration periodicity of ~7 nm. Through a cross-correlative precession electron diffraction–atom probe tomography investigation the Cr segregation in a Fe(Cr) nanocrystalline alloy was found to be dependent on grain boundary type [
14]. Segregation, precipitation, and phase separation in Fe-Cr systems have been analyzed by Kuronen et al. [
15], showing that the precipitation of Cr occurs into isolated pockets in bulk Fe-Cr alloys with Cr content higher than 10 at.%. Mirebeau et al. [
16] and Dubiel et al. [
17,
18,
19,
20] evidenced that short range order (SRO) develops in Fe-Cr alloys following prolonged heat treatments up to ~630 °C with a clustering tendency. To explain the corrosion behavior of Fe-Cr alloys Liu et al. [
21] considered the effect of SRO on establishing a percolation network of Cr atoms.
A relevant finding of Mechanical Spectroscopy (MS) investigations on Cr martensitic steels is the presence of C-Cr associates and clusters in as-quenched martensite [
22]. Small-angle neutron scattering (SANS) measurements showed that their size is <5 nm [
6]. The C-Cr associate distribution changes with quenching rate from austenitic field and evolves following heat treatments, leading in some cases to contiguous Cr-rich and Cr-poor zones, which affect both radiation resistance and fracture behaviour [
23,
24,
25]. Recently, an analytic study of such point defect structures (C-Cr associates) and of their role on Cr segregation has been carried out through MS experiments [
26].
Remarkable differences in fracture mode and DBTT have been observed in samples quenched from austenitic field with slow (150 °C/min) and fast (3600 °C/min) cooling rates, and successively heat treated at 700 °C for increasing time. The samples cooled with the slower rate exhibit a mixed mode of brittle fracture (quasi-cleavage plus inter-crystalline) whereas quasi-cleavage fracture is observed in samples cooled with the faster one. This was explained by the Cr enrichment at grain boundaries occurring in slowly cooled samples and favoured by the specific distribution of C-Cr associates after quenching [
27]. This represents an important achievement for better understanding the physical mechanisms governing the embrittlement of Cr martensitic steels, however there are some still open problems. Firstly, it is necessary to assess whether Cr segregation, even to a minor extent, occurs also in samples cooled with fast rate. The second problem is to clarify its role in the process of fracture in both ductile and brittle fields.
Moreover, recent X-ray photoelectron spectroscopy (XPS) analyses carried out on the fracture surfaces evidenced the segregation of Cr in both ductile and brittle (quasi-cleavage) fields [
28]. To shed more light on these aspects, the fracture behaviour of a Cr martensitic steel prepared in two different conditions, (1) as-quenched with cooling rate of 3600 °C/min and (2) quenched and annealed at 700 °C for 10 h, has been investigated through Charpy tests. Then, XPS measurements have been carried out on the fracture surfaces of probes broken in ductile and brittle field to assess possible variations of Cr content with respect to the mean value of the alloy.
2. Materials and Methods
The nominal composition of the examined martensitic stainless steel is reported in
Table 1.
According to ASTM A370, standard V-notched probes (55 × 10 × 10 mm3) for Charpy tests were manufactured from a 10 mm-thick plate. They were treated for 30 min at 1075 °C (austenitic field) then quenched with a cooling rate of 3600 °C/min, measured by a thermocouple put in direct contact with the probe surface. A set of probes were tested in as-quenched condition while another set was heated for 10 h at 700 °C.
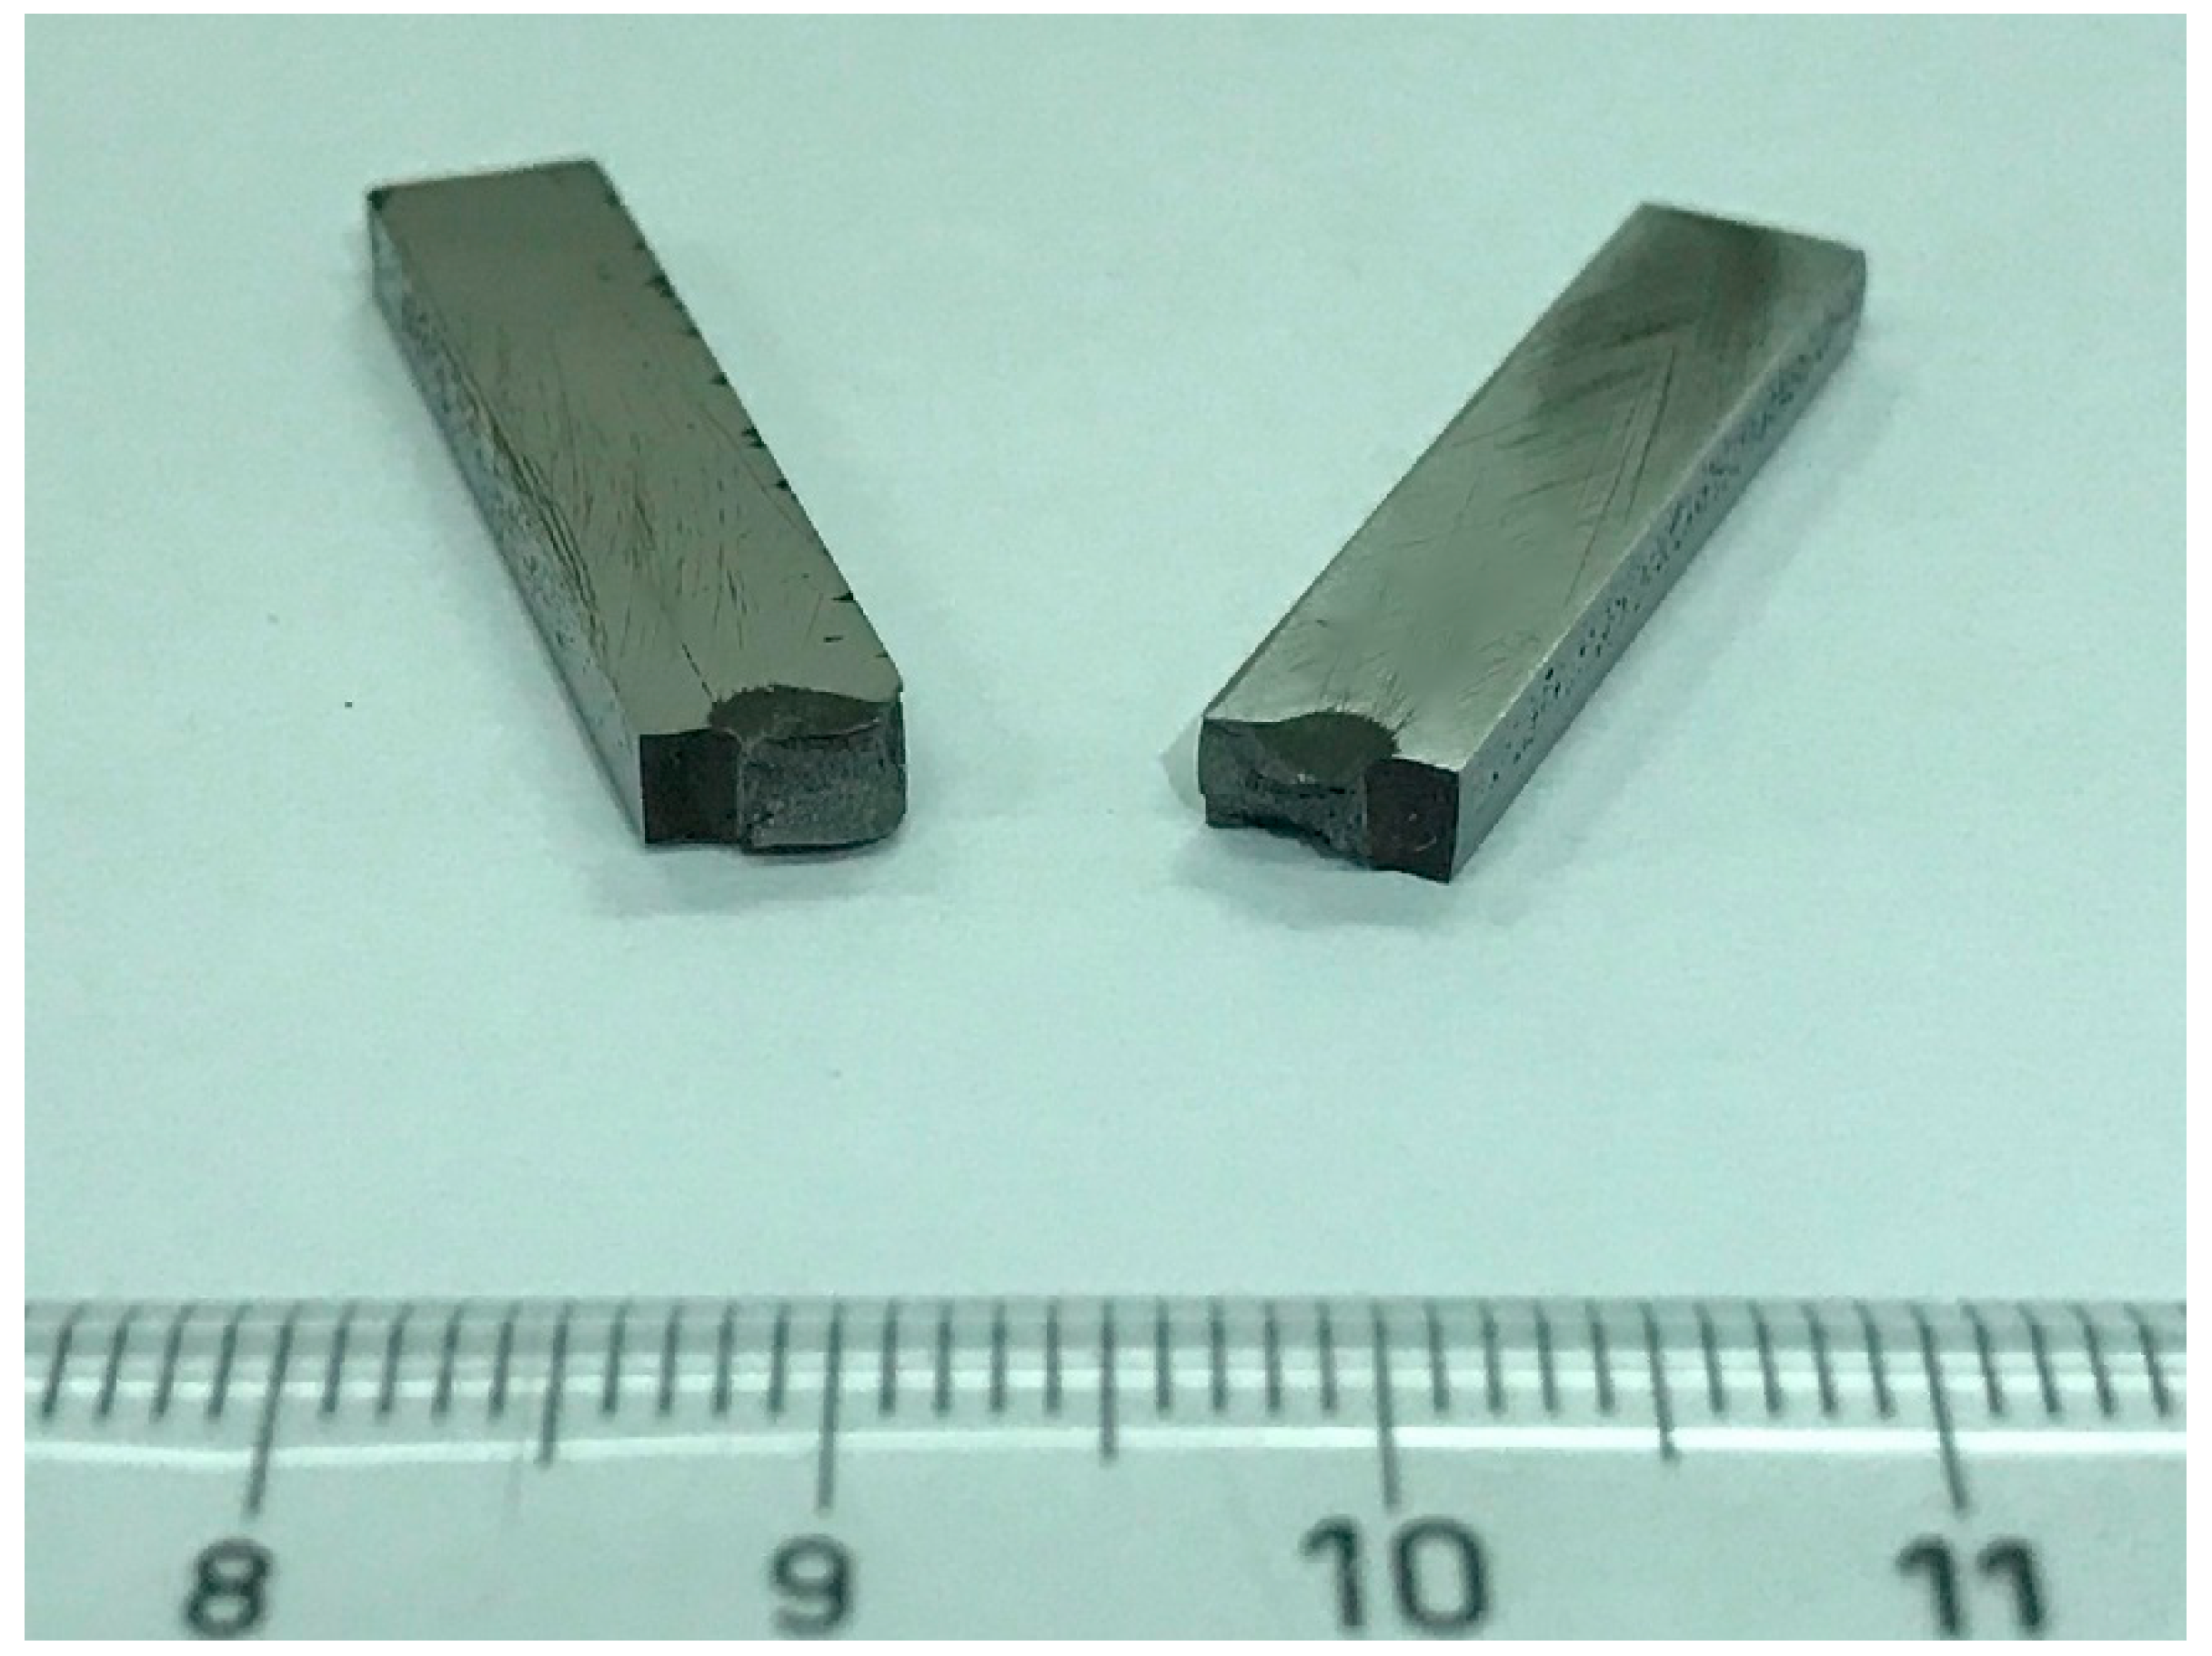
The Charpy tests were performed according to the UNI EN ISO 148-1:2016 [
29] standard in the temperature range from −100 to +150 °C. The image of a broken probe is displayed in
Figure 1 while the absorbed energy vs. test temperature is shown in
Figure 2. Each point in the graph is the mean value of five tests and the error bars represent the standard deviation. After fitting experimental data through sigmoidal curves DBTT was determined as the temperature corresponding to (USE + LSE)/2, where USE and LSE are the upper and lower shelf energies, respectively.
Table 2 reports the values of DBTT and USE determined from the curves in
Figure 2. After the heat treatment DBTT shifts towards lower temperatures, the change is ~40 °C.
The material structure after quenching and successive heat treatment has been investigated by scanning electron microscopy (SEM Hitachi SU70, Hitachi, Tokyo, Japan) and X-ray diffraction (XRD). XRD patterns of the most intense reflections have been collected (Philips, Eindhoven, The Netherlands) with the Mo-Kα radiation (λ = 0.071 nm) in step-scanning mode with 2θ steps of 0.005° and counting time of 10 s per step. In order to determine the fracture mode and possible effects of Cr segregation, the surfaces of the probes broken at different temperatures were examined by SEM and EDS microanalysis (Thermo Scientific 4443F, Madison, WI, USA).
The XPS measurements were carried out on the fracture surfaces of the two sets of samples. Because of excessive C contamination, before the analysis each sample was cleaned by the chemical etching at room temperature in a solution of HCl diluted to 12.3% for a duration of 30 s. The acid was then removed by washing the specimens with ultra-pure water in ultrasonic bath. The XPS experiments were performed by using an Escalab 250 Xi (Thermo Fisher Scientific Ltd., East Grinstead, UK) with a monochromatic Al X-ray source (hν = 1486.6 eV) at a spot size of 900 µm. The spectrometer was equipped with a hemispherical analyser and 6-channeltrons as a detector. The fracture surface of every sample was investigated in ultra-high vacuum (UHV), keeping the base pressure in the analysis chamber of about 10−10 mbar. The pressure was increased, when the Ar+ ion gun EX06 was turned on during the XPS depth profiling. The ion gun used for the Ar+ sputtering was operated at energy of 2 keV and beam current density of 2.5 mA cm−2. XPS regions were acquired at pass energy of 40 eV and standard electromagnetic lens mode, corresponding to ~1 mm in diameter of analyzed sample area. Moreover, multipoint analysis over the fracture surfaces was carried on in small-area lens mode, corresponding to 300 µm in diameter. The binding energy BE = 285.0 eV, corresponding to C1s peak of adventitious carbon, was used for the scale calibration. The spectra were acquired and processed by Avantage v.5 software, where the smart mode background subtraction was applied for quantitative analysis.
A numerical model was developed using Sysweld
® code to investigate the thermal gradients within the sample during the imposed rapid cooling. Thermal properties were taken as a function of temperature and phases (
Figure 3a). The austenitic to martensitic transformation was modelled using the well-known Koistinen-Marburger equation [
30,
31] with martensite start temperature set equal to 375 °C. The numerical model, shown in
Figure 3b, consisted of 14,000 linear finite elements.
The temperature at nodes belonging to the external surface was made to vary from 1075 °C to room temperature with a constant cooling rate of 3600 °C/min (boundary condition).
3. Results and Discussion
It is well known that C and impurities like P are site competitors, thus the free C atoms tend to suppress P segregation at grain boundaries and consequently intergranular embrittlement. Since Cr or other carbide-forming elements decrease the concentration of free C in the steel matrix, it is reasonable to expect high impurity grain boundary segregation in an alloy with Cr content > 11 wt.%. In the examined steel, P content is very low (0.005 wt.%) to avoid specific embrittlement; the P rich χ-phase was found to nucleate during proton irradiation at pre-existing NbC precipitates [
32], however P segregation after heat treatments at 700 °C is not reported in literature. Therefore, the attention of present work is focused on Cr segregation.
The microstructural evolution induced by heat treatments is displayed in
Figure 4. After quenching, the steel is fully martensitic and exhibits a typical martensitic structure consisting of laths organized in packets; each prior austenitic grain (PAG) contains several packets. After the heat treatments, the laths disappear, M
23C
6 (M = Cr, Fe) carbides form decorating PAGs and the interfaces between previous laths. The mean chemical composition (wt.%) of M
23C
6 carbides is C 6%, Cr 65%, and Fe 29%. Since the carbide precipitation is substantially completed after 2 h at 700 °C, no remarkable difference is observed between the samples treated for 10 h. The Cr profiles in the images of
Figure 4 do not show a specific trend but only fluctuations from point to point. Such Cr fluctuations are of the order of 7–8 wt.%.
Table 3 reports the line breadths β(2θ) of the most intense XRD reflections, namely {110}, {200} and {211}. In general, the β(2θ) is progressively decreasing after the heat treatments due to the recovery of dislocation structures forming during the martensitic transformation consequent to the quenching from austenitic field.
Figure 5 shows the fracture surfaces of the probes broken in Charpy tests in brittle and ductile field. The surfaces of the probes broken in brittle field exhibit the typical morphological features of quasi-cleavage fracture mode consisting of flat or slightly concave facets that arise from individual micro-cracks. They form independently and propagate through the material until coalesce. Tear ridges are observed in the zones, where the rupture of metal ligaments between different micro-cracks occurs leading to their coalescence (see the sketch in
Figure 6). The fine steps inside each facet form when the propagating crack crosses groups of dislocations.
In the fracture surfaces of the samples heated at 700 °C, several carbides are present and the zones, where the detachment of metal from carbides occurs, act as preferred nucleation sites for micro-cracks.
In the case of the ductile fractures, the dimples are the main characteristic. After heat treatment the dimple size shifts to larger dimensions but the morphology does not change; in addition, cracked M
23C
6 carbides (indicated by arrows in
Figure 4) are observed inside the dimples.
The fracture surfaces of the two sets of samples have been investigated by XPS measurements. The spectra of whole Fe 2p and Cr 2p regions were acquired, but only the principal 2p
3/2 peaks were taken into account for the qualitative and quantitative analysis in order to simplify the peak fitting procedure and to increase the accuracy of quantification.
Figure 7 shows the Fe 2p
3/2 and Cr 2p
3/2 peaks of the XPS spectra measured on the fracture surfaces of as-quenched steel in both brittle (a,b) and ductile fields (c,d).
The attribution of oxidation states for the components of Cr and Fe peaks was carried out after the “smart” background subtraction. The components of Fe 2p
3/2 spectra (see
Figure 7a,c) were the following: the first peak A at BE = 707.0 eV corresponding to metallic Fe
0, peak B at BE = 708.9 eV corresponding to oxidized iron state Fe
2+ and two other components C at BE = 710.6 eV and D at BE = 711.9 eV corresponding to iron states Fe
3+ in oxide and hydroxide, respectively [
33,
34]. The last fitted component E at BE = 713.6 eV is a satellite peak, typical for the Fe oxides. Additionally, the Cr 2p
3/2 spectra (see
Figure 7b,d) had a metallic component A at BE = 574.3 eV and two components of Cr
3+ states in oxide and hydroxide at BE = 576.8 eV (B) and BE = 578.2 eV (C), respectively [
35]. All the components of Fe 2p
3/2 and Cr 2p
3/2 spectra, the quantitative weight percentage and respective chemical states are reported in
Table 4 and
Table 5.
The same chemical states of Fe and Cr were present in all the fracture surfaces analysed, but the relative intensity of the metallic component with respect to oxide was changing. The intensity of metal and oxide components was very variable: these changes were found not only in different samples but also on different points of the same sample surface. Therefore, the overlayer of segregated Cr on the fracture surface layer is quite thin and not always homogeneously distributed. This result was visible from the comparison of the intensity between the Fe2p
3/2 components. In fact, in some specific surface areas, where the content of Cr was higher, the metallic Fe peak at BE = 707.0 eV had the same intensity of oxide component at BE = 710.6 eV. In the cases where the amount of Cr was lower, the metallic Fe
0 component was less intense than the oxidized one (see
Figure 7c,d). Therefore, it could be assumed that metallic Fe
0 on the surface is covered by a thin Cr film. Since the XPS measurements are extremely sensitive to the surface, the Cr overlayer must be quite thin (less than about 10 nm) for the registration of Fe 2p signal from metallic Fe
0.
This hypothesis was also confirmed by the results of XPS depth profiles carried out on a surface area of 1.5 × 1.5 mm
2 with Ar
+ sputtering cycles of 30 s at ion energy of 2 keV. From these profiles (
Figure 8) it was estimated that the Cr-rich overlayer has a mean thickness of few nanometers in all the samples, independently on the test temperature or treatment time. Just a very short Ar
+ sputtering was enough for the complete removal of segregated Cr. In fact, after about 70–80 s of ion sputtering, the Cr signal is strongly reduced for any type of analysed fracture surfaces. From these results, it was possible to estimate the thickness of Cr overlayer. By using the calibrated sputtering rate of 0.17 nm/s, it was calculated that after 70–80 s of sputtering an overlayer of approximately 12–13 nm was removed from the surface. Unfortunately, this time-to-depth conversion is not very accurate, because it refers to ideal conditions, where the sample has a flat surface, whereas the steel fracture surfaces, especially those obtained in ductile field, were very irregular with the result of a shadowed sputtering effect, i.e., a non-uniform sputtering of the fracture surface [
36]. For this reason, it is more correct to report the depth profiles in time scale, remembering that the thickness of Cr overlayer is over-estimated in the above calculation.
To determine the Cr distribution, small-area (diameter of 300 µm) XPS line scans have been carried out across the fracture surfaces of probes broken in ductile (+100 °C) and brittle (−50 and −100 °C) fields. As shown in
Figure 9a–c displaying the content (wt.%) of Fe and Cr in different positions, the Cr distribution is much more homogeneous in the probes broken in ductile than in brittle field. It is evident that a strong Cr segregation is present at the centre of the brittle fracture surfaces (black line), of as-quenched and heat treated probes, whereas in the case of ductile fractures (red line) the Cr content is almost constant through the whole surface.
From the quantitative analysis of Fe 2p
3/2 and Cr 2p
3/2 peaks, it was observed an excess of Cr on the fracture surface of all the samples. This phenomenon is much stronger for the fractures obtained in brittle field, where about 40 wt.% of Cr was observed, however Cr is always higher than 20 wt.% also in ductile field, namely well above the value (10.5 wt.%) of the steel nominal composition. These results are different from the Cr line scans obtained by EDS and reported in
Figure 4, because the analysis depths of the two techniques are quite different. The maximum information depth of XPS is about 10 nm whereas in EDS it is in the micrometric scale and representative of the bulk value.
To verify whether the Cr enrichment evidenced by line scans of
Figure 9a–c, is a specific feature of the fracture paths or, on the contrary, it is somehow connected to a macro-segregation phenomenon of the probes, the tests were also carried out under the same conditions on 6 different points of the flat surface of a probe cross-section after mechanical polishing (see
Figure 9c). The average content of Cr was calculated to be of 10.6 ± 0.3 wt.%, corresponding to an experimental error less than 5% and, consequently, less than 10% for what concerns the Fe/Cr ratio. From the data in
Figure 9c, it is evident that there is no macro-segregation because the contents of Fe and Cr do not depend on the position, are nearly constant, and correspond to the nominal values of the steel composition. So, these results showed that the XPS data are extremely repeatable, consequently, the calculated values of the Fe/Cr ratio, were in any case lower than the nominal ratio, after adding the experimental error. Therefore, the profiles in
Figure 9a,b are specific of the fracture paths which advance through the material along the way of minor resistance, namely through the zones with higher Cr content.
In order to deepen the Cr segregation phenomenon, the thermal gradients within the probe during cooling were determined via numerical simulation. For example,
Figure 10 shows the profiles of temperature through a Charpy probe after a given time of cooling (t = 1.39 min) as well as the corresponding distribution of martensite volume fraction. The inner part of the probe experiences a slower cooling than the surface thus the martensitic transformation starts at the surface and then moves to the inner part of the probe. In
Figure 10b, the external part consists of martensite (red color), the inner part of austenite (blue color), while in the middle there is the presence of both the phases in different fractions depending on the distance from the surface. At room temperature the predicted microstructure is fully martensitic as in the real sample.
The thermal histories captured by two virtual probes located in the center (point A) and on the surface (point B) of the cross section in correspondence of the notch are shown in
Figure 11. The temperature inside the specimen (point A) during cooling is used to estimate the Cr diffusion distances close to the center of fracture surface.
In the conditions of present experiments, the random walk (
RW) of C and Cr atoms at the surface and in the internal part of Charpy probes was calculated vs. time on the basis of the trends reported in
Figure 11. The calculation was made only for the austenitic phase because RW is negligible after the martensitic transformation at 375 °C. This permits also to neglect the Cr partitioning between austenite and martensite occurring in steels during isothermal treatments (e.g., see [
37]).
RW for the temperature
T and time t is given by:
where
D is the diffusion coefficient. The diffusion coefficients of
C and
Cr in austenite were determined according to the following expressions:
being
R the gas constant (= 1.987 [cal mol
−1 K
−1]). The RW values of C and Cr in points A and B plotted in
Figure 12a,b were determined by integrating Equation (1) with time steps
dt of 0.06 s.
Of course, RW of C is always higher than that of Cr, however the most interesting result is the significant difference for both the elements between external and internal parts. In fact, the internal part of Charpy probes undergoes a slower cooling which allows a longer diffusion path of C and Cr atoms. Several experimental [
15,
18,
19,
20,
21] and simulation [
15,
20] works give clear evidence of the clustering tendency in Fe-Cr alloys which decreases as temperature increases, however MS measurements [
5] and Monte Carlo simulations [
24] showed that some Cr atoms aggregation occurs also in austenitic field, in particular C-Cr associates [
22,
26] act as preferred sites for the clustering of Cr atoms. It is evident that higher RW values involve favorable conditions for Cr atoms aggregation. As shown by
Figure 9c, the formation of Cr enriched zones does not take place on a macroscopic scale otherwise it would be detected also on the polished surface of the probes but only on a microscopic scale.
In order to highlight the effects of Cr clustering on impact behaviour, the ratio Fe/Cr of the mean values (wt.%) measured on the fracture surface of all the samples has been calculated. From the nominal composition of steel, this ratio is 8.2 in the bulk material, whereas its value is noticeably lower for all the fracture surfaces, as shown by the plots in
Figure 13.
The graphs of Fe/Cr ratio vs. test temperature are somehow similar to the sigmoidal curves of absorbed energy displayed in
Figure 2. For both the probe sets, the surfaces originated from brittle fractures exhibit a higher Cr content than the ductile ones, however the Fe/Cr ratio is always rather far from the value corresponding to the chemical composition of the steel. The fracture surfaces are always enriched in Cr and this means that the microscopic Cr enriched zones represent a preferred path for cracks in both modes of fracture (brittle and ductile).
Line scans (
Figure 9) and mean Fe/Cr values (
Figure 13) do not show relevant difference of Cr concentration in the surfaces resulting from ductile fractures of probes with and without heat treatment, while a little difference is observed in brittle field. In Fe-Cr alloys, the Mȍssbauer measurements [
20] indicate a decreasing trend of short-range ordering (SRO) parameter as temperature increases, however there is still a tendency to Cr clustering up to 700 °C. Therefore, the heat treatment (10 h at 700 °C) is not suitable to achieve the homogeneous Cr distribution in the steel matrix. A part of Cr atoms (~2.5 wt.%) [
30] forms carbides (see
Figure 3) but remaining Cr atoms are not uniformly distributed.
Previous works [
10] on the same steel slowly cooled from austenitic field (150 °C/min) showed that a mixed mode of fracture (quasi-cleavage plus inter-crystalline) occurs and EDS measurements evidenced Cr segregation in the areas of inter-crystalline fracture. This is in agreement with the theoretical work of Seah [
38] and with experimental investigations on steels of similar composition [
39] and more generally on Fe-Cr alloys [
40]. The embrittlement due to grain boundary segregation is the sum of effects due to bond-breaking, chemical interactions, and atomic size effects [
41]. In the conditions of faster cooling rate (3600 °C/min) examined here, the steel does not exhibit inter-crystalline fracture mode, however XPS results indicate that Cr segregation plays a role also in other modes of fracture including quasi-cleavage and ductile fractures.
No papers report specific XPS studies on the fracture surfaces of this material and, more in general, the literature is lacking in publications dealing with micro-chemical analyses on Cr martensitic steels. In the past, Auger electron spectroscopy (e.g., see [
42,
43,
44]) has been used for studying high temperature embrittlement but the examined materials had a much higher P content than the steel examined here and the attention was focused on the role of C and Cr in determining the P content in grain boundaries. More recently, an investigation carried out by means of Scanning Auger Microscopy (SAM) on the fracture mode of turbine blades before and after service life shows that there is change in brittle fracture mode from intergranular to transgranular induced by a Cr redistribution from grain boundaries towards grain interior [
44]. The mechanisms through which Cr segregation affects quasi-cleavage and ductile fracture modes are not yet completely clear and the topic deserves further investigation, therefore experiments are underway on sets of probes treated at increasing time at 700 °C.


 ,
, 


