Article

Optimization of the Corrosion Resistance of Electroless Ni–W–P Coatings on Magnesium Alloys by the Response Surface Methodology

1
Corrosion and Protection Laboratory, Key Laboratory of Superlight Materials and Surface Technology, Ministry of Education, Harbin Engineering University, Harbin 150001, China
2
Corrosion and Protection Division, Shenyang National Laboratory for Materials Science, Northeastern University, Shenyang 110819, China
3
College of Power and Energy Engineering, Harbin Engineering University, Harbin 150001, China
4
Technique Center, Tianjin Pipe Corporation, Tianjin 300301, China
5
Strategy and Planning Department, Offshore Oil Engineering Co., Ltd., Tianjin 300301, China
*
Authors to whom correspondence should be addressed.
Coatings 2021, 11(1), 18; https://doi.org/10.3390/coatings11010018
Submission received: 2 November 2020 / Revised: 14 December 2020 / Accepted: 14 December 2020 / Published: 25 December 2020

Abstract

:
Plating processes greatly affect the corrosion resistance of electroless Ni–W–P coatings on magnesium alloys. In the present research, the corrosion resistance of electroless Ni–W–P alloy-coated AZ91D magnesium alloy was optimized by the response surface methodology. The optimum technological parameters of the plating process were determined by establishing a quadratic regression model, and the influence of these variables and their interactions on the corrosion resistance of the coating was analyzed. The optimum technological parameters of the electroless plating process were nickel sulfate concentration = 20 g/L, sodium tungstate concentration = 15 g/L, sodium hypophosphite concentration = 30 g/L, bath temperature = 60 °C, and bath pH = 9.3. Under these conditions, the coating had the best corrosion resistance. Among the aforementioned five variables, sodium tungstate concentration had the most significant influence on the corrosion resistance of the coating. Different degrees of interactions among the variables greatly affected the corrosion resistance of the coating.

1. Introduction

Magnesium and its alloys are widely used in different industries because of their excellent mechanical and electronic performances [1], such as low density, high specific strength, high specific stiffness, outstanding shock absorption capacity, and good electromagnetic shielding effect [2]. Hence, they are extensively used in electronic communication products [3], biomedical devices [4], automobiles [5], and aerospace components [6]. However, the corrosion resistance of magnesium and magnesium alloys is extremely poor in aqueous solution and the atmospheric environment [7,8]. Electroless Ni–W–P plating has attracted great attention because it can significantly improve the hardness and wear resistance of magnesium alloys [9,10]. Ni–W–P alloy coating has excellent wear resistance and corrosion resistance, in the preparation of the coating on magnesium alloy surface can overcome the low hardness, prone to corrosion of magnesium alloys weaknesses, broadening the scope of the application of magnesium alloys in marine atmosphere environment. Therefore, this process has been constantly studied and improved [11,12,13,14,15,16]. However, owing to the high surface activity of magnesium alloys, it is difficult to plate matrix materials. Hence, the electroless plating process of magnesium alloys still needs to be improved [17,18].
Electroless plating process parameters have significant influences on the forming process of plating layers [19,20]. Any change of these parameters may lead to defects in plating layers or even cause difficulties in the forming process. Therefore, the range of each factor must be strictly controlled to ensure effective electroless plating. However, numerous factors affect the performance of electroless plating layers [21,22,23]. It is difficult to explain the interactions among these factors by optimizing the corrosion resistance of electroless-plated layers through traditional test design methods, such as orthogonal design test and full factor test [24].
Response surface method (RSM) is an important branch of experimental design used in the development of new processes and the optimization of their performances. RSM is a collection of mathematical and statistical techniques that are useful for the modeling and analysis of problems in which a response of interest is influenced by several variables [25,26,27]. In the current work, the corrosion resistance of electroless Ni–W–P alloy-coated AZ91D magnesium alloy was selected as the optimization process index by RSM and the failure time was considered the response value. Taking the influencing factors as independent variables (research variable) and the corrosion resistance of the coating as the dependent variable (response value), a functional relationship of multiple times was established. According to the established functional relationship, a response surface was formed in the value spaces of the independent variables. The established multivariate function was approximatively simplified to a quadratic regression Equation (1) [28]. According to the fitted quadratic regression equation, the response values of the studied variables were detected, in turn, optimal process parameters were obtained.
Y = β 0 + i = 1 n β i X i + i = 1 n β i i X i 2 + i < j n β i j X i X j
where Y is the response value, β0 is a constant, βi and Xi are the coefficients and items at a time, respectively, βii and X i 2 are the coefficients and items at second time, respectively, βij and XiXj are the coefficients and items during interactions, respectively.

2. Experiment and Method

2.1. Materials

AZ91D magnesium alloy was used as the experimental material, its chemical composition tested by inductively coupled plasma spectrometer (ICP), the result is presented in Table 1. The size of the sample was 30 mm × l5 mm × 8 mm. The surface of the sample was polished step by step with 400#, 1000#, and 2000# sandpapers to ensure the same surface roughness. A 2-mm diameter hole was punched at the upper edge of the sample for suspension in a bath.

2.2. Electroless Plating Process

The polished sample was first ultrasonically cleaned in acetone for 15 min, then washed by deionized water, and finally, cleaned with lye. NaOH and Na3PO4 were mixed in a certain amount to prepare an alkaline solution. The as-prepared alkaline solution was heated to 62 °C and then used to clean the magnesium alloy sample for 15 min. The magnesium alloy matrix then underwent an activation treatment for 15 s. The main components of the activation solution were H3BO3, NH4HF2, and H3PO4. The sample was electroless plated 30 min after activation, and the resultant coating was heat-treated at 200 °C, 2 h.

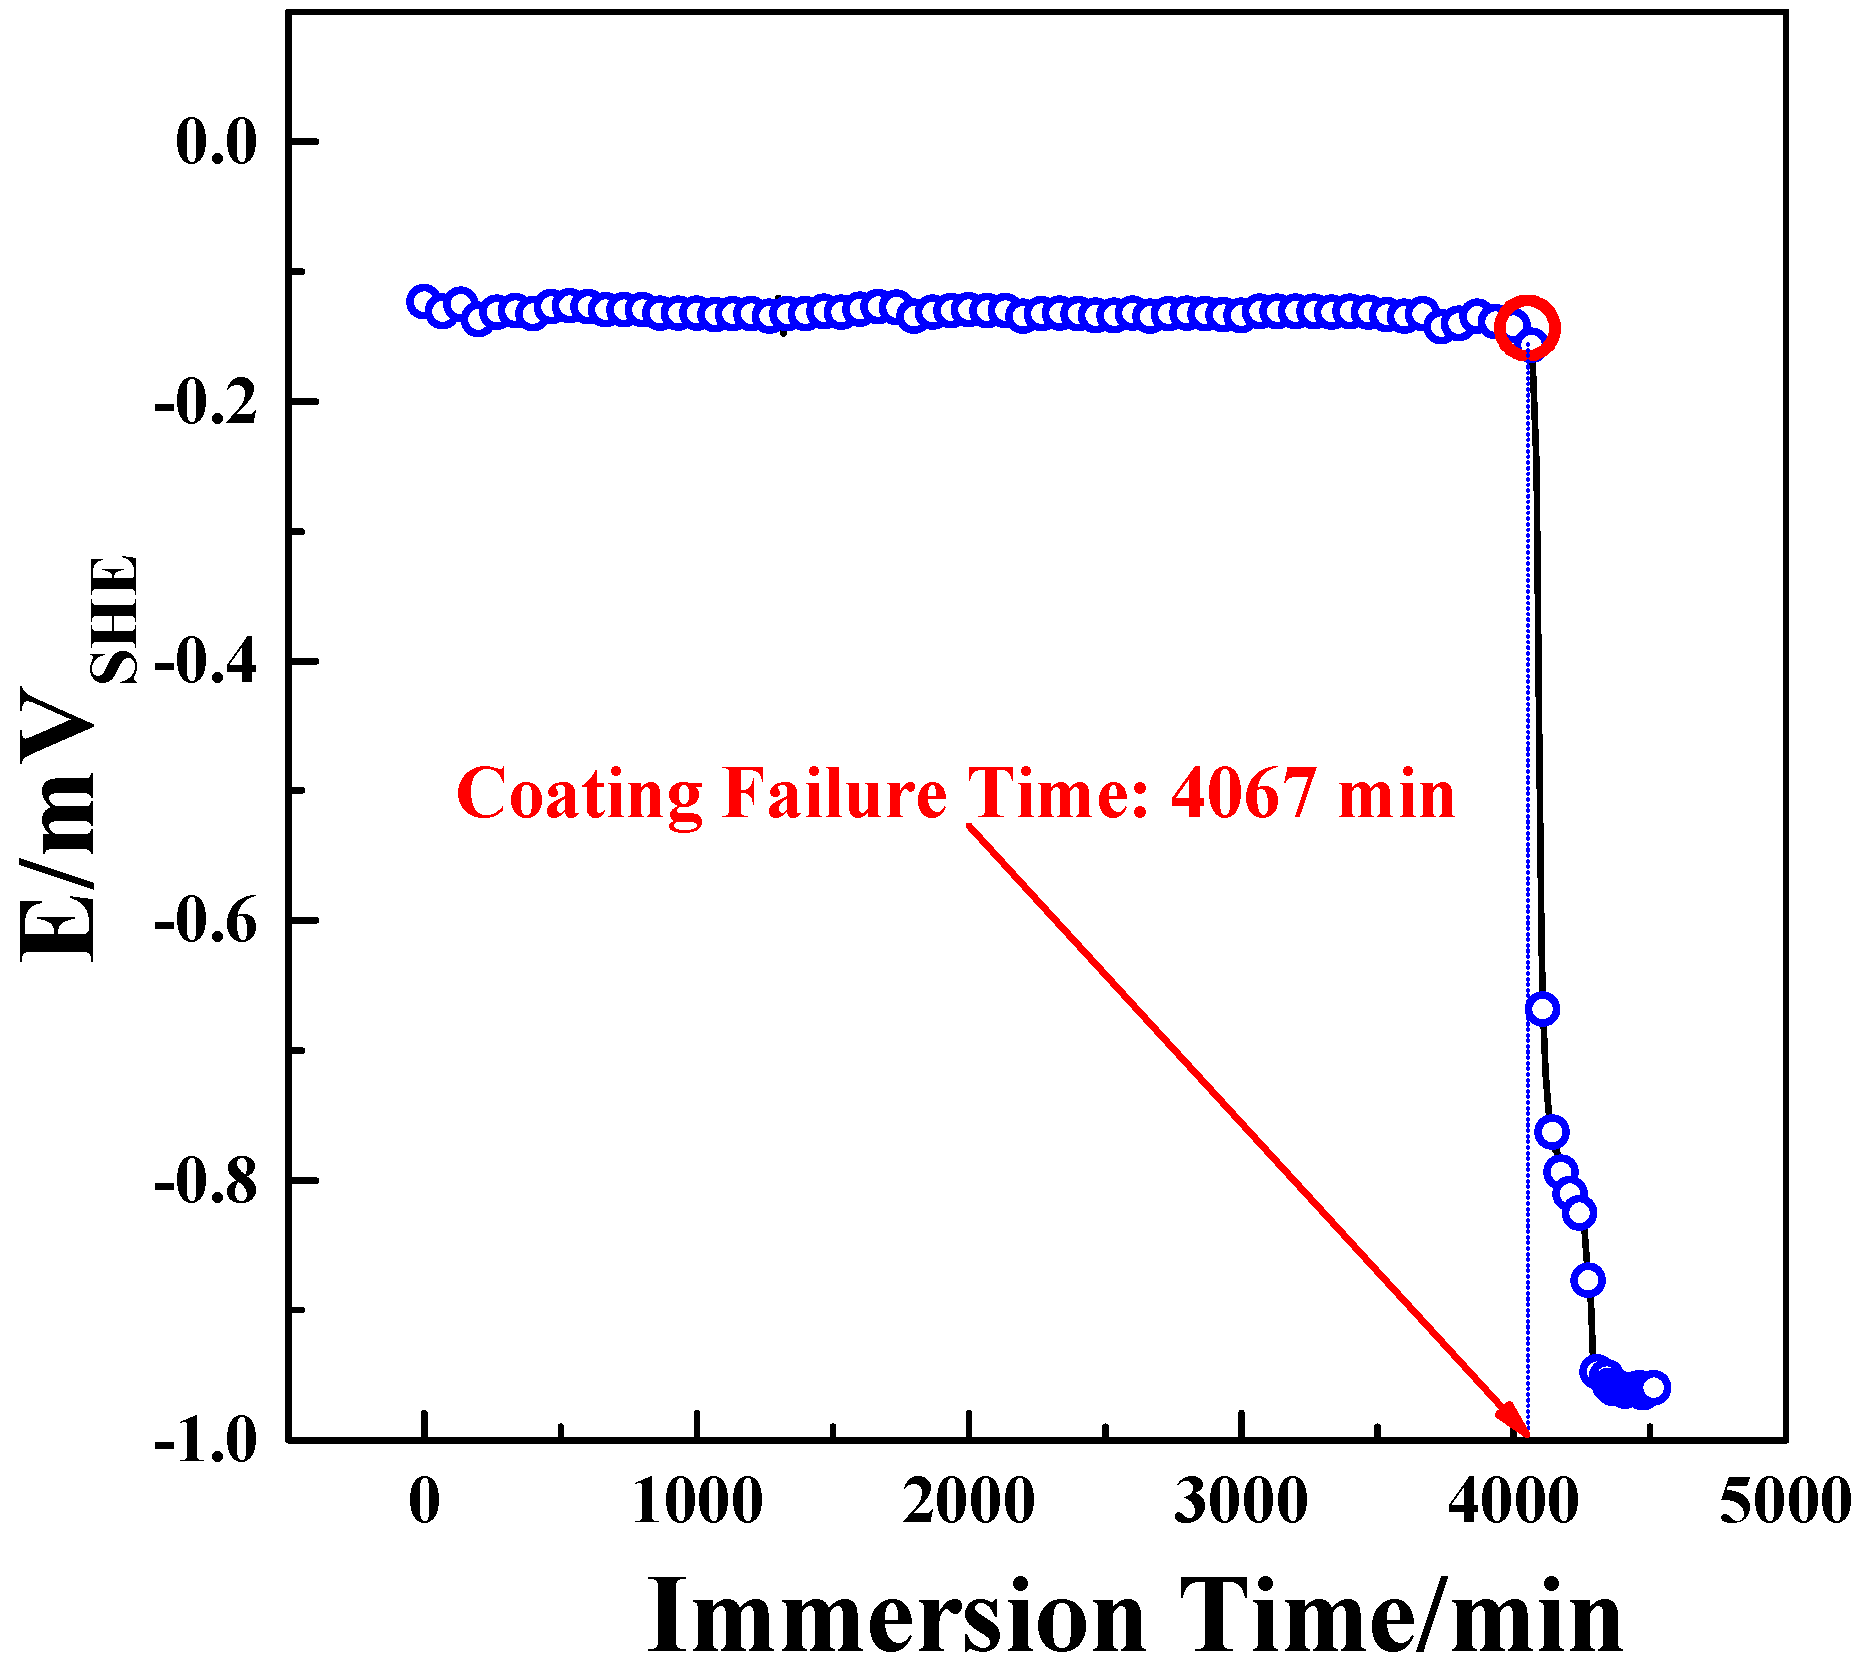
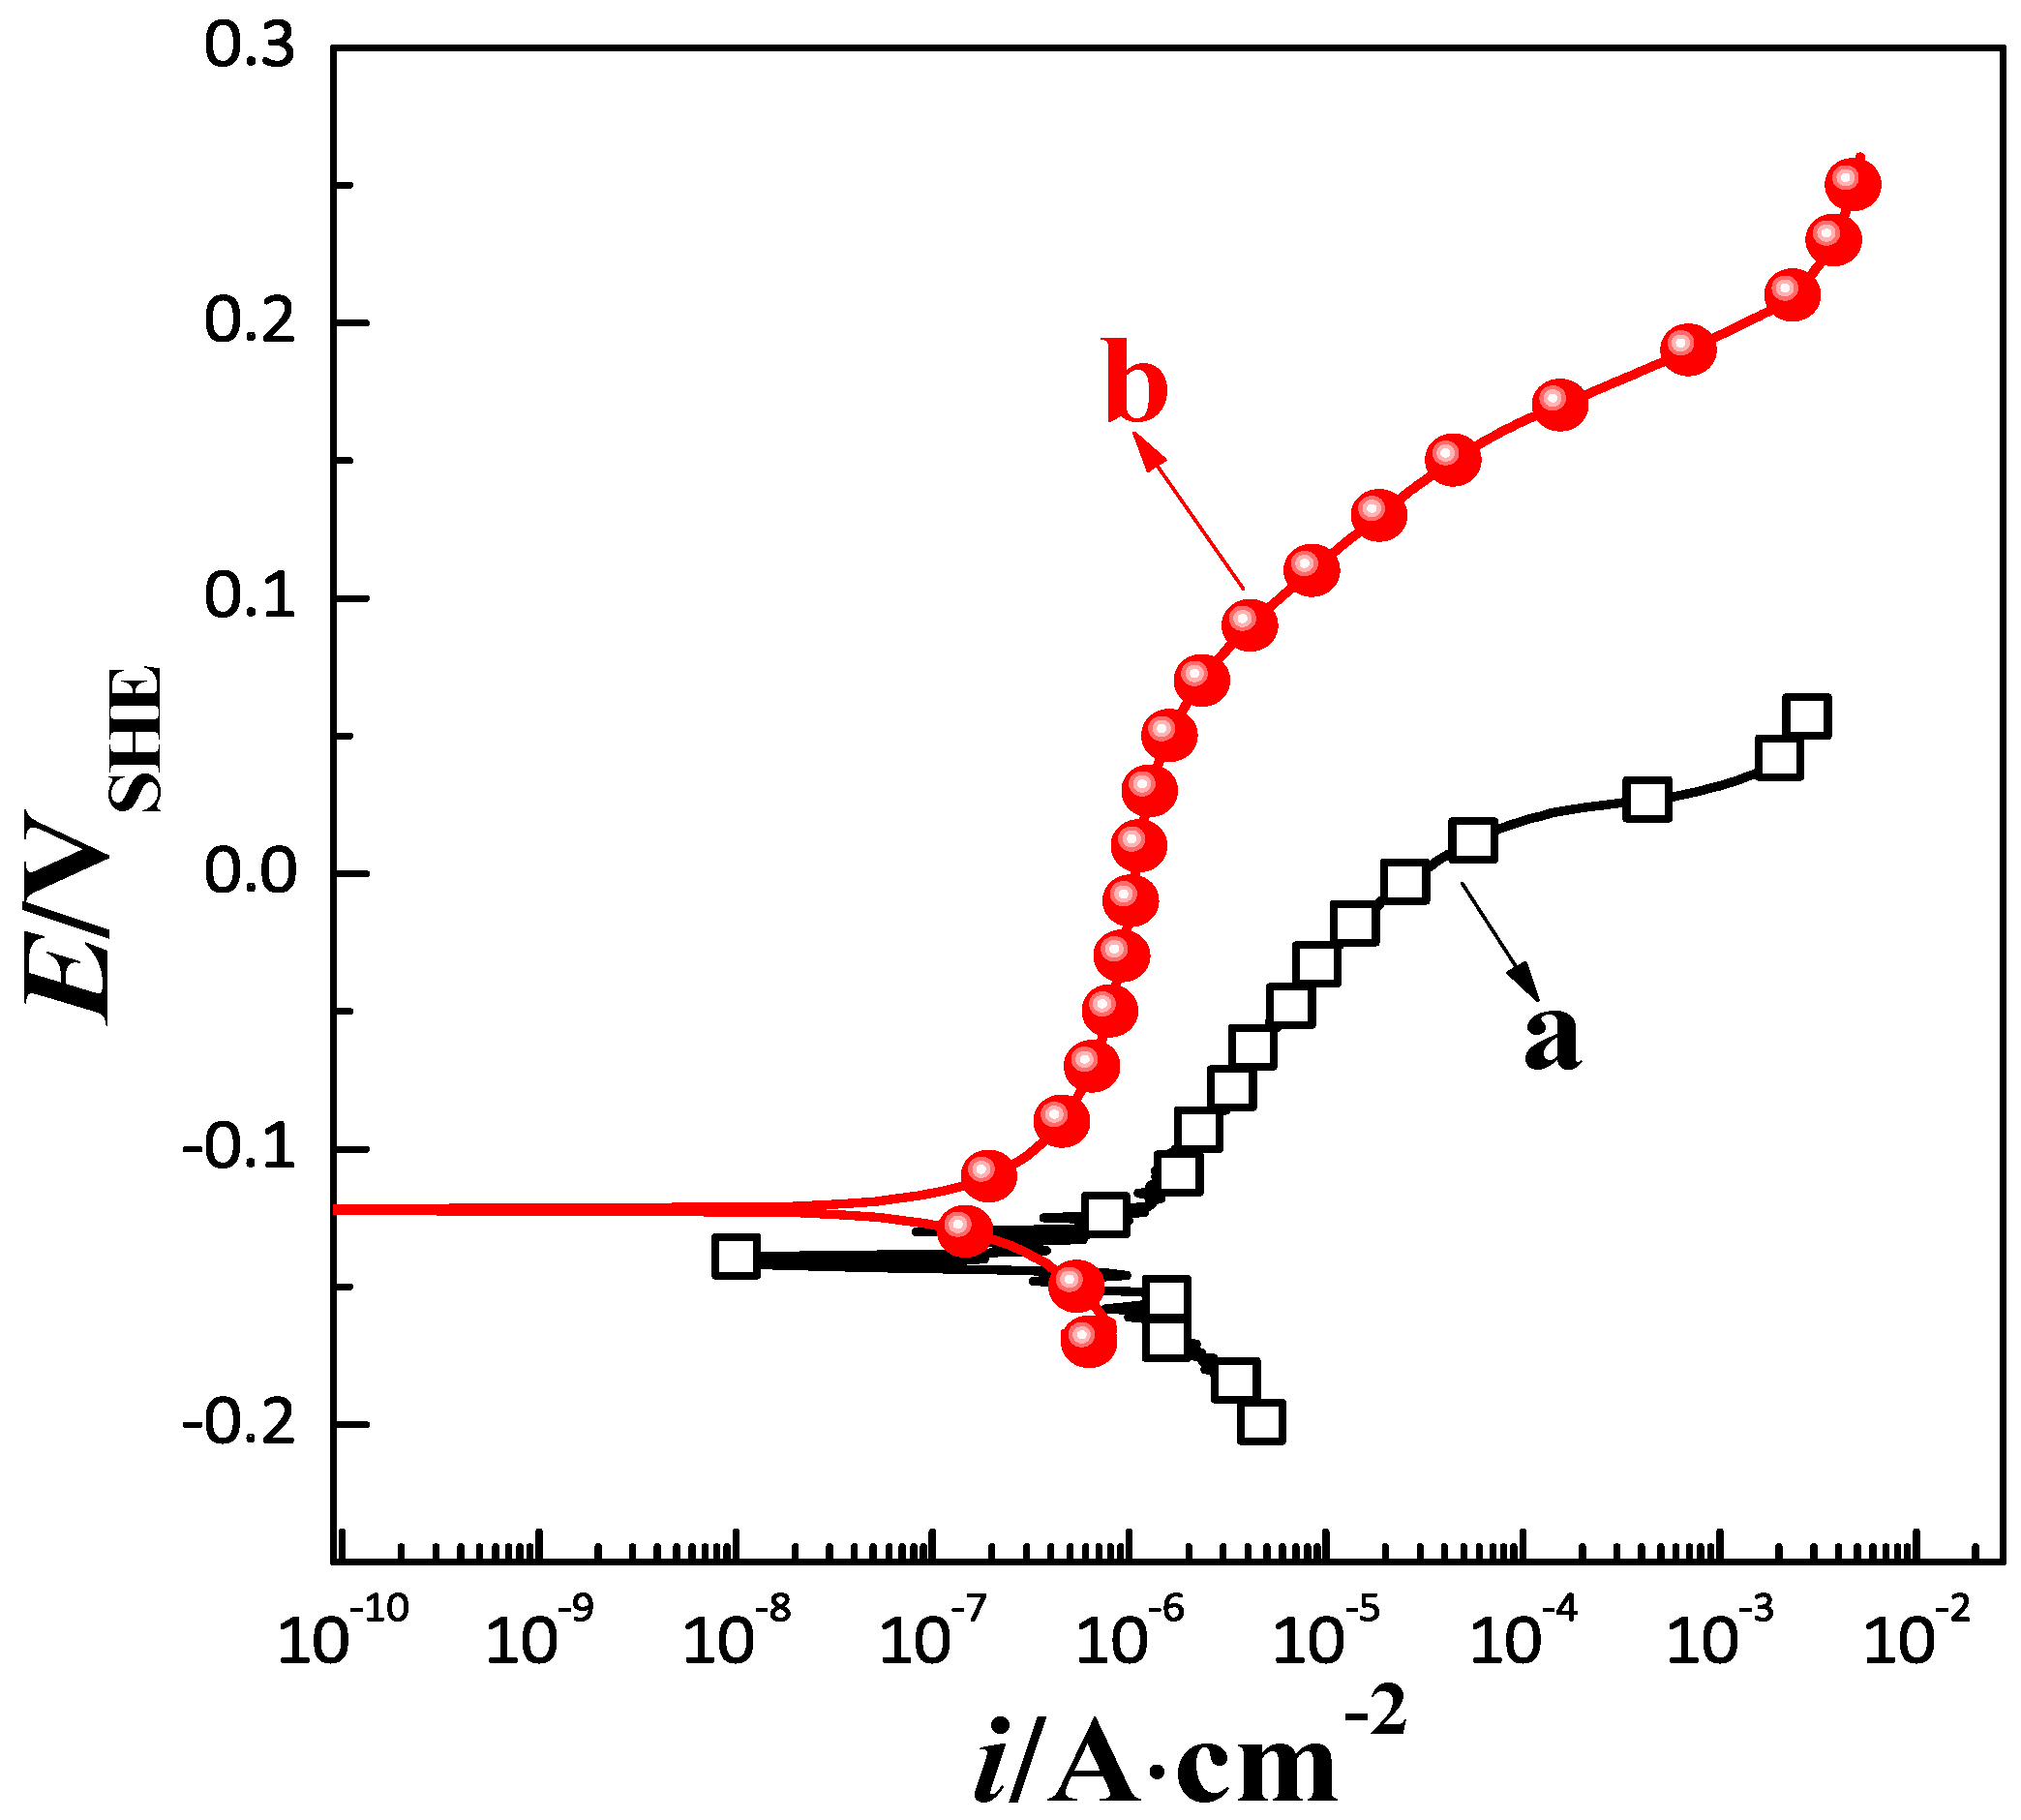
2.3. Corrosion Resistance Test

An IM6ex electrochemical workstation was used to test the potentiometric polarization curves and OCP. The three-electrode corrosion cell test system was used for corrosion electrochemical measurement. The reference electrode was a calomel reference electrode, the counter electrode used platinum sheet, and the work electrode used the Ni–W–P coating sample. During potentiometric polarization, scanning was started from the open-circuit potential of −300 mV and stopped when the current density exceeded 1 mA·cm−2 and the scanning speed was controlled at 0.333 mV/s. In this work, all corrosion tests are completed by IM6ex electrochemical workstation, and the electrochemical workstation manufacture by Zahner electrochemical company in Kronach, Germany.

2.4. Experimental Design of RSM

The central composite design (CCD) was adopted for RSM. Five process parameters—nickel sulfate concentration ((NiSO4; X1), sodium tungstate concentration (Na2WO4; X2), sodium hypophosphite concentration (NaH2PO2; X3), bath temperature (T; X4), bath pH value (X5)—were used as experimental variables. Taking the corrosion resistance of the coating as the response value (Y), a five-factor, five-level response surface design was established (Table 2).
The relationships between the actual values and the coded values were X1 = (A − 25)/5, X2 = (B − 20)/5, X3 = (C − 25)/5, X4 = (D − 60)/5, and X5 = (E − 8.7)/0.6. The central composite experimental design of k factors mainly consists of 2·k cubic points, 2k axial points, and n center points. The total number of experiments in a complete experimental design is N = 2k + 2·k + n, where k is the number of main factors in the experimental design and n is the number of repetitions at the center point. Therefore, the five-factor, five-level response surface design consisted of 50 experiments, and each experiment was repeated 3–5 times.
Electroless plating was carried out under the experimental parameters designed for the central composite experiment. Immersion experiments were carried out on the plated samples at 25 °C, and open circuit potential (OCP) tests were conducted simultaneously during immersion. Because the OCP of magnesium alloy is lower than the Ni–W–P alloy, once the coating loses its protective effect on magnesium alloy, an intense hydrogen evolution reaction occurs in contact with aqueous solution, and the OCP drops rapidly. Therefore, the rapid change of OCP of the coating can be used to determine whether the coating has lost its protective effect on magnesium alloy. The coating failure time was recorded when the OCP value started to decrease rapidly, and the OCP test curve of the coating is displayed in Figure 1.

3. Results

3.1. Test Results of the Electroless Plating Experiment and the Center Composite Test Design

The results of the electroless plating experiment and the center composite test design are presented in Table 3.
According to the test results in Table 3, quadratic regression fitting was performed, and the corresponding fitting results are presented in Equations (2) and (3).
Time = −538 × X1 − 1768 × X2 + 898 × X3 + 326 × X4 + 545 × X5 + 437 × X1 × X2 − 143 × X1 × X3 − 336 × X1 × X4 − 292 × X1 × X5 − 940 × X2 × X3 − 197 × X2 × X4 − 560 × X2 × X5 + 50 × X3 × X4 + 327 × X3 × X5 + 135 × X4 × X5 − 371 × X12 + 379 × X22 − 391 × X32 − 402 × X42 − 487 × X52 + 3048
Time = 2082 × A + 1639 × B + 789 × C + 2045 × D + 25,178 × E + 17.5 × A × B − 5.7 × A × C − 13.4 × A × D − 97.3 × A × E − 37.6 × B × C − 7.9 × B × D − 187 × B × E + 1.99 × C × D + 109 × C × E + 45.0 × D × E − 14.9 × A2 + 15.2 × B2 − 15.7 × C2 − 16.1 × D2 − 1352 × E2 − 223,389
Correlation and variance analyses were performed for the quadratic regression equation, and the obtained result is presented in Table 4. In the regression model, the F value was 21.16 and the p value was less than 0.0001, indicating that the quadratic regression equation could better explain the real situation of the experiment. When the points in Figure 2 are evenly and tightly distributed on both sides of the ideal line, the predicted and actual values have a good correlation. According to the variance analysis, the correlation coefficient between the real and predicted values of the plating failure time was R2 = 93.59%, indicating that the fitting equation could better explain the real situation of the experiment. The optimal process parameters in Table 4 were used as the design parameters for the CCD test design, and the code was (X1X2X3X4X5) = (−1 − 1111). The coating failure time obtained from the immersion test was 10,200 min (7–8 days), and the corresponding value predicted by the CCD test design was 9268.5 min (6–7 days), the immersion test result for Ni–W–P alloy coating under optimal process conditions shown in Figure 3.
The relative error was about 9.1%, which is consistent with the correlation coefficient of the regression equation (R2 = 93.59%). This implies that the regression equation obtained from the CCD experimental design could well explain the real experimental results and accurately predict the optimal process parameters.

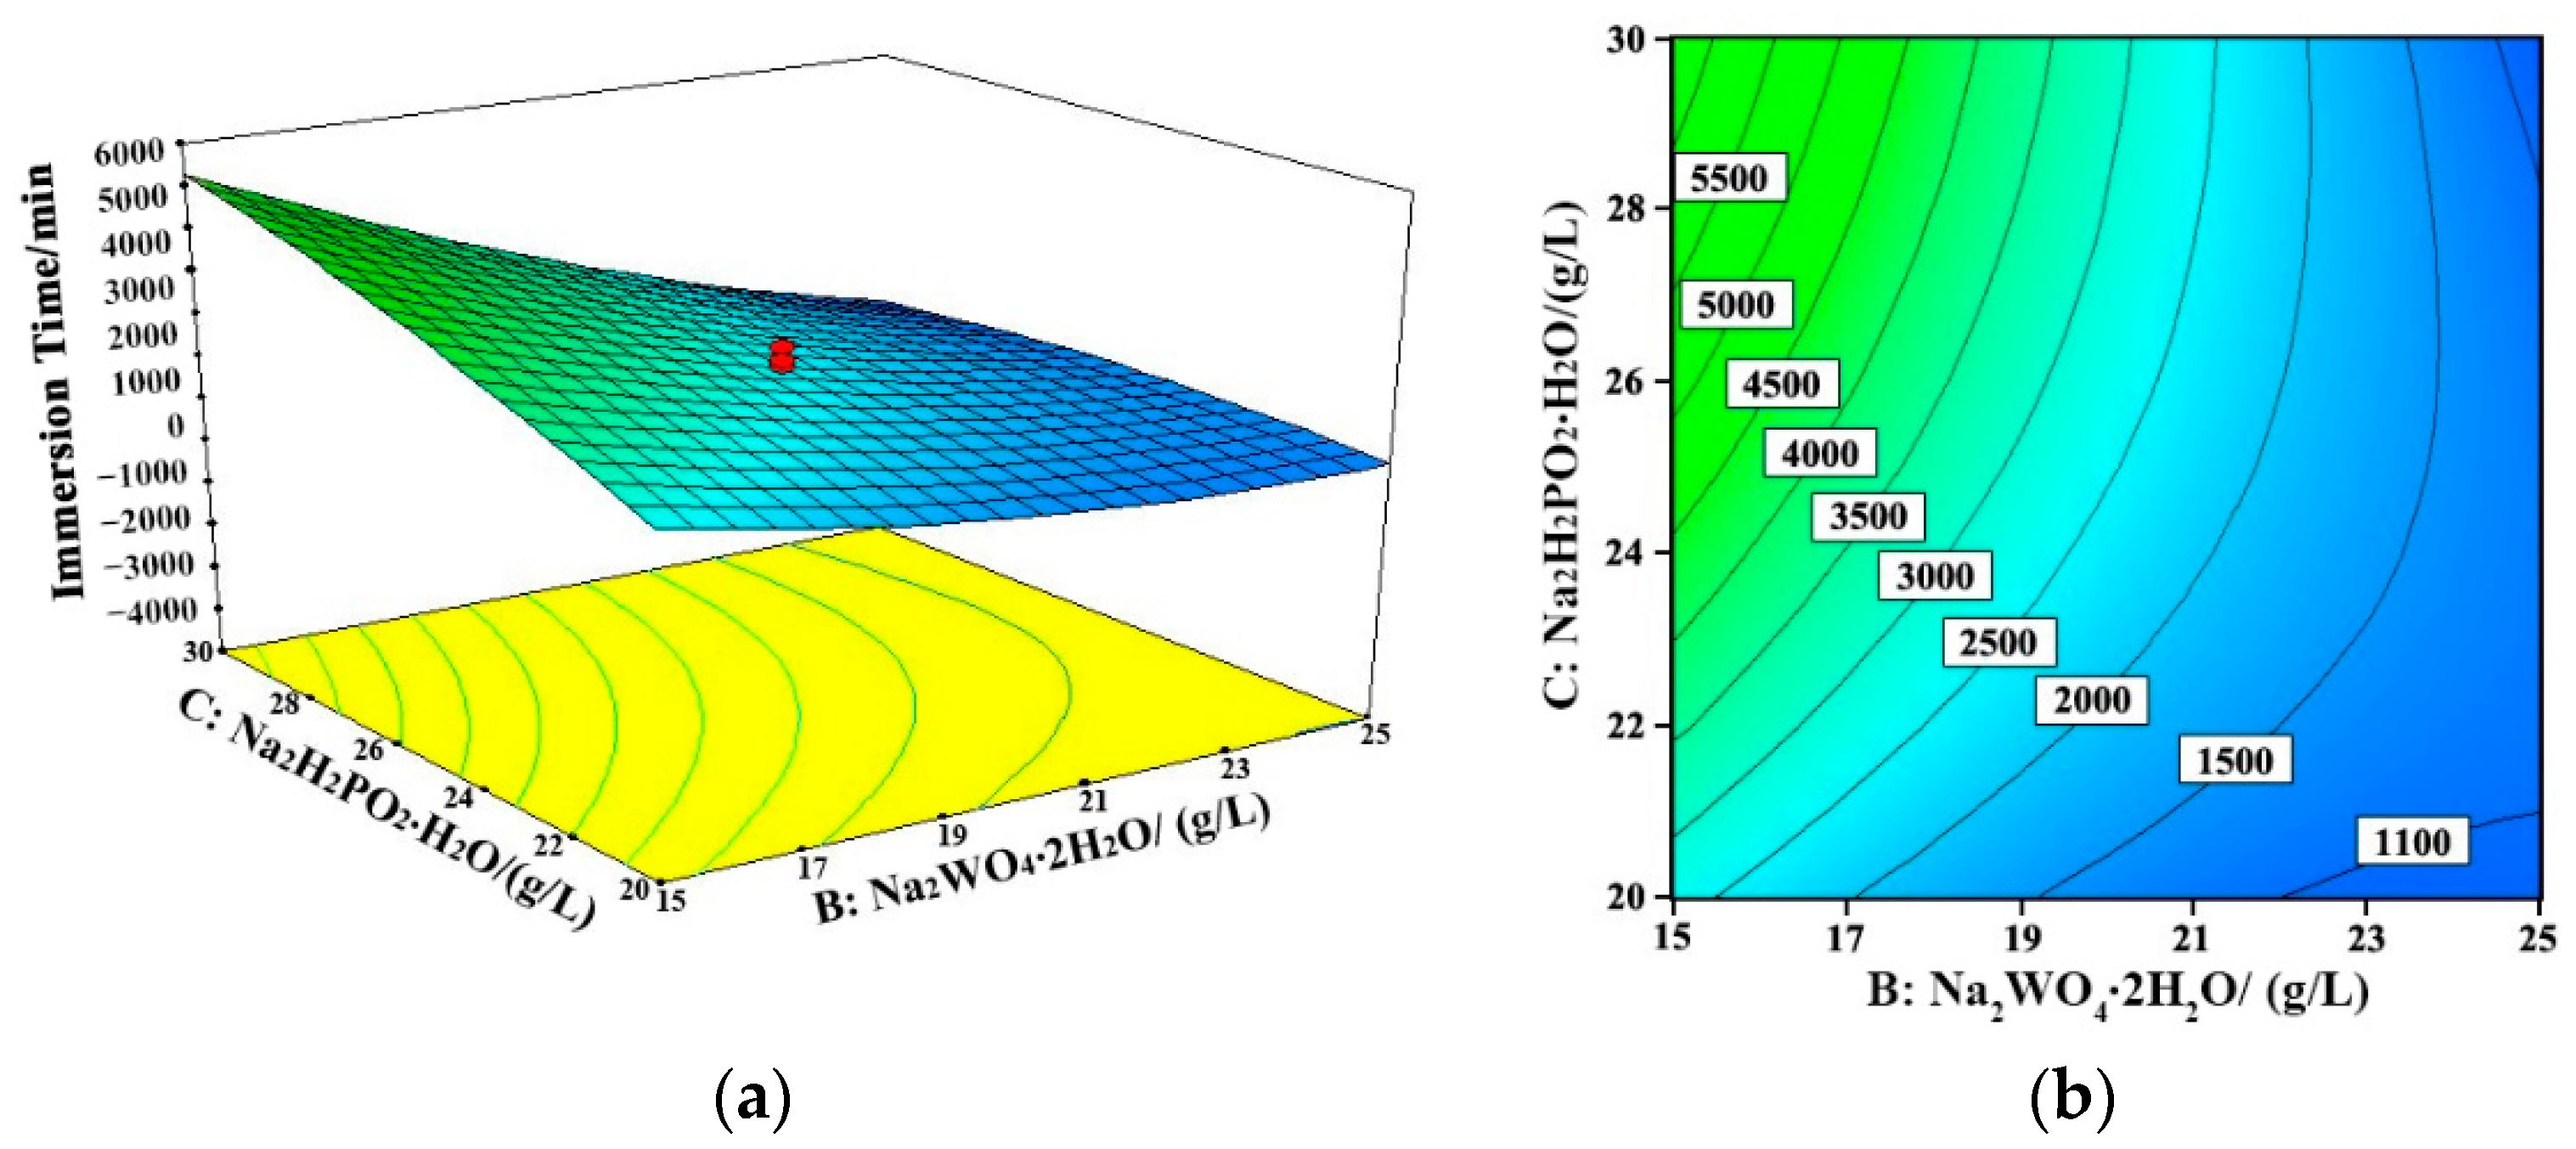
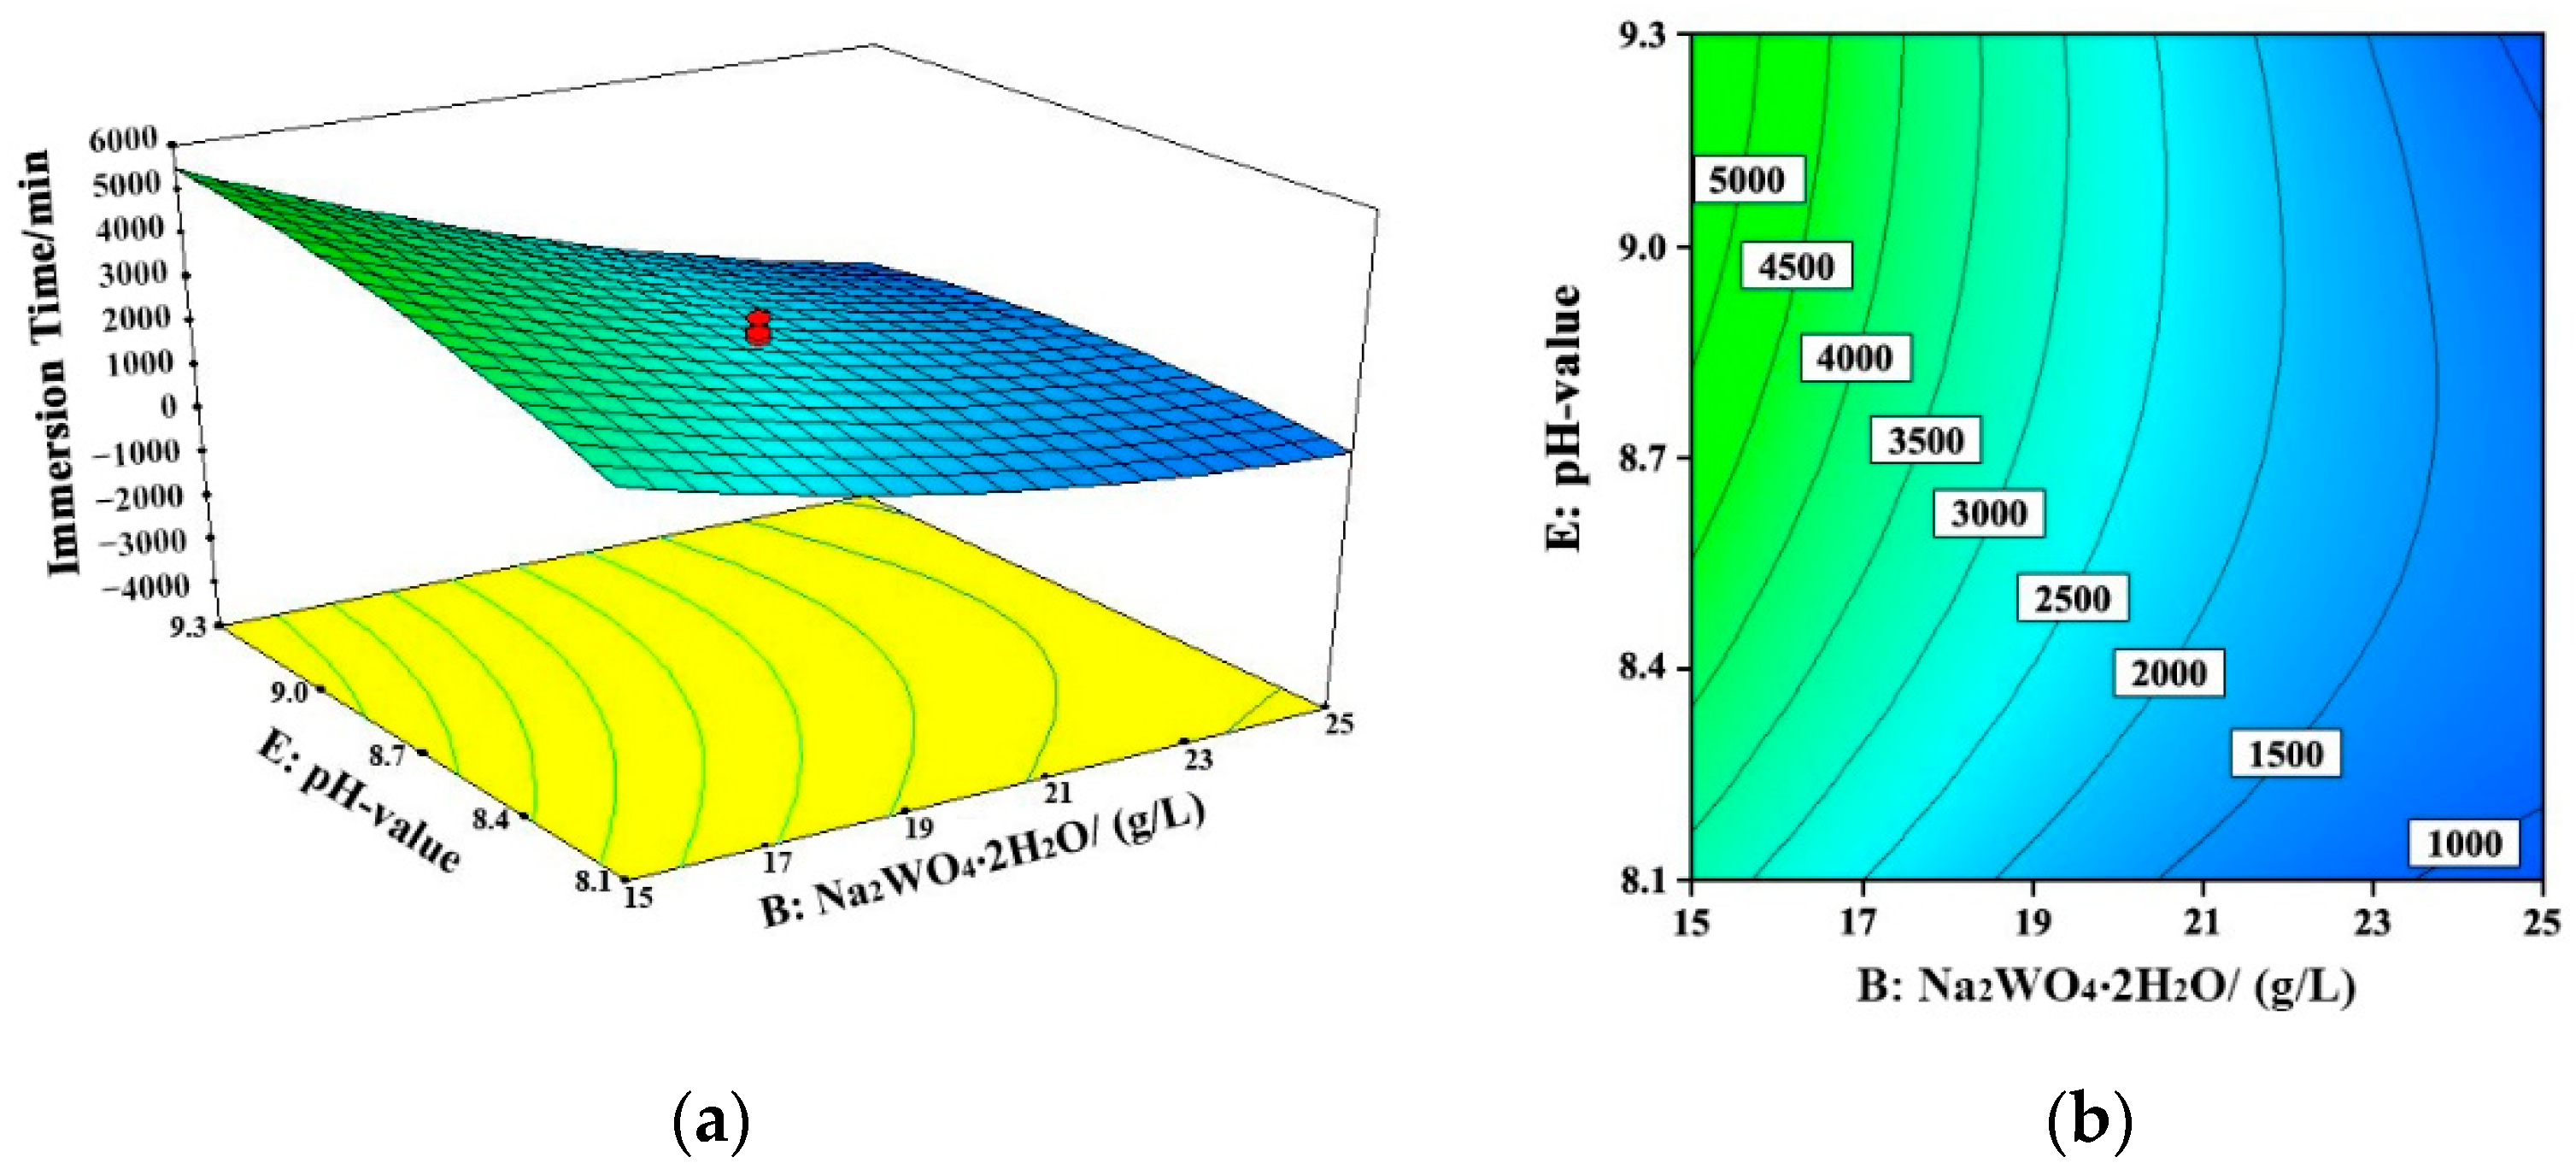
3.2. Influences of the Studied Variables on the Corrosion Resistance of the Coating

According to the variance analysis, the larger the F value, the more significant the effect of the variables on the response value. On the contrary, the smaller the P value, the less significant the effect. P = 0.05 was the critical value to evaluate the influences of different variables and their interactions on the corrosion resistance of the coating, and the result is presented in Table 5. The items that significantly affected the response value were X1, X2, X3, X4, X5, X12, X22, X32, X42, X52, X1X2, X2X3, and X2X5, and the insignificant items included X1X3, X1X4, X1X5, X2X4, X3X4, X3X5, and X4X5.
The reduction of the insignificant terms simplified the quadratic regression equation and facilitated the experimental analysis. The simplified results are shown in Equations (4) and (5).
Time = −538 × X1 − 1768 × X2 + 898 × X3 + 326 × X4 + 545 × X5 + 437 × X1 × X2 − 940 × X2 × X3 − 560 × X2 × X5 − 371 × X12 + 379 × X22 − 391 × X32 − 402 × X42 − 487 × X52 + 3048
Time = 285.7 × A + 1167 × B + 1714 × C + 1993 × D + 28,169 × E + 17.5 × A × B − 37.6 × B × C − 187 × B × E − 14.9 × A2 + 15.2 × B2 − 15.7 × C2 − 16.1 × D2 − 1352 × E2 − 219194
The variance analysis result of the simplified quadratic regression equation is presented in Table 6, and the simplified regression model manifested high significance. The lack of fit was not significant. When the adeq precision was greater than 4, the model had a good ability to resist external interferences. The adeq precision ratio was found as 21.1 (Table 6), indicating that the experimental results obtained by this model were almost not affected by external interference signals. The correlation coefficient (R2), the correction correlation coefficient (R2adj), and the prediction correlation coefficient (R2pred) decreased from 0.93 to 0.89, from 0.89 to 0.86, and from 0.72 to 0.70, respectively, indicating that the accuracy of the simplified quadratic regression model was slightly poor, thus revealing its effectiveness.
In Figure 4, A is the concentration of nickel sulfate, B is the concentration of sodium tungstate, C is the concentration of sodium hypophosphite, D is the temperature of the bath, E is the pH value of the bath, AB is the interaction between nickel sulfate and sodium tungstate, BC is the interaction between sodium tungstate and sodium hypophosphite, and BE is the interaction between sodium tungstate and the pH of the bath.
To facilitate the analysis of the influences of each research variable and their interactions on the response value, the coefficients of the coded equation for the simplified quadratic regression model were normalized, and the corresponding result is shown in Figure 4. The influencing degrees of the five studied variables on the response value were found in the order of sodium tungstate concentration > sodium phosphite concentration > bath pH > nickel sulfate concentration > solution temperature. The interactions among the variables had significant influences on the corrosion resistance of the coating. The concentration of sodium tungstate was the dominant factor during its interaction with nickel sulfate, sodium hypophosphite, and bath pH. The influence of sodium tungstate concentration on the response value accounted for about 25% of the total influence on the response value.
The interactions among different variables are displayed in Figure 5, Figure 6 and Figure 7. The concentration of sodium tungstate was the dominant factor during the interaction between nickel sulfate and sodium tungstate. In the interaction between sodium tungstate and sodium hypophosphite, sodium tungstate concentration was the main factor, whereas in the interaction between sodium tungstate and the pH value of the bath, sodium tungstate concentration was the main influencing factor. This indicates that, among the studied five variables, sodium tungstate concentration had the most significant effect on the corrosion resistance of the Ni–W–P alloy coating, and its comprehensive influencing degree was about 50%.

3.3. Influences of the Electroless Plating Process on the Corrosion Resistance of the Coating

According to the quadratic regression equation, curve fitting was performed to obtain the functional relationship between each research variable and the response value, and the corresponding fitting result is displayed in Figure 8. It is noticeable that within the proposed value ranges, the relationship between each variable and the response value was nonlinear. Therefore, the increment of the amount of reactants to accelerate the deposition rate of electroless plating does not necessarily lead to superior corrosion resistance. An electroless plating process is significantly affected by the composition of the plating solution and technological parameters; thus, the main process variables must be strictly controlled within a certain range to achieve an optimal comprehensive performance of the plating layer. Too high or too low a parameter value can cause adverse effects on the plating process and even lead to plating failure.

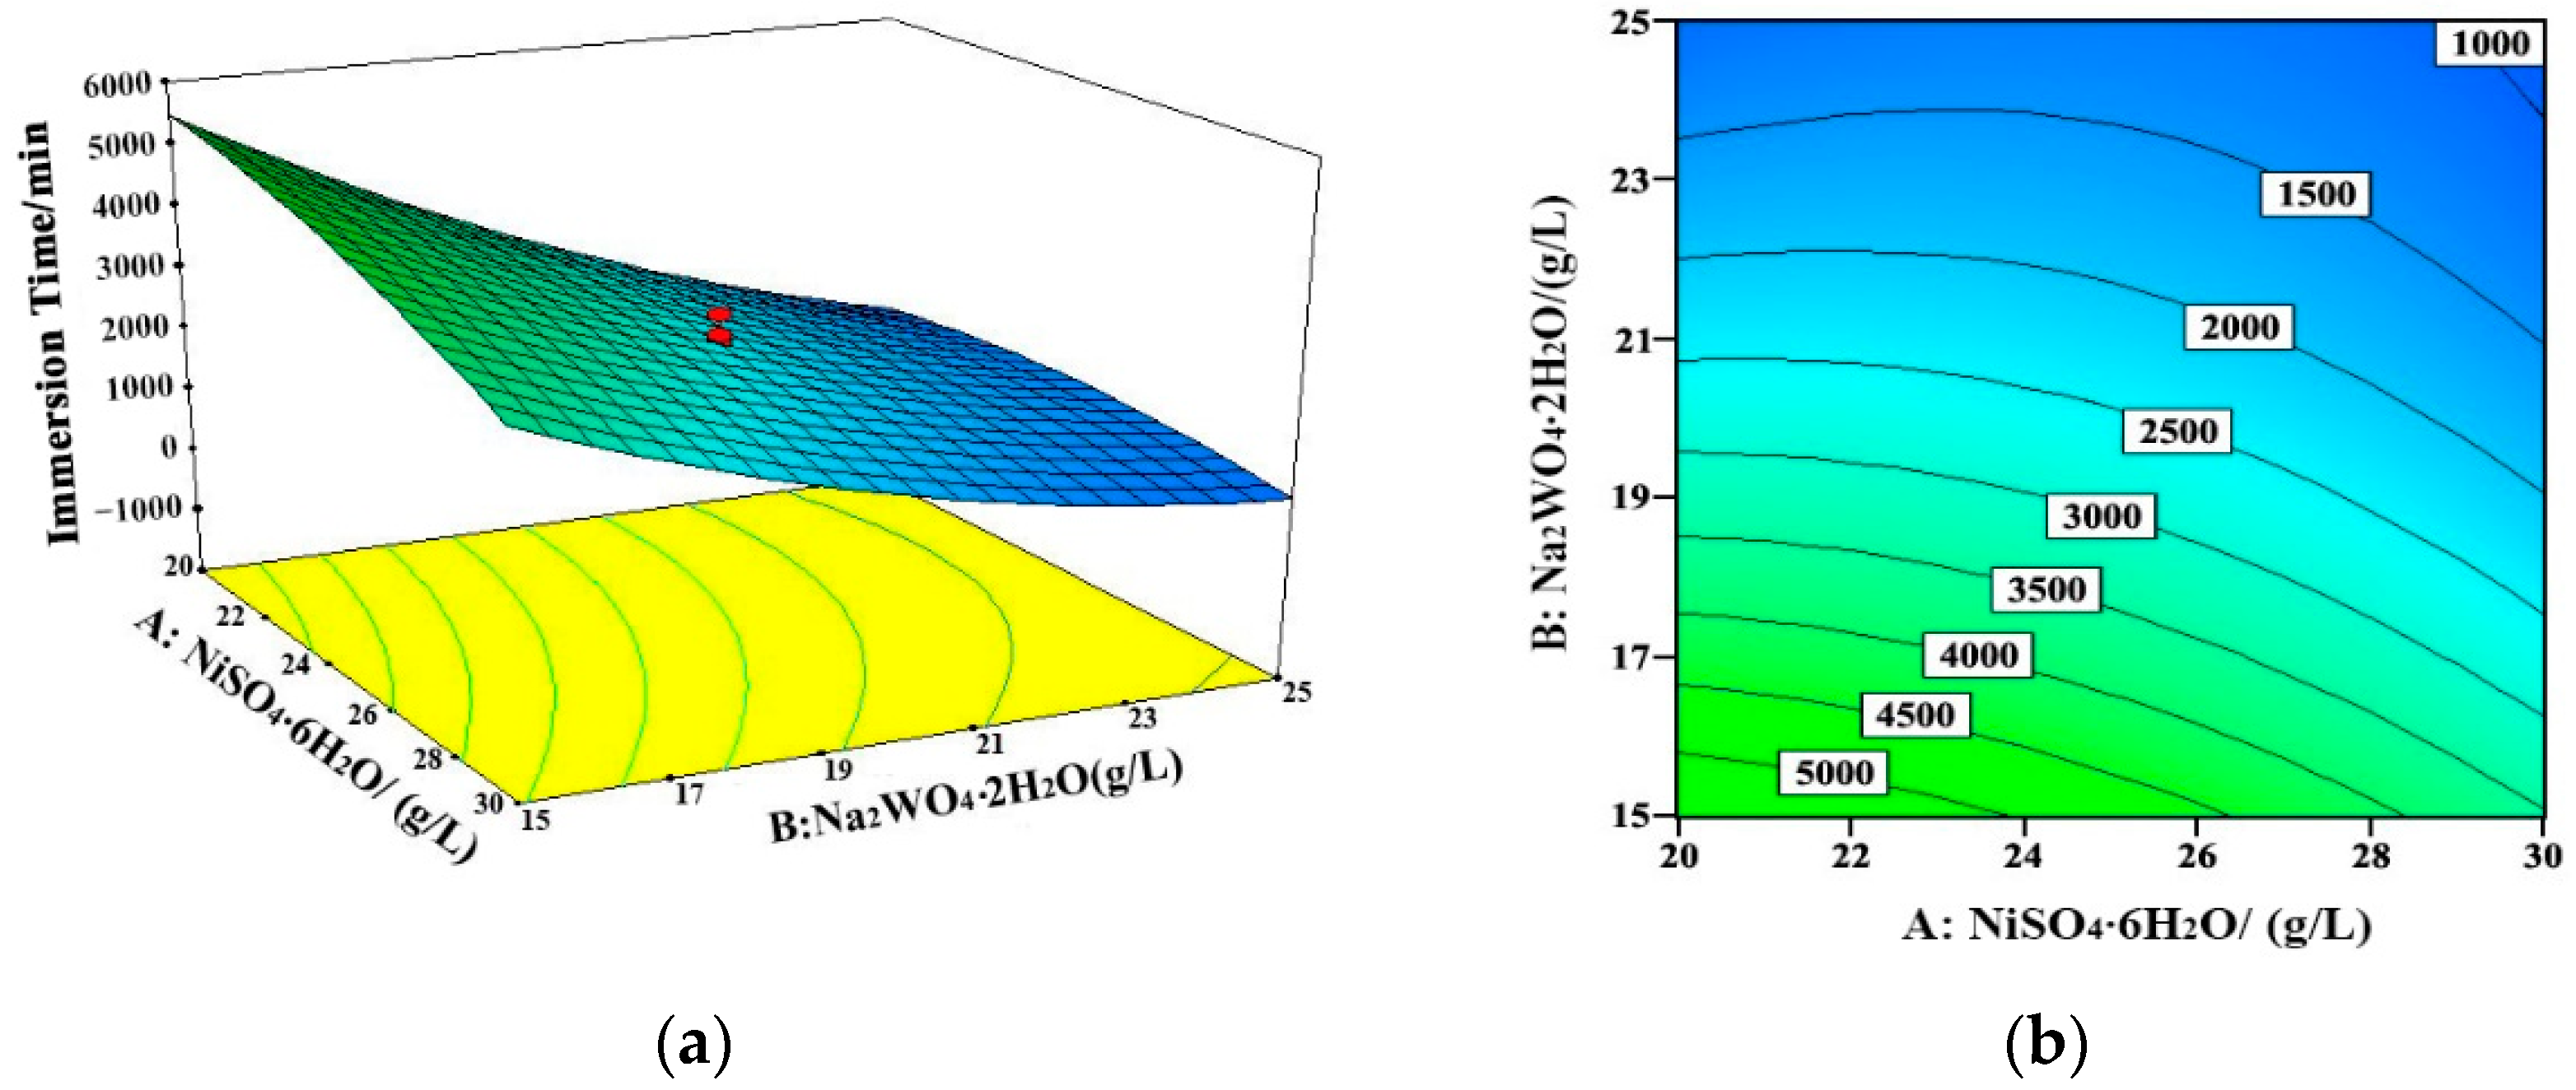
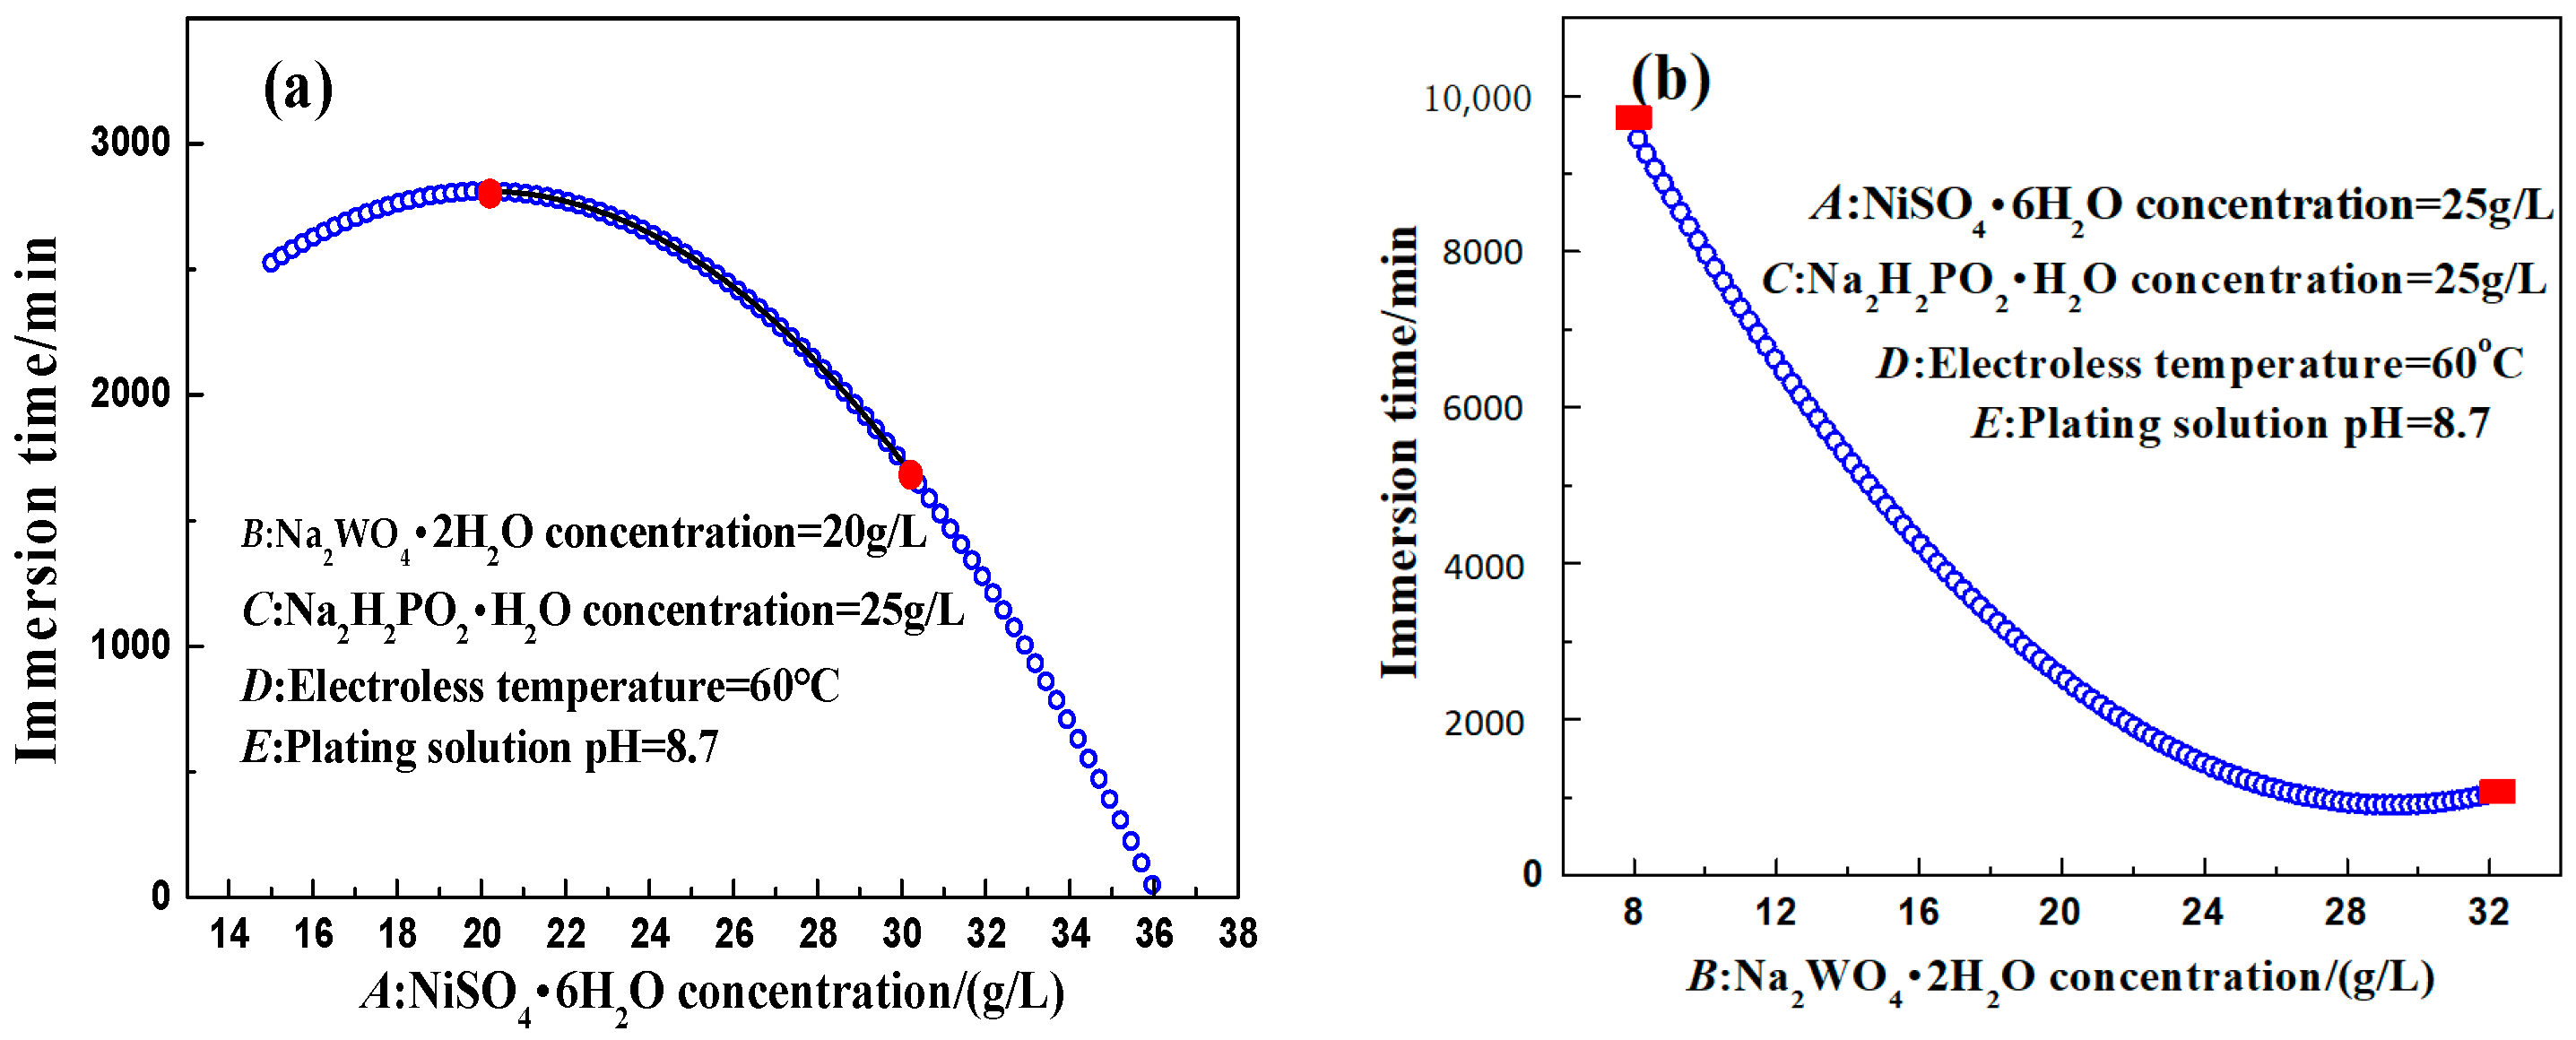
3.3.1. Effects of Different Salt Concentrations on the Corrosion Resistance of the Coating

It is noticeable from Figure 8a that the corrosion resistance of the coating first increased and then decreased with the increase of the nickel sulfate concentration. When the concentration of nickel sulfate was too low, the deposition rate of electroless plating was seriously affected. Too high a concentration of nickel sulfate could accelerate the deposition process of electroless plating. However, it often could lead to spontaneous decomposition in electroless plating. In addition, the concentration of nickel sulfate was closely related to the concentration of the complexing agent. When the complexing agent concentration was certain and the Ni2+ concentration was too high, the complexation reaction between the complexing agent and Ni2+ ions in the bath solution could not be completed, causing free Ni2+ ions to react quickly with OH in the alkaline solution and generate Ni(OH)2 precipitation; thus, affecting the electroless plating process and leading to the solution decomposition. Therefore, the effect of nickel sulfate concentration on the corrosion resistance of the coating was bidirectional (nonlinear).
It is evident from Figure 8b that the corrosion resistance of the coating first decreased and then increased slightly with the increase of the sodium tungstate concentration. According to the experimental results of the response surface method, the concentration of sodium tungstate had a significant influence on the corrosion resistance of the electroless Ni–W–P-plated layer, and its interaction with nickel sulfate, sodium hypophosphite, and the pH of the plating solution was obvious. During the deposition process of electroless Ni–W–P alloy plating in the alkaline solution, both Ni2+ and WO42− ions had redox reactions with hypophosphite. Moreover, the reduction reaction of W was related to sodium hypophosphite concentration and the pH of the bath. The deposition of W belonged to an induced co-deposition process, which is a reduction reaction caused by the deposition process of nickel. However, the “competitive relationship” between sodium tungstate and nickel sulfate resulted in different trends. Therefore, the corrosion resistance of the coating decreased with the increase of the sodium tungstate concentration.

3.3.2. Effects of the Reducing Agent on the Corrosion Resistance of the Coating

It is clear from Figure 8c that the optimal concentration of the reducing agent (sodium hypophosphite) was 30 g/L. When the concentration of sodium hypophosphite was too low, its reducing capacity decreased rapidly, leading to a lack of electroless plating power and affecting the deposition rate. When the concentration of sodium hypophosphite was too high, numerous phosphite ions reacted with Ni2+ to form nickel phosphite precipitation, which was attached to the sample surface and adversely affected the coating quality and the deposition rate. The precipitation of nickel phosphite also decreased the stability of the bath. Therefore, the effect of sodium hypophosphite concentration on the corrosion resistance of the coating was nonlinear.

3.3.3. Effects of Temperature on the Corrosion Resistance of the Coating

According to Figure 8d, with the increase of the temperature, the corrosion resistance of the coating first increased and then decreased. From the perspective of dynamics, the increase of the temperature could improve the reaction activity, facilitate the chemical reaction to cross the reaction barrier, and also lead to an increase of the deposition rate. However, when the temperature was too high, rapid dissolution of the plating solution occurred, the coating performance declined, and the surface gloss was reduced. Therefore, the effect of temperature on the corrosion resistance of the coating was nonlinear.

3.3.4. Effects of the pH Value of the Plating Solution on the Corrosion Resistance of the Coating

It is discernible from Figure 8e that the corrosion resistance of the coating first increased and then decreased with the increase of the pH value. During electroless plating, a large amount of OH was consumed on the substrate surface, leading to a drastic change in the local pH value and affecting the corrosion resistance of the coating. In the alkaline solution, when the pH value was low, the fluctuation of pH was large, causing a poor plating condition. When the pH value was high, the deposition rate accelerated. However, too many OH ions easily reacted with free Ni2+ and precipitated, affecting the comprehensive properties of the coating. In addition, a high pH value also led to a rapid decrease in the stability of the bath. Therefore, the influence of the pH value of the plating solution on the corrosion resistance of the coating was nonlinear.

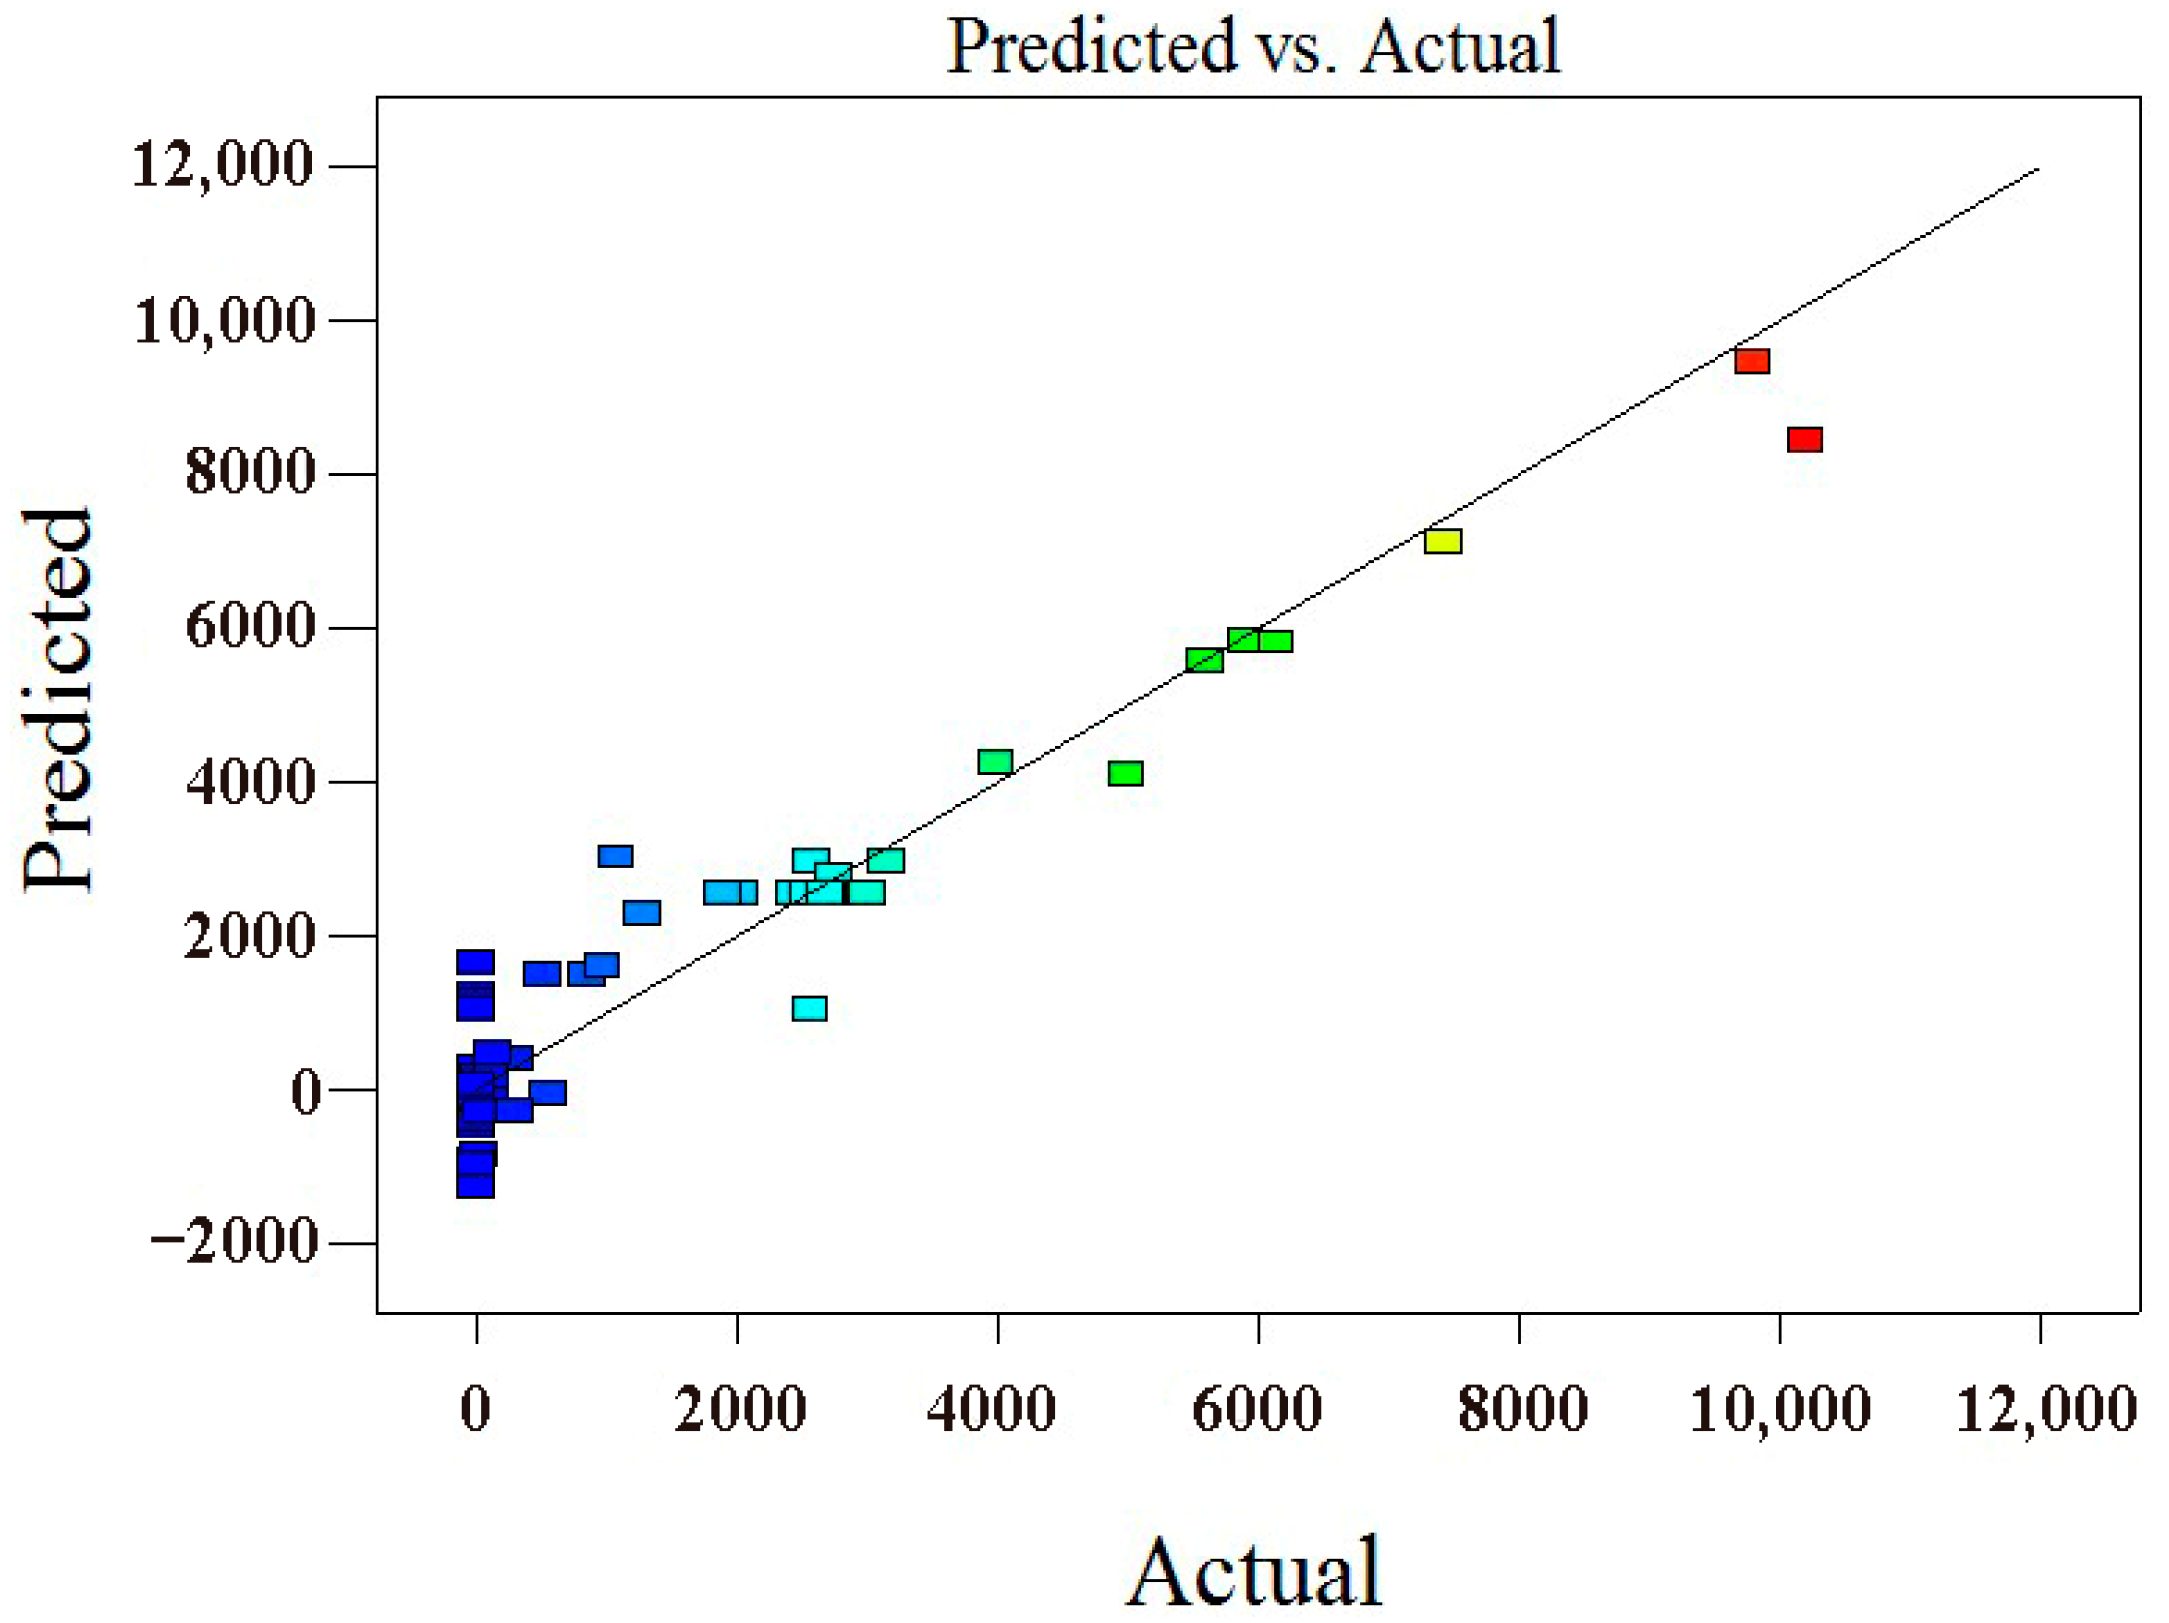
3.4. Corrosion Resistance Optimization of the Coating by the Response Surface Method

The potentiometric polarization curves for the corrosion resistance of the coating predicted by the orthogonal experimental design test and the response surface method are displayed in Figure 9. It is clear that in comparison to the orthogonal experimental design test, the Ecorr value from −0.121 V to −0.131 V, the Ecorr of the coating obtained by the response surface method under the optimal conditions increased to about 10 mV. The ipassive value from 9.445 × 10⁻⁶ A/cm2 to 1.054 × 10⁻⁶ A/cm2, it decreased by an order of magnitude and widened the dimensional blunt interval. Moreover, the Epitting value from 0.019 to 0.165 V, the Epitting value increased by about more than 100 mV. Therefore, the coating obtained by the response surface method had better corrosion resistance. The results concerning the chemical composition and surface morphology of the coating are shown in Figure 10.

4. Conclusions

In the present work, the corrosion resistance of electroless Ni–W–P alloy-coated AZ91D magnesium alloy was optimized by the response surface method. The main inferences are presented below.
  • The optimum process parameters for the present experiment were nickel sulfate concentration = 20 g/L, sodium tungstate concentration = 15 g/L, sodium hypophosphite concentration = 30 g/L, bath temperature = 65 °C, and bath pH = 9.3. Under these optimum parameters, the electroless-plated layer possessed a uniformly dense structure and manifested good corrosion resistance.
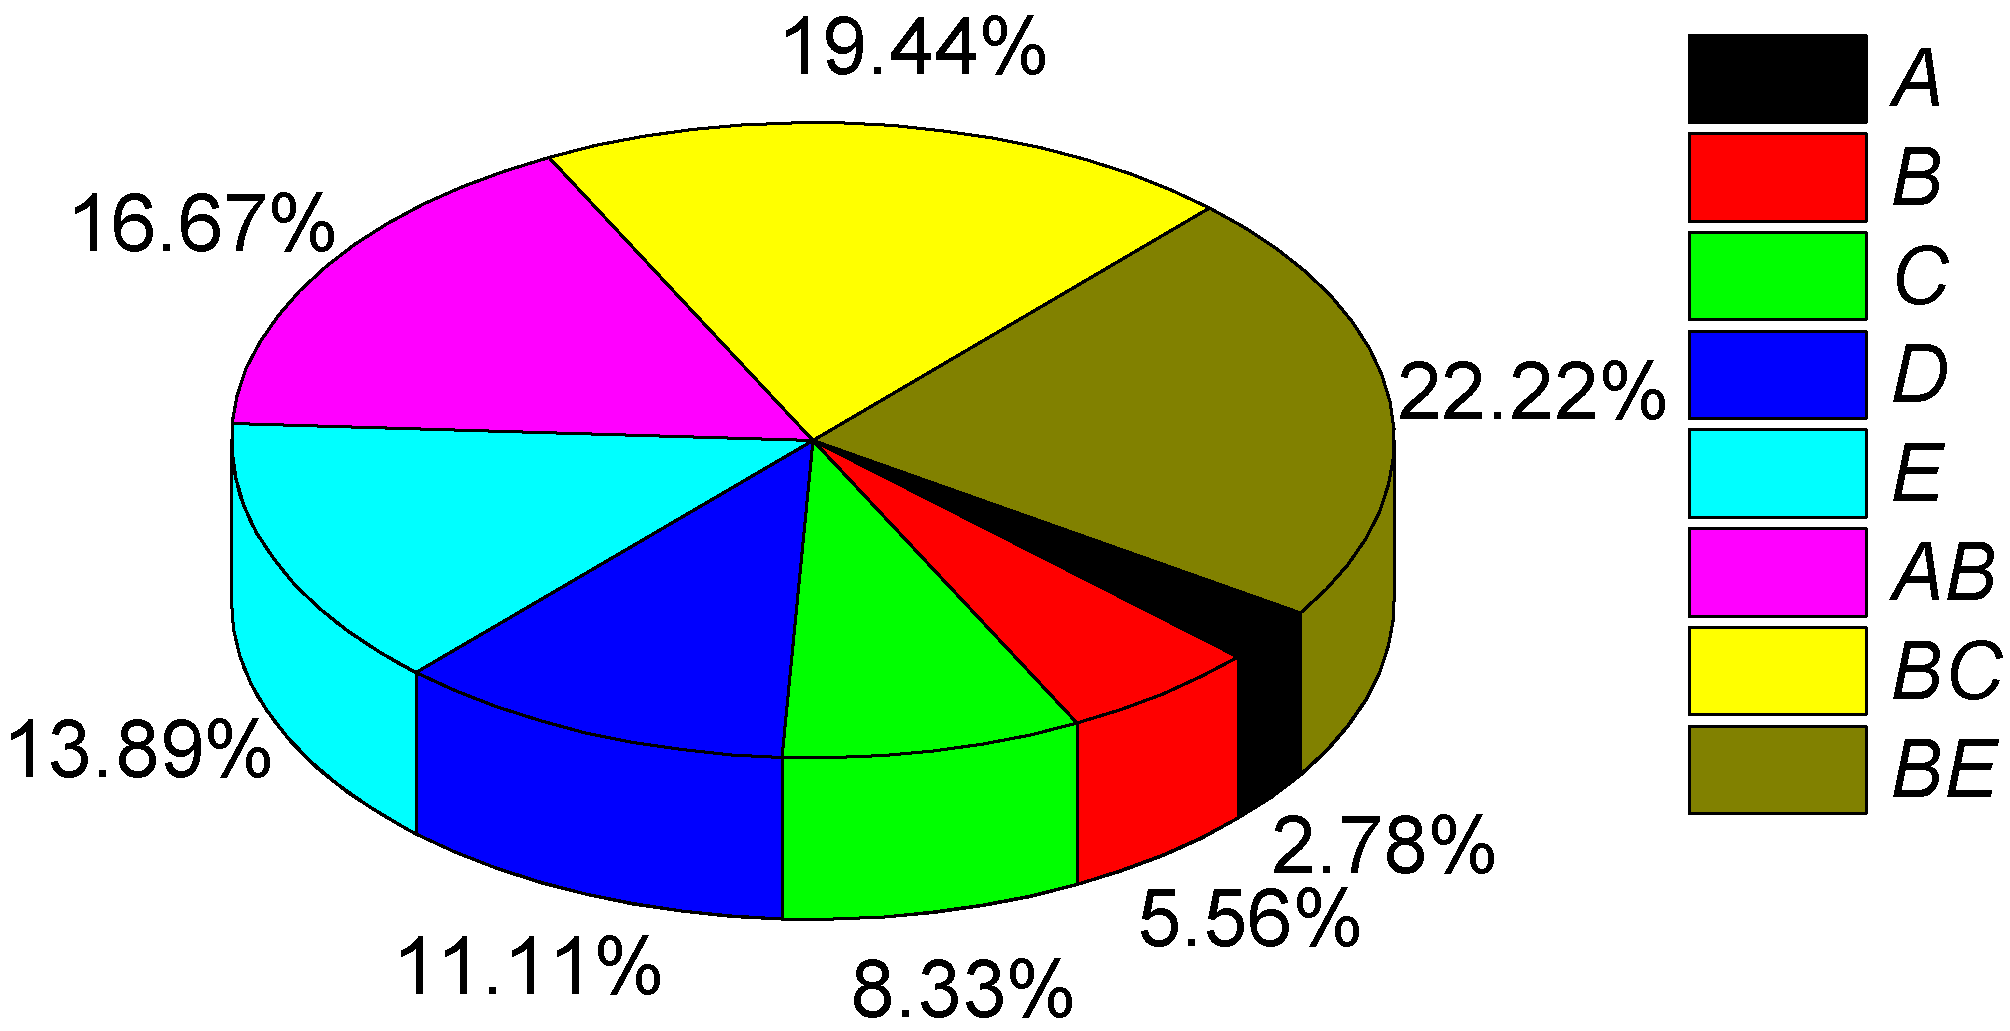
  • The influencing degrees of the experimental variables on the corrosion resistance of the coating were in the order of sodium tungstate concentration > sodium phosphate concentration > pH value > nickel sulfate concentration > temperature.
  • The interactions among the variables had significant influences on the corrosion resistance of the coating. The concentration of sodium tungstate was the dominant factor during its interactions with nickel sulfate, sodium hypophosphite, and bath pH.

Author Contributions

Conceptualization, B.L. and T.Z.; methodology, Y.L.; software, Y.Y.; validation, Q.Z., Y.W., and H.S.; formal analysis, Y.S. and Z.W.; investigation, F.W.; resources, B.L.; data curation, B.L.; writing—original draft preparation, B.L.; writing—review and editing, T.Z.; visualization, B.L.; supervision, T.Z.; project administration, B.L.; funding acquisition, B.L. All authors have read and agreed to the published version of the manuscript.

Funding

The authors are grateful to the financial support from the National Natural Science Foundation of China (No. 51701050), and the Natural Science Foundation of Heilongjiang Province (Nos. QC2018057, E2016022).

Institutional Review Board Statement

Not applicable.

Informed Consent Statement

Not applicable.

Data Availability Statement

Data is contained within the article.

Conflicts of Interest

The authors declare no conflict of interest.

References

  1. Ball, C.P.J. The history of magnesium. J. Inst. Met. 1960, 89, 81–94. [Google Scholar]
  2. Mordike, B.L.; Ebert, T. Magnesium: Properties—Applications—Potential. Mater. Sci. Eng. A 2001, 302, 37–45. [Google Scholar] [CrossRef]
  3. Nishikawa, Y.; Takara, A. Current status and manufacturing technologies of magnesium alloy parts in japanese home electronics. Mater. Sci. Forum 2003, 426, 569–574. [Google Scholar] [CrossRef]
  4. Musfirah, A.H.; Ghani, J.A. Magnesium and aluminum alloys in automotive industry. J. Appl. Sci. Res. 2012, 8, 4865–4875. [Google Scholar]
  5. Sezer, N.; Evis, Z.; Kayhan, S.M.; Tahmasebifar, A.; Koç, M. Review of magnesium-based biomaterials and their applications. J. Magnes. Alloys 2018, 6, 23–43. [Google Scholar] [CrossRef]
  6. Furuya, H.; Kogiso, N.; Matunaga, S.; Senda, K. Applications of magnesium alloys for aerospace structure systems. Mater. Sci. Forum 2000, 350, 341–348. [Google Scholar] [CrossRef]
  7. Atrens, A.; Shi, Z.; Mehreen, S.U.; Johnston, S.; Song, G.-L.; Chen, X.; Pan, F. Review of Mg alloy corrosion rates. J. Magnes. Alloys 2020, 8, 989–998. [Google Scholar] [CrossRef]
  8. Esmaily, M.; Malmberg, P.; Shahabi-Navid, M.; Svensson, J.E.; Johansson, L.G. A ToF-SIMS investigation of the corrosion behavior of Mg alloy AM50 in atmospheric environments. Appl. Surf. Sci. 2016, 360, 98–106. [Google Scholar] [CrossRef] [Green Version]
  9. Chunyan, Z.; Shangju, L.; Baoxing, Y.; Xiaopeng, L.; Xiao-Bo, C.; Tao, Z.; Fuhui, W. Ratio of total acidity to pH value of coating bath: A new strategy towards phosphate conversion coatings with optimized corrosion resistance for magnesium alloys. Corros. Sci. 2019, 150, 279–295. [Google Scholar] [CrossRef]
  10. Duan, G.; Yang, L.; Liao, S.; Zhang, C.; Lu, X.; Yang, Y.; Zhang, B.; Wei, Y.; Zhang, T.; Yu, B.; et al. Designing for the chemical conversion coating with high corrosion resistance and low electrical contact resistance on AZ91D magnesium alloy. Corros. Sci. 2018, 135, 197–206. [Google Scholar] [CrossRef]
  11. Muhaffel, F.; Cimenoglu, H. Development of corrosion and wear resistant micro-arc oxidation coating on a magnesium alloy. Surf. Coat. Technol. 2019, 357, 822–832. [Google Scholar] [CrossRef]
  12. Guo, S.; Pan, F.; Zhang, H.; Zhang, D.; Wang, J.; Miao, J.; Su, C.; Zhang, C. Fe-based amorphous coating for corrosion protection of magnesium alloy. Mater. Des. 2016, 108, 624–631. [Google Scholar] [CrossRef]
  13. Liu, F. Effect of pretreatment and annealing on aluminum coating prepared by physical vapor deposition on AZ91D magnesium alloys. Int. J. Electrochem. Sci. 2016, 11, 5655–5668. [Google Scholar] [CrossRef]
  14. Chang, L.; Zhou, Y.; Liu, W.; Duan, X.Y. Pulse plated Zn transition layer in electroplating Sn–Ni alloy coatings on magnesium alloys. Mater. Corros. 2014, 66, 434–441. [Google Scholar] [CrossRef]
  15. Sharma, A.K.; Suresh, M.; Bhojraj, H.; Narayanamurthy, H.; Sahu, R. Electroless nickel plating on magnesium alloy. Met. Finish. 1998, 96, 10–16. [Google Scholar] [CrossRef]
  16. Zhang, W.X.; Huang, N.; He, J.G.; Jiang, Z.H.; Jiang, Q.; Lian, J.S. Electroless deposition of Ni–W–P coating on AZ91D magnesium alloy. Appl. Surf. Sci. 2007, 253, 5116–5121. [Google Scholar] [CrossRef]
  17. Zhang, W.; He, C. Electroless Ni–W–P/Ni–B duplex coatings on AZ91D magnesium alloy. In Proceedings of the International Conference on Mechanic Automation and Control Engineering, Wuhan, China, 26–28 June 2010. [Google Scholar]
  18. Gray, J.; Luan, B. Protective coatings on magnesium and its alloys—A critical review. J. Alloys Compd. 2002, 336, 88–113. [Google Scholar] [CrossRef]
  19. Song, G.-L. Recent progress in corrosion and protection of magnesium alloys. Adv. Eng. Mater. 2005, 7, 563–586. [Google Scholar] [CrossRef]
  20. Deng, H.; Moller, P. Effects of pretreatment on the structure and properties of electroless nickel coatings. In Proceedings of the 79th AESF Annual Technical Conference, Atlanta, GA, USA, 22–25 June 1992. [Google Scholar]
  21. Ezhilselvi, V.; Balaraju, J.; Subramanian, S. Chromate and HF free pretreatment for MAO/electroless nickel coating on AZ31B magnesium alloy. Surf. Coat. Technol. 2017, 325, 270–276. [Google Scholar] [CrossRef]
  22. Cui, X.; Jin, G.; Li, Q.; Yang, Y.; Li, Y.; Wang, F. Electroless Ni–P plating with a phytic acid pretreatment on AZ91D magnesium alloy. Mater. Chem. Phys. 2010, 121, 308–313. [Google Scholar] [CrossRef]
  23. Rajabalizadeh, Z.; Seifzadeh, D. Strontium phosphate conversion coating as an economical and environmentally-friendly pretreatment for electroless plating on AM60B magnesium alloy. Surf. Coat. Technol. 2016, 304, 450–458. [Google Scholar] [CrossRef]
  24. Ambat, R.; Zhou, W. Electroless nickel-plating on AZ91D magnesium alloy: Effect of substrate microstructure and plating parameters. Surf. Coat. Technol. 2004, 179, 124–134. [Google Scholar] [CrossRef]
  25. Grum, J.; Slabe, J. The use of factorial design and response surface methodology for fast determination of optimal heat treatment conditions of different Ni–Co–Mo surfaced layers. J. Mater. Process. Technol. 2004, 155, 2026–2032. [Google Scholar] [CrossRef]
  26. Gunaraj, V.; Murugan, N. Application of response surface methodology for predicting weld bead quality in submerged arc welding of pipes. J. Mater. Process. Technol. 1999, 88, 266–275. [Google Scholar] [CrossRef]
  27. Hou, T.-H.; Su, C.-H.; Liu, W.-L. Parameters optimization of a nano-particle wet milling process using the Taguchi method, response surface method and genetic algorithm. Powder Technol. 2007, 173, 153–162. [Google Scholar] [CrossRef]
  28. Wang, J.; Wan, W. Experimental design methods for fermentative hydrogen production: A review. Int. J. Hydrogen Energy 2009, 34, 235–244. [Google Scholar] [CrossRef]
Figure 1. OCP test curve of the electroless Ni–W–P coating during immersion.
Coatings 11 00018 g001
Figure 2. Correlation analysis diagram of the predicted and actual values.
Coatings 11 00018 g002
Figure 3. Immersion test result for Ni–W–P alloy coating under optimal process conditions.
Coatings 11 00018 g003
Figure 4. Significance analysis of the effects of the studied variable and their interactions on the corrosion resistance of the coating.
Coatings 11 00018 g004
Figure 5. Response surface (a) and contour map (b) of the coating failure time with the change of nickel sulfate and sodium tungstate concentrations (sodium hypophosphite concentration = 25 g/L, 60 °C, pH = 8.7). A: NiSO4·6H2O; B: Na2WO4·2H2O.
Coatings 11 00018 g005
Figure 6. Response surface (a) and contour map (b) of the coating failure time with the change of sodium tungstate and sodium hypophosphite concentrations (Nickel sulfate concentration = 25 g/L, 60 °C, pH = 8.7). B: Na2WO4·2H2O; C: NaH2PO2·H2O.
Coatings 11 00018 g006
Figure 7. Response surface (a) and contour map (b) of the coating failure time with the changes of sodium tungstate concentration and bath pH (nickel sulfate concentration = 25 g/L, sodium hypophosphite concentration = 25 g/L, 60 °C). B: Na2WO4·2H2O.
Coatings 11 00018 g007
Figure 8. Relationship curves between different factors and the response value. (a) NiSO4·6H2O; (b) Na2WO4·2H2O; (c) NaH2PO2·H2O; (d) Solution temperature; (e) Solution pH.
Coatings 11 00018 g008aCoatings 11 00018 g008b
Figure 9. Potentiometric polarization curves of the Ni–W–P alloy coating obtained by (a) the orthogonal experimental design test and (b) the response surface method.
Coatings 11 00018 g009
Figure 10. Chemical composition and morphology of the Ni–W–P coating on AZ91D cast magnesium alloy. (a) Chemical composition by EDS; (b) Cross-section morphology; (c) Surface morphology.
Coatings 11 00018 g010
Table 1. Chemical composition of AZ91D cast magnesium alloy.
Alloy ElementAlZnMnFeMg
wt.%9.10.640.170.01Bal
Table 2. Five-factor, five-level response surface test design and coding.
Experimental VariableMonadSymbolVariable Level
Actual ValueCoded Value−2.378−10+1+2.378
C(NiSO4)g/LAX113.120253036.9
C(Na2WO4)g/LBX28.115202531.9
C(NaH2PO2)g/LCX313.120253036.9
T°CDX448.155606571.9
pH1EX57.38.18.79.310.1
Table 3. Center composite test design and electroless plating experiment results.
GroupCoded Values of the VariablesActual Values of the VariablesCoating Failure
Time (min)
X1X2X3X4X5ABCDE
1−1−1−1−1−1201520558.10
2−1−1−1−11201520559.32750
3−1−1−11−1201520658.12004
4−1−1−111201520659.34990
5−1−11−1−1201530558.13990
6−1−11−11201530559.37420
7−1−111−1201530658.15595
8−1−1111201530659.310,200
9−11−1−1−1202520558.13
10−11−1−11202520559.328
11−11−11−1202520658.10
12−11−111202520659.3134
13−111−1−1202530558.16
14−111−11202530559.3295
15−1111−1202530658.1300
16−11111202530659.32560
171−1−1−1−1301520558.1120
181−1−1−11301520559.3506
191−1−11−1301520658.1550
201−1−111301520659.3848
211−11−1−1301530558.13149
221−11−11301530559.35901
231−111−1301530658.12574
241−1111301530659.36140
2511−1−1−1302520558.10
2611−1−11302520559.30
2711−11−1302520658.10
2811−111302520659.30.1
29111−1−1302530558.10
30111−11302530559.320
311111−1302530658.11
3211111302530659.3120
332000036.92025608.730
34−2000013.12025608.71275
35020002531.925608.70
360−2000258.125608.79800
3700200252036.9608.71080
3800−200252013.1608.70
390002025202548.18.70
40000−2025202571.98.7964
41000022520256010.10
420000−2252025607.30
4300000252025608.73000
4400000252025608.73000
4500000252025608.73000
4600000252025608.73000
4700000252025608.73000
4800000252025608.73000
4900000252025608.73000
5000000252025608.73000
Table 4. Optimal technological parameters for electroless Ni–W–P plating.
C(NiSO4)C(Na2WO4)C(NaH2PO2)TpHPredicted Failure Time
20 g/L15 g/L30 g/L65 °C9.39268.5 min
Table 5. Variance analysis result for the quadratic regression equation.
Coefficients of the ModelEstimated Values of the CoefficientsDegrees of FreedomSum of SquaresF Valuep-Value (Prob > F)
β03048.46
X1−538.1011.254 × 10717.60.0002
X2−1767.9911.354 × 108190.03<0.0001
X3898.2513.495 × 10749.05<0.0001
X4326.0114.604 × 1066.460.0166
X5545.3311.288 × 10718.080.0002
X12−371.3817.664 × 10610.760.0027
X22379.4818.002 × 10611.230.0022
X32−391.2718.507 × 10611.940.0017
X42−401.5218.959 × 10612.570.0014
X52−486.7311.316 × 10718.480.0002
X1X2436.7516.104 × 1068.570.0066
X1X3−143.0016.544 × 1050.920.3458
X1X4−366.0613.614 × 1065.070.0321
X1X5−291.8112.725 × 1063.820.0602
X2X3−939.5012.825 × 10739.64<0.0001
X2X4−196.9311.241 × 1061.740.1972
X2X5−560.1811.004 × 10714.090.0008
X3X449.6817.899 × 1040.110.7416
X3X5326.9313.420 × 1064.800.0366
X4X5134.8815.821 × 1050.820.3735
The underline shown in the Table 5 means the preparation factors related to the significant effect on corrosion resistance performance of coating.
Table 6. Reliability analysis result of the simplified quadratic regression equation.
SourceSum of SquaresDFMean SquareF ValueProb > F
Model2.892 × 108132.224 × 10724.28<0.0001
Residual3.298 × 107369.161 × 105
Lack of Fit3.298 × 107291.137 × 106
Pure error070
R2 = 89.76%, R2adj = 86.07%, R2pred = 70.43%
Adeq precision = 21.130
Note: R2pred = 0.7043 is in a reasonable agreement with R2adj = 0.8607. DF is the degrees of freedom in analysis of variance.
Publisher’s Note: MDPI stays neutral with regard to jurisdictional claims in published maps and institutional affiliations.

