Article

Laboratory Experimental Study on Influencing Factors of Drainage Pipe Crystallization in Highway Tunnel in Karst Area

1
Sichuan Lehan Expressway Co., Ltd., Leshan 614000, China
2
State Key Laboratory of Mountain Bridge and Tunnel Engineering, Chongqing Jiaotong University, Chongqing 400074, China
3
College of Civil Engineering, Chongqing Jiaotong University, Chongqing 400074, China
4
College of Architectural Engineering, Neijiang Normal University, Neijiang 641112, China
*
Author to whom correspondence should be addressed.
Coatings 2021, 11(12), 1493; https://doi.org/10.3390/coatings11121493
Submission received: 29 October 2021 / Revised: 25 November 2021 / Accepted: 1 December 2021 / Published: 3 December 2021
(This article belongs to the Special Issue Corrosion and Degradation of Materials)

Abstract

:
The crystalline blockage of tunnel drainage pipes in a karst area seriously affects the normal operation of drainage system and buries hidden dangers for the normal operation of the tunnel. In order to obtain the influencing factors and laws of tunnel drainage pipe crystallization in a karst area, based on the field investigation of crystallization pipe plugging, the effects of groundwater velocity, drainage pipe diameter, drainage pipe material, and structure on the crystallization law of tunnel drainage pipe in karst area are studied by indoor model test. The results show that: (1) With the increase of drainage pipe diameter (20–32 mm), the crystallinity of drainage pipes first increases and then decreases. (2) With the increase of water velocity in the drainage pipe (22.0–63.5 cm·s−1), the crystallinity of the drainage pipes gradually decreases from 1.20 g to 0.70 g. (3) The crystallinity of existing material drainage pipe is: M3 (poly tetra fluoroethylene) > M2 (pentatricopeptide repeats) > M4 (high density polyethylene) > M1 (polyvinyl chloride); M8 (polyvinyl chloride + coil magnetic field) is used to change the crystallinity of drain pipe wall material. (4) When the groundwater flow rate is 34.5 cm·s−1, M1 (polyvinyl chloride) and M8 (polyvinyl chloride + coil magnetic field) can be selected for the tunnel drainage pipe. The research on the influencing factors of tunnel drainage pipe crystallization plugging fills a gap in the research of tunnel drainage pipe crystallization plugging. The research results can provide a basis for the prevention and treatment technology of tunnel drainage pipe crystallization plugging.

1. Introduction

With the accelerated development and modernization of China, the construction of railways and expressways in China has obviously developed by leaps and bounds. There are numerous tunnels in hard water regions in Southwest China. Water in this geological environment contains nearly saturated bicarbonate and calcium ions, which flow with groundwater into drainage pipes, slowly form calcium carbonate (CaCO3) crystals, and precipitate to clog tunnel drainage systems (Figure 1). The clogging of tunnel drainage pipes may seem to be a minor problem, but it can lead to substantial hidden dangers to the safety of the entire tunnel lining structure and the normal operation of the drainage system.
The problem of tunnel damage due to crystallization has long been recognized around the world. When SIc (calcite saturation index) is greater than 1.0, calcium carbonate deposition begins to occur rapidly. Then, in the downstream direction, the pH value and SiC of water no longer increase, but decrease [1]. The presence of phosphate ions in the precipitating solution stabilizes the initially formed vaterite by significantly reducing the rate of transformation of vaterite to calcite [2]. Within a certain concentration range of Ca2+ and CO32−, the magnetic field has a significant inhibition effect on the growth and precipitation of CaCO3 crystals [3]. The magnetic field affects the phase equilibrium of CaCO3 polymorphs by influencing the CO2/water interface or through the hydration of CO32− ions [4]. Magnetic treatment can significantly lower the pH of the solution and, in the meantime, reduce the deposition of scale by 48% [5]. The activation energy of water molecules at high temperatures is 3.16 kcal·mol−1 higher than that at low temperatures and is close to the hydrogen bond energy between water and polyacrylate [6]. The diffusion coefficient of water molecules increases continuously as the temperature of aqueous solutions increases, while the diffusion coefficients of Ca2+ and CO32− are relatively small at 293 K [7]. Ions in aqueous solutions most readily react at 353 K to form ion pairs, which then grow into crystallites, and are least likely to crystallize at 343 K [8]. The orders of binding energies of polymers with two calcite crystal surfaces are polyacrylic acid (PAA) > acrylic acid-methyl acrylate copolymer (AA-MA) > polymethylacrylic acid (PMAA) [9]. The solubility of CaCO3 in water increases as the water activity increases [10]. The scale inhibition effect of magnetic fields is related to the magnetic flux density, and the relationship between the two is not a monotonic but rather a multi-extreme function [11]. With the increase of temperature (20–80 °C), the carbonate mineral crystal mainly changes from granular or acicular single crystal to granular and needle crystal aggregate, and the crystallization degree changes from heteromorphic or semi automorphic to automorphic [12]. Scaling quantity increased with increasing the initial concentration of Ca2+ and SO42−, the influence of HCO3 and pH on scaling quantity was little, and the scale would dissolve with increasing Cl [13]. Bacteria and fungi can promote or lead to karst erosion, and some bacteria in water can promote the formation of CaCO3 precipitation [14]. Bacteria are the main producers of CO2 in soil [15] and can lead to CaCO3 crystallization [16,17]. The terpolymer β-CD-MA-SSS has a scale inhibition rate of nearly 99.9% for CaCO3 [18]. Currently, this substance is the most widely used scale inhibitor [19]. The crystal of the tunnel drainage system is mainly insoluble calcium carbonate [20,21,22,23], which is mainly calcite crystal form. When the pH value is 8~10, the crystallinity of the semi filled pipe is higher. When the pH value is 11, the crystallinity of the full filled pipe is gradually higher than that of the semi filled pipe 23 days after the start of the test, and the crystallinity is greatly affected by the pH value; the crystals are calcite. The higher the pH value when the main crystal form is spindle shape, the closer the accumulation, and the smaller and uniform the grain size [24]. The main influencing factors of tunnel drainage pipe crystallization blockage are groundwater type, shotcrete characteristics, physicochemical conditions of drainage pipe solution crystallization and drainage pipe deposition conditions [25].
It can be seen from the above research literature that there has been some research on the blockage of tunnel drainage pipe, but it is still in its infancy. For example, a lot of research work needs to be carried out on the influencing factors of crystallization blockage of tunnel drainage pipe. Therefore, aiming at the problem of crystalline plugging of tunnel drainage pipe, based on the field investigation, this paper analyzes the effects of groundwater velocity, drainage pipe diameter and drainage pipe material on the crystallization law of drainage pipe using the methods of indoor orthogonal model experiment and quantitative and qualitative analysis to determine what materials and parameters of drainage pipe that can prevent crystallization blockage suitable for tunnel field application. The overall structure of the paper is as follows: Section 2 explores the indoor model test design, while Section 3 provides the results of the indoor model test. Section 4 is a quantitative and qualitative analysis of the results and discussion of the indoor model test. Section 5 indicates the research conclusions.

2. Theoretical Tests

2.1. Research Route

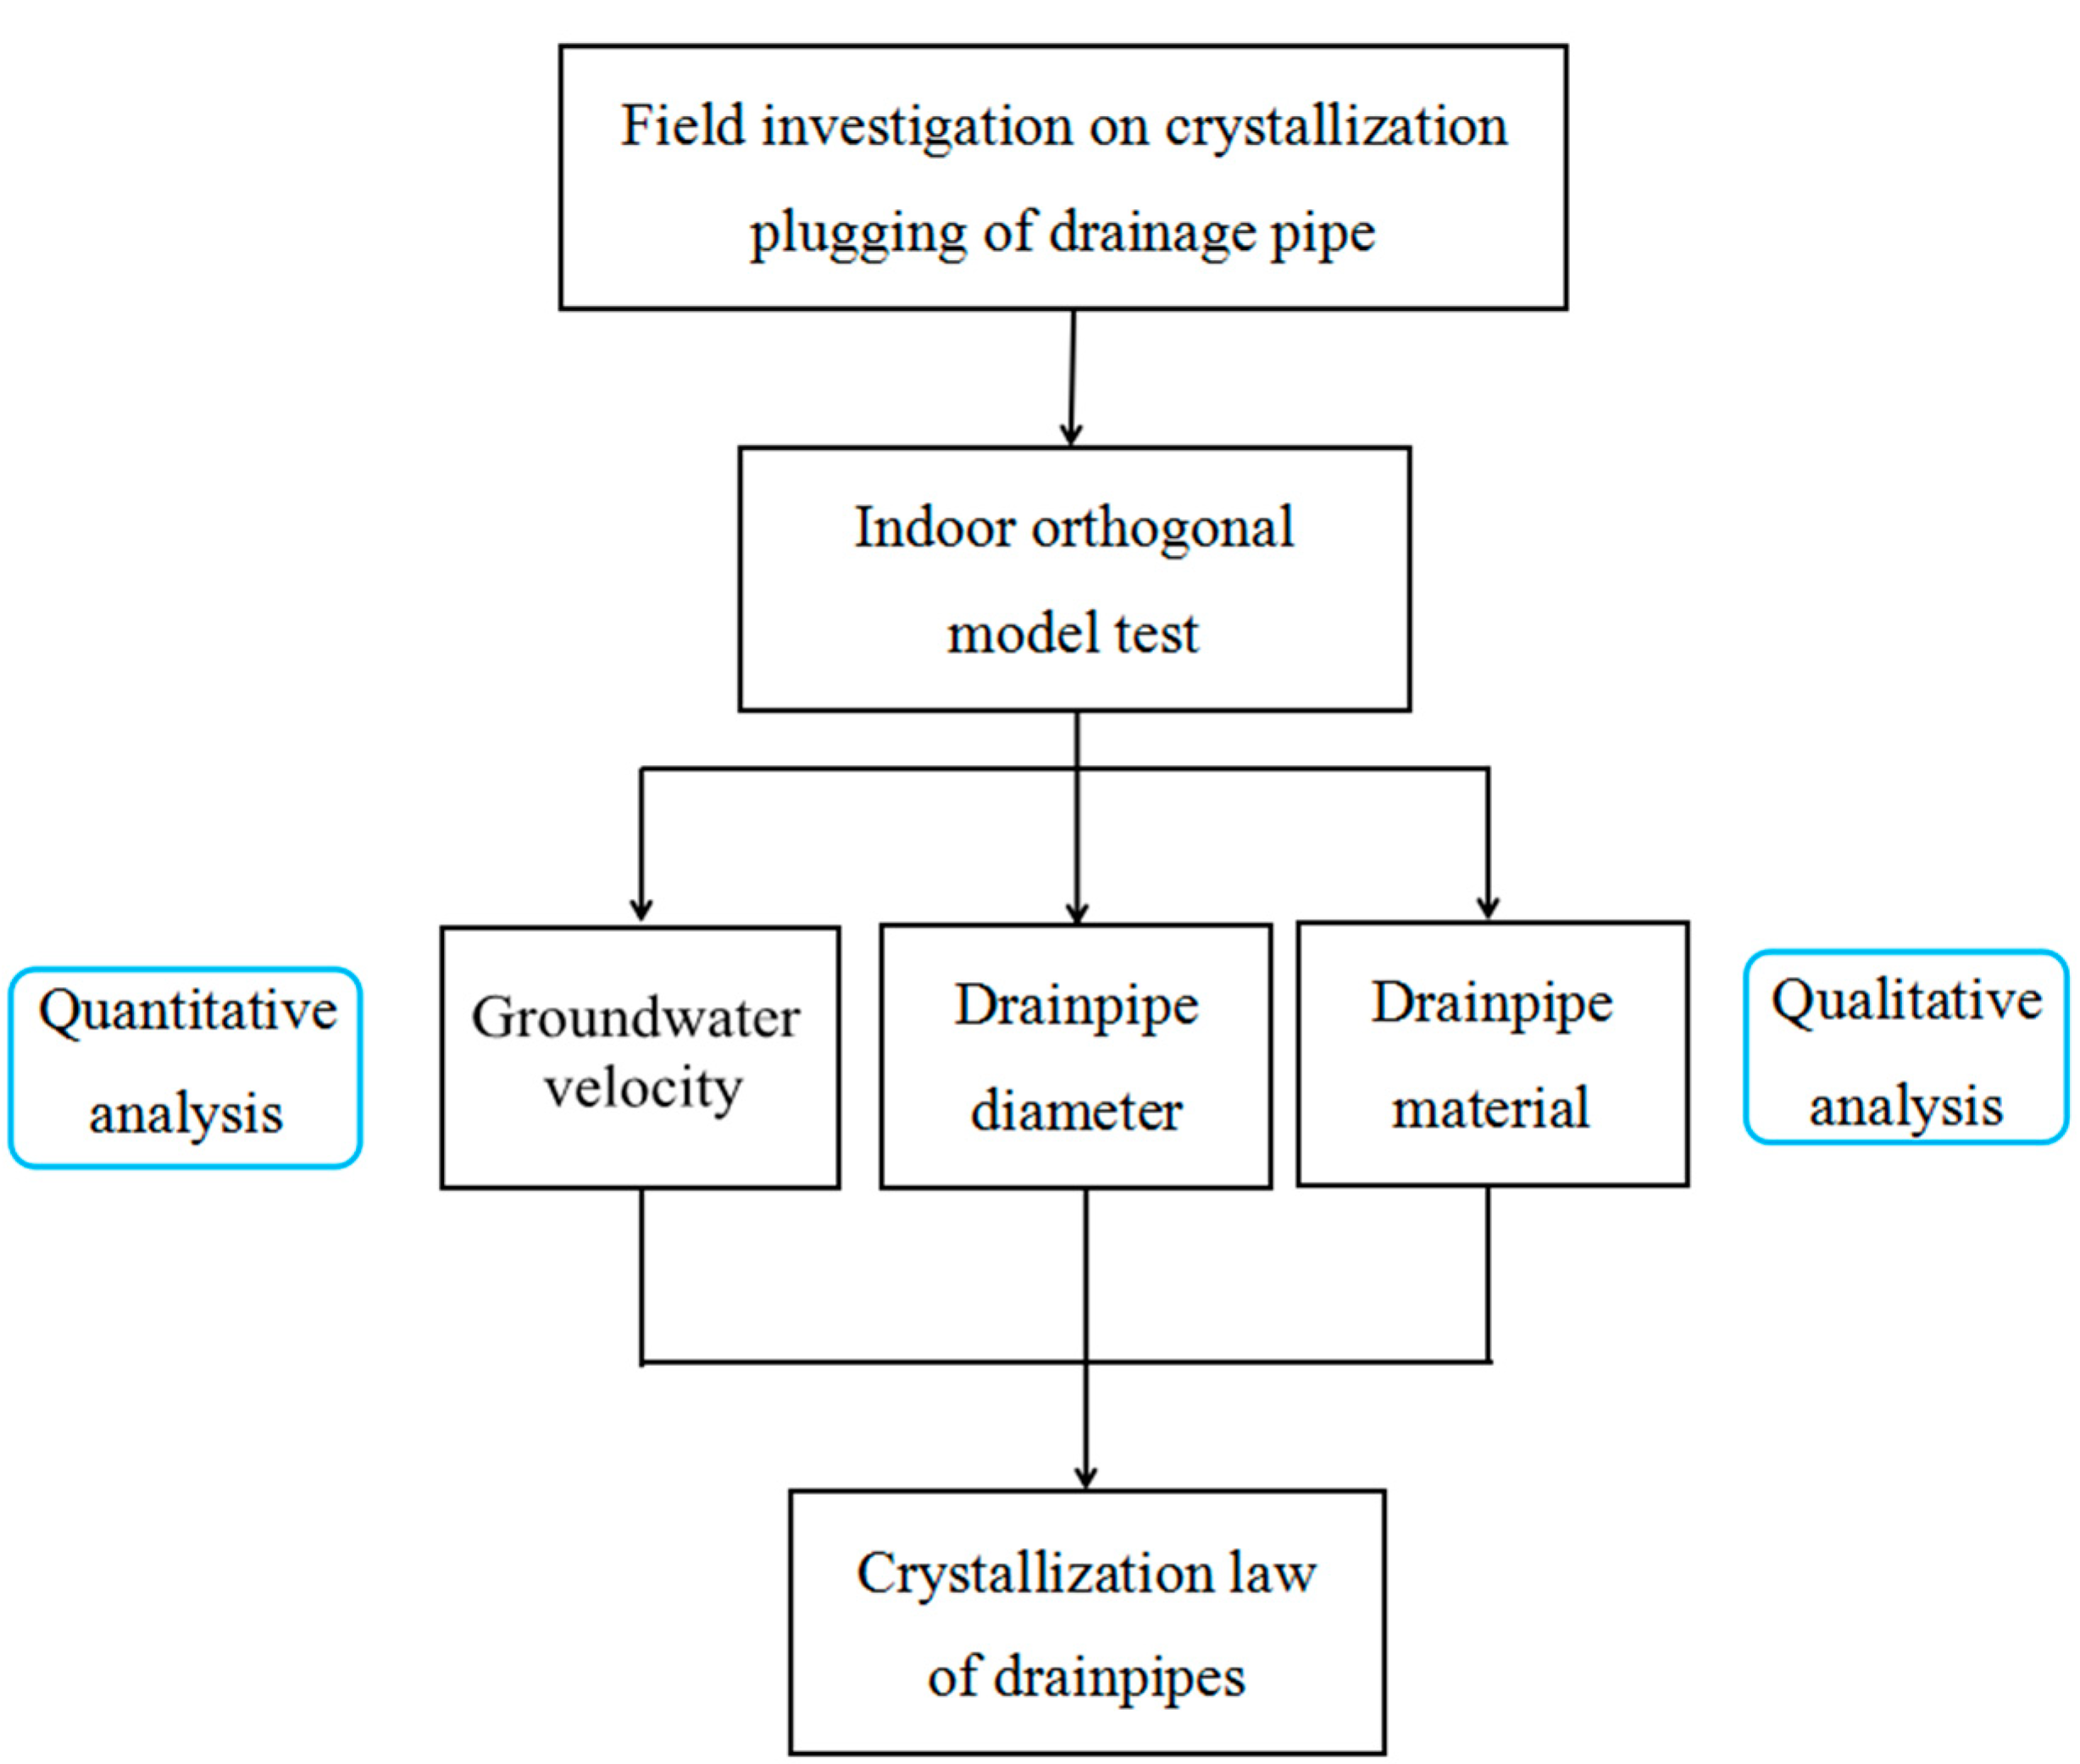
Based on the field investigation, this paper analyzes the influence of three factors on the crystallization of drain pipe: the flow rate of groundwater in the drain pipe, the diameter of drain pipe and the material of drain pipe. The main research route is shown in Figure 2.

2.2. Test Scheme

Three sets of laboratory tests were designed to assess the drainage pipe diameter, pipe material, and flow velocity. Based on the test contents, a test apparatus was designed and custom built (Figure 3) and mainly consisted of a water tank, a pump, a ball valve, and test pipes. Table 1 lists the variable values set for the main influencing factors of the tests. The indoor test run is shown in Figure 4. The drainage pipe used in the test is the drainage pipe sold in the market, and its durability meets relevant standards.
The tests were conducted at room temperature. The test solution was prepared from anhydrous CaCl2, NaHCO3, and deionized water. The aqueous solution was circulated for a total of 50 days, which was divided into five 10-day test cycles. After the completion of each cycle, the test was stopped, and the pipe section under study was dried and weighed.

2.3. Test Solution

A field investigation showed that the groundwater in the region where the engineering project is located is composed of clastic rock pore fracture water, carbonate rock fracture karst water, and loose rock pore water. Water samples were taken at K108+435 of the right line of the Dayan Tunnel of the Emeishan-Hanyuan Expressway for testing and analysis. The composition and content of various major anions and cations in water sample solutions were determined, and the corresponding test results are shown in Table 2.
The selected water samples were rich in a variety of ions, including cations such as Ca2+, Mg2+, K+, and Na+. Ca2+ was the most abundant cation, accounting for 63.50% of the total. The most common anions were HCO3, SO42−, and Cl, and HCO3 was the most abundant, accounting for 79.48% of the total.
The analysis of the data in Table 2 indicated that the presence of a wide range of anions and cations in the natural water samples would increase the number of factors affecting crystallization in tunnel drainage pipes and the sensitivity of these factors. To achieve controllability and operability of the factors influencing crystallization and to minimize repetition in the laboratory tests, representative types of anions and cations in the water samples were determined for the tests. Ca2+ and HCO3 were selected, and accordingly, a saturated CaHCO3 solution was used as the test solution.

3. Results

3.1. Effect of Pipe Diameter

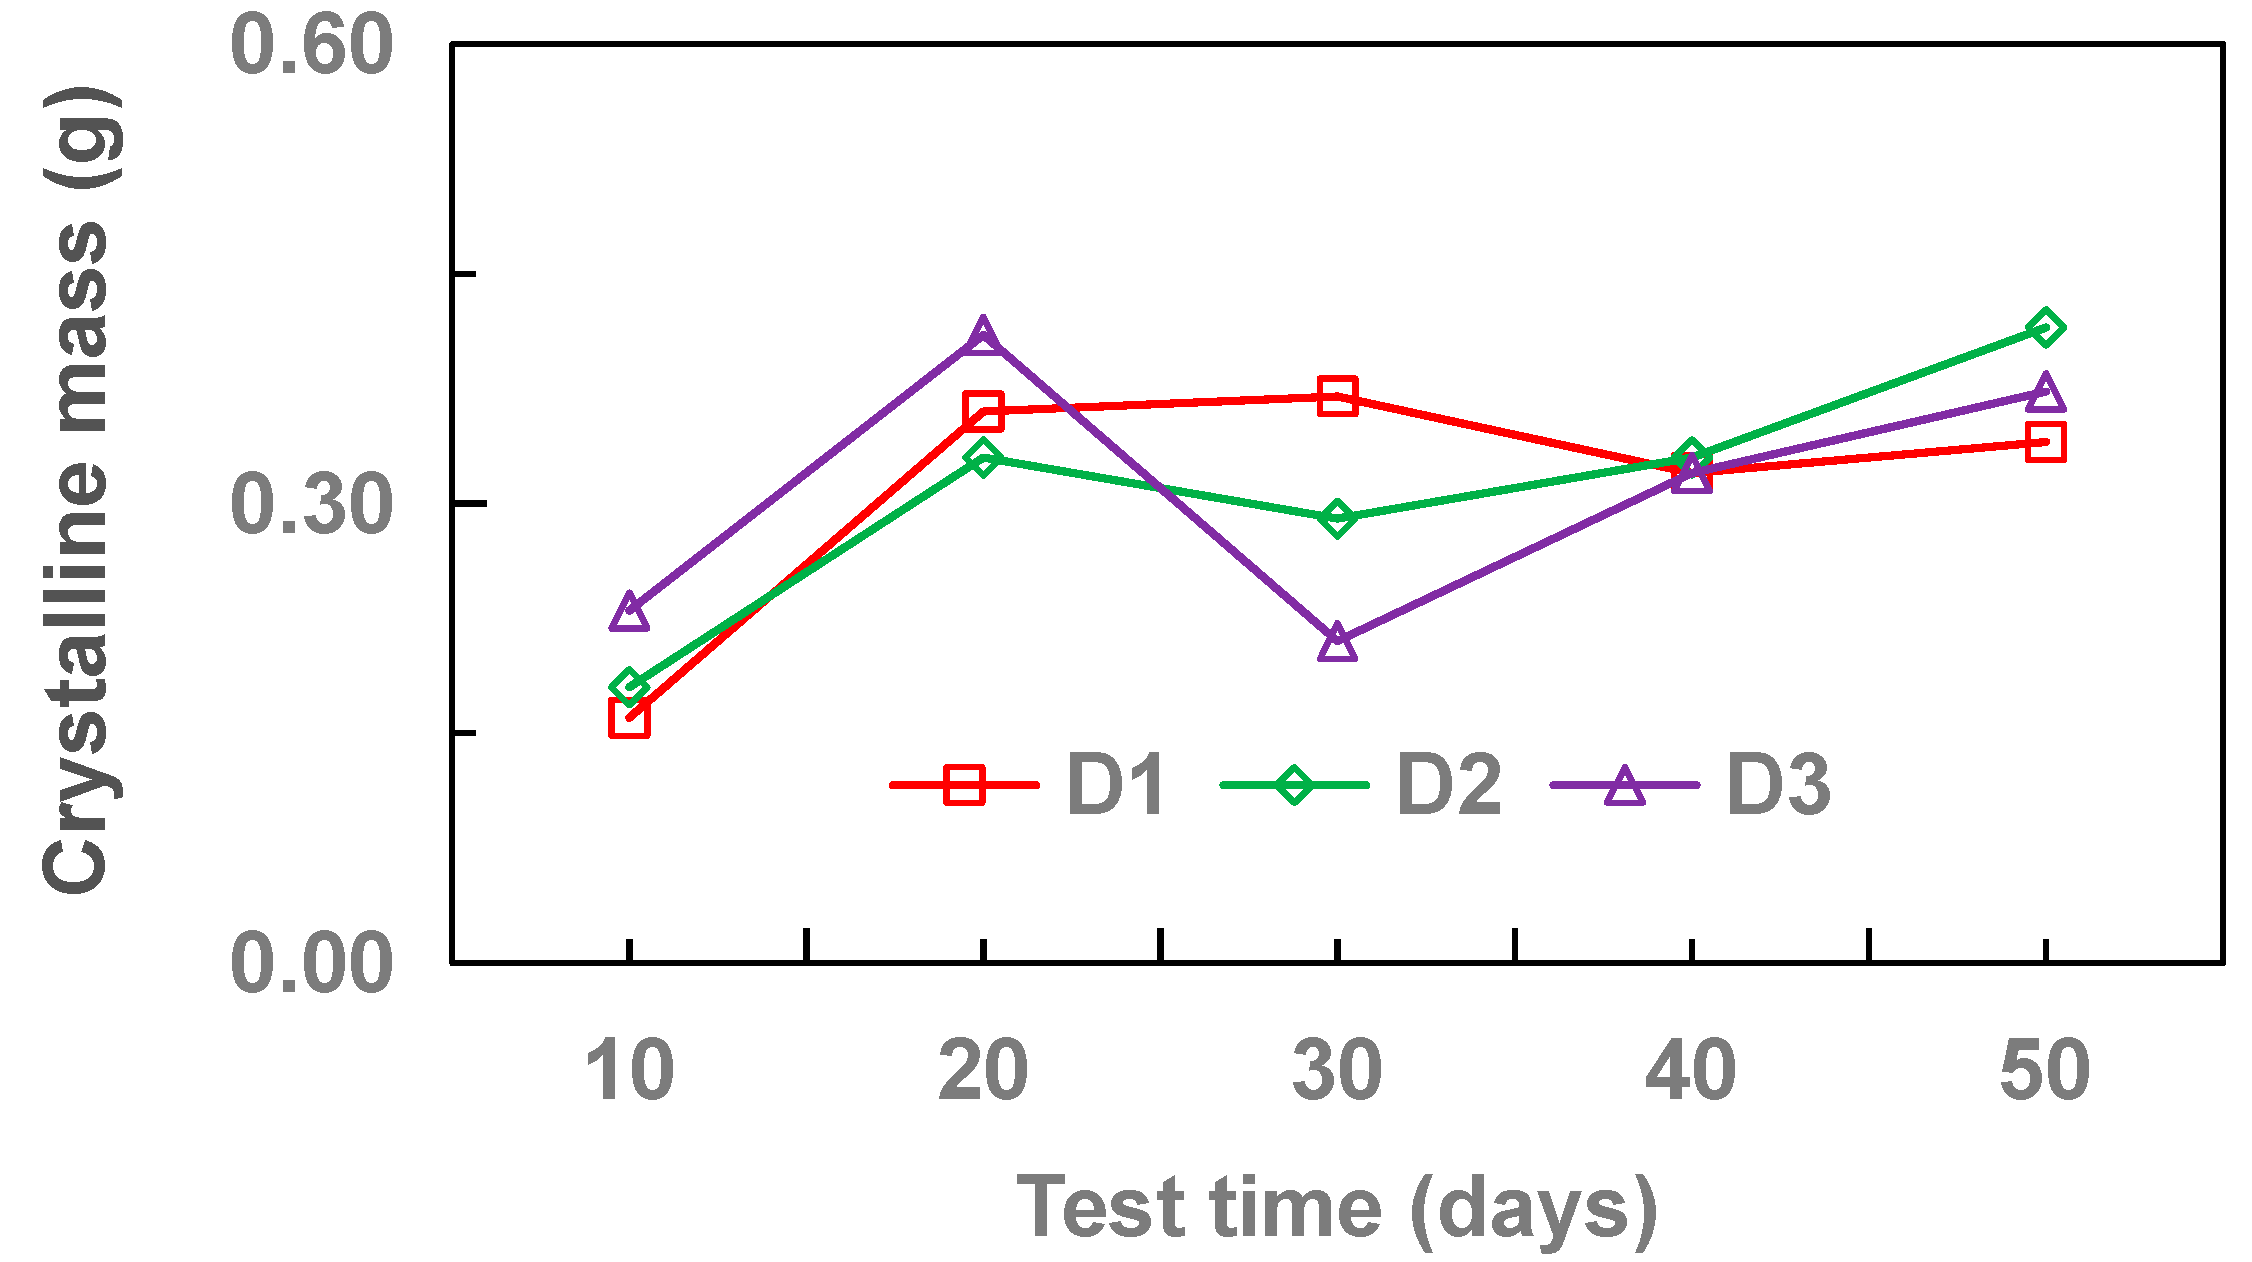
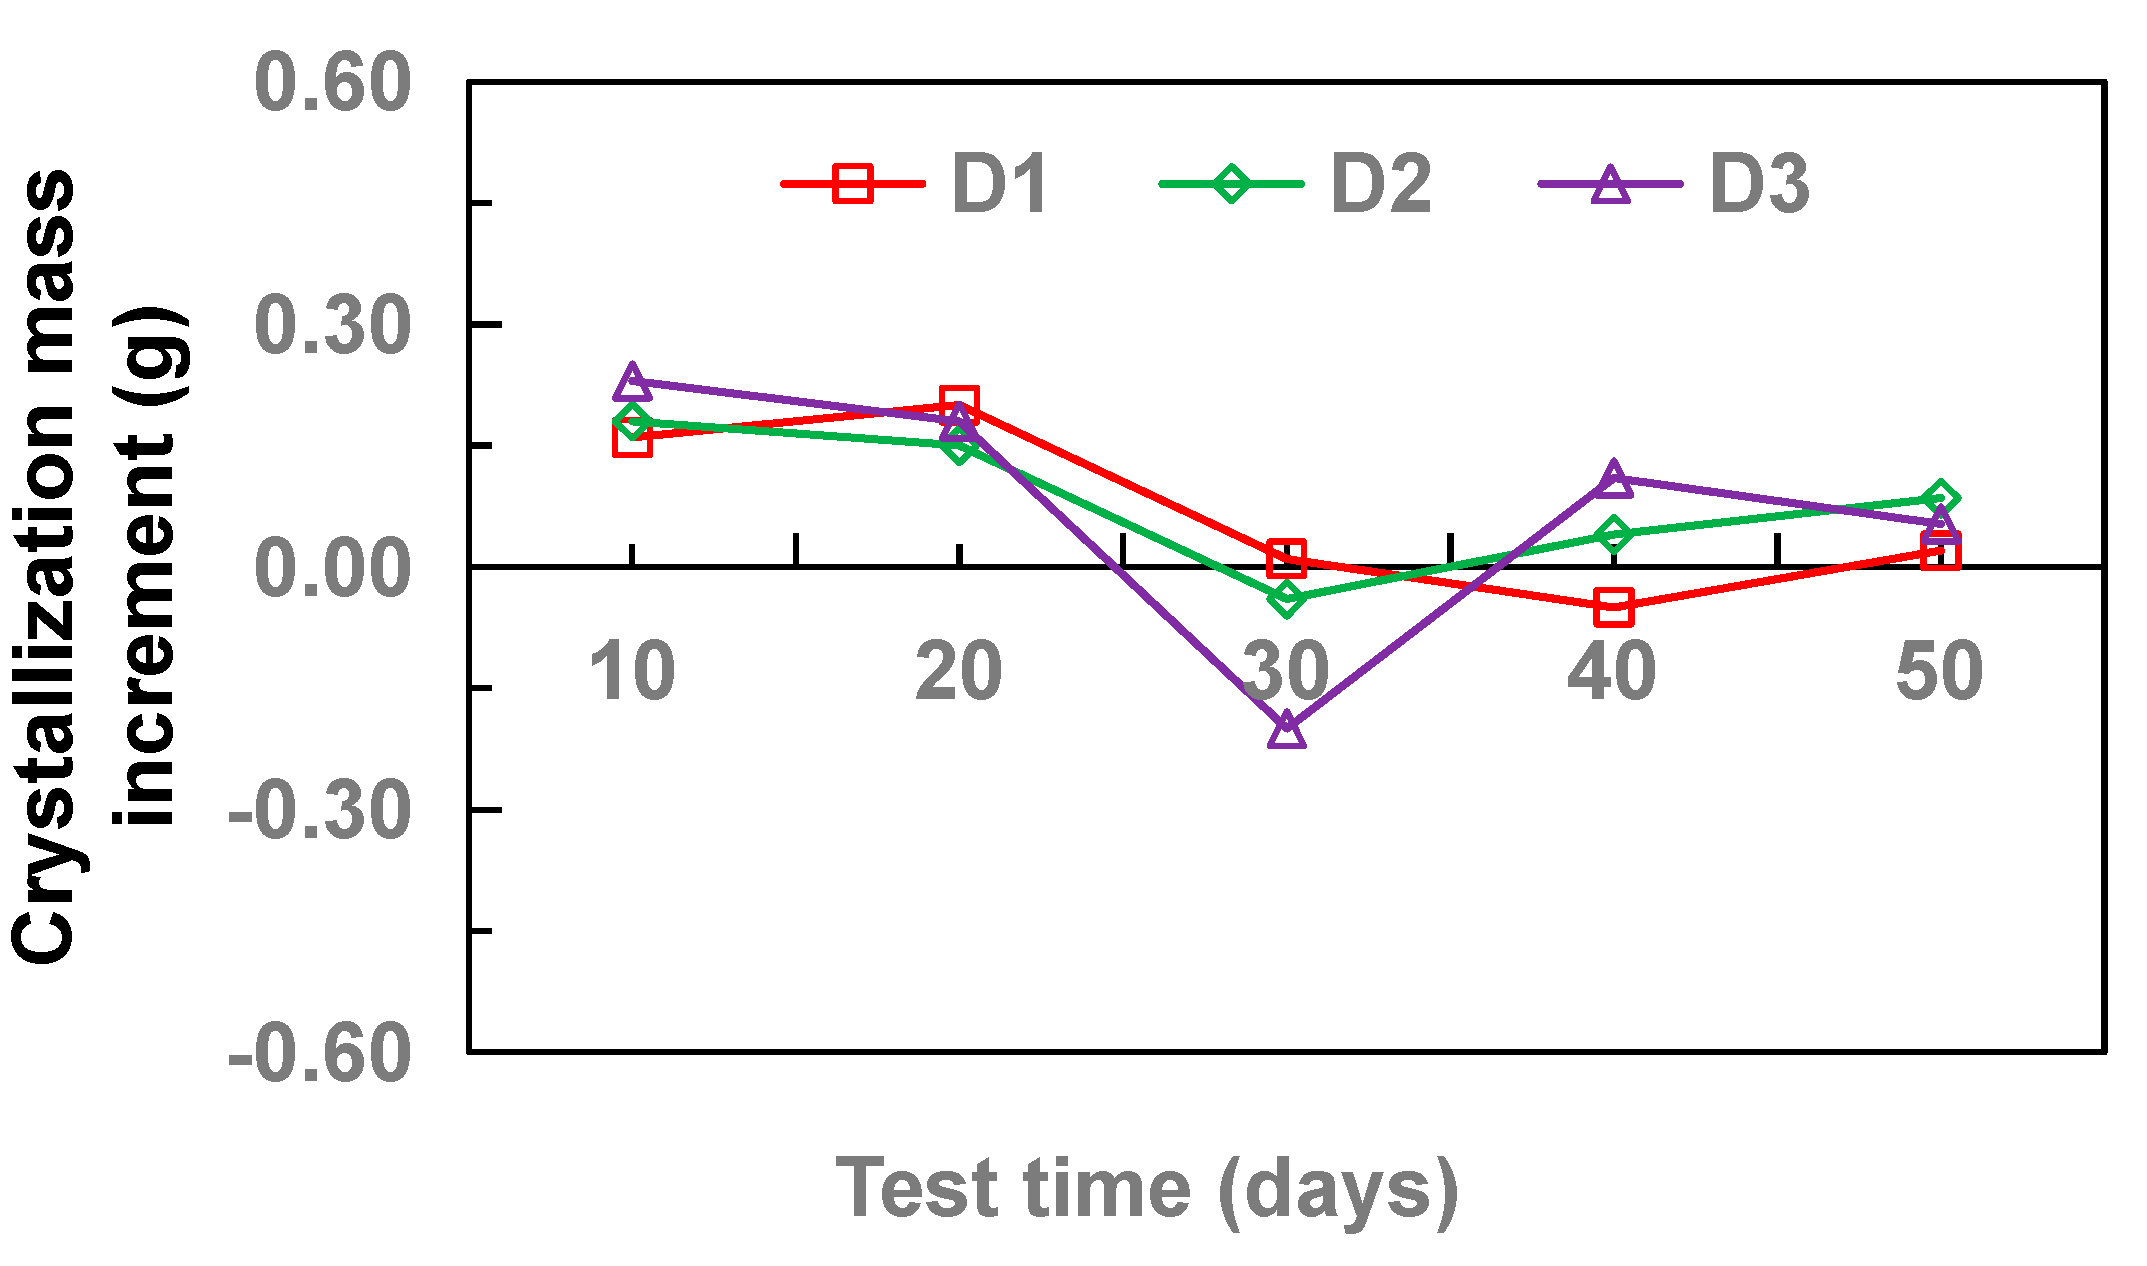
To investigate the effect of the diameter of drainage pipes on crystallization, three pipe diameters (20 mm, 25 mm, and 32 mm) were used, and the flow velocity was controlled at 34.5 cm·s−1. Each type of pipe was completely filled during the test. The variation in the mass of crystals with time is shown in Figure 5, and the variation in the increase in the mass of crystals with time is shown in Figure 6.
Figure 5 shows that (1) the 25-mm pipe (D2) was the most sensitive to CaCO3 crystallization and had the largest change in the mass of crystals, with the maximum and minimum being 0.415 g and 0.18 g, respectively; in other words, the difference between the maximum and minimum was 0.235 g, and the maximum was more than 2.3 times the minimum; (2) the difference between the maximum and the minimum masses of crystals in the 20-mm pipe (D1) was 0.21 g, and the maximum was 2.3 times the minimum, exhibiting a pattern that was the same as that in the case of the 25-mm pipe (D2); and (3) the 32-mm pipe (D3) was the most stable, where the difference between the maximum and minimum masses of crystals was 0.2 g, and the maximum was 1.95 times the minimum.
Figure 6 indicates that the variation in the mass of crystals in the 20-mm pipe (D1) was characterized by a fast increase in the early phase followed by gradual stabilization with time. The curves of all three types of pipe showed a negative growth, indicating that the pipe wall played a role in weakening the crystallization for a certain period of time. The mass of crystals in the 32-mm pipe (D3) experienced the largest negative growth, reaching 0.2 g, which was 20 and 5 times the negative growth in the 20-mm and 25-mm pipes, respectively. In addition, Figure 6 shows that for all types of pipe, the mass of crystals started to increase abruptly after reaching the minimum negative growth. During the test, there was initially a large interaction between the crystals and the pipe wall, which was favorable to the formation of crystals. In a later phase, the interaction between the CaCO3 crystals and the pipe wall was surpassed by the interaction between the CaCO3 crystals themselves, which mainly played a repulsive role. Under the continued action of water flow, the presence of friction reduced the originally formed crystals, thereby resulting in the phenomenon of negative growth. As the circulation test proceeded, the surface of crystals was covered continuously by other tiny particles and impurities in the solution, thereby resulting in growth again in the later phase. The above process occurred cyclically during the test.

3.2. Effect of Flow Velocity

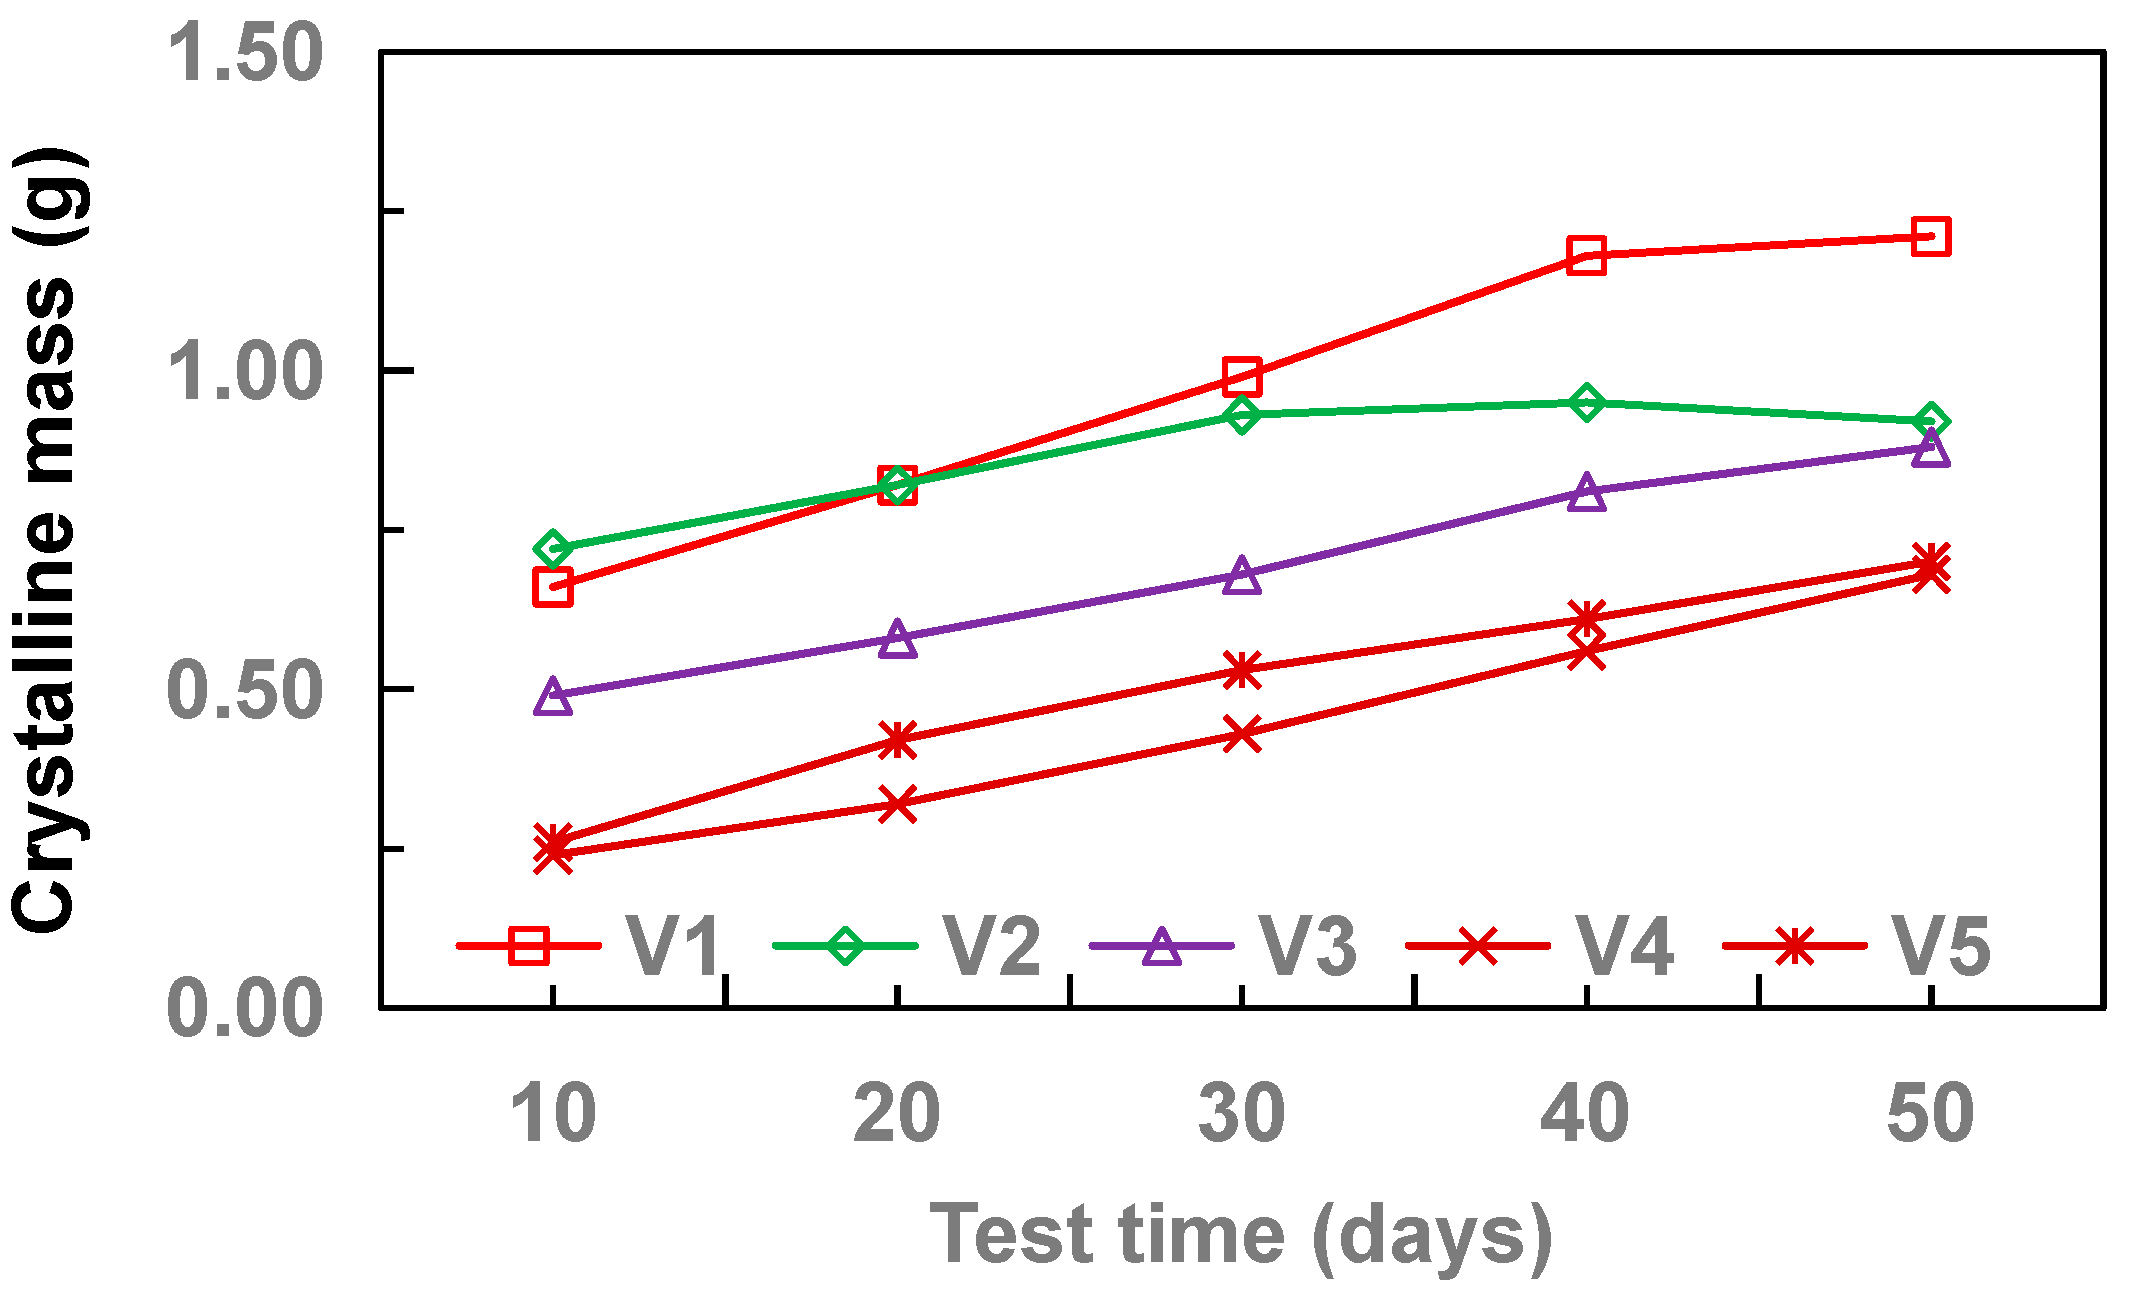
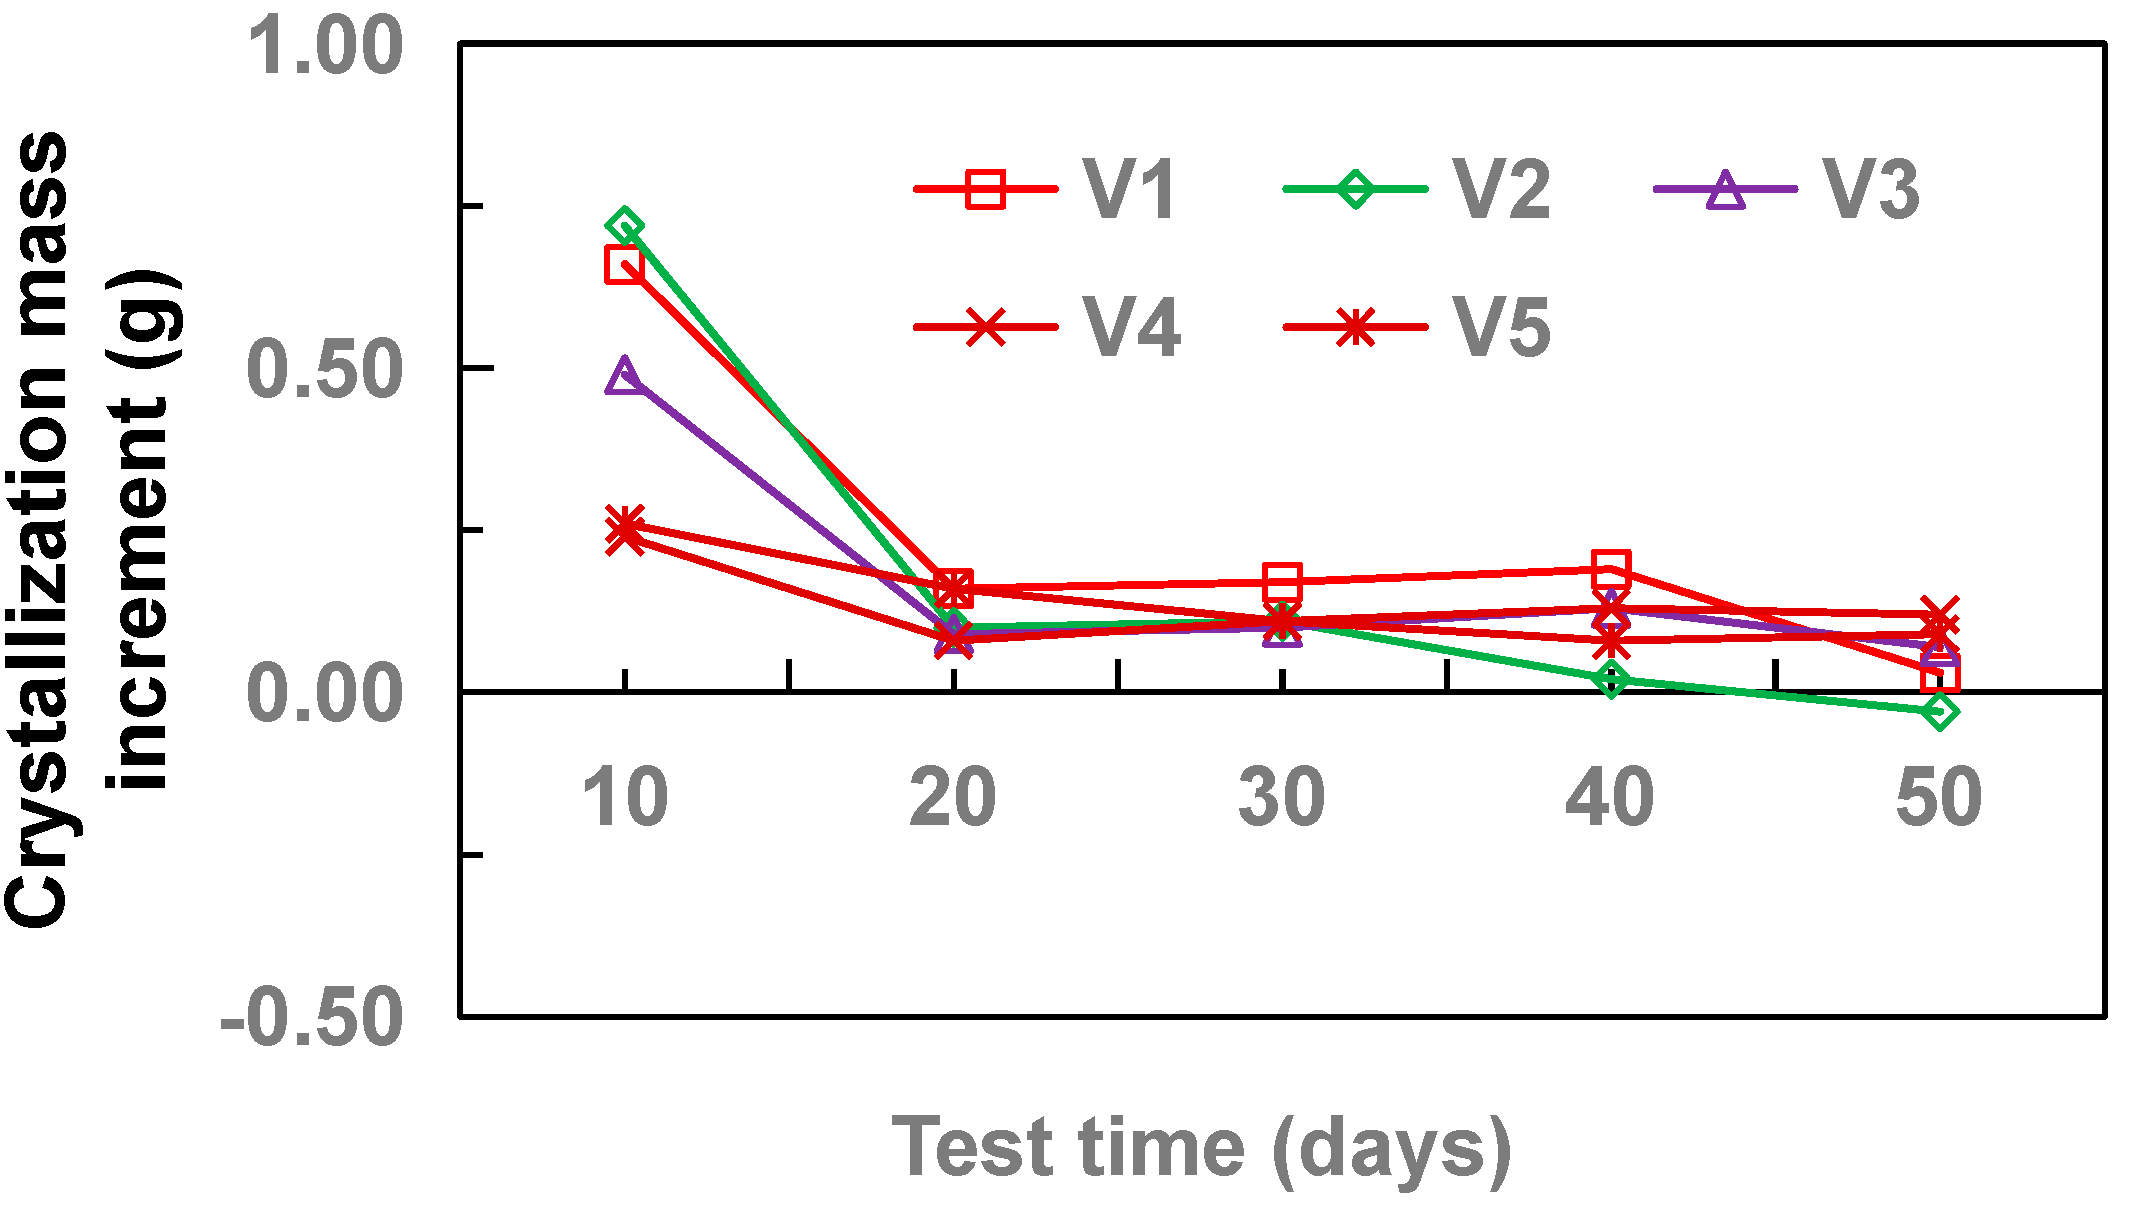
The effect of the flow velocity on crystallization in drainage pipes was investigated using a 32-mm polyvinyl chloride (PVC) pipe and considering five different flow velocities (22 cm·s−1, 26.5 cm·s−1, 34.5 cm·s−1, 44.5 cm·s−1, and 63.5 cm·s−1). The variation in the mass of crystals with time is shown in Figure 7, and the variation in the increase in the mass of crystals with time is shown in Figure 8.
Figure 7 shows that, overall, the rate of crystallization was faster in the pipes with a low flow velocity than in the pipes with a high flow velocity. Specifically, the results reveal the following: (1) Under a flow velocity of 22 cm·s−1, the difference between the maximum and minimum crystal mass was 0.55 g; and the maximum was 1.83, 1.32, 1.8, 2.83, and 2.69 times the minimum for flow velocities of 26.5 cm·s−1, 34.5 cm·s−1, 44.5 cm·s−1, and 63.5 cm·s−1, respectively. (2) Under the influence of each flow velocity, the mass of crystals first increased, then reached the saturated state in the later phase, and remained stable, with the crystallization rate slowing down gradually. In the early phase, there was a high interaction force between the pipe wall and the CaCO3 crystals, resulting in the attachment of a large mass of crystals to the pipe wall and the gradual accumulation of impurities in the solution. In the later phase, the interaction between the CaCO3 crystals and the pipe wall was no longer dominant, and its effect gradually weakened. Meanwhile, the precipitates on the wall were rounded under the continuous impact of the water flow, so the change in mass was very small. Figure 8 shows that the phenomenon of negative growth in the mass of crystals occurred only under a flow velocity of 26.5 cm·s−1, exhibiting a negative growth of 0.03 g, i.e., on the order of magnitude of 0.01 g, which was very small compared to the order of magnitude of 1 g under a flow velocity of 26.5 cm·s−1. There was a large fluctuation in the mass of crystals in the pipes with a high flow velocity.

3.3. Effect of Pipe Material

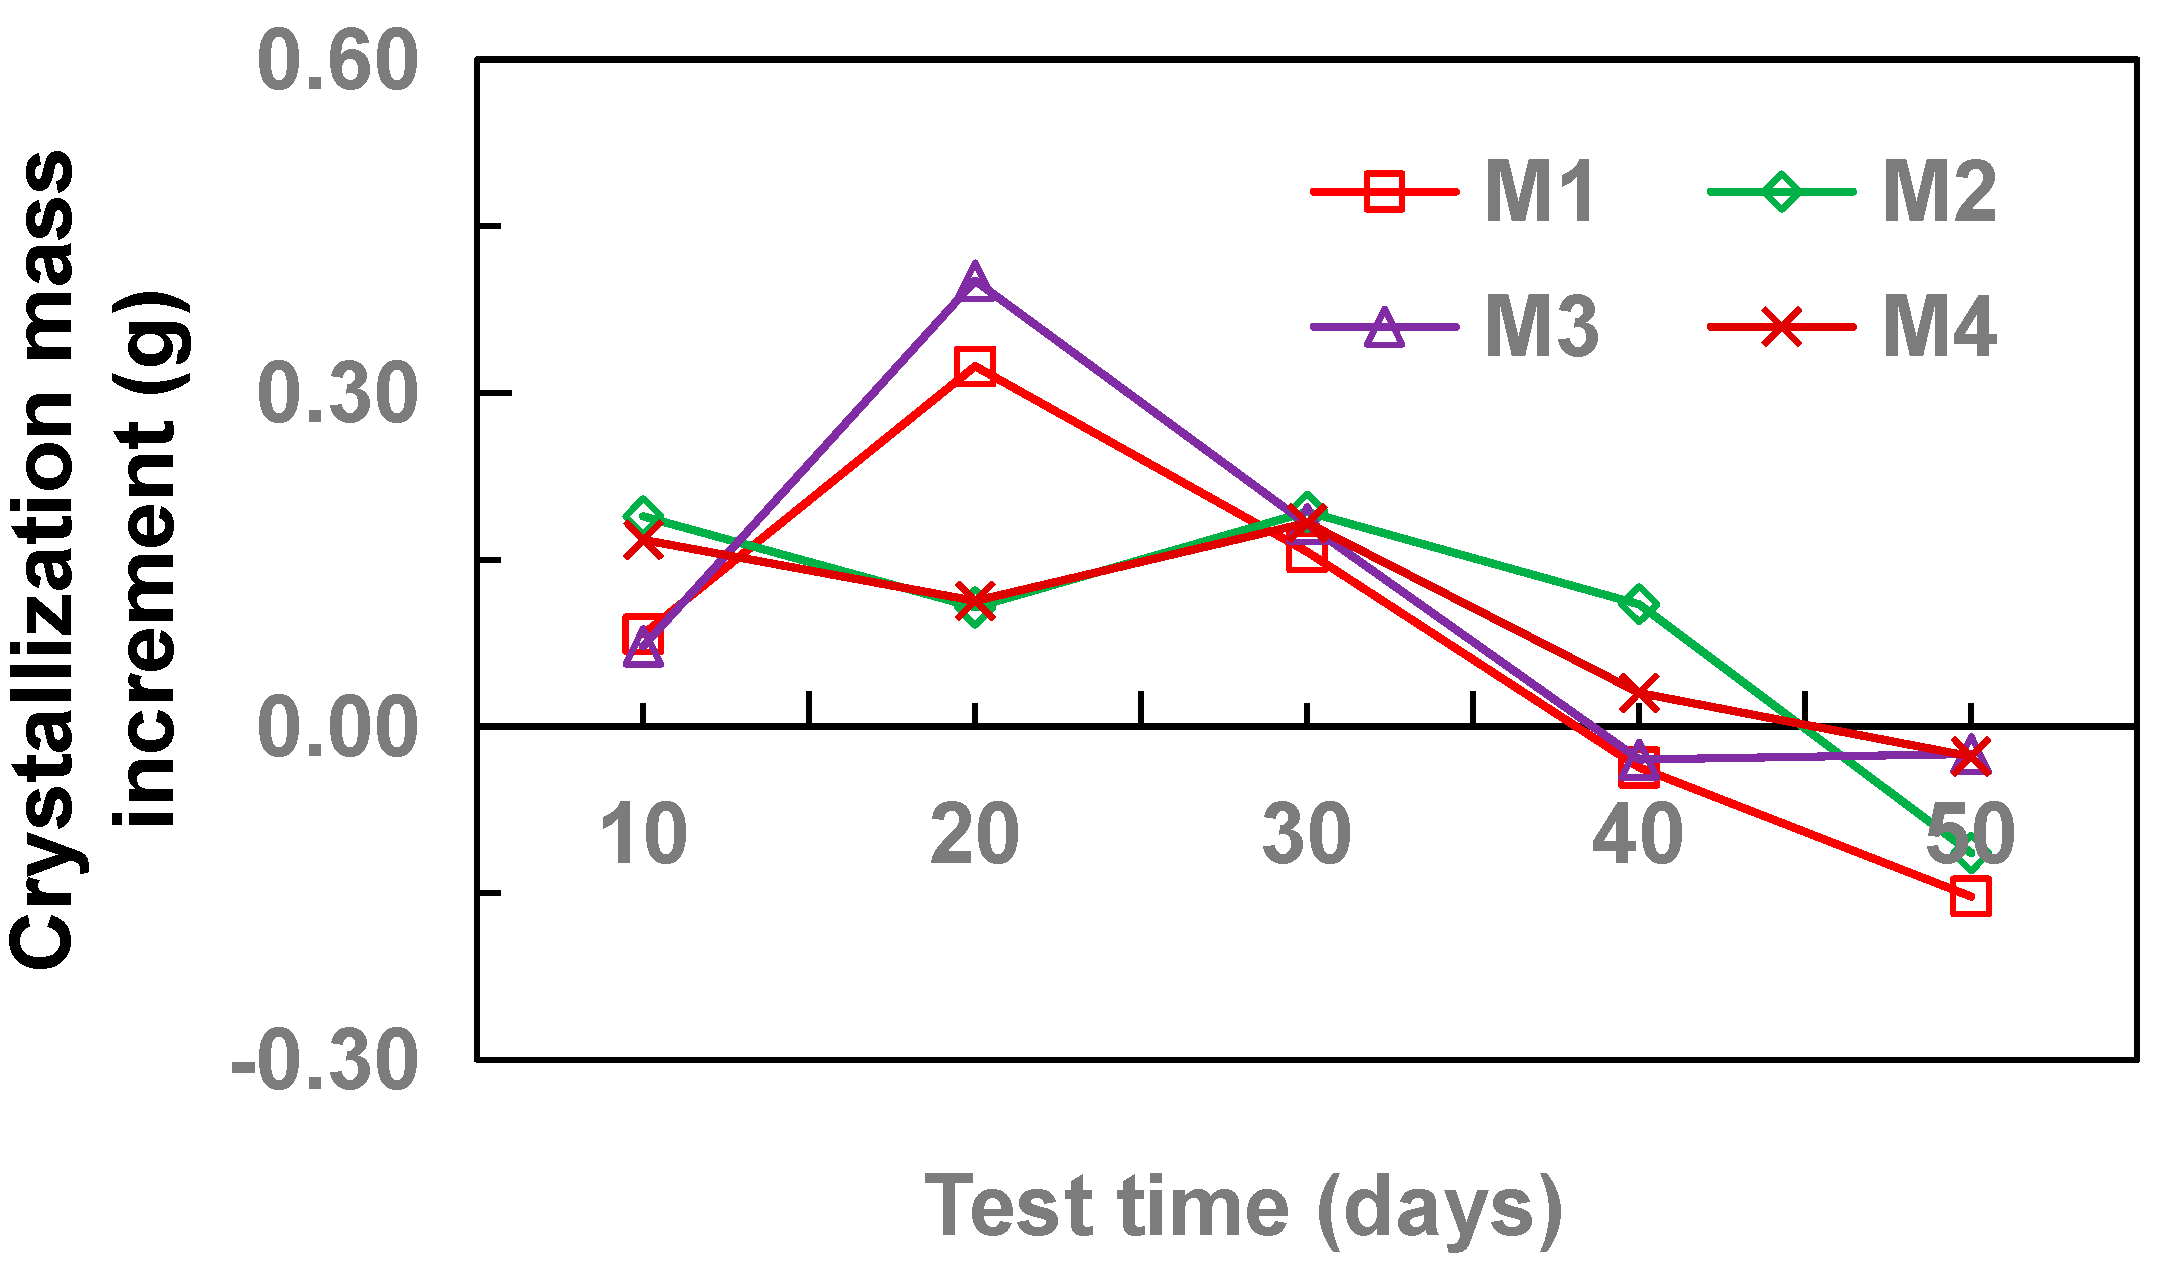
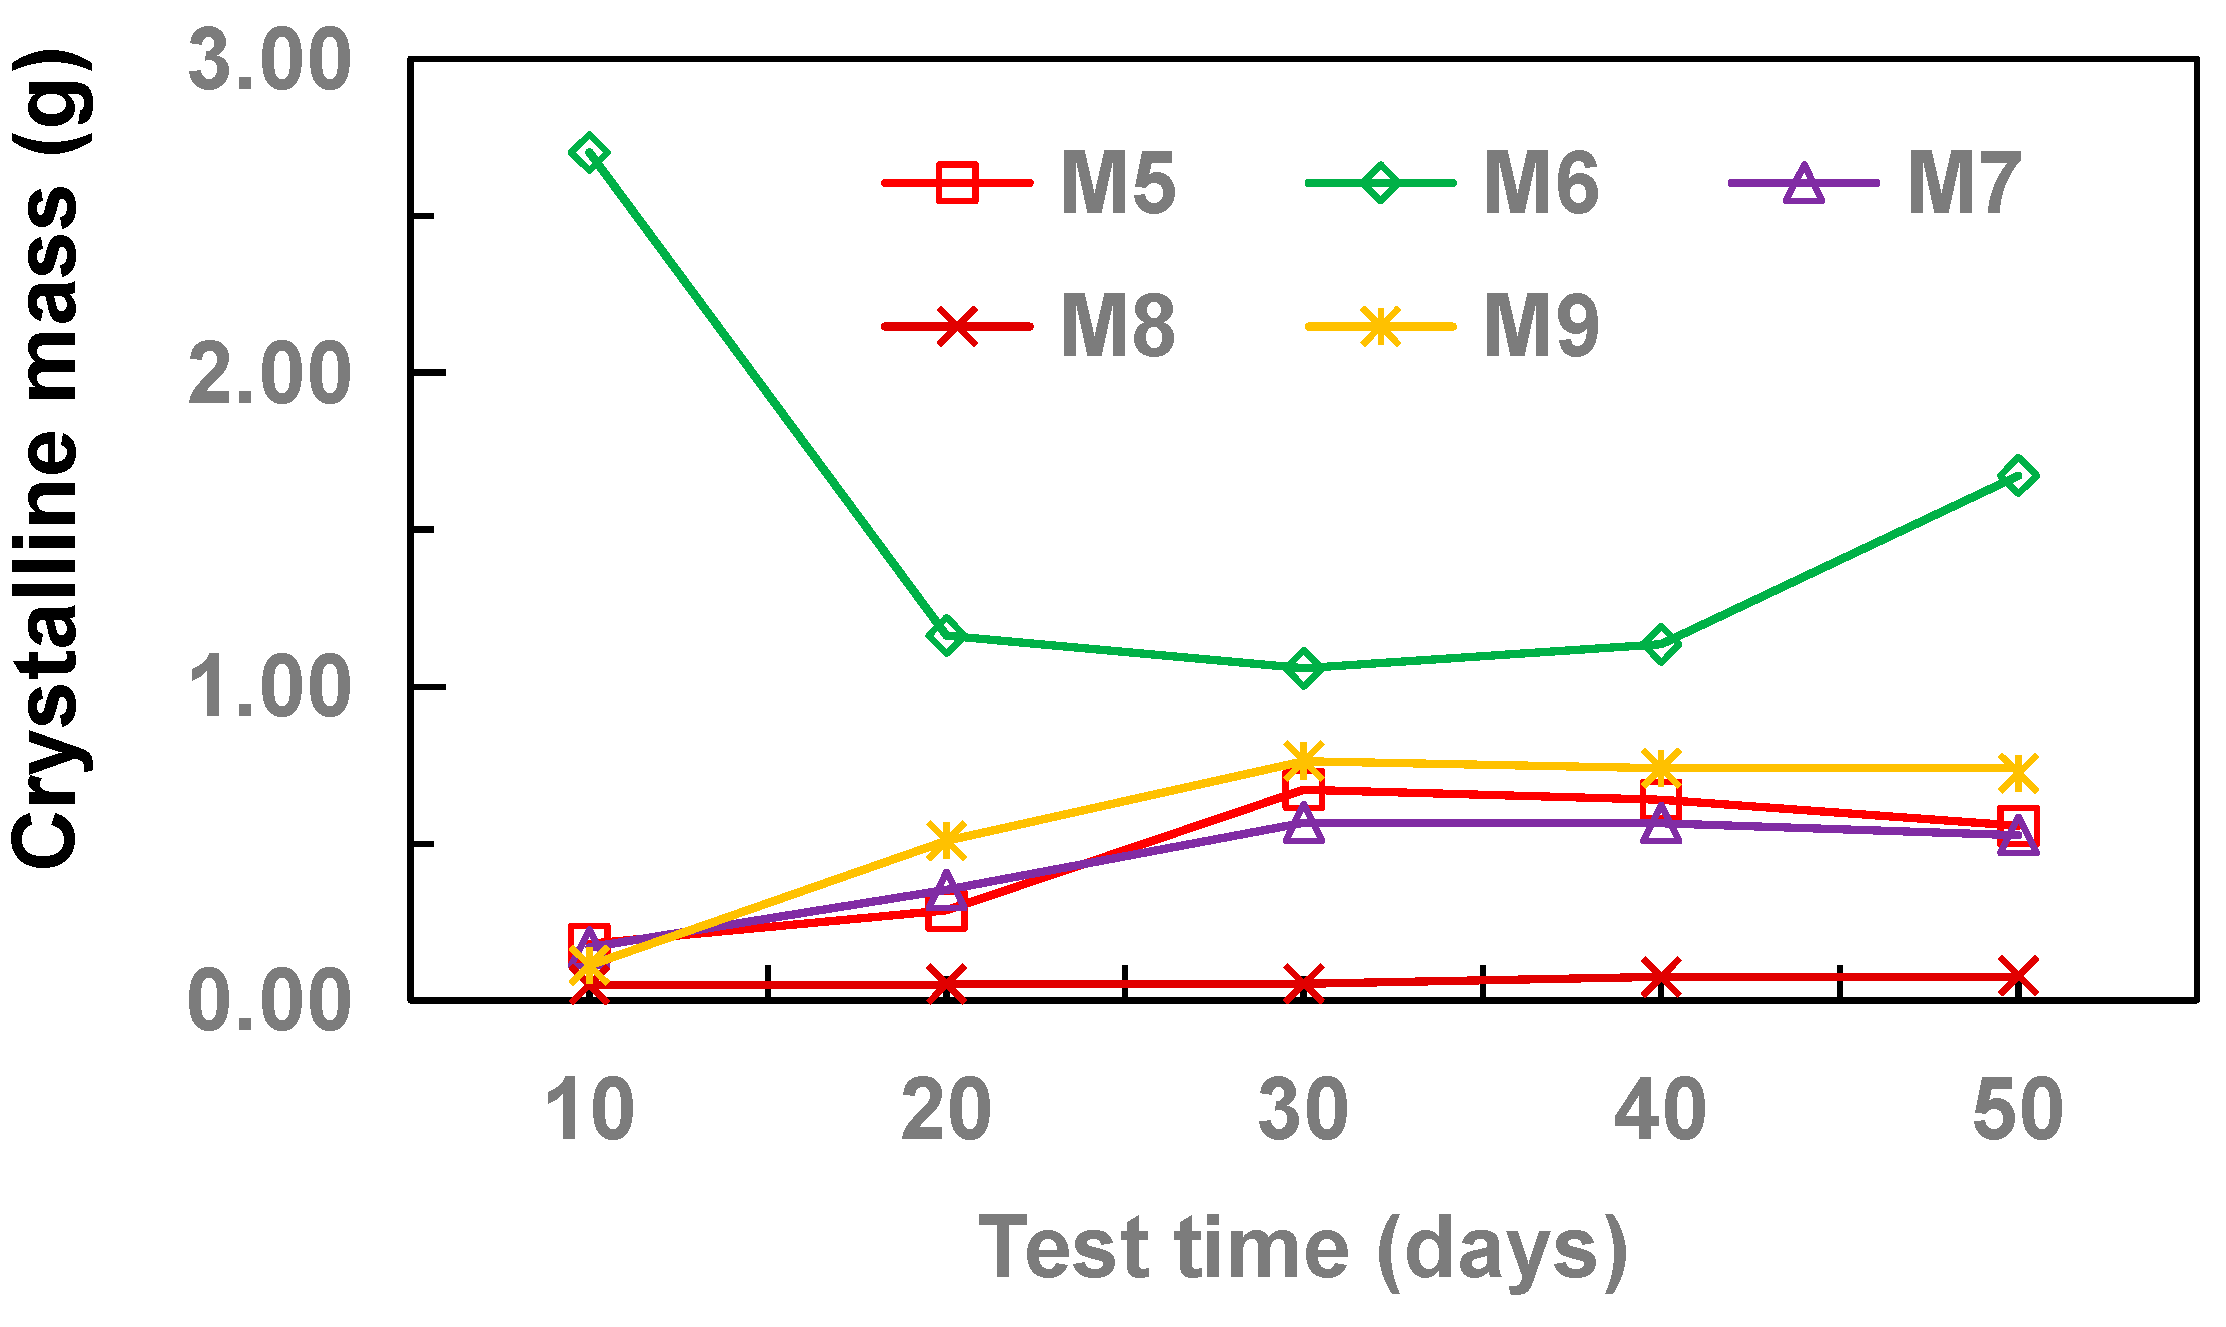
This group of experiments included nine kinds of pipe experiments. The pipe diameter of the drainage pipe was 32 mm and the flow rate was controlled to 34.5 cm·s−1. Among the pipes, M1–M4 were mainly the existing pipes, and M5–M9 mainly included the addition of other materials on the basis of the existing pipes, which changed the inner wall characteristics of the drainage pipe and the internal physical field of the drainage pipe, and analyzed the influence law of the drainage pipe material and structure on the crystallization of the drainage pipe. The variation law of crystallization quality of M1–M4 drainage pipes with test time is shown in Figure 9, and the variation curve of crystallization quality increment with test time is shown in Figure 10. The variation law of crystallization quality of M5–M9 drainage pipe with test time is shown in Figure 11. The variation curve of crystallization quality increment with test time is shown in Figure 12.
As shown in Figure 9, the trends of the effects of the different pipe materials on CaCO3 crystallization were approximately the same, i.e., there was always an initial stage of increase followed by a stage of decrease. In the increasing stage, the interaction between the CaCO3 crystals and the pipe wall was dominated by attraction in the early phase, and there was an accumulation of other impurities in the solution, resulting in an increase in the mass of crystals. Specifically, in the case of the PVC (M1) pipe, the mass of crystals reached the maximum of 0.564 g on day 30, which was 6.8 times the corresponding minimum of 0.083 g; for the polypropylene random (PPR) (M2) pipe, the mass of crystals attained its maximum of 0.599 g on day 40, which was 3.2 times its minimum of 0.189 g; for the polytetrafluoroethylene (PTFE) (M3) pipe, the mass of crystals reached the maximum of 0.655 g at day 30, which was 9.1 times the minimum of 0.072 g; and for the HDPE (M4) pipe, the mass of crystals reached the maximum of 0.494 g on day 40, which was 2.94 times the minimum of 0.168 g. After running the test for a period of time, the mass of crystals reached the maximum, and then repulsion became dominant instead of attraction. However, as the test continued, the impurities in the solution and the previously formed crystals interacted with each other through extrusion and friction, which rounded them and resulted in a decreasing process. Overall, the mass of crystals in the PTFE (M3) pipe was higher than that in the other types of pipe and thus did not meet our goal of reducing CaCO3 crystallization. Considering the economic cost, the use of PVC (M1) pipe is recommended. In addition, Figure 10 shows that the PVC (M1) pipe achieved the largest negative growth, with a steep slope of change. During the period of day 10 to day 20, there was a positive increase in the variable value for all pipes, with the largest increase (0.401 g) occurring in the PTFE (M3) pipe, and the smallest increase (0.107 g) occurring in the PVC (M1) pipe, indicating that there was a process of aggregation in each pipe in the early phase. Overall, the largest negative growth (0.153 g) occurred in the PVC (M1) pipe between day 40 and day 50, during which the increase in each parent material was less than 0 g.
Figure 11 reflects the variation trend in the mass of crystals in pipes made of different modified materials with time. The mass of crystals in the pipe using a magnetic field coil (M8) was always smaller than the mass in the pipes using different modified materials, indicating a significant modification effect; the maximum mass of crystals (0.075 g) was 1.5 times the minimum (0.05 g). The minimum mass of crystals was mainly due to the directional movement of Ca2+ and HCO3 in the circulating water under the action of the electromagnetic field generated by the current, which thus interfered with their mutual binding. The curve of the flocking film (M6) pipe is apparently above the curves of other pipes, indicating that the mass of crystals in this pipe was much larger than that in the pipes using other types of modified materials; the maximum mass of crystals reached 2702 g, which was 2.55 times the minimum of 1058 g. The mass of crystals in this pipe was the largest mainly because the villi were negatively charged and interacted strongly with the substances in solution. In addition, the presence of villi greatly increased the contact area, so other substances in solution continuously accumulated as the water flowed through the pipe. For these two reasons, the mass of crystals in the flocking film (M6) pipe was much larger than that in the pipes using other modified materials. The other three modified materials had very similar modification effects, with the effect of polyethylene (PE) powder (M9) being slightly less than that of the hydrophobic material (M5) and silicone (M7).
Figure 12 shows the variation trend in the increase in the mass of crystals with time in the pipes using different types of modified materials. The variation in the mass of crystals in the flocking film (M6) pipe was the largest, with the maximum increase in the mass of crystals reaching 1539 g, which was 40.5 times the minimum (0.038), mainly due to its own negative charge and large contact area. The increase in the mass of crystals produced in the pipe using the magnetic field coil (M8) was relatively stable (almost in a straight line), with an average increase of 0.0075 g, indicating that the magnetic field generated by a current of 1 A in the test had a satisfactory effect on the directional movement of ions in solution and thus achieved the purpose of reducing the crystals on the pipe wall. Except for the stable mass of crystals in the pipe using the magnetic field coil (M8), the mass of crystals in the other four pipes using modified materials all showed a negative growth stage, indicating that with the circulation of water flow, the binding force between the CaCO3 crystals and each modified material had an obvious stage of change between attraction and repulsion.

4. Discussion

It can be seen from the influence experiment of drainage pipe diameter that when the drainage pipe is full of groundwater, the crystallinity also increases gradually in the initial stage. However, after it increases to a certain extent, due to the decrease of drainage pipe cross-section, when the groundwater flow is certain, the groundwater velocity in the pipe will increase, resulting in the increase of flow velocity pressure at the cross-section. Finally, the crystals on the pipe wall fall off. It can be seen that when the groundwater flow is certain, the change of pipe diameter also reflects the change of groundwater velocity in the pipe; that is, the groundwater velocity has a strong impact on the crystallization of the drainage pipe. It can be seen from the flow velocity influence experiment that the crystals in the drainage pipe increase gradually under different flow velocities, but the larger the flow velocity is, the smaller the crystals as a whole, which also verifies that the flow velocity of groundwater in the drainage pipe has a significant impact on the crystallization of the drainage pipe. The test results are consistent with literature [26,27].
In the pipe influence experiment, the change curve of crystallinity with time of the existing pipes in M1~M4 markets is basically the same, and the total crystallinity has little difference. Therefore, the effect of these four kinds of pipes on preventing crystal plugging is not ideal. Among the five composite pipes M5~M9, although the crystallization laws of M6 and M8 are different, the crystallization laws of the other three pipes are basically the same. Because fluff is pasted on the pipe wall of M6, the contact opportunity between the crystal and fluff is increased due to the existence of a large number of fluff at the initial stage of the test, so the attached crystal is lower than that of other materials. In the later stage, when the local water force is greater than the bonding force between the crystal and fluff, the crystal will fall off, and then the crystal will increase. The difference of M8 was that a magnetic field was added. Under the action of magnetic field, calcium carbonate crystals in groundwater are mainly unstable aragonite crystals, which are easily washed away by groundwater. The modification results are consistent with the research results in literature [5,28,29].

5. Conclusions

Aiming at the problem of crystalline plugging of tunnel drainage pipe in karst area, based on the field investigation, this paper studied the effects of groundwater velocity, diameter, material, and structure of drainage pipe on the crystallization law of a tunnel drainage pipe in karst area using the methods of indoor orthogonal model test and quantitative and qualitative analysis. The main conclusions are as follows:
(1)
With the increase of drainage pipe diameter (20–32 mm), the crystallinity of drainage pipe increases first and then decreases gradually. With the increase of water velocity in the drainage pipe, the crystallinity of the drainage pipe decreases gradually. At different flow rates, the growth rate of crystallization increased first and then gradually stabilized. Without adding other materials, the crystallinity of drainage pipe is: M3 > M2 > M4 > M1. When other materials are added, the crystallinity of drainage pipe is M6 > M9 > M5 > M7 > M8. When the groundwater flow rate is 34.5 cm·s−1, M1 and M8 drainage pipes can be used in the tunnel to ensure that the drainage pipe will not be blocked by crystallization.
(2)
There is a 5-fold relationship between the diameter of indoor test (20–32 mm) and the diameter of field drainage pipe (80–160 mm). Therefore, whether there is a 5-fold relationship between the law obtained from indoor test and the actual crystallization change law needs to be further determined. Ca2+ and HCO3 were mainly selected as the ions in the test solution, while the actual groundwater on site also contains other ions that may affect crystallization, such as Mg2+, requiring a lot of further research work.

Author Contributions

Investigation, H.L. (Huaming Li) and H.L. (Hao Leng); writing—original draft preparation, S.X.; writing—review and editing, S.L.; formal analysis, H.C. and B.Z.; data curation, Z.L. All authors have read and agreed to the published version of the manuscript.

Funding

This research was financially supported by the Scientific Research Project of the Emei Hanyuan Expressway Project (Grant No. LH-HT-45), and the State Key Laboratory of Mountain Bridge and Tunnel Engineering (Grant No. SKLBT-2110).

Institutional Review Board Statement

Not applicable.

Informed Consent Statement

Not applicable.

Data Availability Statement

The datasets used and/or analyzed during the current study are available from the corresponding author on reasonable request.

Conflicts of Interest

The authors declare no conflict of interest.

References

  1. Liu, Z.; Zhang, M.; You, S.; Qiang, L.; Sun, H.; Wang, J.; Kongyun, W. Spatial and diurnal variations of geochemical indicators in a calcite-precipitating stream-Case study of Baishuitai. Yunnan. Geochimica 2004, 33, 269–278. [Google Scholar]
  2. Katsifaras, A.; Spanos, N. Effect of inorganic phosphate ions on the spontaneous precipitation of vaterite and the transformation of vaterite to calcite. J. Cryst. Growth 1999, 204, 183–190. [Google Scholar] [CrossRef]
  3. Lin, Y.; Fang, J.; Li, J. Quantitive study of the effect of a magnetic field on the precipitation of calcium carbonate aqueous solutions. Ind. Water Treat. 2002, 22, 16–18. [Google Scholar]
  4. Knez, S.; Pohar, C. The magnetic field influence on the polymorph composition of CaCO3 precipitated from carbonized aqueous solution. J. Colloid Interface Sci. 2005, 281, 377–388. [Google Scholar] [CrossRef]
  5. Parsons, S.; Wang, B.; Judd, S.; Stephenson, T. Magnetic treatment of Calcium Carbonate scale-effect of PH control. Water Res. 1997, 31, 339–342. [Google Scholar] [CrossRef]
  6. Dermitzaki, E.; Bauer, J.; Wunderle, B.; Michel, B. Diffusion of water in amorphous polymers at different temperatures using molecular dynamics simulation. In Proceedings of the 2006 1st Electronic Systemintegration Technology Conference, Dresden, Germany, 5–7 September 2006; Volume 2, pp. 762–772. [Google Scholar]
  7. You, X.; Zhang, X. Molecular dynamics simulation on an aqueous solution of calcite. J. North Univ. China 2013, 170–173. [Google Scholar]
  8. Wang, D.; Huang, L. Molecular dynamics simulation on an aclueous solution of calcium carbonate. Sci. Technol. Eng. 2009, 9, 6619–6623. [Google Scholar]
  9. Zhang, S.; Shi, W.; Lei, W.; Xia, M.; Wang, F. Molecular dynamics simulation of interaction between calcite crystal and water-soluble polymers. Acta Phys. Chim. Sin. 2005, 21, 1198–1204. [Google Scholar]
  10. Song, J. Experimental Study on the Impact of Magnetic Field on Calcium Carbonate Crystallization Process; Shandong University: Jinan, China, 2015. [Google Scholar]
  11. Chen, J. Manufacturing Water Treatment Devices Generating Alternating Magnetic Field and Experimental Study on Its Antiscaling Effect; Chongqing University: Chongqing, China, 2014. [Google Scholar]
  12. Huang, S.; Song, H. Study on the crystallization and precipitation of carbonate at different temperature conditions. Geoscience 1991, 442–449 and 475–476. [Google Scholar]
  13. Jiang, S.; Yu, H.; Liu, C. Research on the scaling dynamic model of the high salinity system. Appl. Chem. Ind. 2011, 40, 1623–1628. [Google Scholar]
  14. Zhang, J.; Li, S.; Zhou, Y. On bacterial and fun gal effects on karst process and its application. Carsologica Sin. 1997, 16, 362–369. [Google Scholar]
  15. Jakucs, L. Morphogenetics of Karst Regions: Variants of Karst Evolution; Adam Hilger: New York, NY, USA, 1977. [Google Scholar]
  16. Greenfield, L. Metabolism and concentration of calcium and magnesium and precipitation of calcium carbonate by a marine bacteria. Ann. N. Y. Acad. Sci. 1963, 109, 23–45. [Google Scholar] [CrossRef]
  17. Krumbein, W. Photolithotopic and chemoorganotrophic activity of bacteria and algae as related to beachrock formation and degradation (Gulf of Aqabu, Sinai). Deep. Sea Res. Part B Oceanogr. Lit. Rev. 1979, 1, 139–203. [Google Scholar]
  18. Gu, X.; Qiu, F.; Zhou, X.; Yang, D.; Guo, Q.; Guo, X. Synthesis and application of terpolymer scale inhibitor in the presence of β-cyclodextrins. J. Pet. Sci. Eng. 2013, 109, 177–186. [Google Scholar] [CrossRef]
  19. Wang, H.; Zhou, Y.; Liu, G.; Huang, J.; Yao, Q.; Ma, S.; Cao, K.; Liu, Y.; Wu, W.; Sun, W.; et al. Investigation of calcium carbonate precipitation in the presence of fluorescent-tagged scale inhibitor for cooling water systems. Desalination Water Treat. 2015, 53, 3491–3498. [Google Scholar] [CrossRef]
  20. Yoon, S.; Park, E.; Lee, J.; Chun, B. Laboratory test of molecular vibration for preventing drainage pipe blockage in deteriorated tunnel. J. Korean Geotech. Soc. 2012, 28, 69–77. [Google Scholar] [CrossRef]
  21. Zhang, X.; Zhou, Y.; Zhang, B.; Zhou, Y.; Liu, S. Investigation and Analysis on Crystallization of Tunnel Drainage Pipes in Chongqing. Adv. Mater. Sci. Eng. 2018, 2018, 1–6. [Google Scholar] [CrossRef] [Green Version]
  22. Guo, X. Crystallization mechanism and countermeasures of drainage system for railway tunnel. China Railw. Sci. 2020, 41, 71–77. [Google Scholar]
  23. Ye, F.; Tian, C.; He, B.; Zhao, M.; Wang, J.; Han, X.; Song, G. Experimental study on scaling and cloggingin drainage system of tunnels under construction. China J. Highw. Transp. 2021, 34, 159–170. [Google Scholar]
  24. Xiang, K.; Zhou, J.; Zhang, X.; Huang, C.; Song, L.; Liu, S. Experimental Study on Crystallization Rule of Tunnel Drainpipe in Alkaline Environment. Tunn. Constr. 2019, 39, 207–212. [Google Scholar]
  25. Tian, C.; Ye, F.; Song, G.; Wang, Q.; Zhao, M.; He, B.; Wang, J.; Han, X. On Mechanism of crystal blockage of tunnel drainage system and preventive countermeasures. Mod. Tunn. Technol. 2020, 57, 66–76. [Google Scholar]
  26. Lu, G.; Wang, P.; Yang, Y.; Mao, C.; Wu, Y.; Wu, J.; Dong, P.; Wu, J. Advance in mechanism of groundwater crystallization blockage in tunnel drainage pipe and scale inhibiting techniques in karst area. Mod. Tunn. Technol. 2021, 1–16. Available online: http://kns.cnki.net/kcms/detail/51.1600.U.20210818.1810.006.html (accessed on 25 November 2021).
  27. Mao, C.; Yang, Y.; Wu, J.; Dong, P.; Wu, J. Numerical simulation of crystal blockage in tunnel drainage pipe based on dynamic grid and level set. Carsologica Sin. 2021, 1–18. Available online: http://kns.cnki.net/kcms/detail/45.1157.P.20211025.1840.002.html (accessed on 25 November 2021).
  28. Higashitani, K.; Kage, A.; Katamura, S.; Imai, K.; Hatade, S. Effects of a Magnetic Field on the Formation of CaCO3 Particles. J. Colloid Interface Sci. 1993, 156, 90–95. [Google Scholar] [CrossRef]
  29. Alimi, F.; Tlili, M.; Amor, M.B.; Maurin, G.; Gabrielli, C. Influence of magnetic field on calcium carbonate precipitation in the presence of foreign ions. Surf. Eng. Appl. Electrochem. 2009, 45, 56–62. [Google Scholar] [CrossRef]
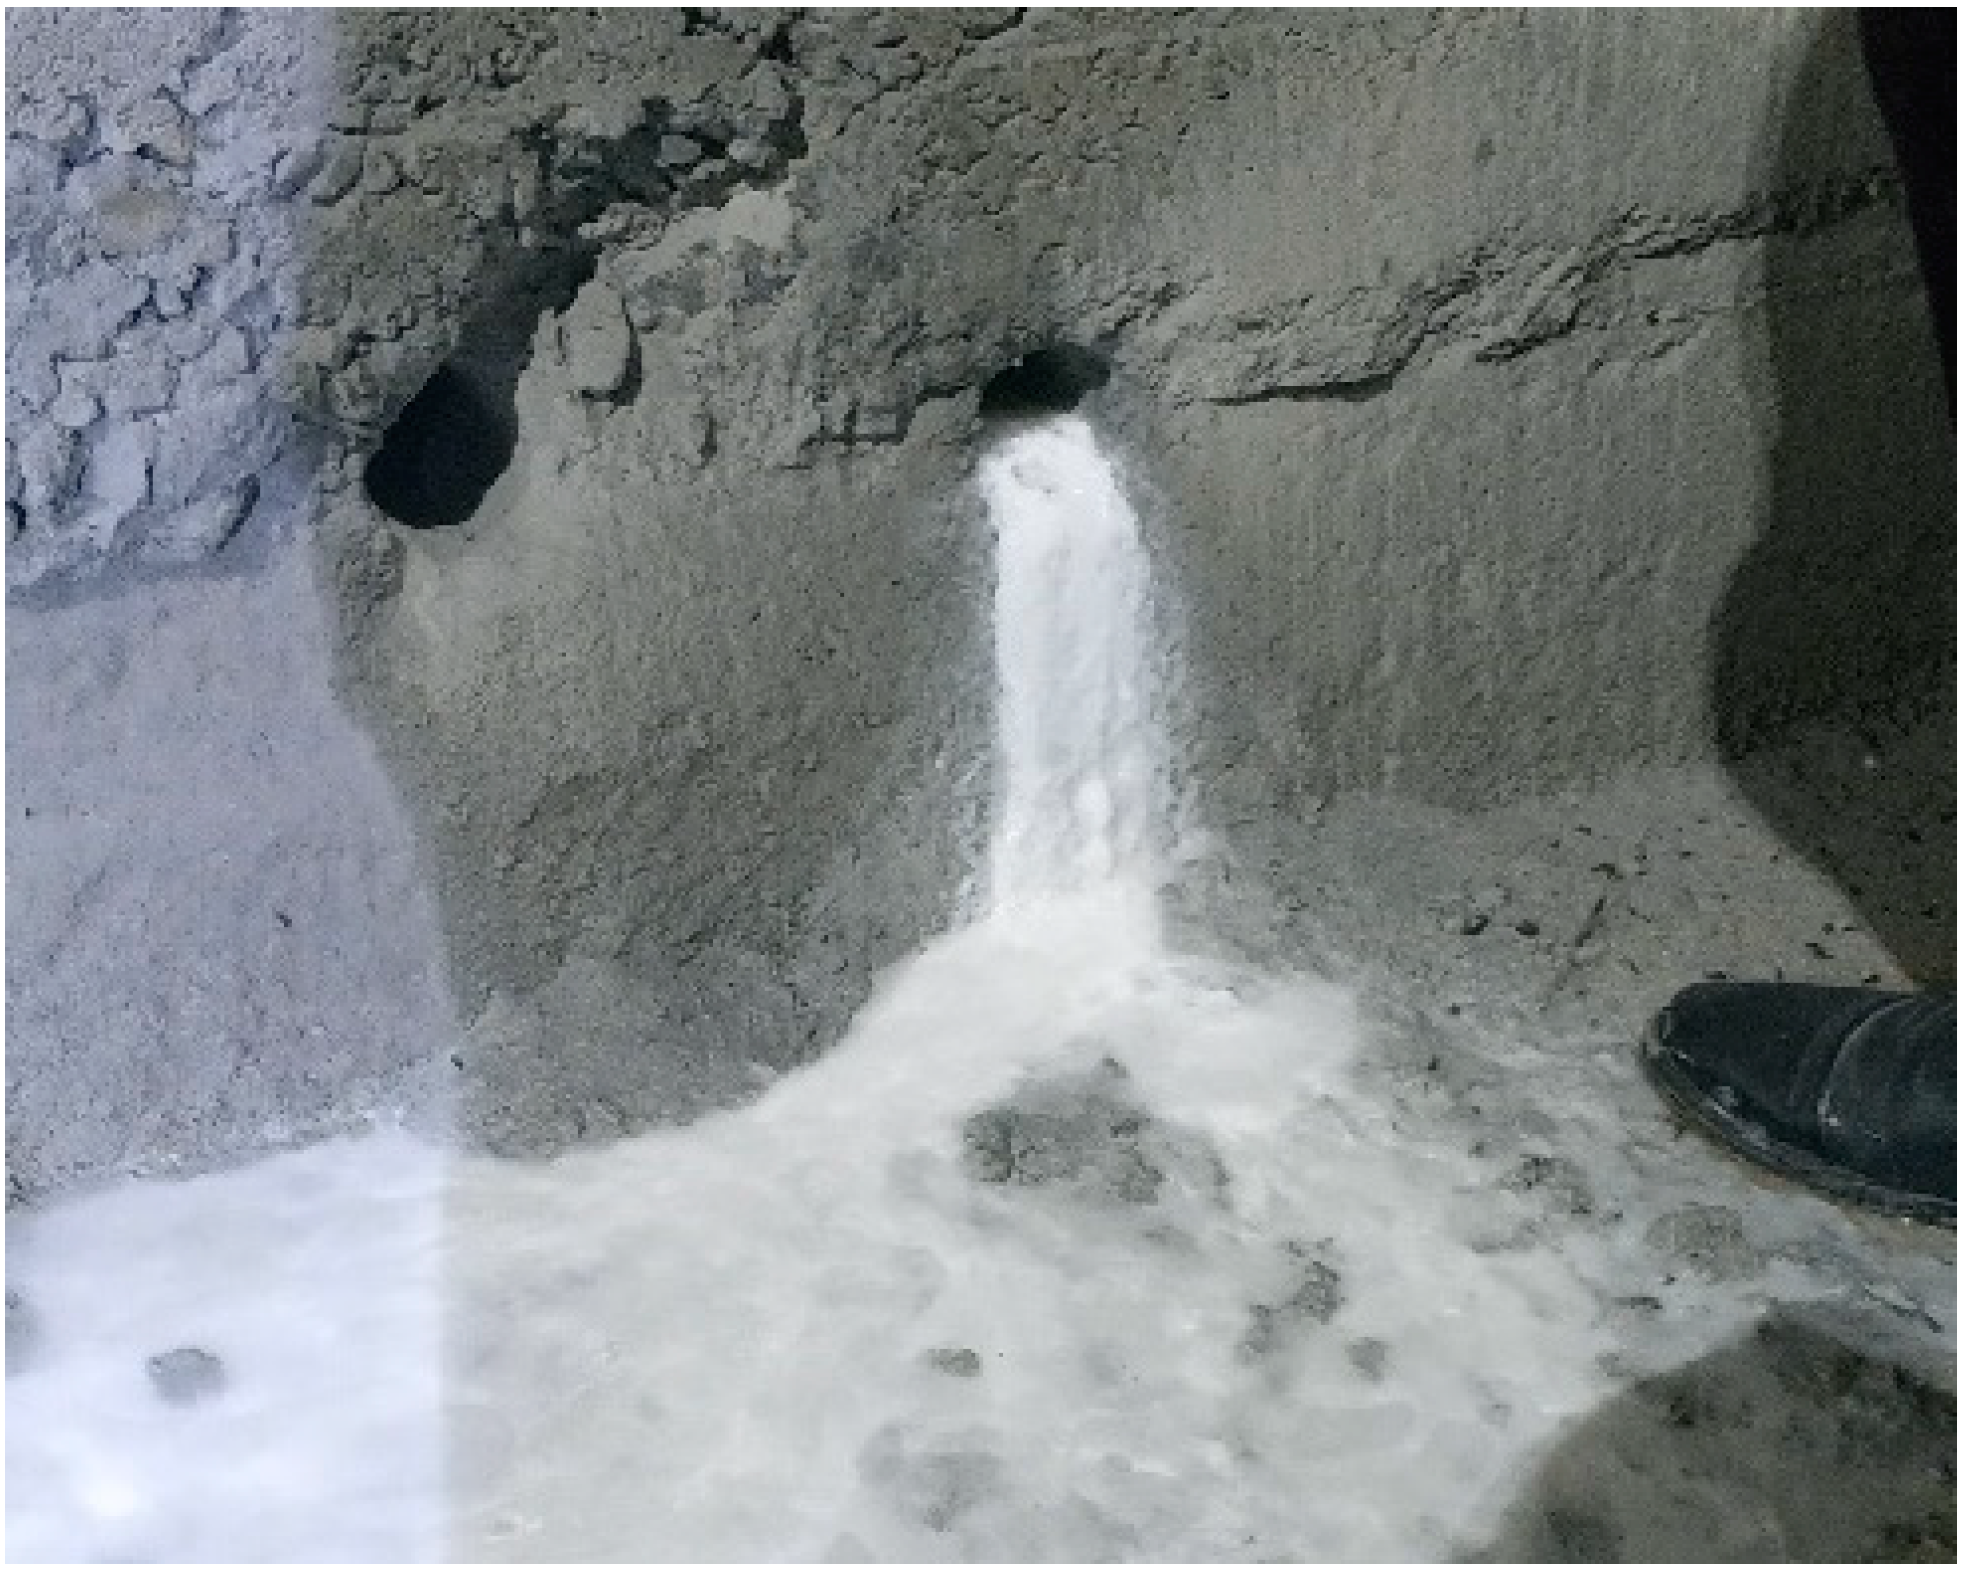
Figure 1. Crystallization and clogging in drainage pipes in the Baoligang Tunnel of the Emeishan-Hanyuan Expressway.
Coatings 11 01493 g001
Figure 2. Research technology route.
Coatings 11 01493 g002
Figure 3. Test device diagram. (a) Elevation. (b) Top view.
Coatings 11 01493 g003
Figure 4. Indoor test operation.
Coatings 11 01493 g004
Figure 5. Variation of crystal quality with time.
Coatings 11 01493 g005
Figure 6. Variation of crystal mass increment with time.
Coatings 11 01493 g006
Figure 7. Variation of crystal quality with time.
Coatings 11 01493 g007
Figure 8. Variation of crystal mass increment with time.
Coatings 11 01493 g008
Figure 9. Variation of crystal quality with time.
Coatings 11 01493 g009
Figure 10. Variation of crystal mass increment with time.
Coatings 11 01493 g010
Figure 11. Variation of crystal quality with time.
Coatings 11 01493 g011
Figure 12. Variation of crystal mass increment with time.
Coatings 11 01493 g012
Table 1. Influencing factors of the tests.
Influencing FactorVariable Value
Drainage pipe diameterD1 = 20 mm; D2 = 25 mm; D3 = 32 mm
Flow velocityV1 = 22.0 cm·s−1, V2 = 26.5 cm·s−1, V3 = 34.5 cm·s−1, V4 = 44.5 cm·s−1, V5 = 63.5 cm·s−1
Drainage pipe materialM1 = PVC, M2 = PPR, M3 = PTFE, M4 = HDPE, M5 = PVC + hydrophobic antistatic self-cleaning agent, M6 = PVC + flocking film, M7 = PVC + silicone, M8 = PVC + magnetic field coil, M9 = PVC + PE powder
In the table: PVC (Polyvinyl chloride); PPR (pentatricopeptide repeats); PTFE (Poly tetra fluoroethylene); HDPE (High Density Polyethylene).
Table 2. Concentration of main ions in tunnel drains.
Ion TypeIonConcentration c (mmol·L−1)Percentage (%)Ion TypeIonConcentration c (mmol·L−1)Percentage (%)
CationK++Na+3.685.17AnionCl1.80.69
Ca2+45.263.50SO42−51.919.83
Mg2+22.331.33HCO320879.48
Publisher’s Note: MDPI stays neutral with regard to jurisdictional claims in published maps and institutional affiliations.