
The Role of the Oxidation and Reduction Parameters on the Properties of the Reduced Graphene Oxide


Abstract
:1. Introduction
2. Materials and Methods
2.1. Materials
2.2. Methods
2.3. Preparation of Samples
2.3.1. Graphene Oxide
2.3.2. Reduction of Graphene Oxides
3. Results and Discussion
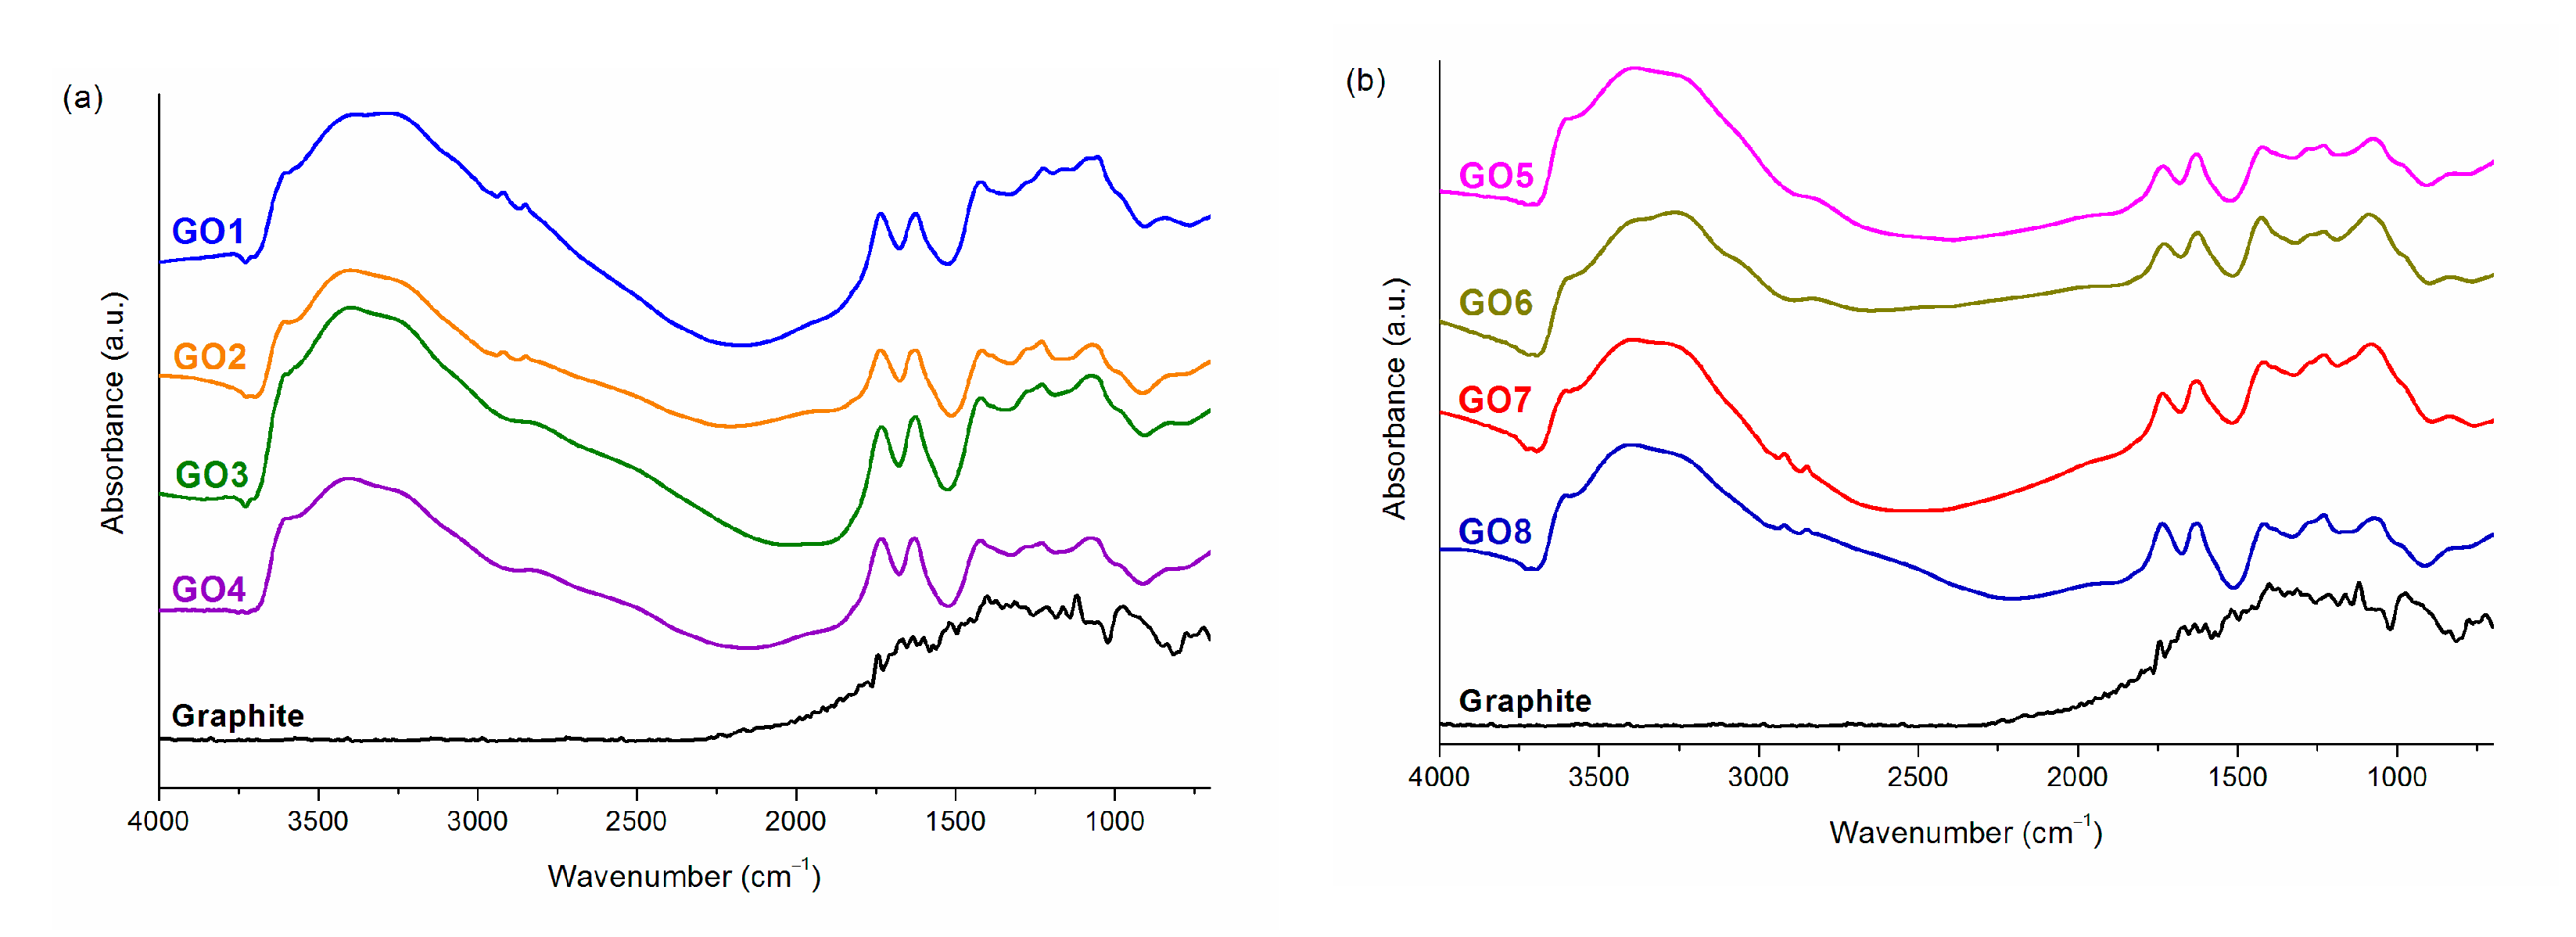
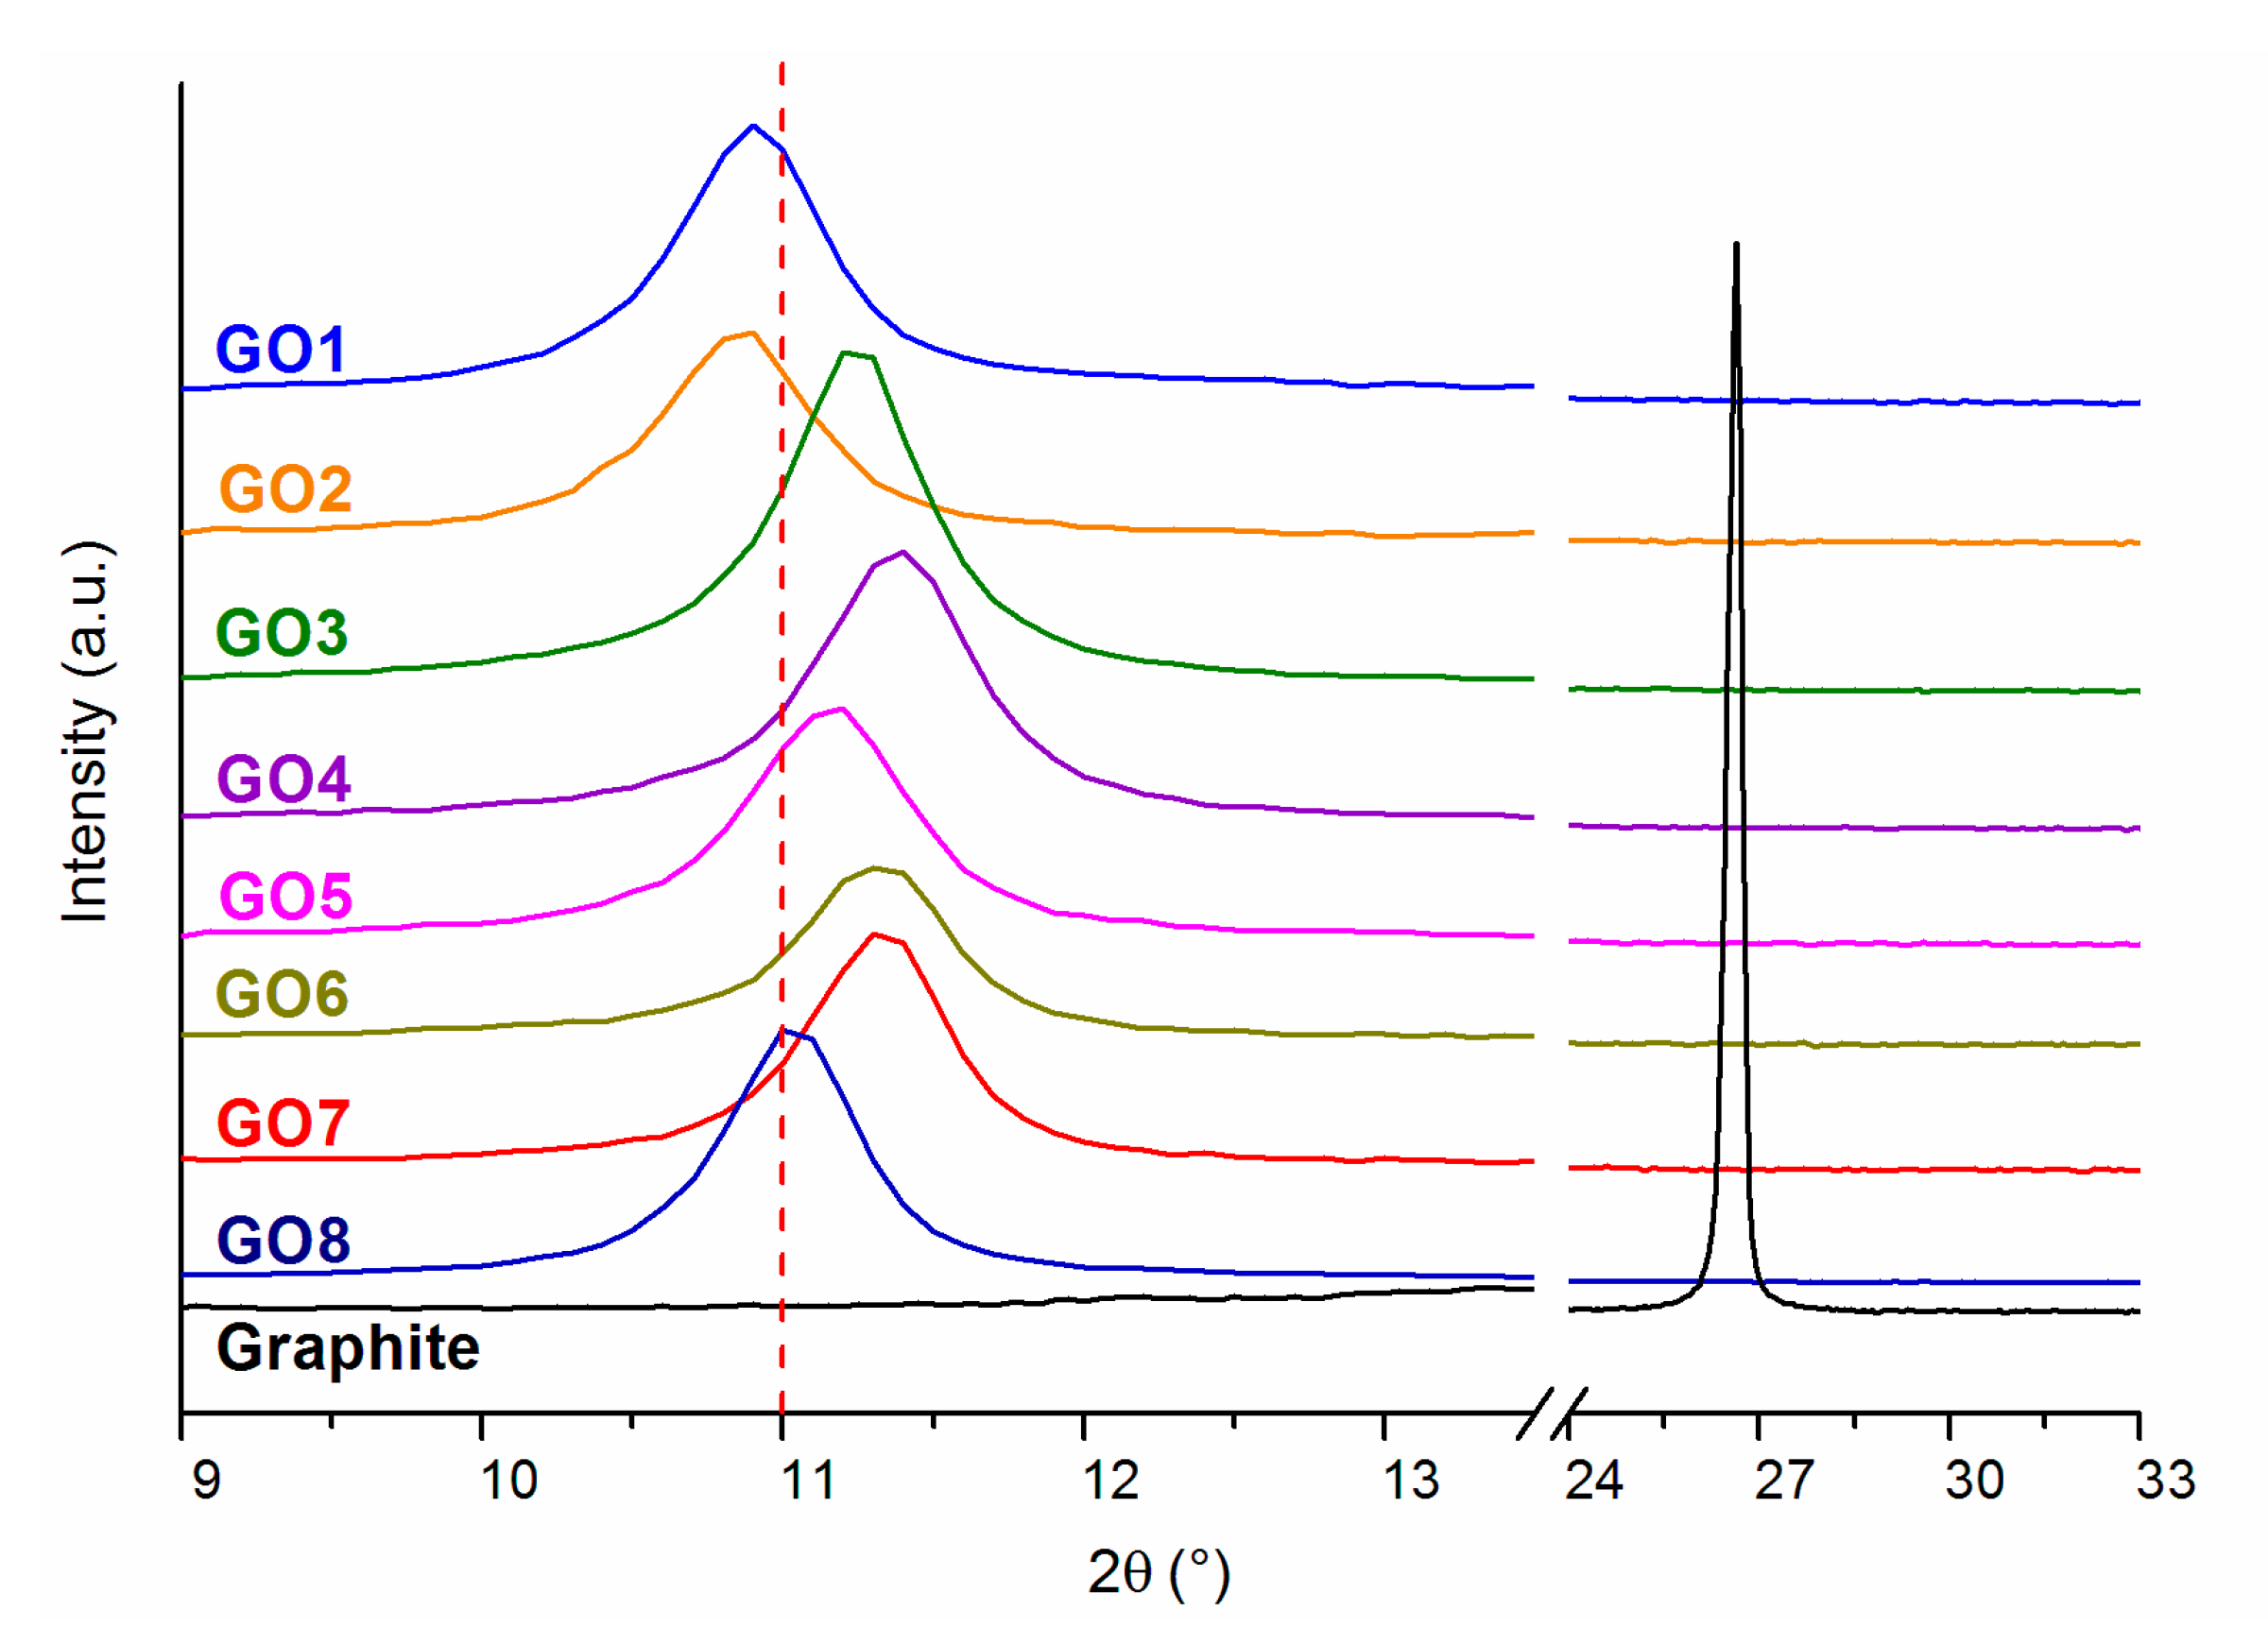
3.1. Graphene Oxide
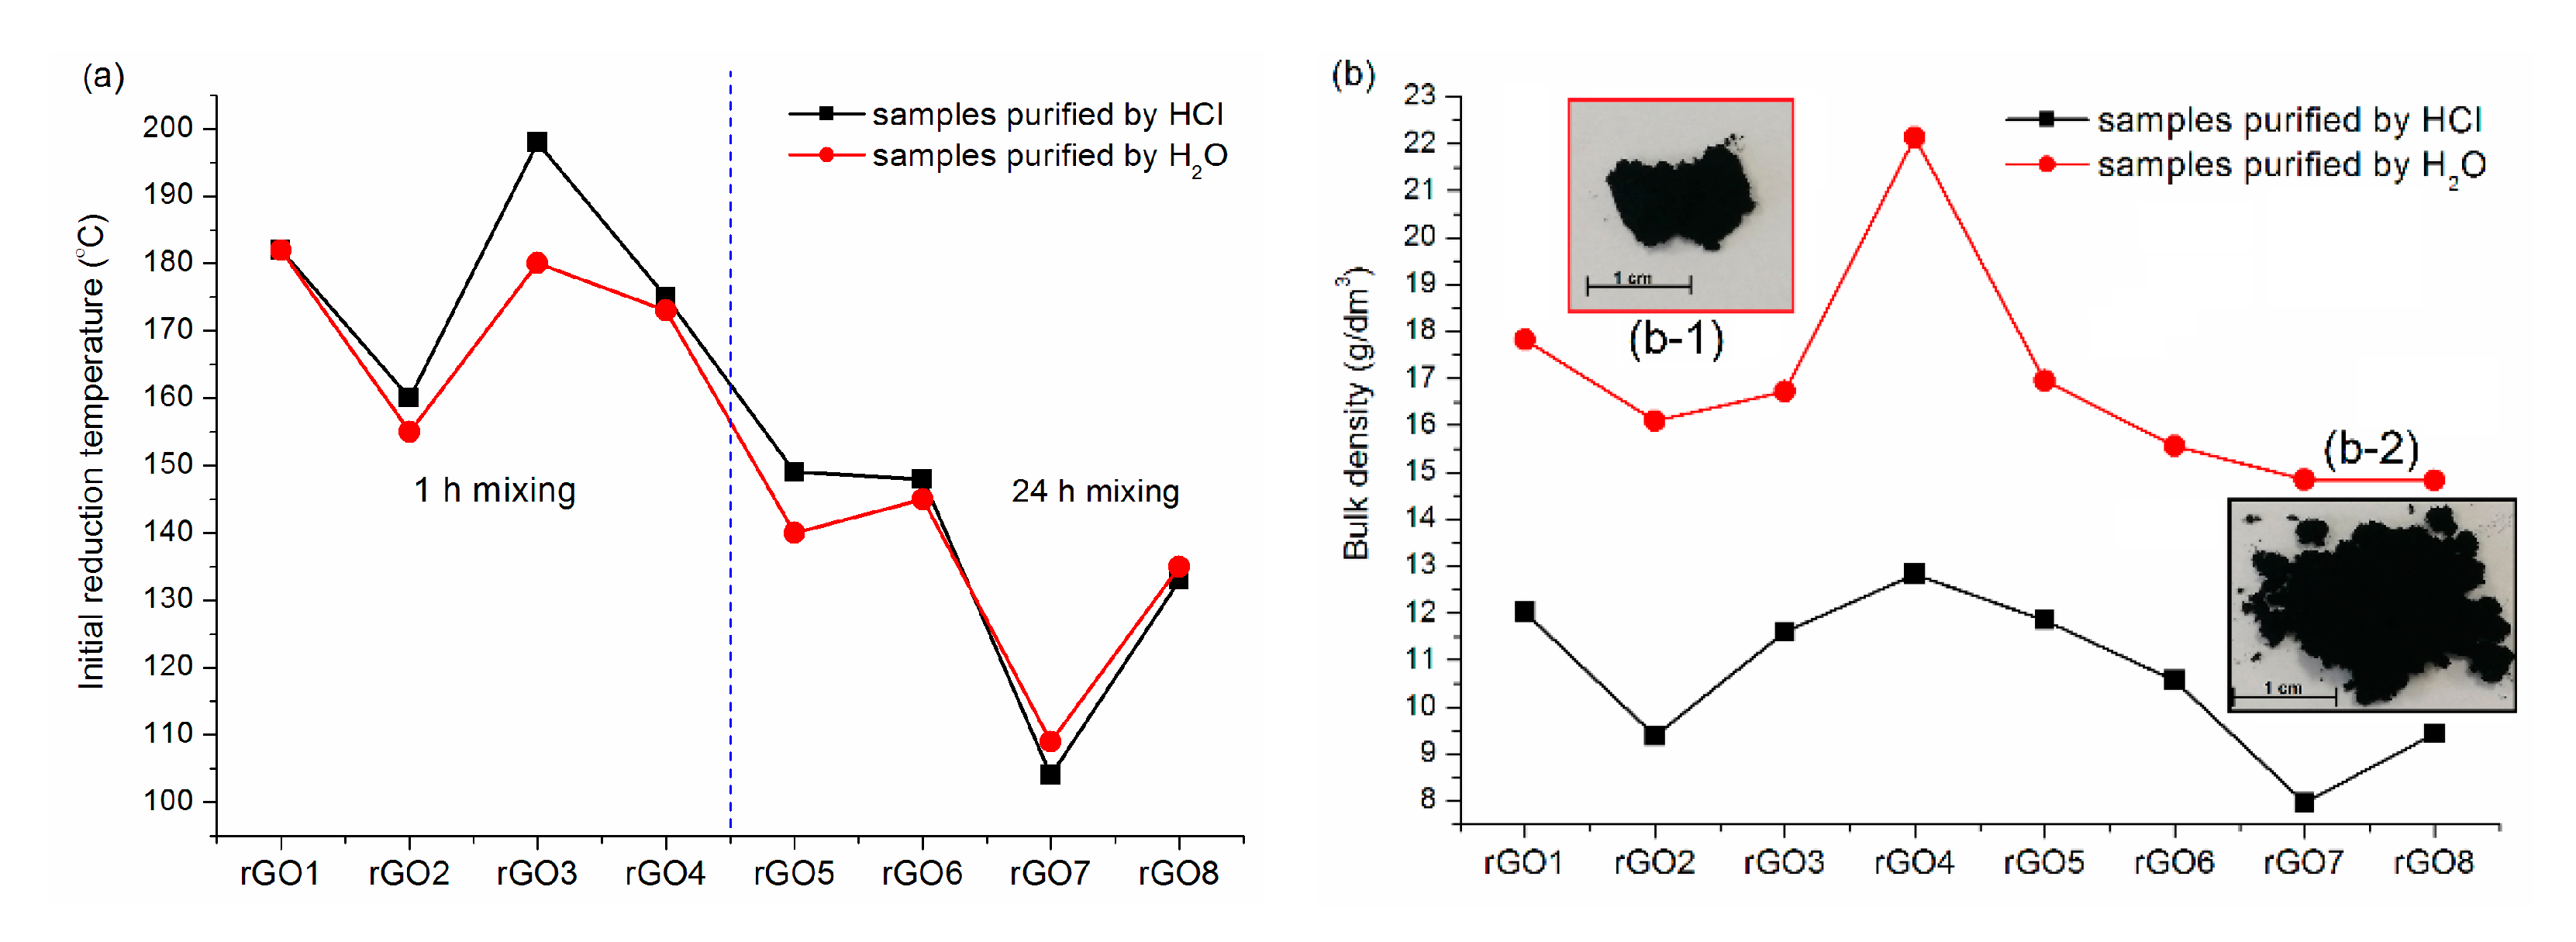
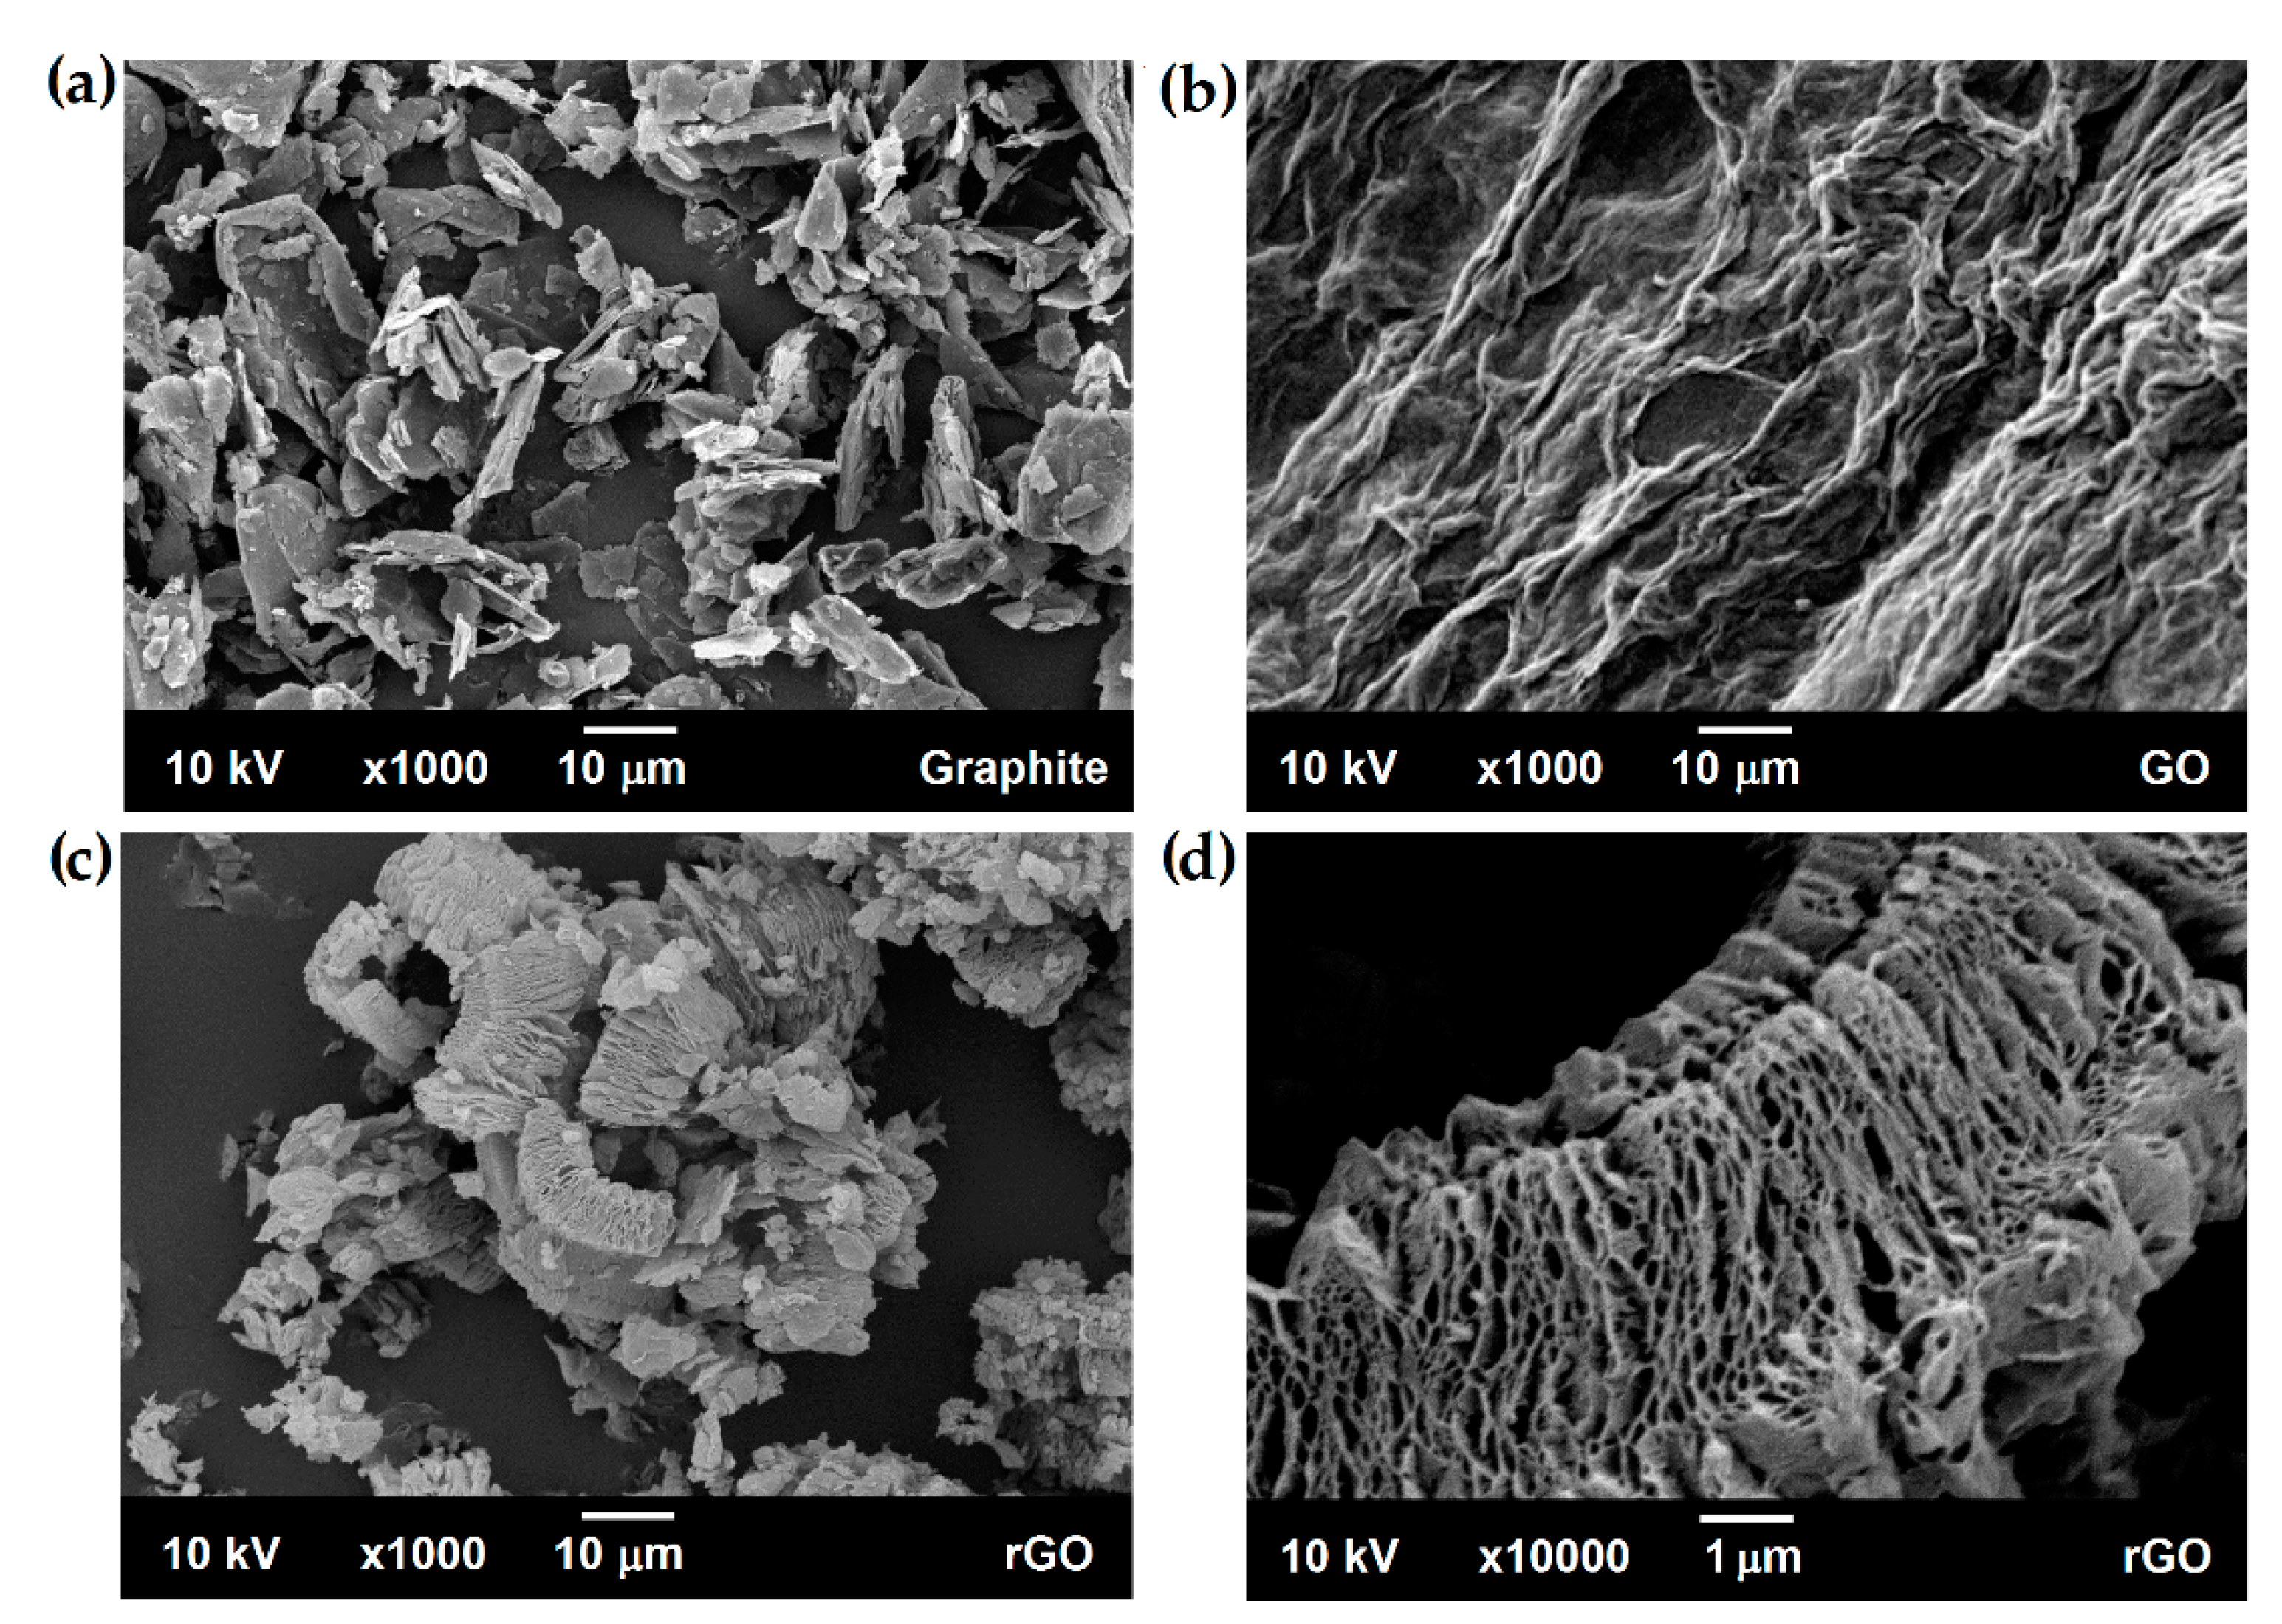
3.2. Reduced Graphene Oxide
4. Conclusions
Supplementary Materials
Author Contributions
Funding
Institutional Review Board Statement
Informed Consent Statement
Data Availability Statement
Conflicts of Interest
References
- Novoselov, K.S.; Fal’Ko, V.I.; Colombo, L.; Gellert, P.R.; Schwab, M.G.; Kim, K. A roadmap for graphene. Nature 2012, 490, 192–200. [Google Scholar] [CrossRef] [PubMed]
- Raccichini, R.; Varzi, A.; Passerini, S.; Scrosati, B. The role of graphene for electrochemical energy storage. Nat. Mater. 2015, 14, 271–279. [Google Scholar] [CrossRef] [PubMed]
- Singh, R.K.; Kumar, R.; Singh, D.P. Graphene oxide: Strategies for synthesis, reduction and frontier applications. RSC Adv. 2016, 6, 64993–65011. [Google Scholar] [CrossRef]
- Mahmoudi, T.; Wang, Y.; Hahn, Y.B. Graphene and its derivatives for solar cells application. Nano Energy 2018, 47, 51–65. [Google Scholar] [CrossRef]
- Smith, A.T.; LaChance, A.M.; Zeng, S.; Liu, B.; Sun, L. Synthesis, properties, and applications of graphene oxide/reduced graphene oxide and their nanocomposites. Nano Mater. Sci. 2019, 1, 31–47. [Google Scholar] [CrossRef]
- Frogley, M.D.; Wang, C.; Cinque, G.; Barber, A.H. Polarised infrared microspectroscopy of edge-oriented graphene oxide papers. Vib. Spectrosc. 2014, 75, 178–183. [Google Scholar] [CrossRef] [Green Version]
- Gadipelli, S.; Guo, Z.X. Graphene-based materials: Synthesis and gas sorption, storage and separation. Prog. Mater. Sci. 2015, 69, 1–60. [Google Scholar] [CrossRef] [Green Version]
- Shang, Y.U.; Zhang, D.; Liu, Y.; Guo, C. Preliminary comparison of different reduction methods of graphene oxide. Bull. Mater. Sci. 2015, 38, 7–12. [Google Scholar] [CrossRef] [Green Version]
- Park, W.K.; Kim, H.; Kim, T.; Kim, Y.; Yoo, S.; Kim, S.; Yoon, D.H.; Yang, W.S. Facile synthesis of graphene oxide in a Couette-Taylor flow reactor. Carbon N. Y. 2015, 83, 217–223. [Google Scholar] [CrossRef]
- Hummers, W.S.; Offeman, R.E. Preparation of Graphitic Oxide. J. Am. Chem. Soc. 1957, 208, 1937. [Google Scholar] [CrossRef]
- Chen, J.; Yao, B.; Li, C.; Shi, G. An improved Hummers method for eco-friendly synthesis of graphene oxide. Carbon N. Y. 2013, 64, 225–229. [Google Scholar] [CrossRef]
- Marcano, D.C.; Kosynkin, D.V.; Berlin, J.M.; Sinitskii, A.; Sun, Z.; Slesarev, A.; Alemany, L.B.; Lu, W.; Tour, J.M. Improved synthesis of graphene oxide. ACS Nano 2010, 4, 4806–4814. [Google Scholar] [CrossRef] [PubMed]
- Guerrero-Contreras, J.; Caballero-Briones, F. Graphene oxide powders with different oxidation degree, prepared by synthesis variations of the Hummers method. Mater. Chem. Phys. 2015, 153, 209–220. [Google Scholar] [CrossRef]
- Yu, H.; Zhang, B.; Bulin, C.; Li, R.; Xing, R. High-efficient synthesis of graphene oxide based on improved hummers method. Sci. Rep. 2016, 6, 1–7. [Google Scholar] [CrossRef] [PubMed] [Green Version]
- Alkhouzaam, A.; Qiblawey, H.; Khraisheh, M.; Atieh, M.; Al-Ghouti, M. Synthesis of graphene oxides particle of high oxidation degree using a modified Hummers method. Ceram. Int. 2020, 46, 23997–24007. [Google Scholar] [CrossRef]
- Rabchinskii, M.K.; Dideikin, A.T.; Kirilenko, D.A.; Baidakova, M.V.; Shnitov, V.V.; Roth, F.; Konyakhin, S.V.; Besedina, N.A.; Pavlov, S.I.; Kuricyn, R.A.; et al. Facile reduction of graphene oxide suspensions and films using glass wafers. Sci. Rep. 2018, 8, 1–11. [Google Scholar] [CrossRef] [Green Version]
- Evlashin, S.; Dyakonov, P.; Khmelnitsky, R.; Dagesyan, S.; Klokov, A.; Sharkov, A.; Timashev, P.; Minaeva, S.; Maslakov, K.; Svyakhovskiy, S.; et al. Controllable laser reduction of graphene oxide films for photoelectronic applications. ACS Appl. Mater. Interfaces 2016, 8, 28880–28887. [Google Scholar] [CrossRef]
- Chua, C.K.; Pumera, M. Chemical reduction of graphene oxide: A synthetic chemistry viewpoint. Chem. Soc. Rev. 2014, 43, 291–312. [Google Scholar] [CrossRef]
- Chong, S.W.; Lai, C.W.; Abd Hamid, S.B. Controllable electrochemical synthesis of reduced graphene oxide thin-film constructed as efficient photoanode in dye-sensitized solar cells. Materials 2016, 9, 69. [Google Scholar] [CrossRef] [Green Version]
- Wang, G.; Yang, J.; Park, J.; Gou, X.; Wang, B.; Liu, H.; Yao, J. Facile synthesis and characterization of graphene nanosheets. J. Phys. Chem. C 2008, 112, 8192–8195. [Google Scholar] [CrossRef]
- Shin, H.J.; Kim, K.K.; Benayad, A.; Yoon, S.M.; Park, H.K.; Jung, I.S.; Jin, M.H.; Jeong, H.K.; Kim, J.M.; Choi, J.Y.; et al. Efficient reduction of graphite oxide by sodium borohydride and its effect on electrical conductance. Adv. Funct. Mater. 2009, 19, 1987–1992. [Google Scholar] [CrossRef]
- Stankovich, S.; Piner, R.D.; Chen, X.; Wu, N.; Nguyen, S.T.; Ruoff, R.S. Stable aqueous dispersions of graphitic nanoplatelets via the reduction of exfoliated graphite oxide in the presence of poly(sodium 4-styrenesulfonate). J. Mater. Chem. 2006, 16, 155–158. [Google Scholar] [CrossRef]
- Stankovich, S.; Dikin, D.A.; Piner, R.D.; Kohlhaas, K.A.; Kleinhammes, A.; Jia, Y.; Wu, Y.; Nguyen, S.B.T.; Ruoff, R.S. Synthesis of graphene-based nanosheets via chemical reduction of exfoliated graphite oxide. Carbon N. Y. 2007, 45, 1558–1565. [Google Scholar] [CrossRef]
- Kuila, T.; Bose, S.; Khanra, P.; Mishra, A.K.; Kim, N.H.; Lee, J.H. A green approach for the reduction of graphene oxide by wild carrot root. Carbon N. Y. 2012, 50, 914–921. [Google Scholar] [CrossRef]
- Wang, Y.; Shi, Z.X.; Yin, J. Facile synthesis of soluble graphene via a green reduction of graphene oxide in tea solution and its biocomposites. ACS Appl. Mater. Interfaces 2011, 3, 1127–1133. [Google Scholar] [CrossRef]
- Hou, D.; Liu, Q.; Cheng, H.; Zhang, H.; Wang, S. Green reduction of graphene oxide via Lycium barbarum extract. J. Solid State Chem. 2017, 246, 351–356. [Google Scholar] [CrossRef]
- Hou, D.; Liu, Q.; Cheng, H.; Li, K.; Wang, D.; Zhang, H. Chrysanthemum extract assisted green reduction of graphene oxide. Mater. Chem. Phys. 2016, 183, 76–82. [Google Scholar] [CrossRef]
- Zhang, C.; Lv, W.; Xie, X.; Tang, D.; Liu, C.; Yang, Q.H. Towards low temperature thermal exfoliation of graphite oxide for graphene production. Carbon N. Y. 2013, 62, 11–24. [Google Scholar] [CrossRef]
- Schniepp, H.C.; Li, J.; Mcallister, M.J.; Sai, H.; Herrera-alonso, M.; Adamson, D.H.; Prud, R.K.; Car, R.; Saville, D.A.; Aksay, I.A. Functionalized single graphene sheets derived from splitting graphite oxide. J. Phys. Chem. B 2006, 110, 8535–8539. [Google Scholar] [CrossRef] [Green Version]
- Mcallister, M.J.; Li, J.; Adamson, D.H.; Schniepp, H.C.; Abdala, A.A.; Liu, J.; Herrera-alonso, O.M.; Milius, D.L.; Car, R.; Prud, R.K.; et al. Single sheet functionalized graphene by oxidation and thermal expansion of graphite. Chem. Mater. 2007, 19, 4396–4404. [Google Scholar] [CrossRef]
- Shen, B.; Lu, D.; Zhai, W.; Zheng, W. Synthesis of graphene by low-temperature exfoliation and reduction of graphite oxide under ambient atmosphere. J. Mater. Chem. C 2013, 1, 50–53. [Google Scholar] [CrossRef]
- Lv, W.; Tang, D.M.; He, Y.B.; You, C.H.; Shi, Z.Q.; Chen, X.C.; Chen, C.M.; Hou, P.X.; Liu, C.; Yang, Q.H. Low-temperature exfoliated graphenes: Vacuum-promoted exfoliation and electrochemical energy storage. ACS Nano 2009, 3, 3730–3736. [Google Scholar] [CrossRef] [PubMed]
- Yang, H.; Kannappan, S.; Pandian, A.S.; Jang, J.H.; Lee, Y.S.; Lu, W. Nanoporous graphene materials by lowerature vacuum-assisted thermal process for electrochemical energy storage. J. Power Sources 2015, 284, 146–153. [Google Scholar] [CrossRef]
- Kaniyoor, A.; Baby, T.T.; Ramaprabhu, S. Graphene synthesis via hydrogen induced low temperature exfoliation of graphite oxide. J. Mater. Chem. 2010, 20, 8467–8469. [Google Scholar] [CrossRef]
- Qiu, Y.; Guo, F.; Hurt, R.; Külaots, I. Explosive thermal reduction of graphene oxide-based materials: Mechanism and safety implications. Carbon N. Y. 2014, 72, 215–223. [Google Scholar] [CrossRef] [Green Version]
- Sun, G.; Zheng, L.; Zhan, Z.; Zhou, J.; Liu, X.; Li, L. Actuation triggered exfoliation of graphene oxide at low temperature for electrochemical capacitor applications. Carbon N. Y. 2014, 68, 748–754. [Google Scholar] [CrossRef]
- Botas, C.; Álvarez, P.; Blanco, C.; Santamaría, R.; Granda, M.; Ares, P.; Rodríguez-Reinoso, F.; Menéndez, R. The effect of the parent graphite on the structure of graphene oxide. Carbon N. Y. 2012, 50, 275–282. [Google Scholar] [CrossRef] [Green Version]
- BN-79/6048-02-06 Sadza–Metody Badań–Oznaczenie Gęstości Nasypowej; Wydawnictwa Normalizacyjne: Warsaw, Poland, 1980.
- Rabiej, M. Application of the particle swarm optimization method for the analysis of wide-angle X-ray diffraction curves of semicrystalline polymers. J. Appl. Crystallogr. 2017, 50, 221–230. [Google Scholar] [CrossRef]
- Szabó, T.; Berkesi, O.; Dékány, I. DRIFT study of deuterium-exchanged graphite oxide. Carbon N. Y. 2005, 43, 3186–3189. [Google Scholar] [CrossRef]
- Gupta, B.; Kumar, N.; Panda, K.; Kanan, V.; Joshi, S.; Visoly-Fisher, I. Role of oxygen functional groups in reduced graphene oxide for lubrication. Sci. Rep. 2017, 7, 1–14. [Google Scholar] [CrossRef]
- Ferrari, A.C.; Meyer, J.C.; Scardaci, V.; Casiraghi, C.; Lazzeri, M.; Mauri, F.; Piscanec, S.; Jiang, D.; Novoselov, K.S.; Roth, S.; et al. Raman spectrum of graphene and graphene layers. Phys. Rev. Lett. 2006, 97, 1–4. [Google Scholar] [CrossRef] [PubMed] [Green Version]
- Malard, L.M.; Pimenta, M.A.; Dresselhaus, G.; Dresselhaus, M.S. Raman spectroscopy in graphene. Phys. Rep. 2009, 473, 51–87. [Google Scholar] [CrossRef]
- Krishnamoorthy, K.; Veerapandian, M.; Yun, K.; Kim, S.J. The chemical and structural analysis of graphene oxide with different degrees of oxidation. Carbon N. Y. 2013, 53, 38–49. [Google Scholar] [CrossRef]
- Botas, C.; Álvarez, P.; Blanco, C.; Santamaría, R.; Granda, M.; Gutiérrez, M.D.; Rodríguez-Reinoso, F.; Menéndez, R. Critical temperatures in the synthesis of graphene-like materials by thermal exfoliation-reduction of graphite oxide. Carbon N. Y. 2013, 52, 476–485. [Google Scholar] [CrossRef] [Green Version]
- Sieradzka, M.; Ślusarczyk, C.; Fryczkowski, R.; Janicki, J. Insight into the effect of graphite grain sizes on the morphology, structure and electrical properties of reduced graphene oxide. J. Mater. Res. Technol. 2020, 9, 7059–7067. [Google Scholar] [CrossRef]
- Fryczkowska, B.; Sieradzka, M.; Sarna, E.; Fryczkowski, R.; Janicki, J. Influence of a graphene oxide additive and the conditions of membrane formation on the morphology and separative properties of poly(vinylidene fluoride) membranes. J. Appl. Polym. Sci. 2015, 132. [Google Scholar] [CrossRef]
- Al-Gaashani, R.; Najjar, A.; Zakaria, Y.; Mansour, S.; Atieh, M.A. XPS and structural studies of high quality graphene oxide and reduced graphene oxide prepared by different chemical oxidation methods. Ceram. Int. 2019, 45. [Google Scholar] [CrossRef]
- Ali, G.; Mehmood, A.; Ha, H.Y.; Kim, J.; Chung, K.Y. Reduced graphene oxide as a stable and high-capacity cathode material for Na-ion batteries. Sci. Rep. 2017, 7. [Google Scholar] [CrossRef]
- De Silva, K.K.H.; Huang, H.H.; Joshi, R.K.; Yoshimura, M. Chemical reduction of graphene oxide using green reductants. Carbon N. Y. 2017, 119, 190–199. [Google Scholar] [CrossRef]
- Hu, Z.; Chen, Y.; Hou, Q.; Yin, R.; Liu, F.; Chen, H. Characterization of graphite oxide after heat treatment. New J. Chem. 2012, 36, 1373–1377. [Google Scholar] [CrossRef]
- Dao, T.D.; Jeong, H.M. Graphene prepared by thermal reduction-exfoliation of graphite oxide: Effect of raw graphite particle size on the properties of graphite oxide and graphene. Mater. Res. Bull. 2015, 70, 651–657. [Google Scholar] [CrossRef]
- Kudin, K.N.; Ozbas, B.; Schniepp, H.C.; Prud’homme, R.K.; Aksay, I.A.; Car, R. Raman spectra of graphite oxide and functionalized graphene sheets. Nano Lett. 2008, 8, 36–41. [Google Scholar] [CrossRef] [PubMed]
- Ye, J.; Zhang, H.; Chen, Y.; Cheng, Z.; Hu, L.; Ran, Q. Supercapacitors based on low-temperature partially exfoliated and reduced graphite oxide. J. Power Sources 2012, 212, 105–110. [Google Scholar] [CrossRef]


| Sample | Mixing Time of the Reagents | Sonication | NaNO3 | |||
|---|---|---|---|---|---|---|
| 1 h | 24 h | Yes | Not | Yes | Not | |
| 1 | X | – | X | – | X | – |
| 2 | X | – | X | – | – | X |
| 3 | X | – | – | X | – | X |
| 4 | X | – | – | X | X | – |
| 5 | – | X | X | – | X | – |
| 6 | – | X | X | – | – | X |
| 7 | – | X | – | X | X | – |
| 8 | – | X | – | X | – | X |
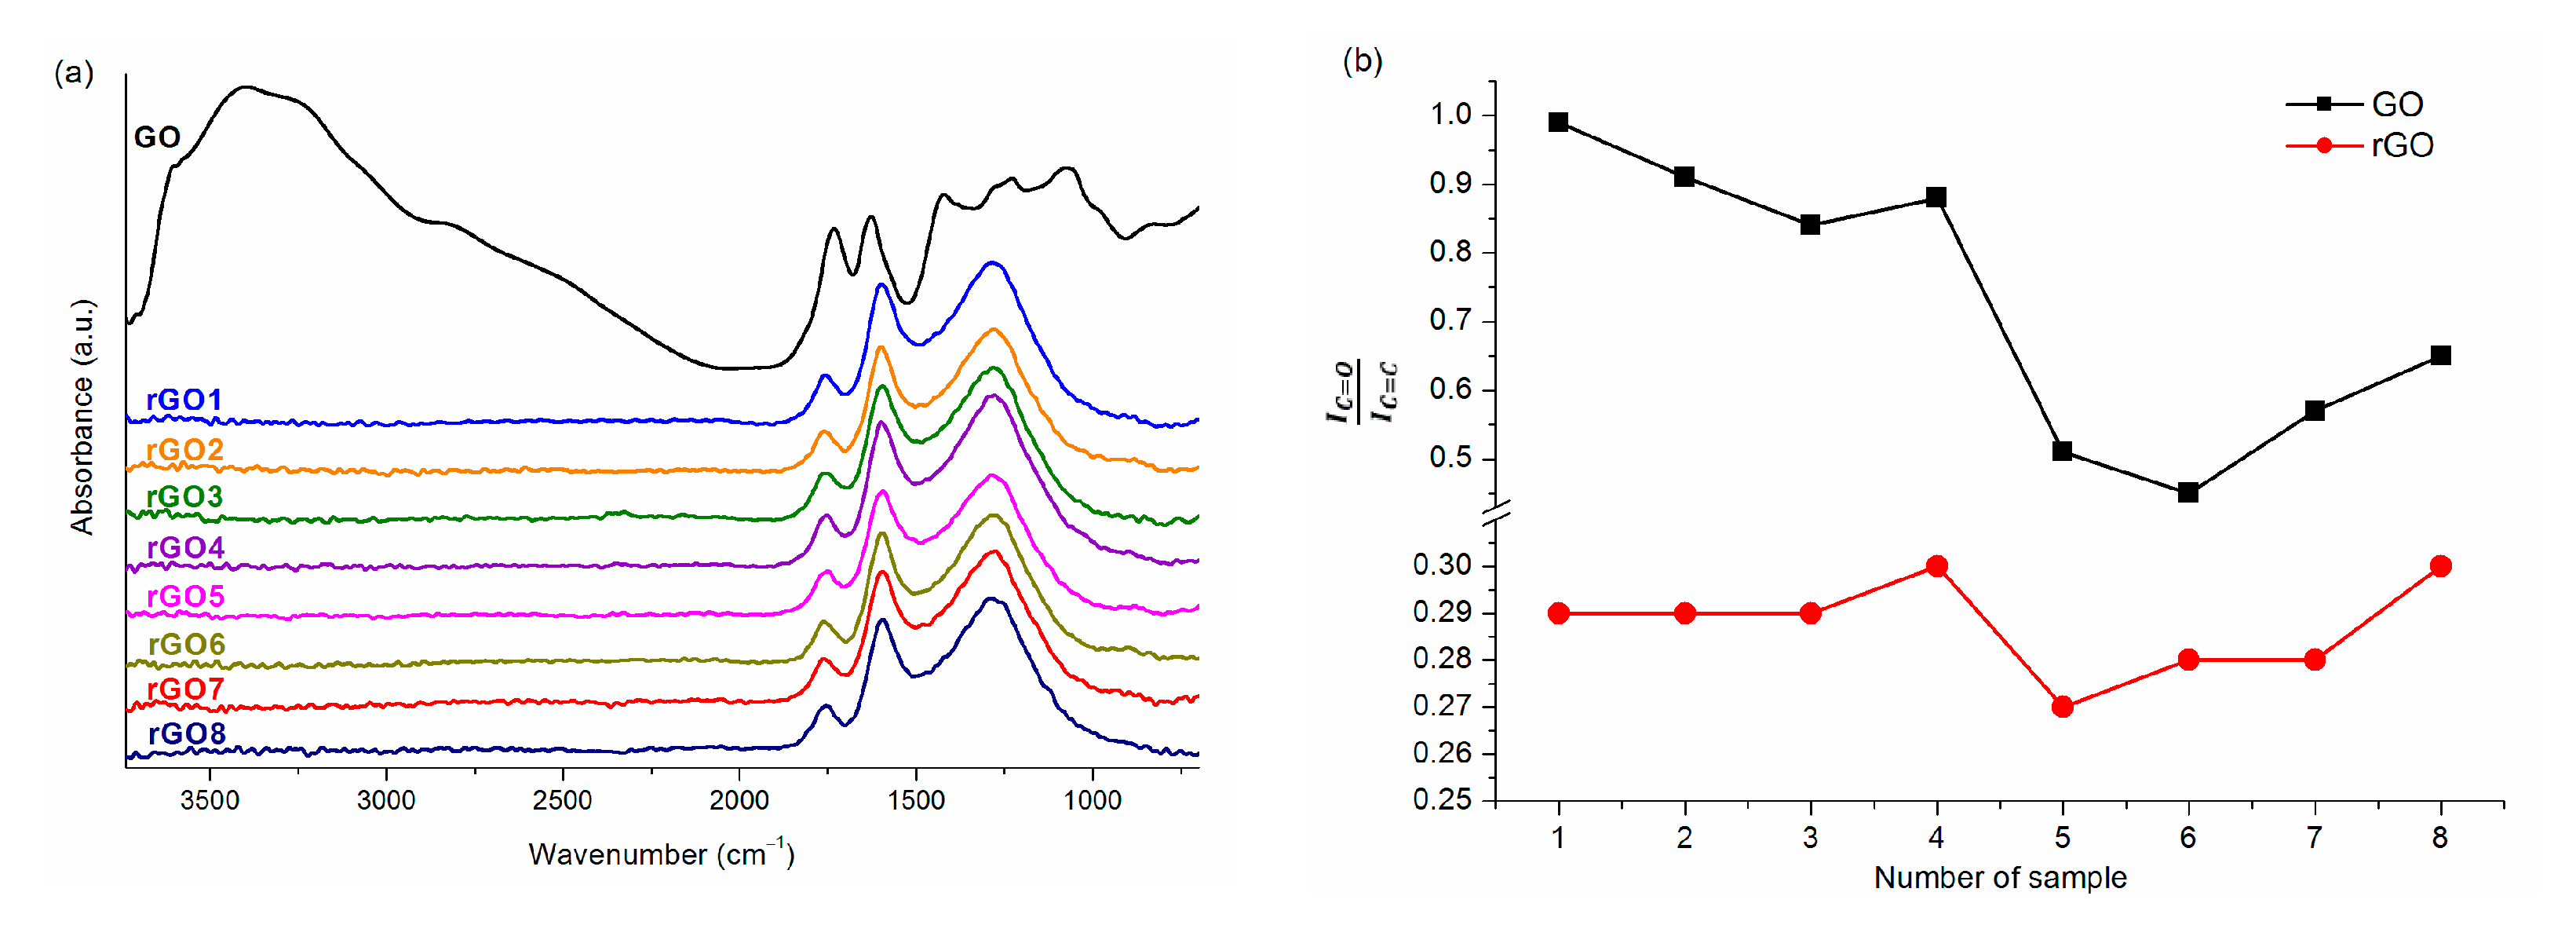
| Sample | GO1 | GO2 | GO3 | GO4 | GO5 | GO6 | GO7 | GO8 |
|---|---|---|---|---|---|---|---|---|
| 0.99 | 0.91 | 0.84 | 0.88 | 0.51 | 0.45 | 0.57 | 0.65 | |
| C/O * | 1.76 | 1.87 | 1.76 | 1.82 | 1.85 | 2.01 | 1.92 | 1.76 |
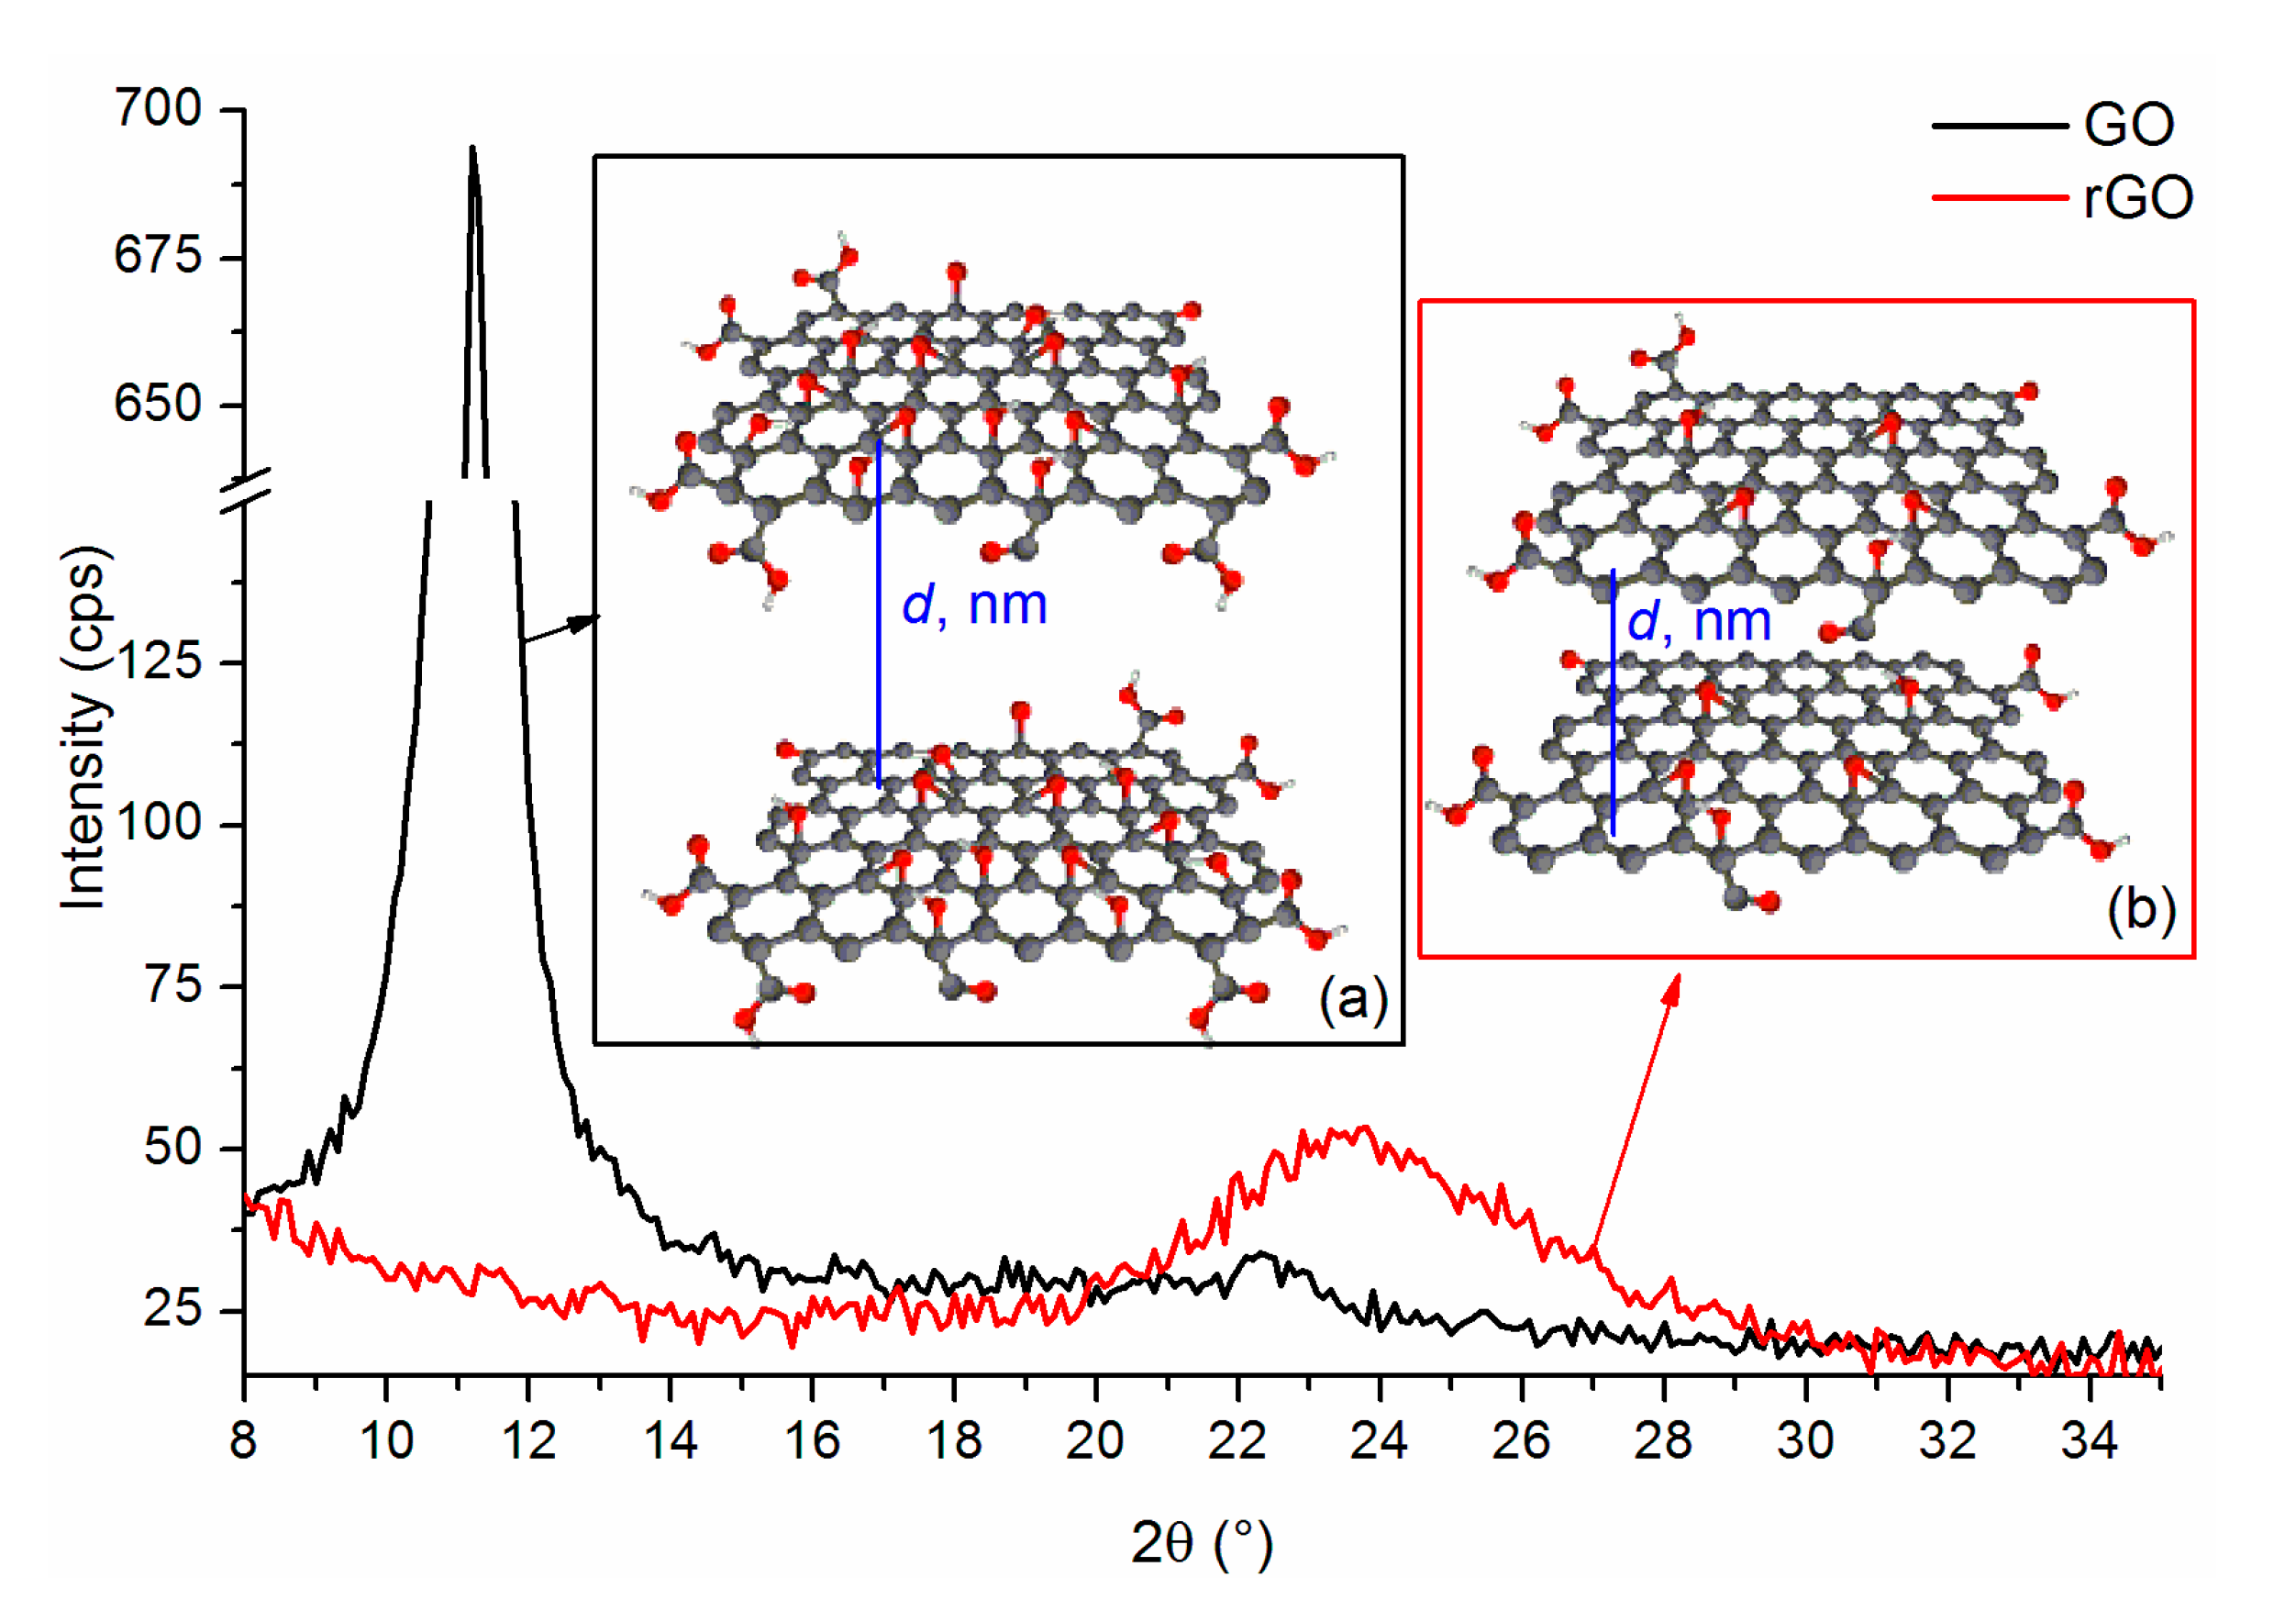
| Sample | 2θ (°) | Size of Crystallites, D (nm) | Interlayer Distance, d (nm) | Number of Layers, N |
|---|---|---|---|---|
| Graphite | 26.48 | 33.00 | 0.33 | 101 |
| GO1 | 10.89 | 16.48 | 0.81 | 21 |
| GO2 | 10.85 | 15.17 | 0.81 | 20 |
| GO3 | 11.24 | 17.48 | 0.79 | 23 |
| GO4 | 11.38 | 15.18 | 0.78 | 20 |
| GO5 | 11.15 | 14.31 | 0.79 | 19 |
| GO6 | 11.31 | 15.39 | 0.78 | 21 |
| GO7 | 11.32 | 17.07 | 0.78 | 23 |
| GO8 | 11.03 | 17.28 | 0.80 | 23 |
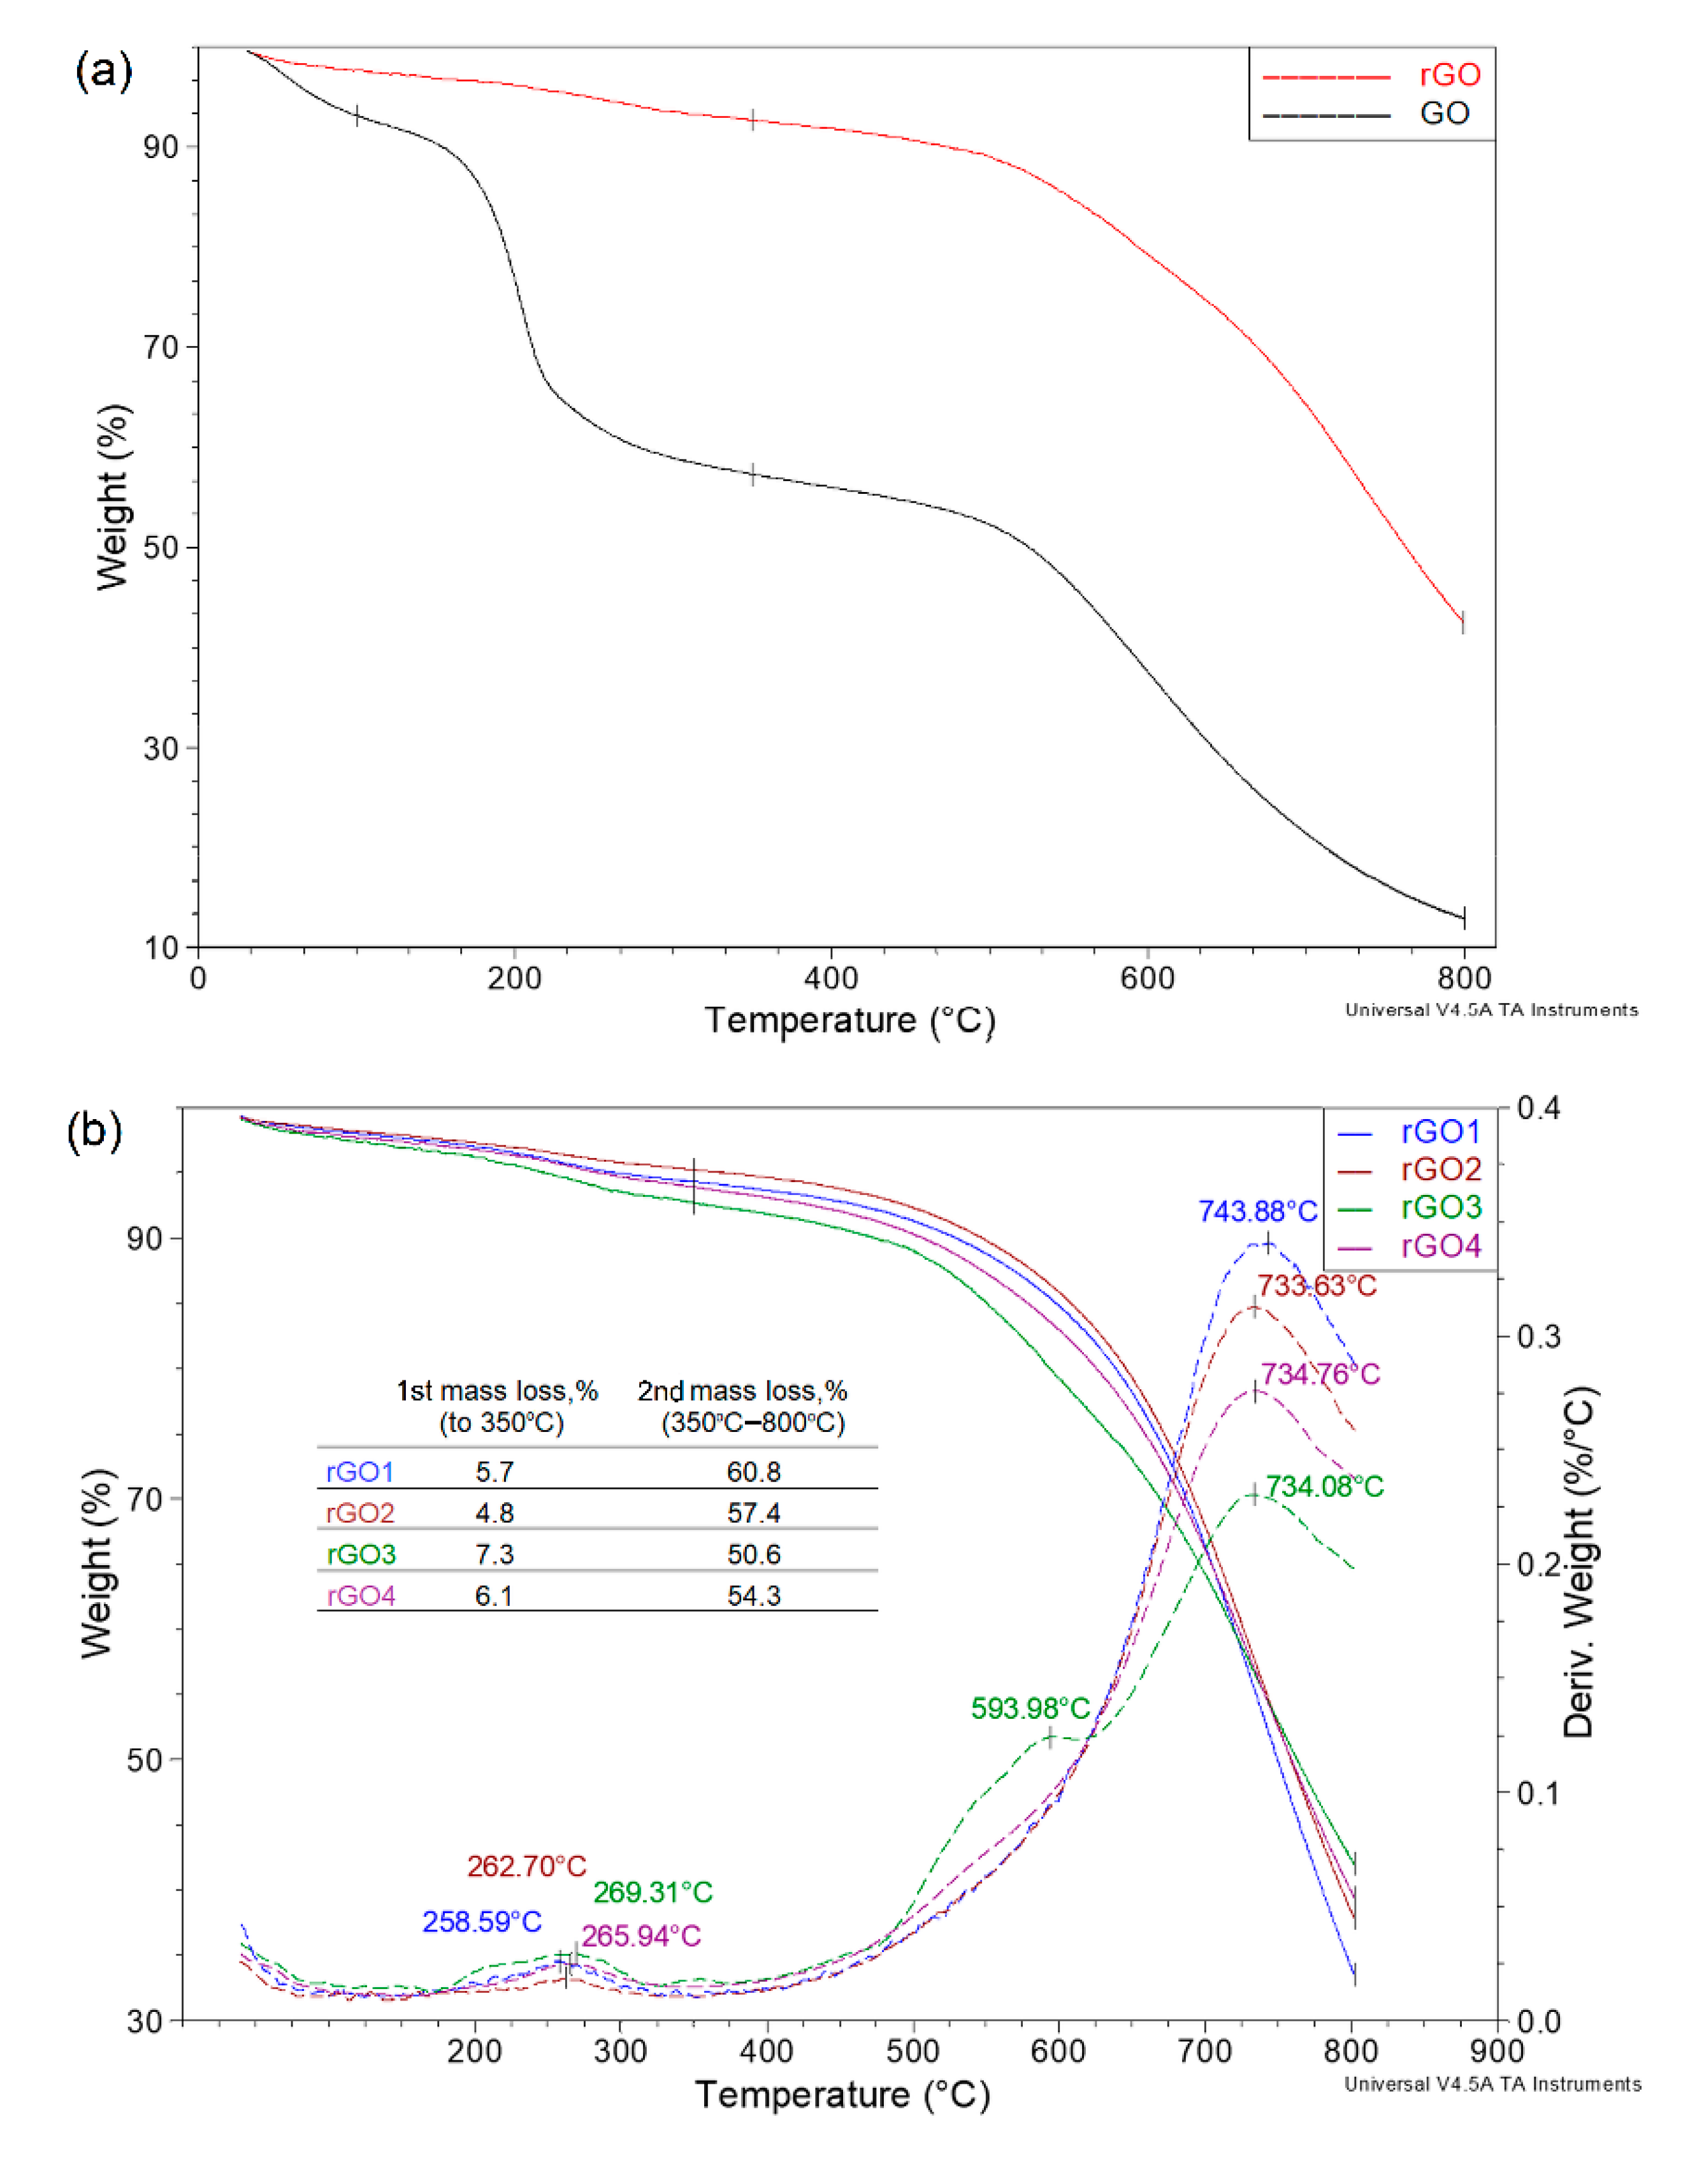
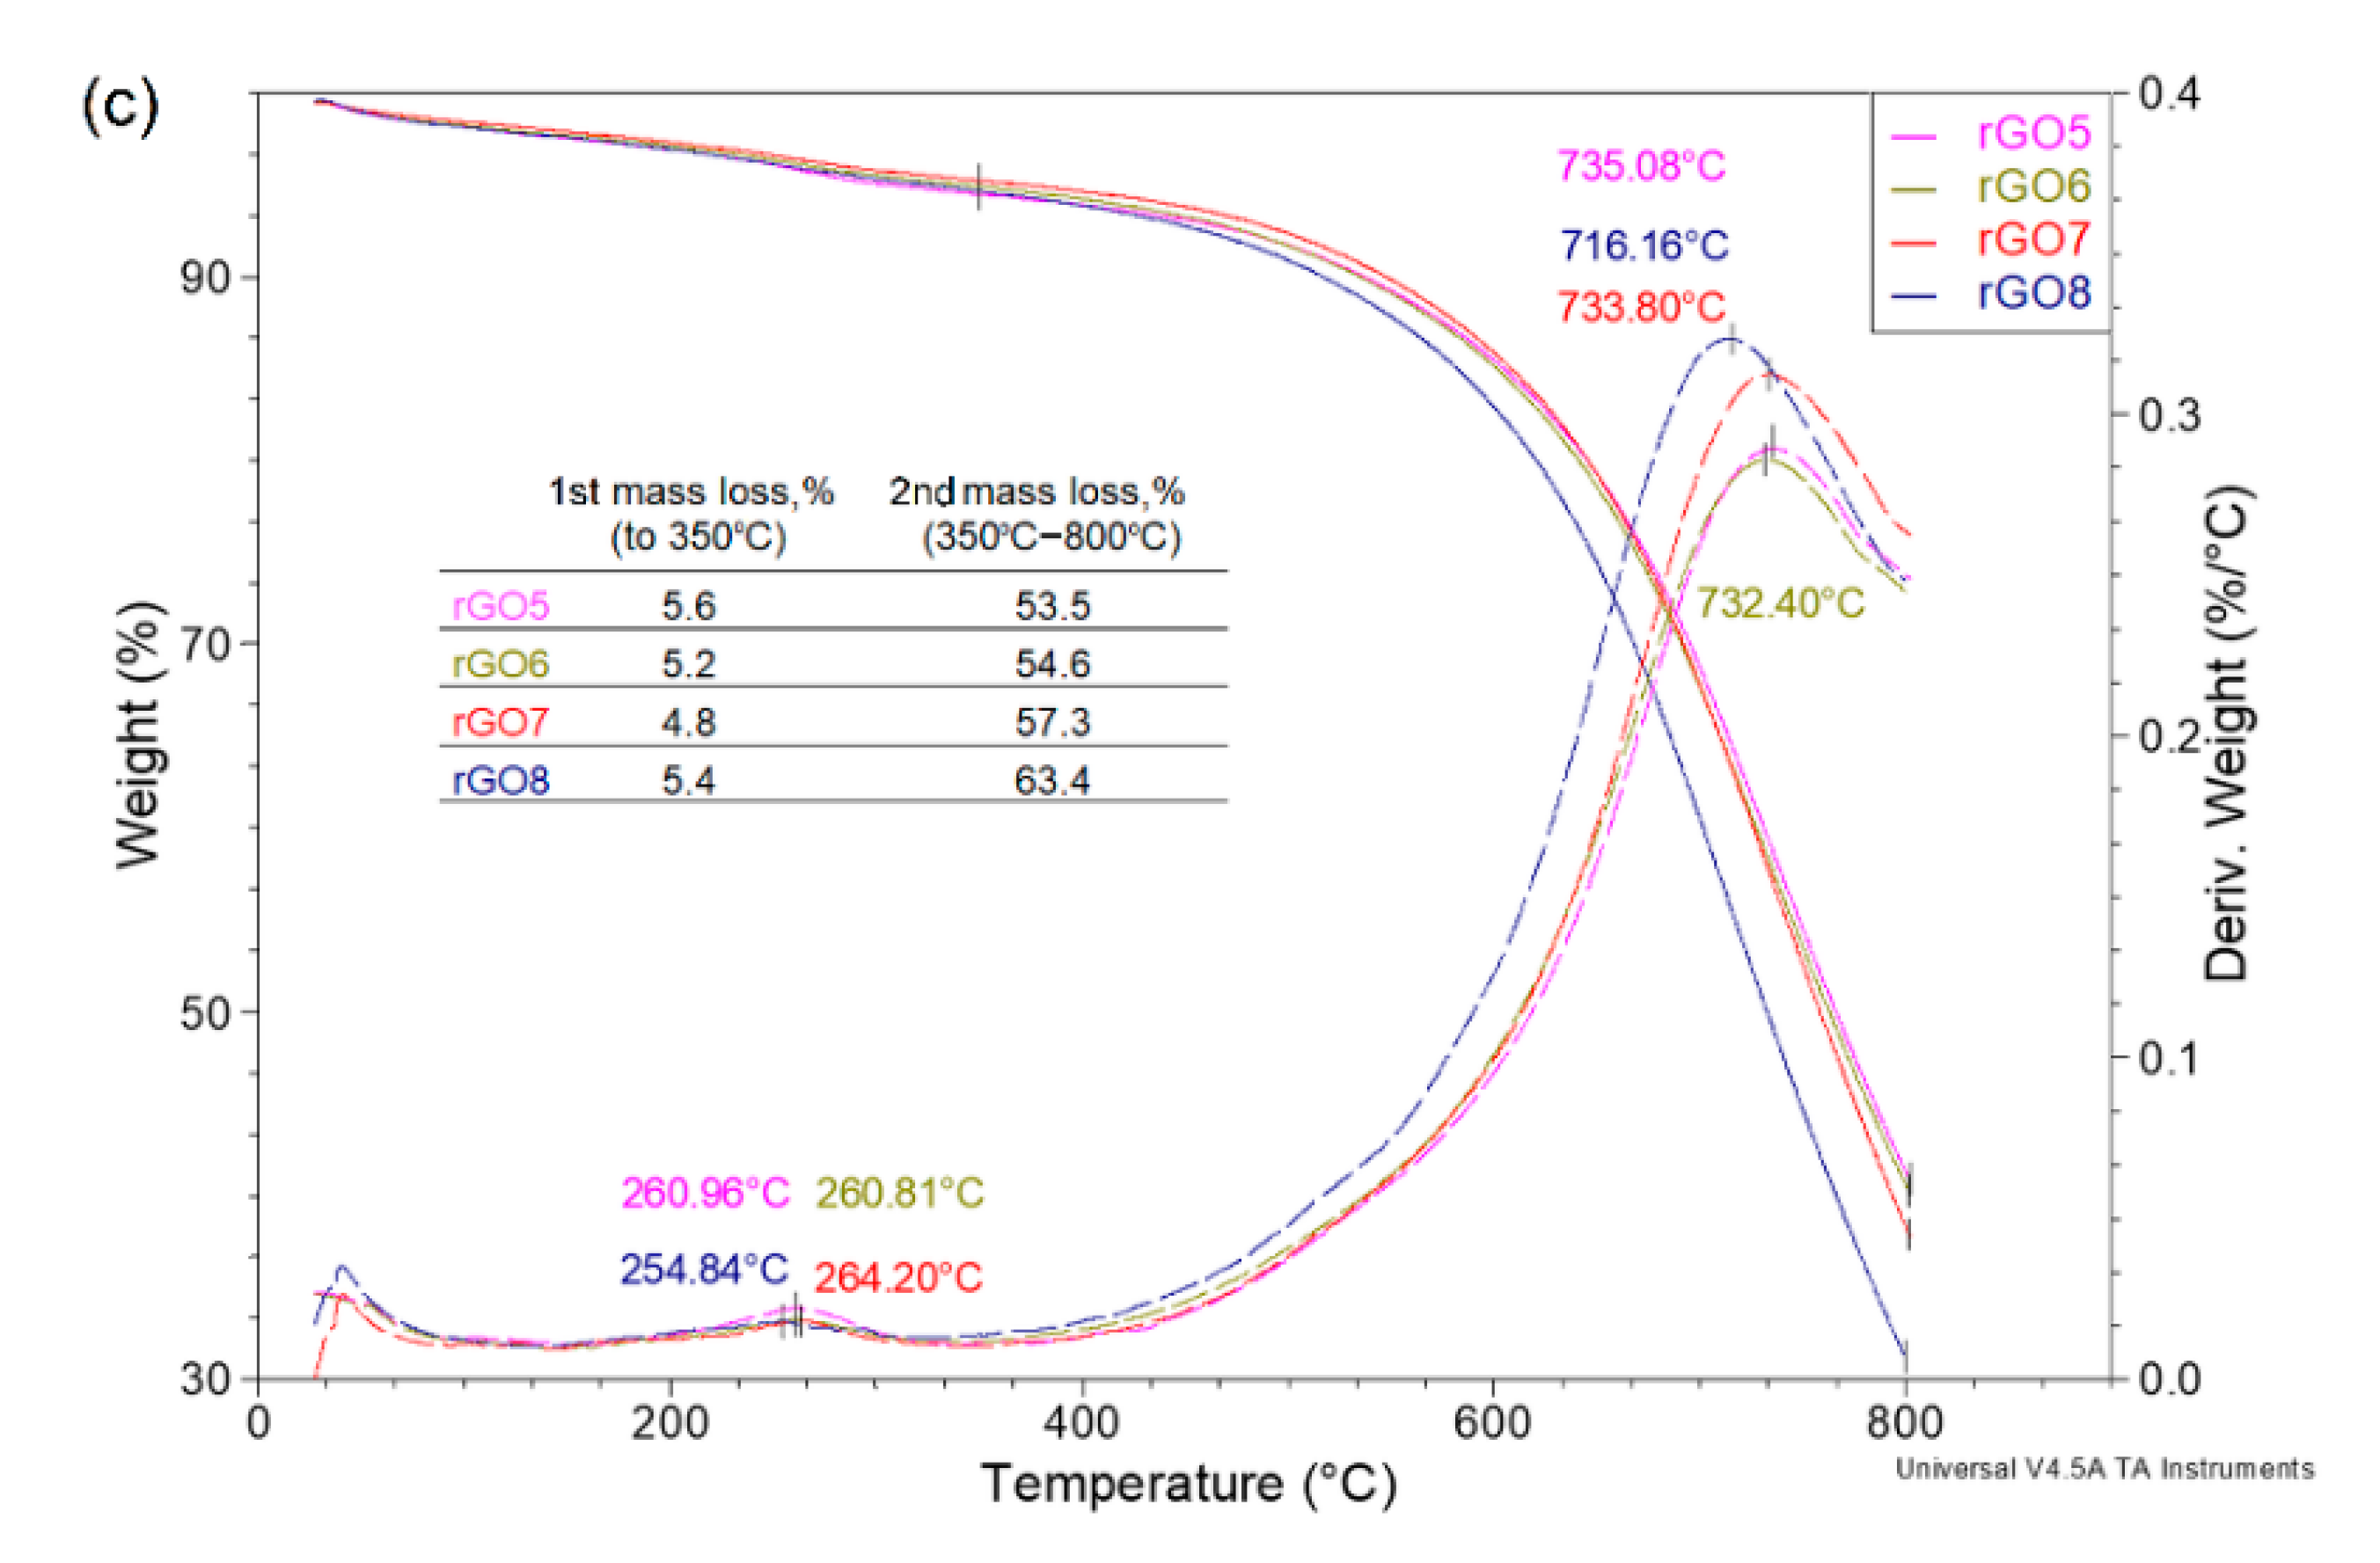
| Sample | 2θ (°) | Size of Crystallites, D (nm), * | Interlayer Distance, d (nm) | Number of Layers, N |
|---|---|---|---|---|
| rGO1 | 24.28 | 2.15 (6) | 0.37 | 7 |
| rGO2 | 23.95 | 2.38 (8) | 0.37 | 7 |
| rGO3 | 23.86 | 1.76 (10) | 0.37 | 6 |
| rGO4 | 23.88 | 1.81 (8) | 0.37 | 6 |
| rGO5 | 23.98 | 2.06 (7) | 0.37 | 7 |
| rGO6 | 23.73 | 1.86 (8) | 0.38 | 6 |
| rGO7 | 23.70 | 2.73 (6) | 0.38 | 8 |
| rGO8 | 23.78 | 2.28 (8) | 0.37 | 7 |
| Sample | rGO1 | rGO2 | rGO3 | rGO4 | rGO5 | rGO6 | rGO7 | rGO8 |
|---|---|---|---|---|---|---|---|---|
| C/O | 4.47 | 3.98 | 4.41 | 4.23 | 4.22 | 3.77 | 4.32 | 4.19 |
| Sample | Raman Shift G Band (cm−1) for GO | Raman Shift G Band (cm−1) for rGO | GO | rGO |
|---|---|---|---|---|
| 1 | 1599 | 1583 | 1.72 | 2.14 |
| 2 | 1594 | 1586 | 1.58 | 2.04 |
| 3 | 1589 | 1586 | 1.70 | 1.93 |
| 4 | 1594 | 1584 | 1.75 | 2.09 |
| 5 | 1593 | 1581 | 1.67 | 1.98 |
| 6 | 1592 | 1583 | 1.68 | 2.21 |
| 7 | 1588 | 1584 | 1.71 | 2.05 |
| 8 | 1588 | 1583 | 1.81 | 2.22 |
Publisher’s Note: MDPI stays neutral with regard to jurisdictional claims in published maps and institutional affiliations. |
© 2021 by the authors. Licensee MDPI, Basel, Switzerland. This article is an open access article distributed under the terms and conditions of the Creative Commons Attribution (CC BY) license (http://creativecommons.org/licenses/by/4.0/).
Share and Cite
Sieradzka, M.; Ślusarczyk, C.; Biniaś, W.; Fryczkowski, R. The Role of the Oxidation and Reduction Parameters on the Properties of the Reduced Graphene Oxide. Coatings 2021, 11, 166. https://doi.org/10.3390/coatings11020166
Sieradzka M, Ślusarczyk C, Biniaś W, Fryczkowski R. The Role of the Oxidation and Reduction Parameters on the Properties of the Reduced Graphene Oxide. Coatings. 2021; 11(2):166. https://doi.org/10.3390/coatings11020166
Chicago/Turabian StyleSieradzka, Marta, Czesław Ślusarczyk, Włodzimierz Biniaś, and Ryszard Fryczkowski. 2021. "The Role of the Oxidation and Reduction Parameters on the Properties of the Reduced Graphene Oxide" Coatings 11, no. 2: 166. https://doi.org/10.3390/coatings11020166