Article

Thermal Stress Cycle Simulation in Laser Cladding Process of Ni-Based Coating on H13 Steel

1
School of Mechanical Engineering and Automation, Northeastern University, Shenyang 110004, China
2
Faculty of Robot Science and Engineering, Northeastern University, Shenyang 110004, China
*
Author to whom correspondence should be addressed.
Coatings 2021, 11(2), 203; https://doi.org/10.3390/coatings11020203
Submission received: 2 November 2020 / Revised: 31 January 2021 / Accepted: 4 February 2021 / Published: 10 February 2021
(This article belongs to the Special Issue Additively Manufactured Coatings)

Abstract

:
In order to improve the work efficiency and save resources in the process of laser cladding on the H13 steel surface, based on COMSOL, by combining computer simulation and experiment, a plane continuous heat source model was used to simulate and analyze the temperature and stress field. The optimal power and scanning speed were obtained. It is found in the simulation process that the thermal sampling points stress increases with the increase of laser power and scanning speed. Because of the existence of solid–liquid phase variation in the laser cladding process, there are two peaks in the maximum thermal stress cycle curve of the sample points located in the molten pool, and the starting and ending time of each sample point’s peak value is basically the same. When the sample point is outside the molten pool, because the metal at the corresponding location is not melted, so there is no obvious peak value in the thermal stress cycle curve. With the increase of cladding layer depth corresponding to each sample point, the variation range of the two alternating thermal stress peaks increases first and then decreases, while the duration increases. According to the peak value of alternating thermal stress at the sampling point, the molten pool depth can be predicted. The residual stress analysis of the cladding layer is carried out according to the analysis results of temperature field and stress field. Through the actual cladding experiment, it is found that the depth of molten pool in the simulation results is basically consistent with the experimental results. All simulation results are verified through actual cladding experiments.

1. Introduction

H13 steel is widely used as a kind of hot die steel. It can be used for manufacturing various hot extrusion and forging dies [1,2] because of its high thermal strength, hardness, abrasion resistance, toughness, good heat resistance, and fatigue performance. But the surface performance will be significantly reduced if the H13 steel mold is exposed to high temperature for a long time [3,4,5]. Laser cladding technology can effectively improve the surface performance of the metal, but the process of cladding is affected by many factors. If only a single experimental study is carried out, the work efficiency will be low and resources will be wasted [6]. By combining computer simulation and experiment, the research cycle can be greatly reduced and the efficiency can be improved [7].
In the past two decades, scholars domestic and abroad have established numerous laser cladding simulation models and conducted relevant studies [8]. Kong et al. [9] adopted the enthalpy-pore method to deal with the phase transition phenomenon in the cladding process, adopted the horizontal set method to track the movement of the molten pool. The forced convection and thermal radiation on the surface of the cladding layer were incorporated into the simulation model, while the heat transfer process in the laser multilayer cladding process of H13 section steel was studied. Liu Hao et al. [10] developed a simulation model of laser cladding temperature field for simultaneous powder delivery. The model processed the additive effect in the entire cladding process through the life and death element method, the shielding effect of the powder flow on the high-energy laser beam and the heat transfer of the laser beam in the powder conveying process were considered by calculating the shading rate [11,12,13,14,15].
Kar and Mazumder [16] proposed a one-dimensional conduction model to determine the alloy composition and cooling process. Hoadley and Rappaz [17] developed a two-dimensional model to calculate the steady-state temperature in the laser cladding process, which gave a quasi-steady-state numerical model of the substrate temperature field. The calculation takes into account the changes in the liquid molten pool, the gas–liquid for the shape and position of the free surface, in order to simplify the model, it is considered that the substrate melts very little and uses the line energy form of the laser, so that the approximate linear relationship between the laser power, the scanning speed, and the thickness of the repair layer is obtained. Han et al. [18] solved the two-dimensional fluid and energy equations, predicted the temperature distribution and geometry of the molten pool during the laser cladding process. Cho and Pirch [19] published a three-dimensional steady-state finite element model of coaxial powder feeding. A self-consistent method is used to calculate the temperature field and coating shape. The obtained temperature gradient and cooling rate are used to predict the coating solidification structure. Jendrzejewski [20] discussed the influence of the preheating temperature on the temperature field and stress field of the repair layer, and adopted a linear approximation to its temperature characteristics. After preheating, the thermal stress value of the substrate repair layer reduced from 1800 MPa to 900 MPa, and got a crack-free repair layer. Toyserkani [21] et al. developed a three-dimensional transient finite element model of coaxial powder feeding. The coating is a multilayer structure, its width and height are determined by the area of the previous layer and laser powder. The model ignores the effect of surface tension and gravity on the shape of the coating. He [22,23] et al. studied the three-dimensional numerical model of the molten pool temperature and fluid flow during the laser cladding process of H13 steel, and used the level set method to simulate the molten pool. Kovacevic [24] and others at the Laser Aided Manufacturing Center of Southern Medical University USA used ANSYS to establish a finite element model. The law of temperature distribution and cooling rate in the molten pool under positive and negative defocusing conditions was studied. Compared with the Gaussian laser beam, it is found that the hollow laser beam (defocus) can effectively prevent the center of the molten pool from overheating, but the model does not consider the powder input impact when it reaches the molten pool. Parisa Farahmand studied the single multi-layer temperature field, strain stress field, and pool size evolution rule for laser cladding [25]. Gao W calculated the temperature variation, cooling rate, and solidification rate at the solid/liquid interface, but he did not consider the effect of Marangoni convection on the weld pool [26]. The Indian Institute of Technology and Monash University used H13 tool steel as the matrix to perform a single-pass laser cladding of CPM9V powder. It was found that the surface hardness of the cladding layer under single-layer and multi-layer conditions are the same. Researchers from Harazmi University in Tehran, Iran and Kaye Nasir Tutsi University of Technology in Tehran, Iran, used ABAQUS to simulate the laser cladding process of WC powder on the surface of Inconel 718. Analyzing the temperature field and residual stress distribution, it is concluded that the laser power and scanning rate have a greater influence on the dilution rate and residual stress of the cladding layer. The increase of input energy increases the residual stress of the cladding layer and the number of cracks decreases [27].
In this study, a planar continuous heat source model was used to conduct numerical simulation on the single-pass laser cladding process of H13 steel based on COMSOL software, the optimal process parameter scheme was determined, the thermal stress and thermal cycle curves were drawn and analyzed, which are used to study the influence of thermal stress cycle on the cladding layer, the residual stress of the cladding layer is also simulated.

2. Simulation Model

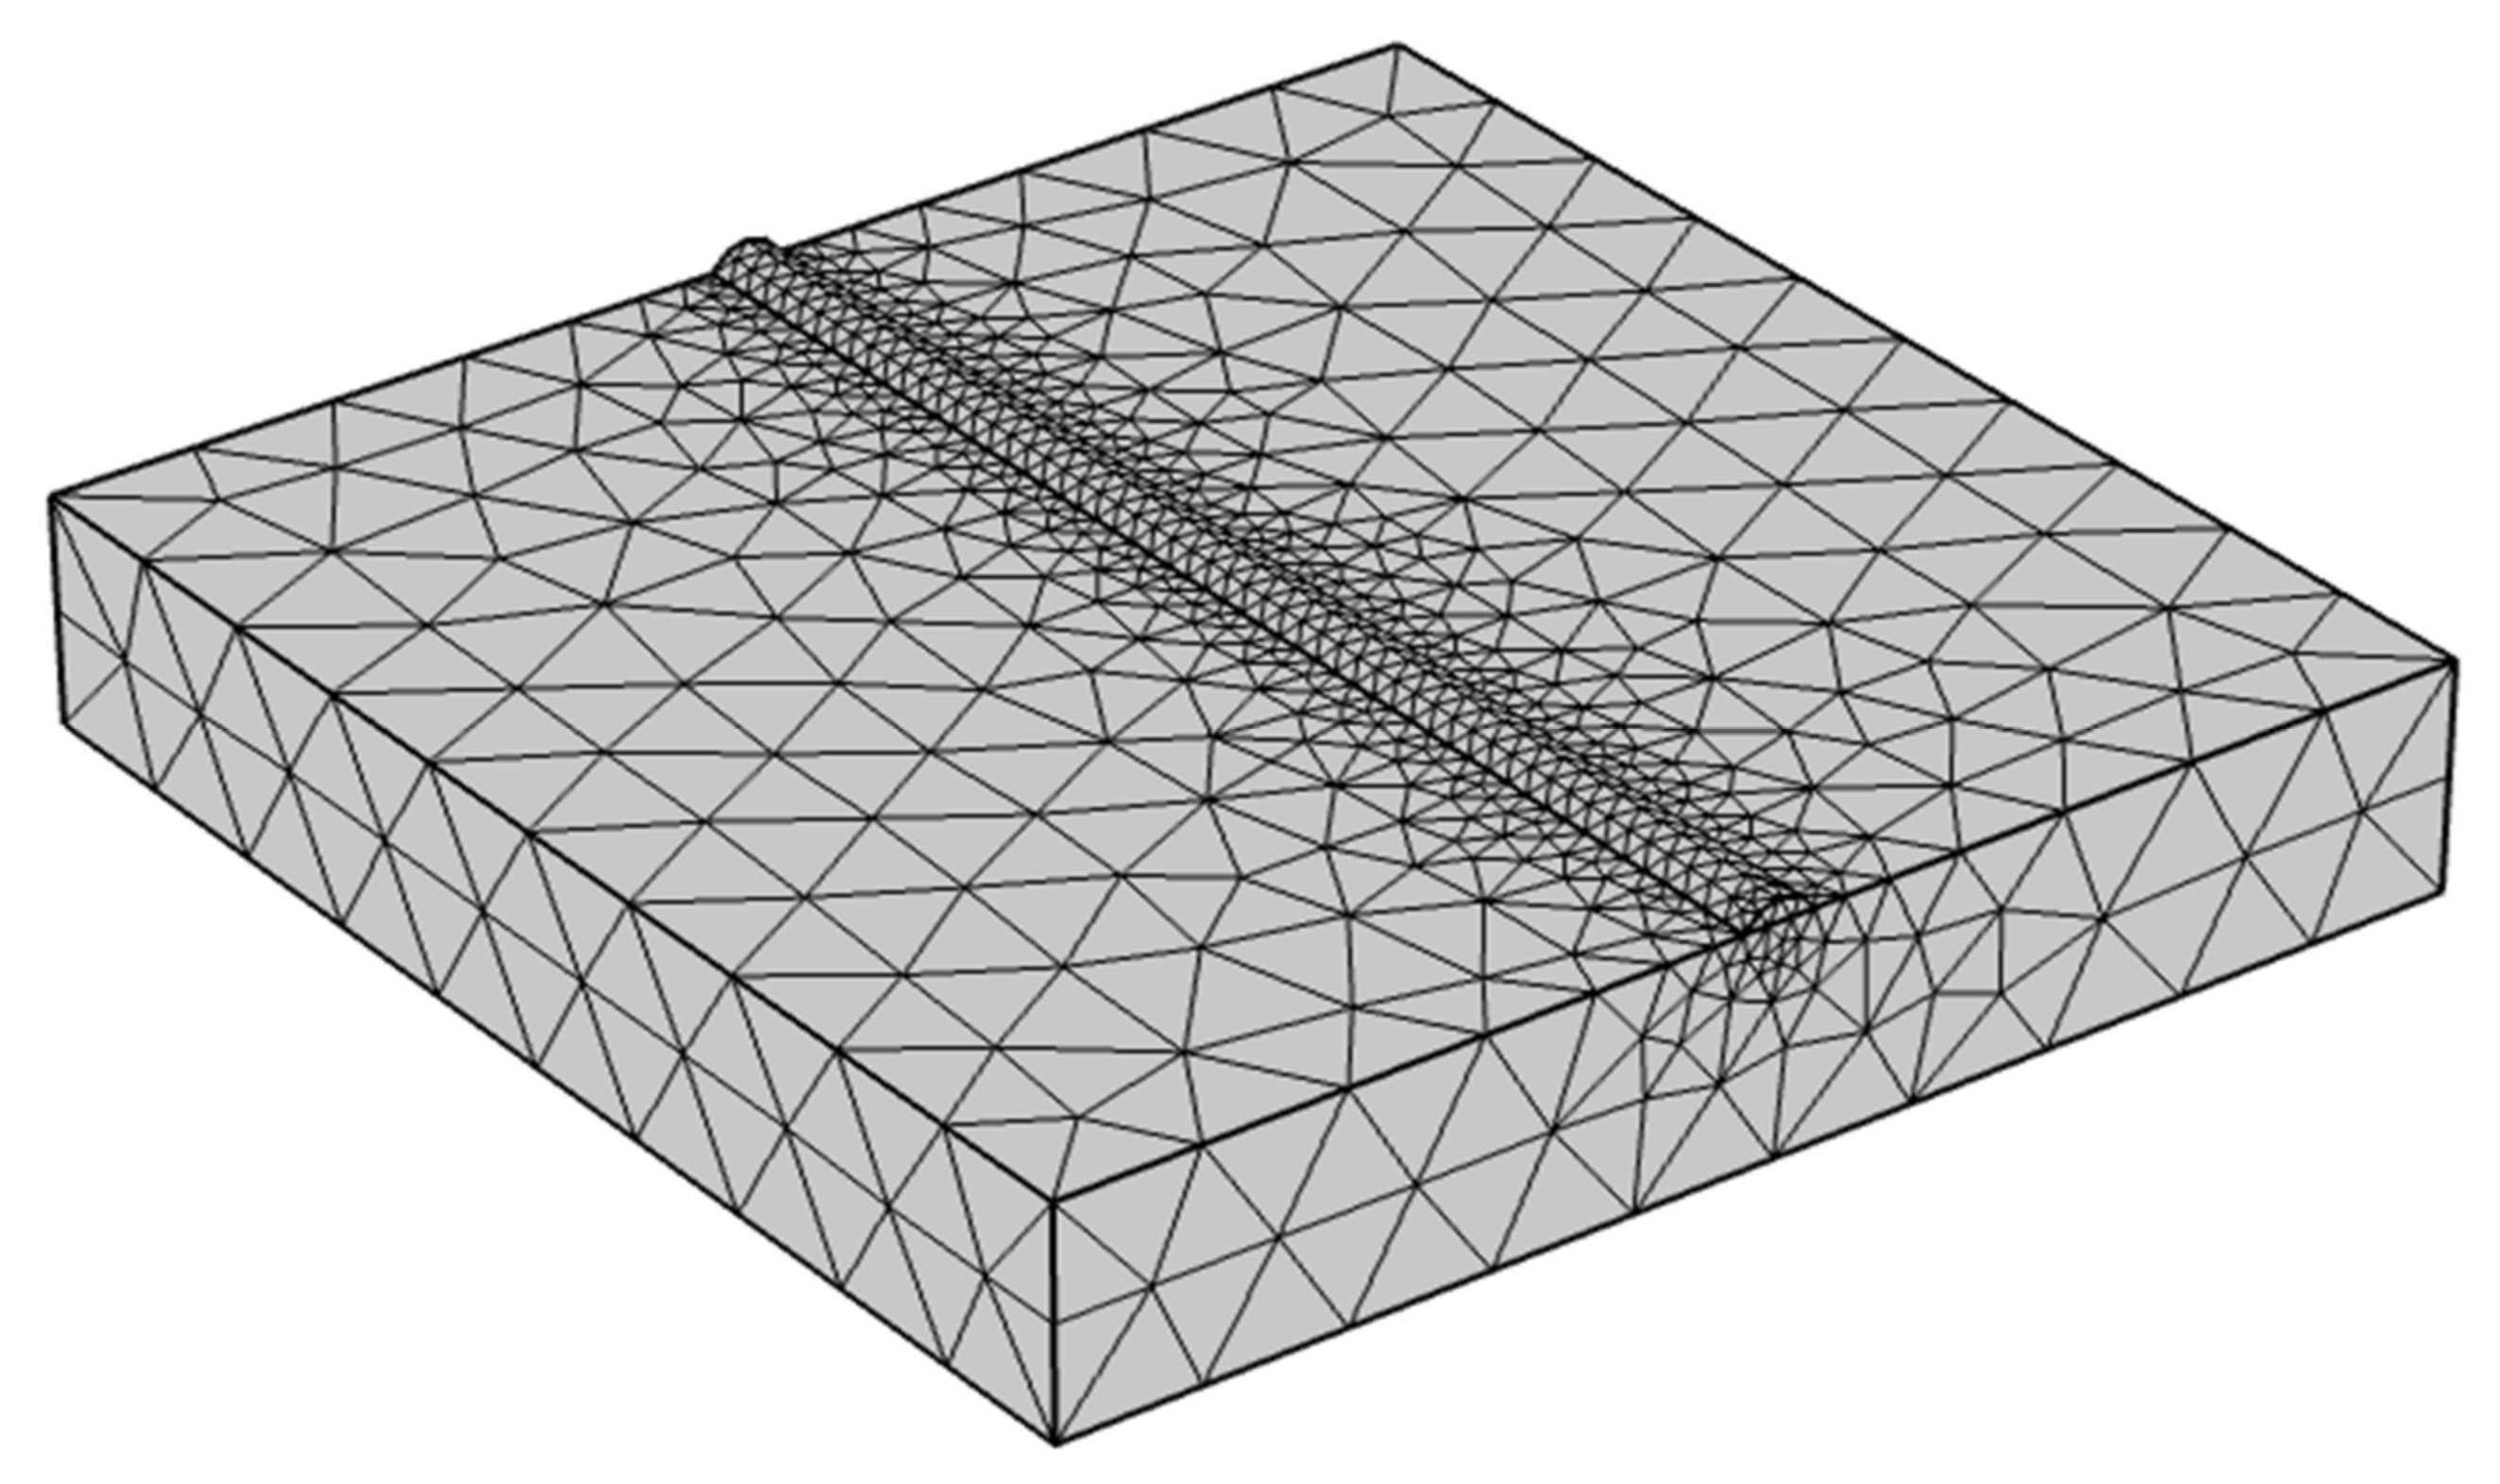
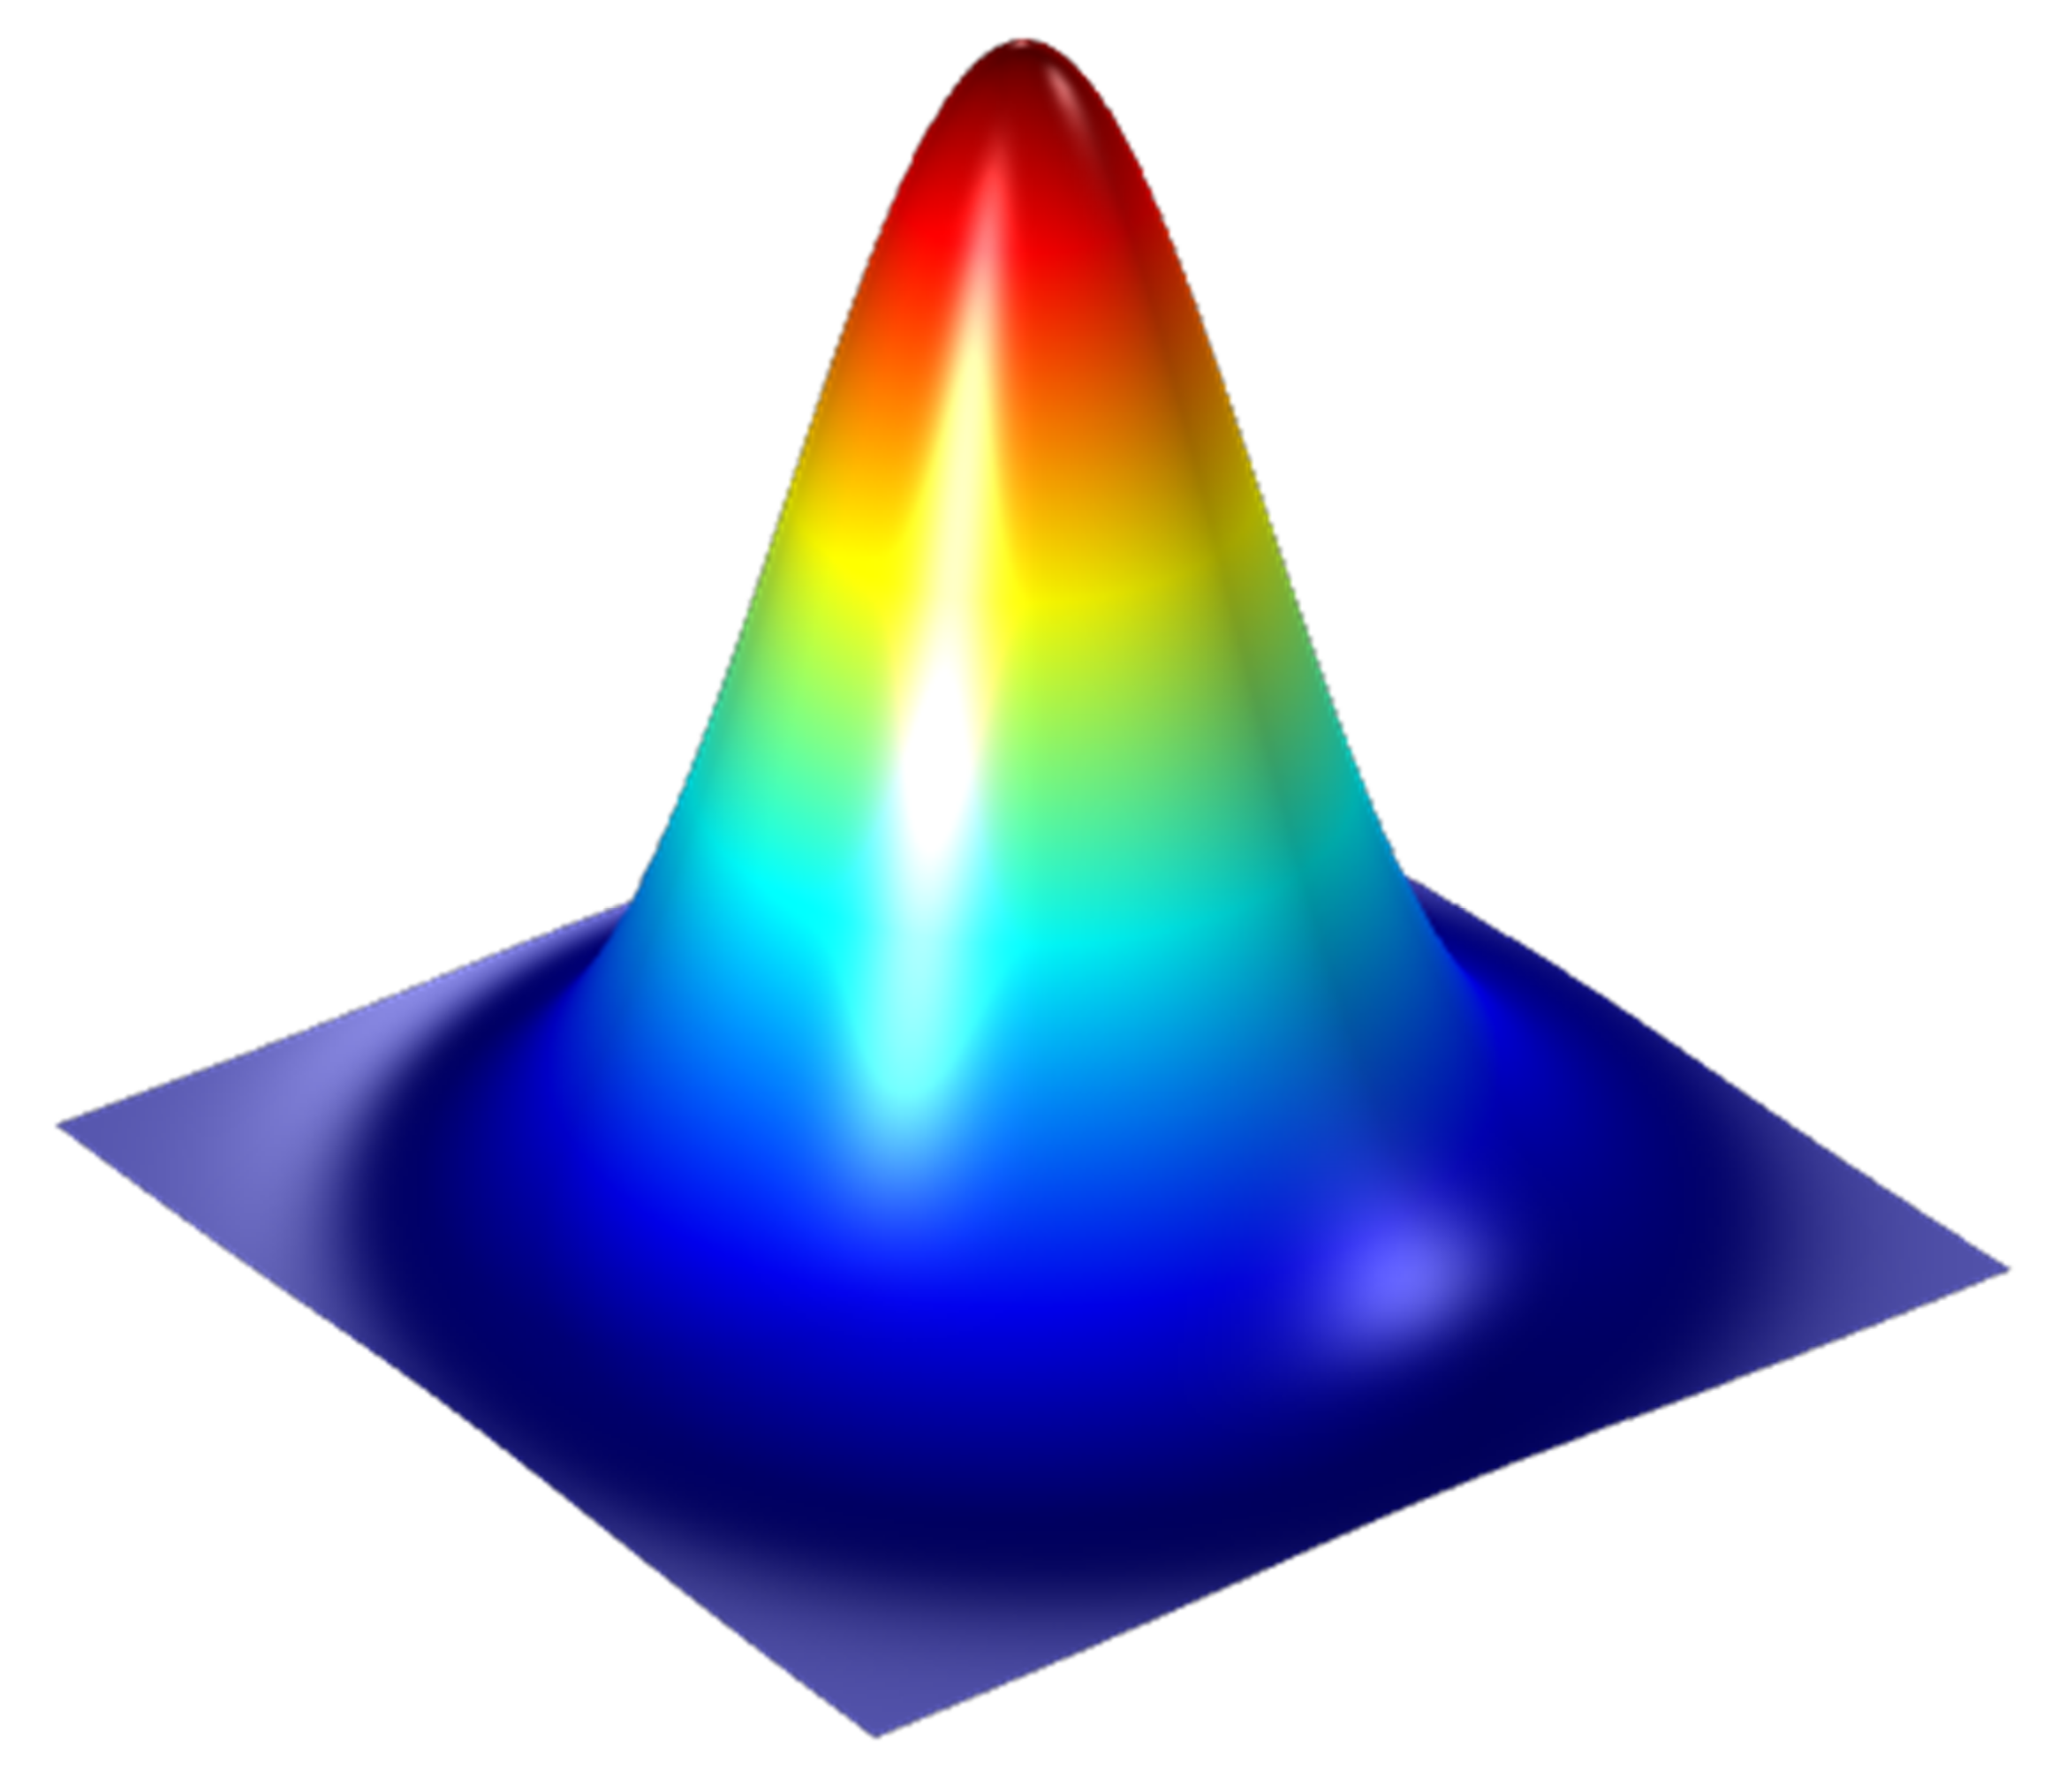
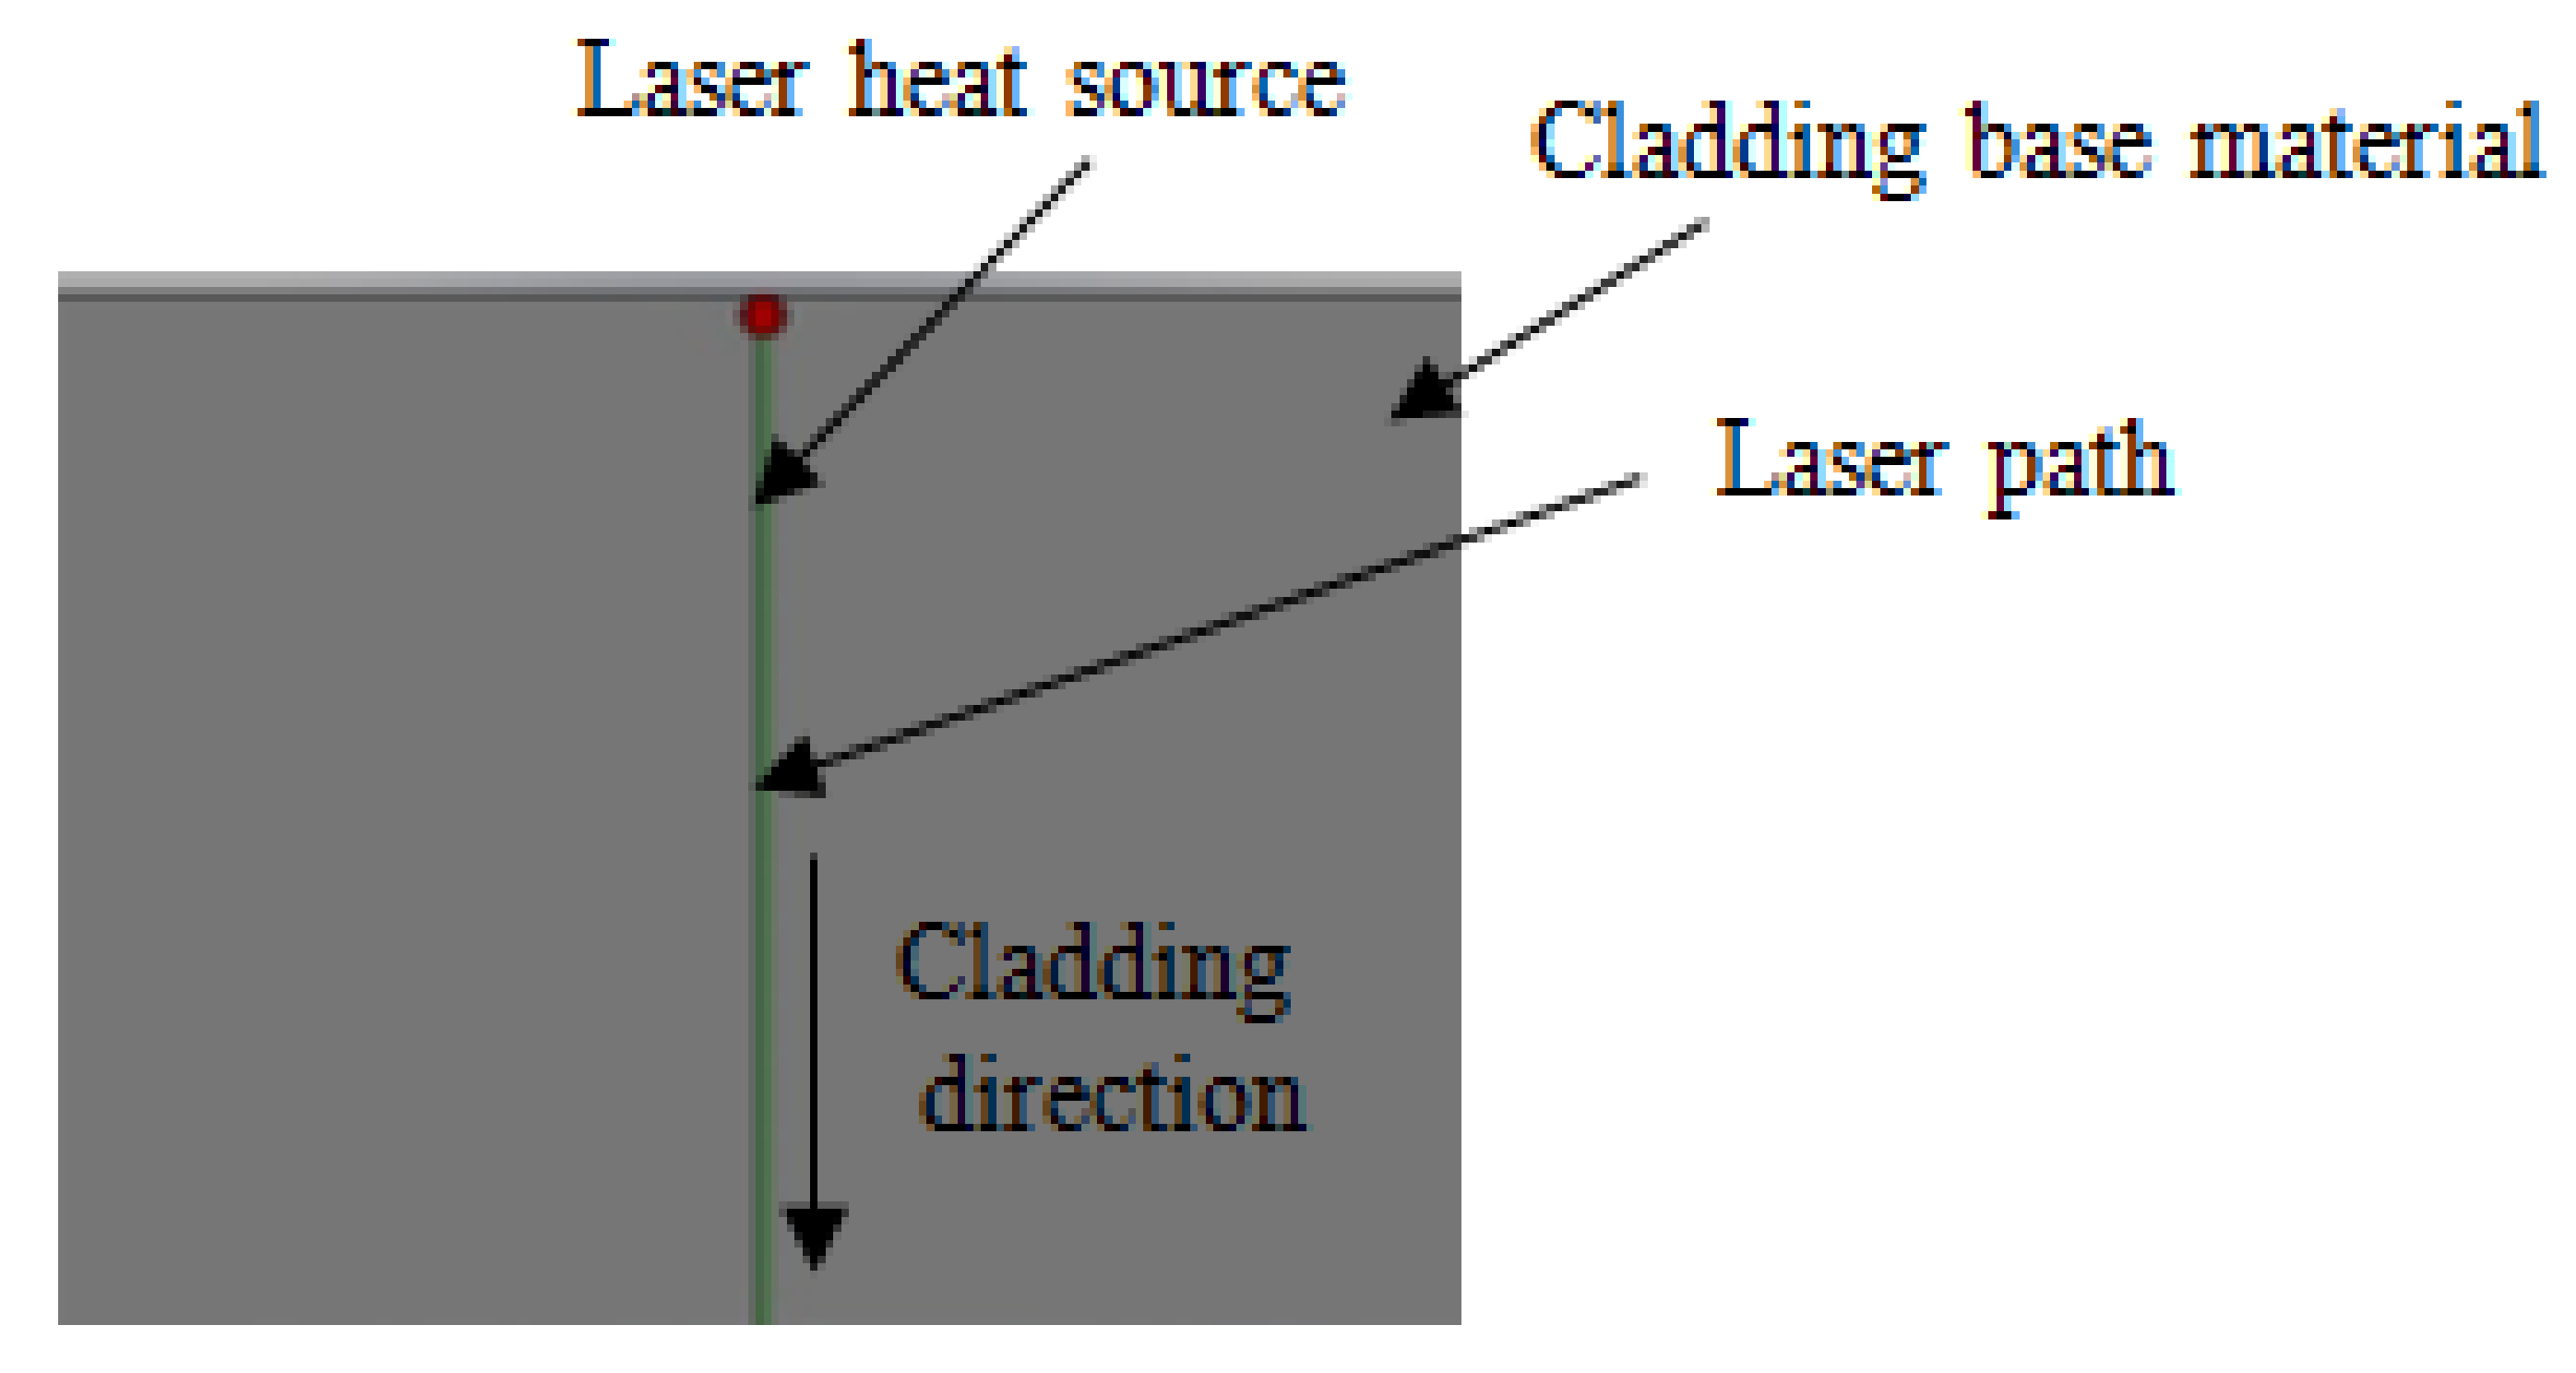
2.1. The Establishment of Finite Element Model

The matrix is H13 steel. The sample is a cuboid with the size of 60 mm × 60 mm × 10 mm. The cladding layer is added to the center of the matrix with a length of 60 mm, its height and width are determined by the powder feed amount and laser diameter. In COMSOL, Figure 1 shows the grid division.
The establishment of heat source model will affect the accuracy of laser cladding numerical simulation results. Both plane heat source and body heat source are suitable for laser cladding. The plane heat source model is generally divided into pulse heat source and continuous heat source. Compared with other heat source models, planar continuous heat source is used more. In this study, the planar continuous heat source model shown in Figure 2 is selected. The distribution function is:
q x , y , t = Q π R 0 2 e 2 x x 0 2 + y v 0 t 2 R 0 2
where q(x, y, t) is the heat flow at the (x, y) position of time t, Q is the laser power, R0 is the laser beam radius, X0 is the position of the laser center in x direction; v0 is the laser cladding velocity.
The matrix used in this experiment is H13 steel, the cladding material is Ni60 alloy powder. The matrix and powder composition are listed in Table 1 and Table 2. According to the chemical composition of the matrix and powder, the corresponding materials from COMSOL database were selected, and their physical properties provided by the software were used.

2.2. Simulation Parameters and Sample Points Distribution

The main parameters of laser cladding include laser power, scanning speed, spot diameter, and powder feeding rate, among which the spot diameter and powder feeding rate mainly affect the height and width of cladding layer, but have little influence on the temperature field distribution. Through simulation calculation, it is found that the temperature field cloud map of different spot diameters and powder feeding rates is basically the same, which is not necessary to be analyzed, but mainly to analyze the influence of laser power and scanning speed on the laser cladding temperature field. The simulation was carried out by changing the laser power and scanning speed. The laser power was 600 W, 800 W, 1000 W, 1200 W, and 1400 W, the scanning speed was 2 mm/s, 3 mm/s, and 4 mm/s.
In order to work out the optimal experimental parameters and analyze the thermal stress cycle of the cladding layer, probes were added to 11 sample points in the cladding layer to record the changes of temperature and thermal stress in real time. Figure 3 shows the locations of the sample points. The cross section is selected in the middle part with stable cladding to ensure the representativeness and accuracy of sample points, avoiding excessive errors as well.

2.3. COMSOL Solution

In this simulation, the temperature field and thermal stress field of the laser cladding material were simulated. A planar continuous heat source shown in Figure 4 was used to simulate the laser heat source; the laser heat source is directly loaded onto the cladding surface, while the laser defocus is adjusted by the heat source radius. The required physical fields module can be added in COMSOL according to the requirements.
The temperature field simulation needs to be calculated in “solid heat transfer” physical field, while the solid heat transfer and thermal stress field simulation physical fields need “solid mechanics” physical fields, so these two physical fields need to be loaded in the simulation.
The cladding layer model was established in advance. In order to prevent the uncladding part from affecting the part under cladding, the “activated” node of COMSOL was used to simulate the laser cladding process during the numerical simulation calculation. Some parts of the field are deactivated before starting, while the deactivated part is multiplied by a small scaling factor to reduce the performance parameters of the material from the overall calculation. When the laser light source moves along the cladding path, the disused part is gradually activated and participates in the whole operation.

3. Results and Discussion

3.1. Formulation of Numerical Simulation Parameters

Figure 5 shows the temperature variation curves of horizontal sample points at different scanning speed, in Figure 5, the temperature in the center of the laser beam is higher than that on both sides. Because the sample points 10 and 11 are distributed symmetrically on both sides of the laser center, the temperature difference is not great at the same laser power and scanning speed. The laser power is proportional to the temperature of the cladding process and the maximum temperature increases with the increase of the laser power. The scanning speed is inversely proportional to the temperature of the cladding process, and the maximum temperature decreases with the increase of the scanning speed.
The three sample points are located on the matrix. If the maximum temperature of the three points reaches 1300 °C, it means that the cladding layer can be completely combined with the matrix. When the laser power is 600 and 800 W, the maximum temperature of the three places is less than 1300 °C, which does not meet the requirements; when the laser power is 1000 W, the maximum temperature can reach 1300 °C only when the scanning speed at B is 2 and 3 mm/s. When the laser power is 1200 W and 1400 W, the maximum temperature can reach the matrix melting temperature of 1300 °C. At this time, only the six schemes corresponding to the laser power of 1200 W and 1400 W meet the requirements.

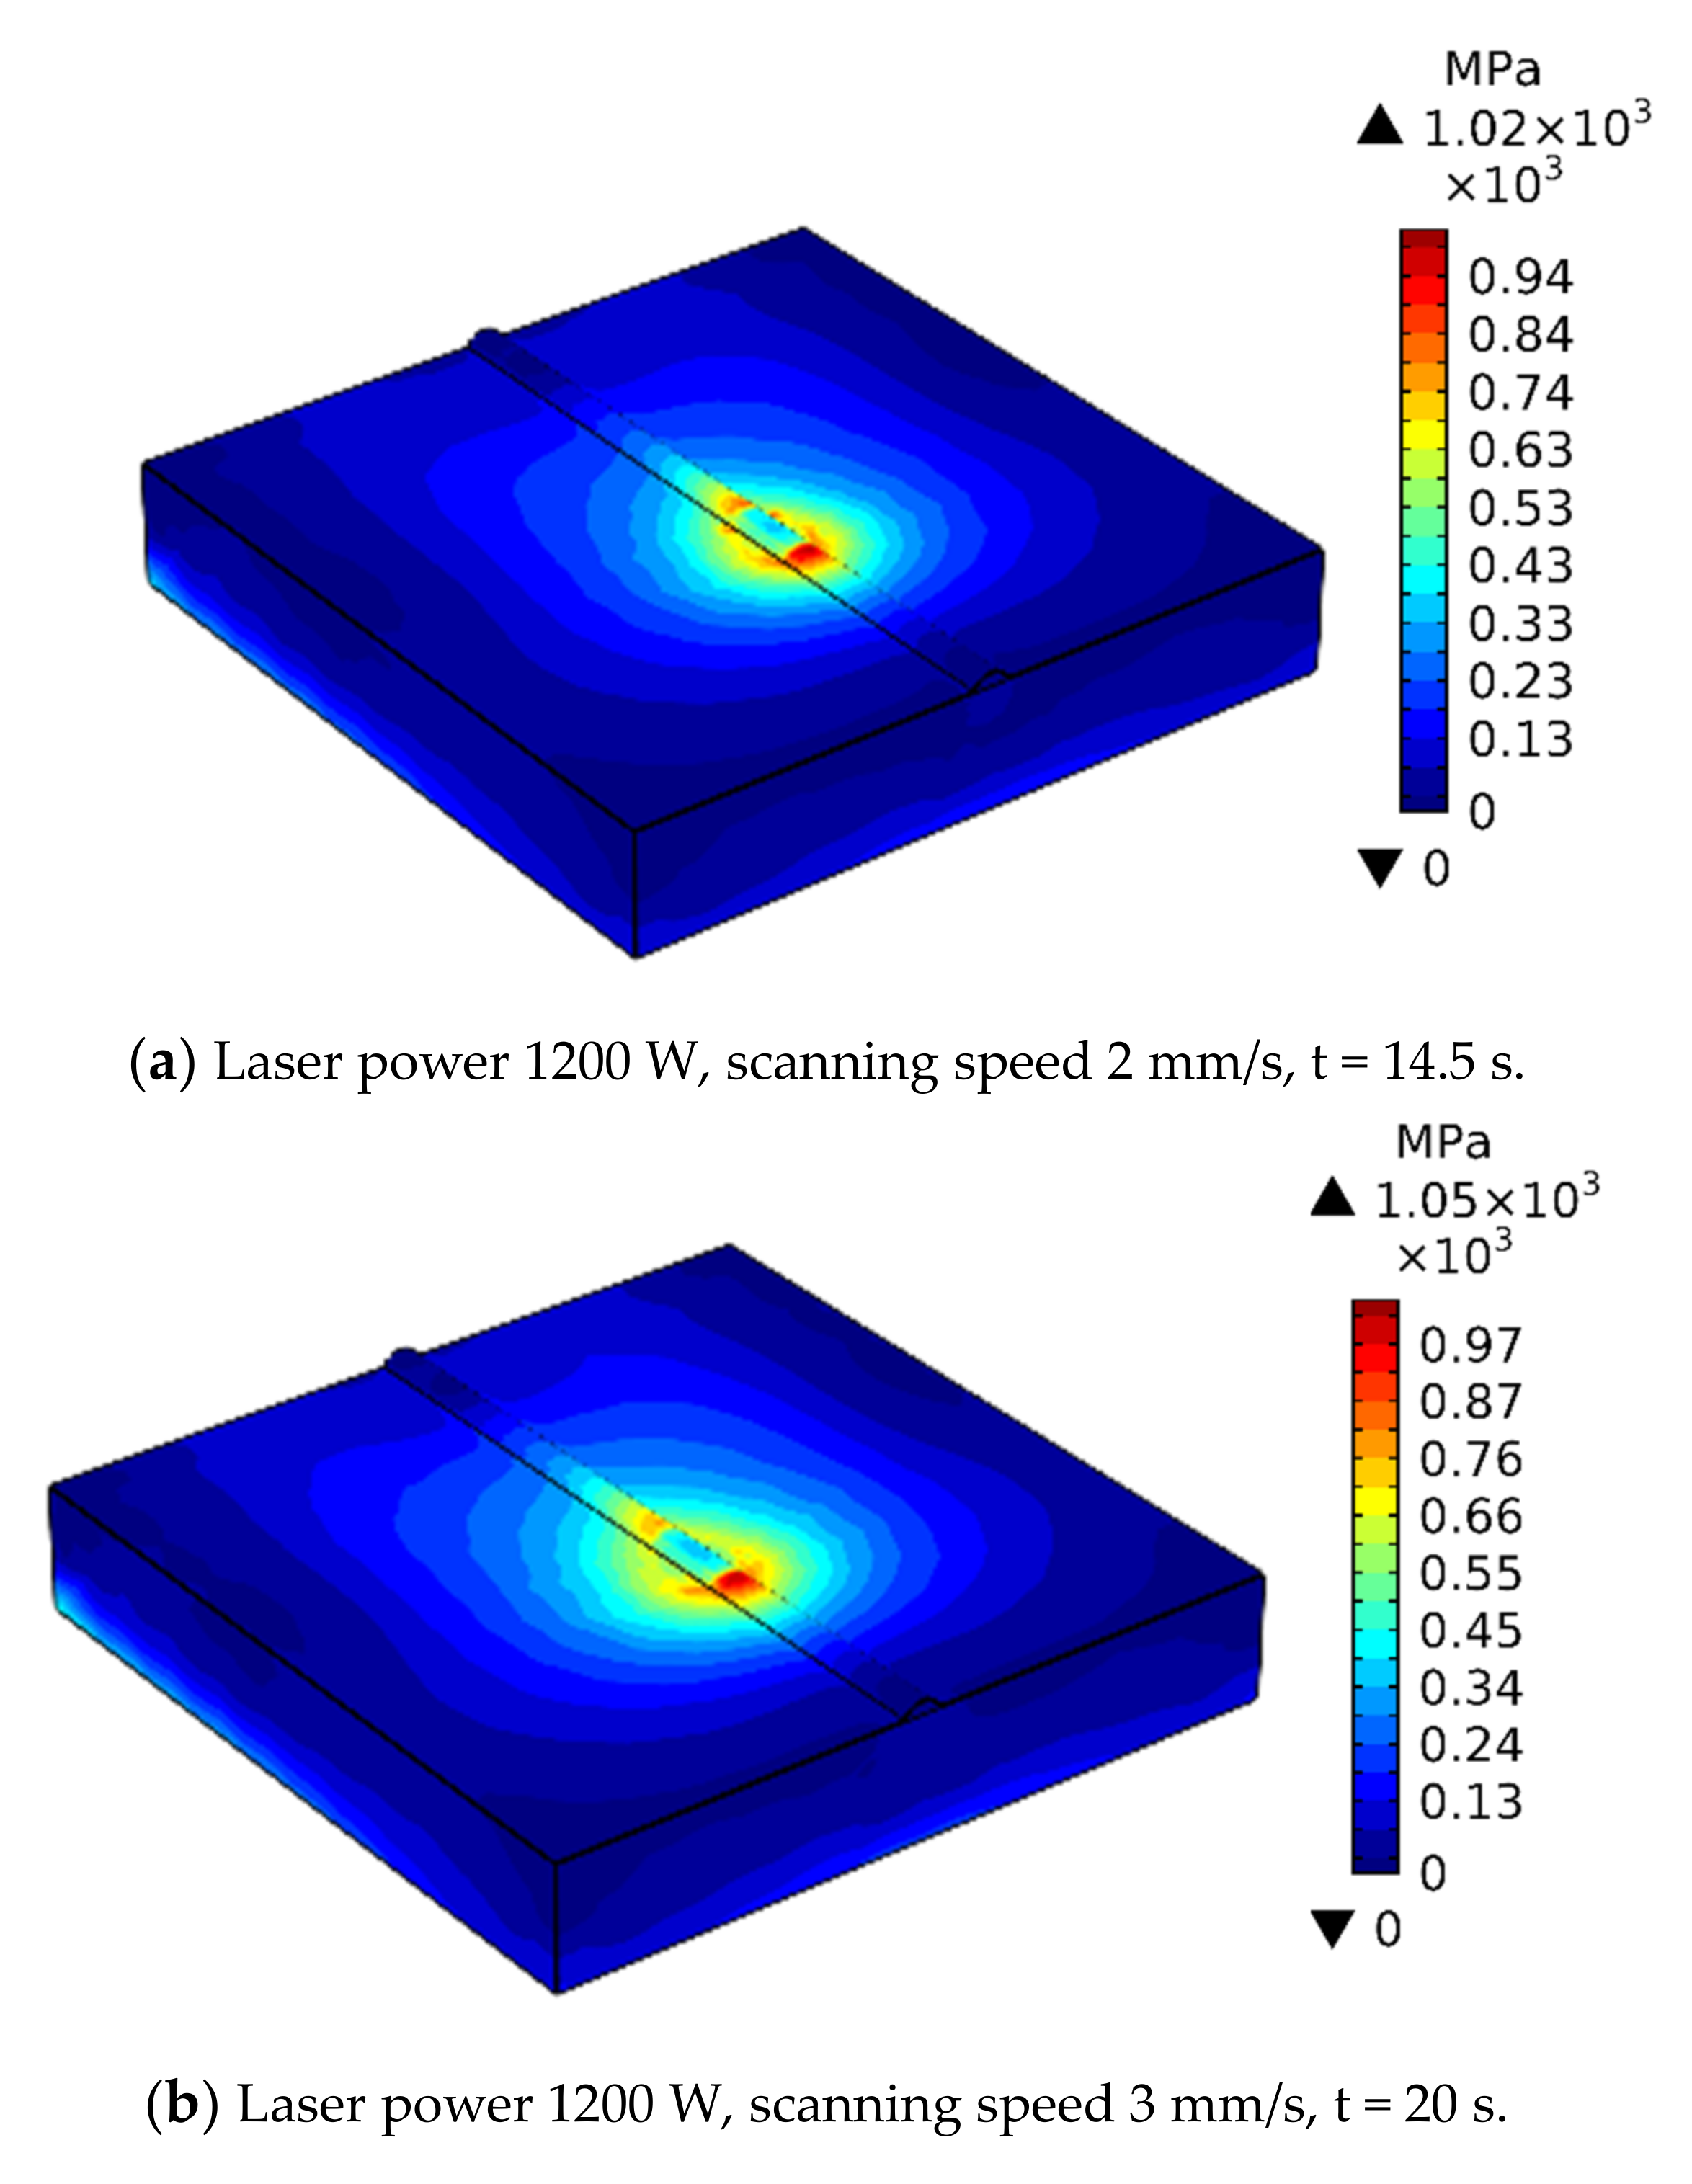
3.2. Stress Field Analysis

Thermal stress is the main reason for cracks in the process of laser cladding, both laser power and scanning speed will affect the thermal stress value of the cladding layer. In order to further determine the numerical simulation parameter scheme, the thermal stress cloud images of the same position under six schemes are obtained through simulation (shown in Figure 6). The maximum thermal stress of the six schemes is listed in Table 3, it can be clearly observed that when the laser power is 1200 W and the scanning speed is 2 mm/s, the corresponding thermal stress value is the minimum. Therefore, this scheme is proposed as a numerical simulation scheme to study the thermal stress cycle.
Taking the optimal simulation scheme, the thermal stress and thermal cycle curves are drawn and analyzed as shown in Figure 7. In the figure, the sample points are heated rapidly by laser at 16 s and reach the maximum temperature at 17.5 s. In the vertical direction, the maximum temperature of all points decreases with the increase of the cladding layer depth. The melting point of powder is 1450 °C, while the highest temperature of sample points 1–5 is higher than the melting point of powder, so the powder can be completely melted. The melting point of the substrate is 1300 °C, while the maximum temperature of sample points 6 and 7 is higher than that of the substrate. The maximum temperature of sample point 8 is 1180 °C. Therefore, the junction between the cladding layer and the substrate is located between sample points 7 and 8, sample points 8~9 are the heat-affected zone of the cladding layer. The spacing between sample points is 0.2 mm, the depth of the molten pool is approximately 0.2~0.4 mm.
Figure 8 shows the von mises thermal stress cycle, thermal stress cycle curves of most sample points have two peaks. When the laser beam is close to the sample point, the thermal expansion of the material around the molten pool exerts pressure on the sample point, so that the first peak of thermal stress occurs at the sample point, at which point the thermal stress of most sample points reaches its maximum value. When the laser beam is located directly above the sample point, the material at the sample point is melted, and the stress at the sample point rapidly decreases to the bottom of the valley. When the laser beam is far away from the sample point, the molten pool starts to solidify as the temperature drops and the stress increases gradually, then the second thermal stress peak appears at the sample point. As the temperature gradually decreases to room temperature, the thermal stress gradually decreases and finally tends to a stable value, namely the residual stress of the sample point.
In the vertical direction, with the increase of the depth cladding layer, the thermal stress at the two peak points gradually decreases, the thermal stress at the bottom of the cladding layer gradually increases, but the residual stress at each sample point tends to be the same value. The maximum thermal stress in the cladding process is 996.67 MPa, and the residual stress tends to be 210 MPa. The von Mises thermal stress curve does not have two distinct peaks when the sample point is outside the molten pool, because the material at the sample point did not melt. The shape of molten pool can be judged according to the thermal stress cycle curve. Sample points 8 and 9 in Figure 8 have no two obvious peak points. The lower side of the junction between the cladding layer and the matrix is located between sample points 7 and 8, which is consistent with the judgment of the thermal cycle curve.
Based on the von Mises thermal stress cycle, it was found that there were unstable alternating thermal stresses at each sample point. The characteristics of unstable alternating thermal stress are the unstable alternating thermal stress starts and ends at the same time, starting from 18.5 s and ending in 20 s, the unstable alternating thermal stress at sample points 1–4 will occur twice intensively, it is composed of multiple unstable alternating thermal stresses, there is a stable increase of thermal stress between the two times. With the increase of the cladding layer depth, the two unstable alternating thermal stresses gradually approach and connect together at sample point 5. As the cladding layer depth increases, the variation amplitude of alternating thermal stress increases first and then decreases, the maximum stress amplitude is 45.5 mpa.

3.3. Residual Stress Analysis

The analysis results of temperature and stress field are applied to the cladding layer as loads, and a line constraint is imposed on both sides of the matrix surface, the stress distribution of the workpiece in all directions after cooling for 3.5 h was analyzed, the stress is also the residual stress of the workpiece.
In order to study the residual stress distribution at different positions of the formed part, the middle position of the cladding layer was selected and cut along the plane. The junction between the cladding layer and the matrix along the axis is selected as the path1, and the path from the apex of the cladding layer to the vertical direction of the matrix along the axis is selected as the path2 to study the distribution of residual stress at different positions, as is shown in Figure 9.
Figure 10 shows the residual stress distribution of the two paths. Figure 10a shows that in the horizontal direction of path 1, the residual stress is symmetrically distributed with a single track as the central axis. In X direction, the residual stress increases sharply when it is close to the boundary area of the cladding layer ( 0.7   mm y 1.4   mm ), and the maximum axial tensile stress is about 414 MPa. Because heat dissipation is relatively faster at the boundary between the cladding layer and the substrate, and the temperature gradient increases, thereby increasing the stress value. In the cladding layer, the closer to the center of the light spot, the smaller the temperature gradient, and the lower the stress value relative to the boundary of the cladding layer. Compressive stress is present in the part far away from the cladding layer, which is due to the high energy input, large temperature gradient, fast cooling rate, and difference in material properties during processing. After cooling, the substrate will hinder the shrinkage of the nickel-based coating, causing the cladding layer to bear tensile stress. Because of the limitation of the single-pass cladding width, the deformation resistance in the direction is small, and the stress value is also relatively small. However, the maximum residual stress in the y direction is concentrated on both sides of the cladding layer close to the substrate, cracks in the cladding layer often appear in this area. The tensile stress in Z direction is very small and can be ignored.
Figure 10b shows that there is a high tensile stress at the interface between the deposited layer and the substrate plane along the vertical direction of Path 2 due to the difference in thermophysical properties between substrate and nickel-based coating, and the maximum tensile stress at z = 3 mm is 432 Mpa. In x direction, as the depth continues to increase, the energy delivered by the laser becomes smaller and smaller, and the temperature gradient decreases, resulting in a gradual decrease in tensile stress. In y direction, as the depth of the cladding layer increases, the tensile stress gradually decreases and transforms into compressive stress in the middle of the substrate. But the compressive stress is transformed into tensile stress again at the bottom of the substrate z = 6 mm, because the local temperature is relatively high during the processing, and the temperature gradient of the entire cladding layer and its edges is large relative to the substrate, the shrinkage rate of the substrate is smaller than that of the entire single track. When the cladding layer is cooled and solidified, the substrates on both sides and the bottom of the cladding layer hinder the shrinkage of the cladding layer, so the single-pass cladding layer bears the tensile stress from the surrounding matrix. Because the cladding layer runs through the entire surface of the substrate along the axis, the overall deformation in the axial direction is an arc with a low center and high sides. Because the substrate is thicker, when the deposited layer is cooled and solidified, the compressive stress in the middle of the substrate and the tensile stress of the cladding layer balance each other according to the force balance principle, while the substrates on both sides move closer to the middle of the cladding layer, the bottom of the substrate bears the tensile stress. The residual stress value in z direction is relatively small, showing a small tensile stress in the upper position of the cladding layer and the substrate, it gradually shows a slight compressive stress as the depth increases.

3.4. Experimental Verification

In order to verify the accuracy of the simulation model, the simulation scheme proposed above was taken for laser cladding experiment. In Figure 11, the temperatures of sample point 6 and 7 are respectively 1580 °C and 1460 °C, which are higher than the melting point of matrix 1300 °C, and the temperature of sample point 8 is 1180 °C. Therefore, according to the simulation calculation, it can be judged that the junction of cladding layer and matrix is located between sample points 7 and 8. After measurement, the depth, width and height of the cladding layer are 0.28 mm, 3.0 mm, and 1.0 mm respectively. The height and width of the cladding layer set by the finite element model are 1.0 mm and 3 mm, the depth of the molten pool obtained by the simulation calculation is 0.2~0.4 mm. It can be seen that the actual size of the cladding layer is basically consistent with the simulation results. The cross section morphology of the cladding layer is basically the same by comparing the cross section screenshot with the simulation results, which verifies that the simulation model is correct.
Figure 12 shows that obvious cracks appear on both sides of the cladding layer close to the substrate, which also has the maximum residual stress according to the simulation results. But the cracks are very small, because the load parameters of the residual stress simulation are optimized. The cracks can only be improved, but cannot be absolutely eliminated.

4. Conclusions

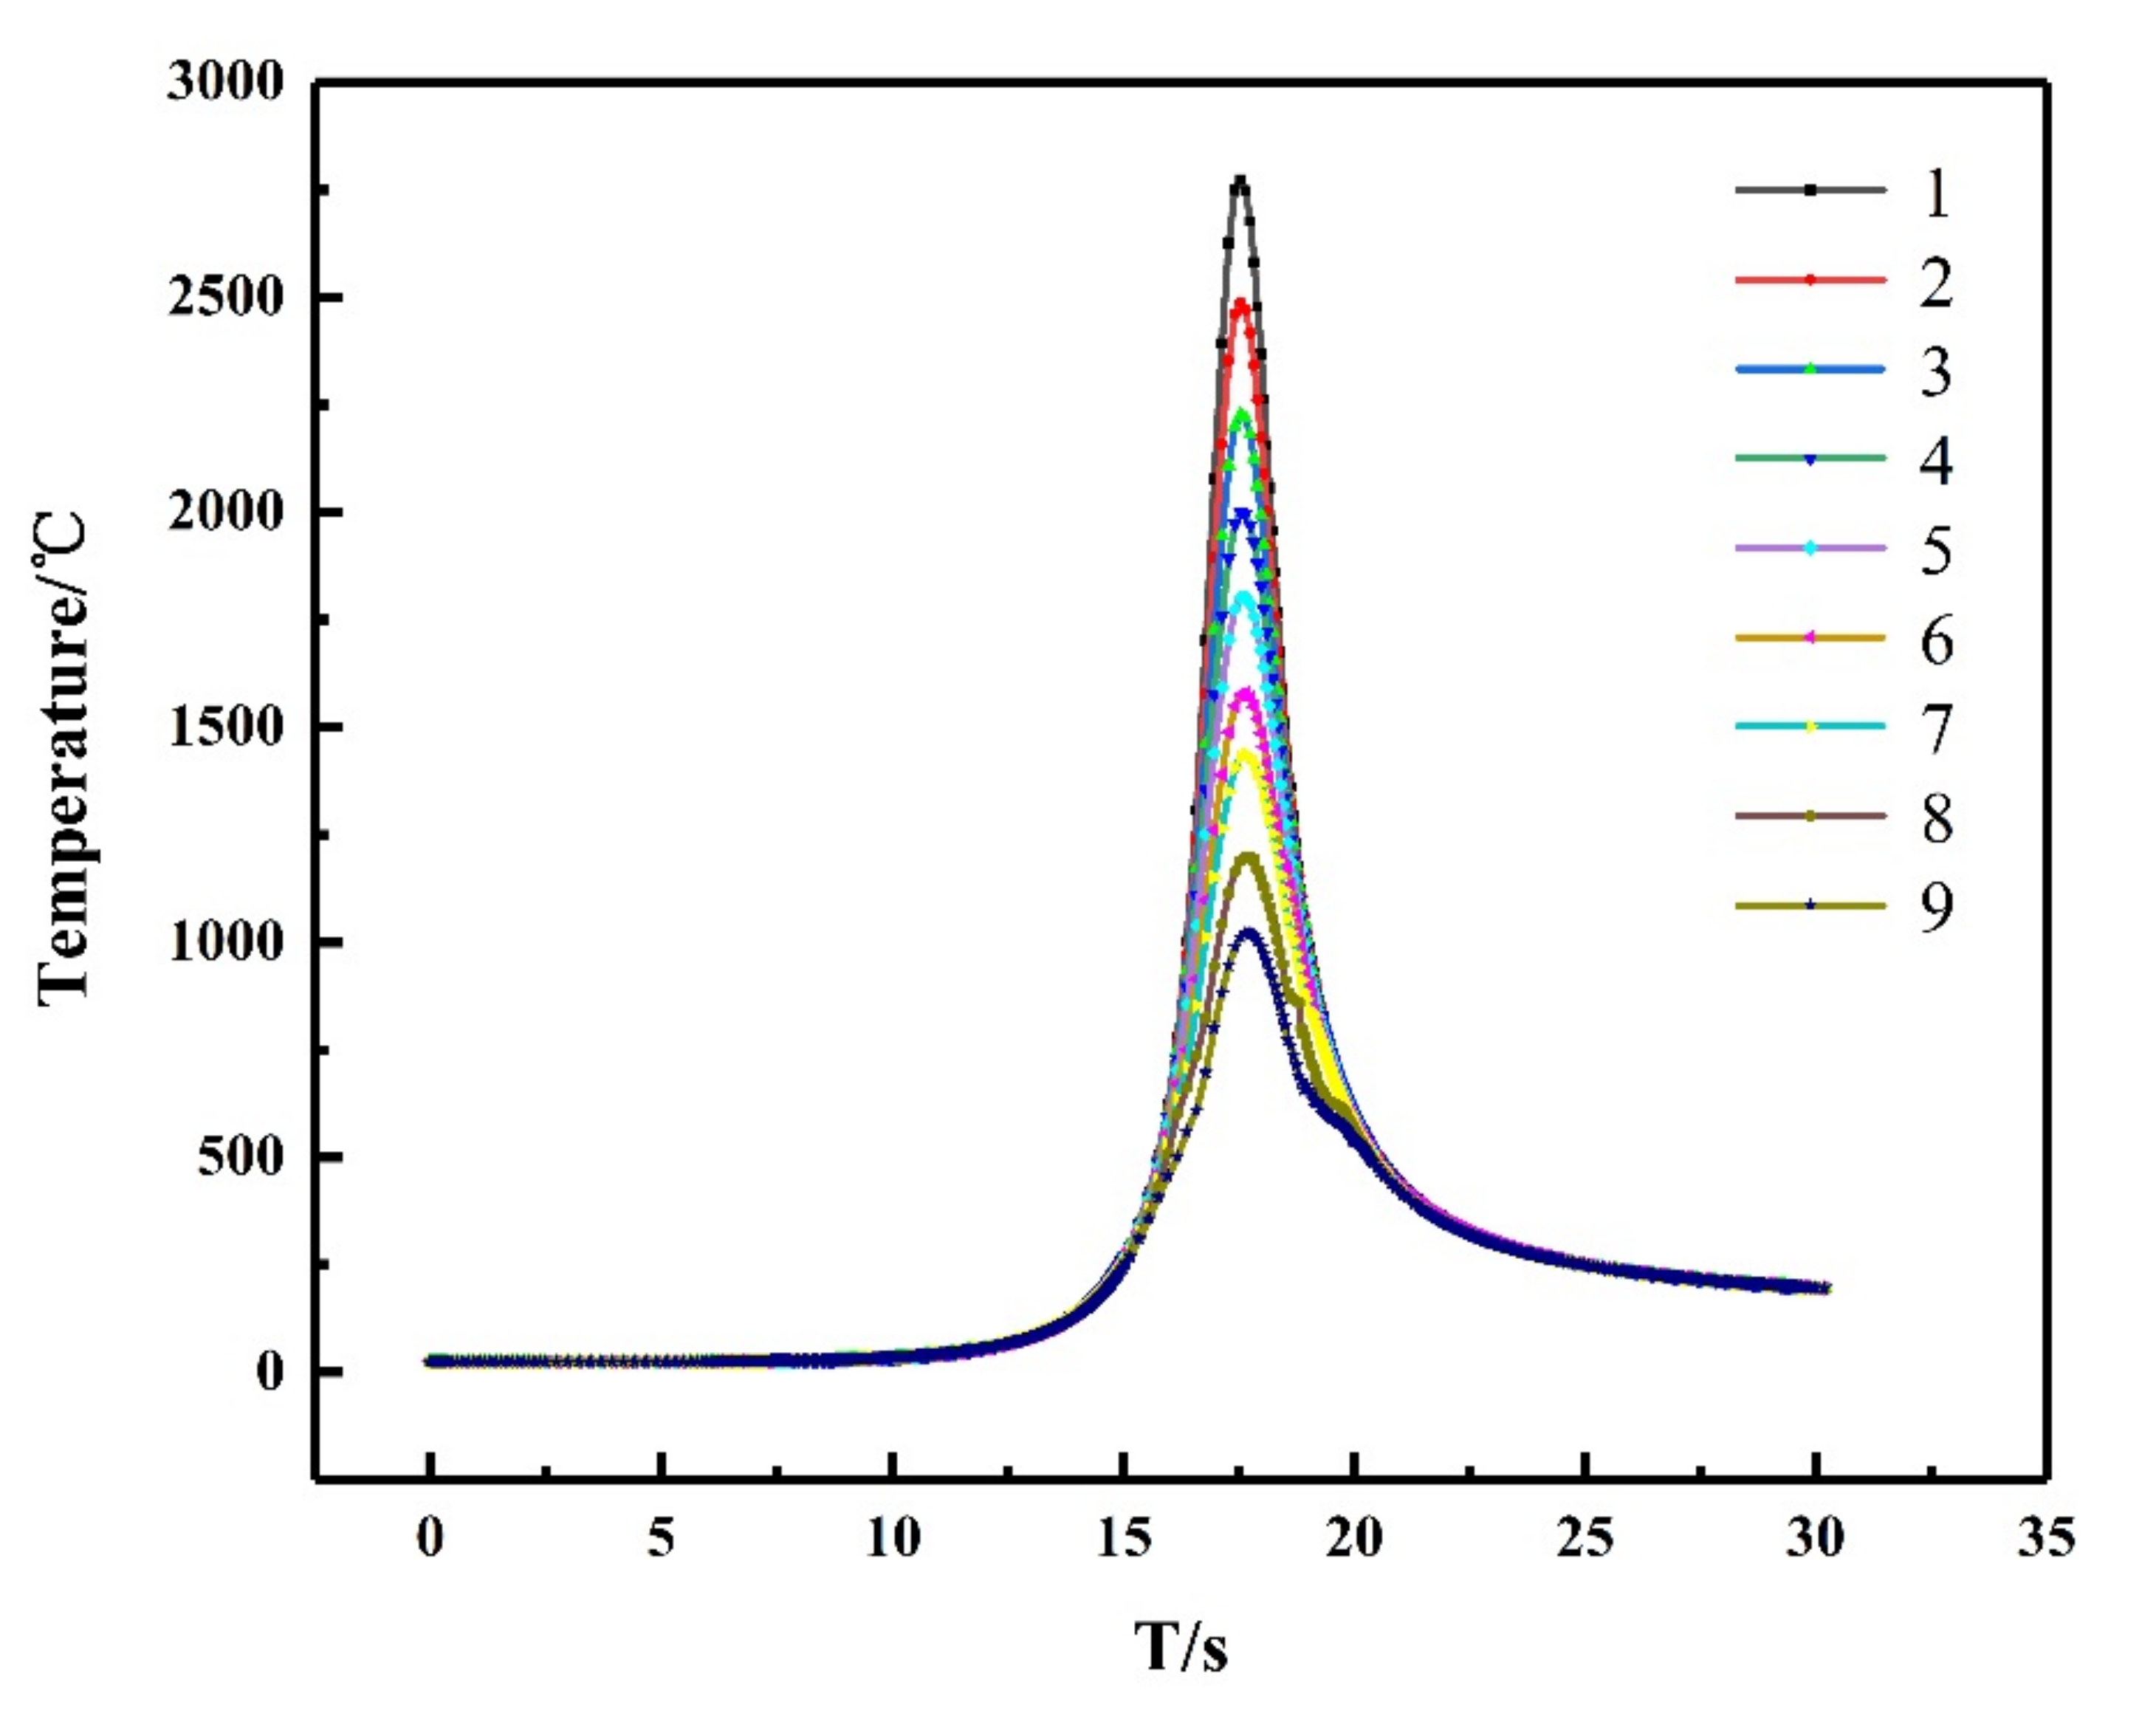
  • The numerical simulation of Ni-base alloy powder laser cladding on H13 steel was carried out. The optimal process parameters are as follows: laser power is 1200 W, scanning speed is 2 mm/s. Under these parameters, the maximum temperature of laser cladding is about 2748.1 °C, the maximum heating rate is 1632.1 °C/s, the maximum cooling rate is 699.5 °C/s, the depth of molten pool is 0.28 mm. Under these parameters, the cross section of the cladding layer obtained by laser cladding experiment is basically consistent with the simulation results, which proves the correctness of the simulation model.
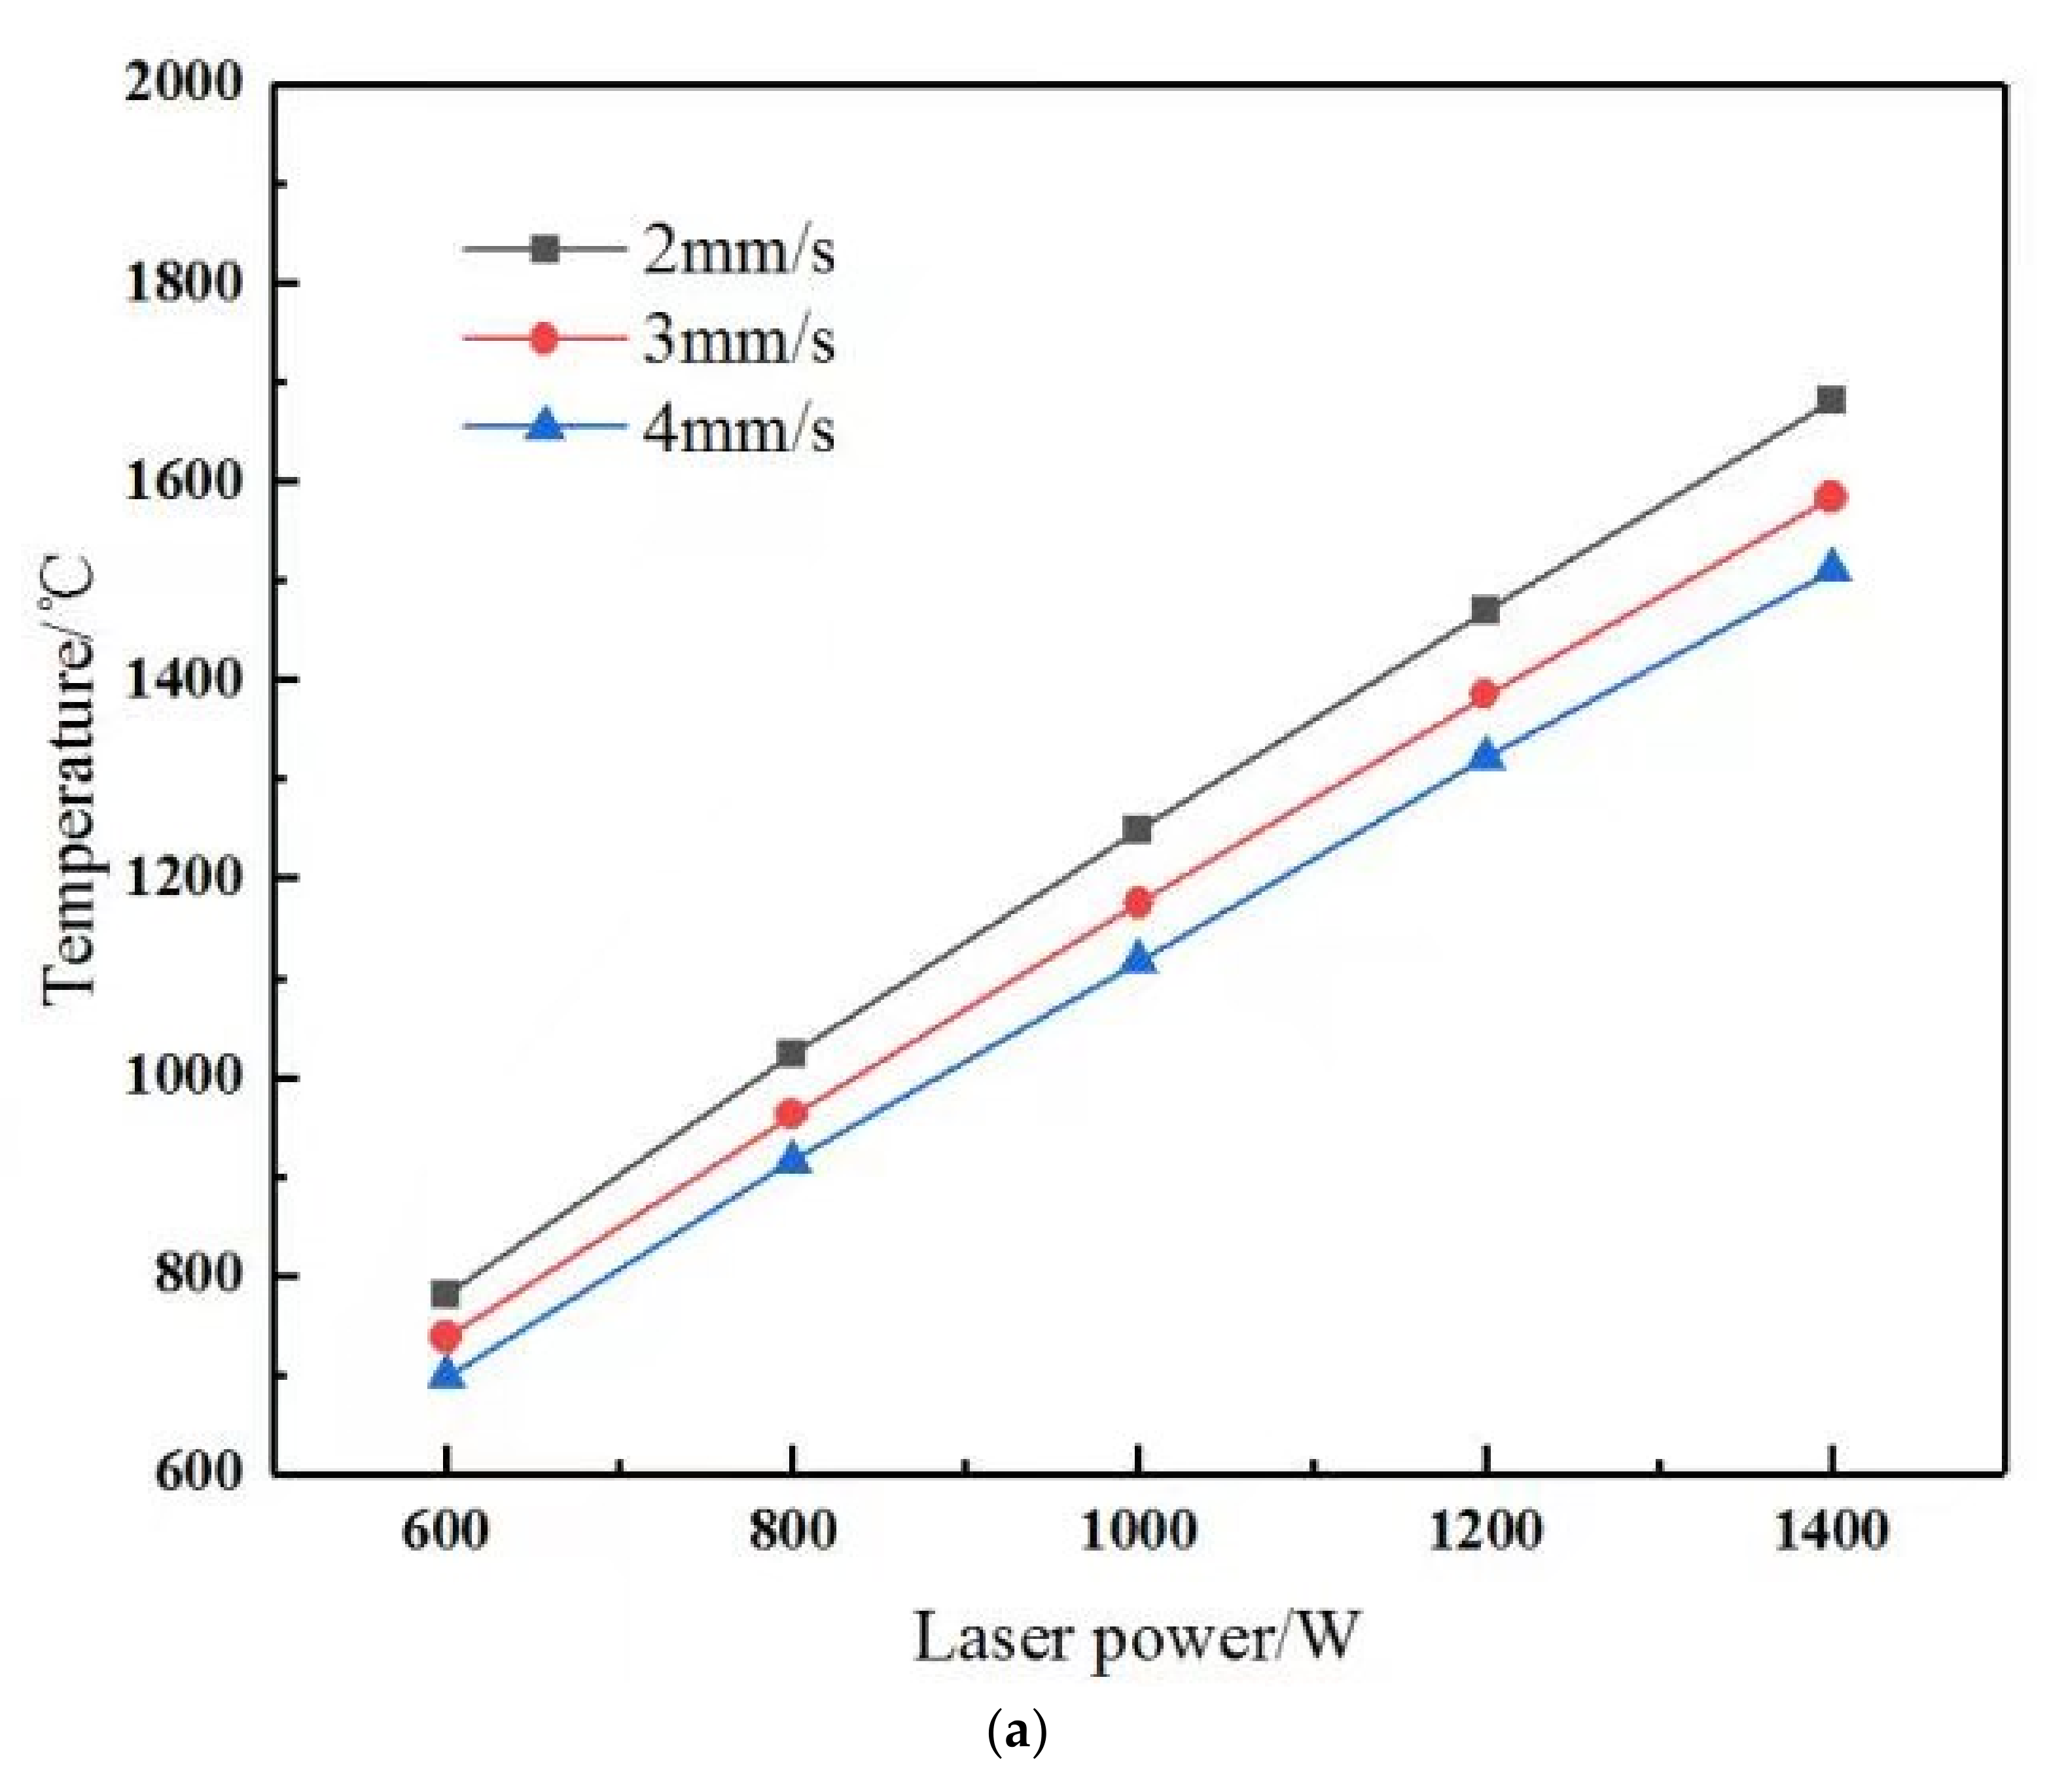
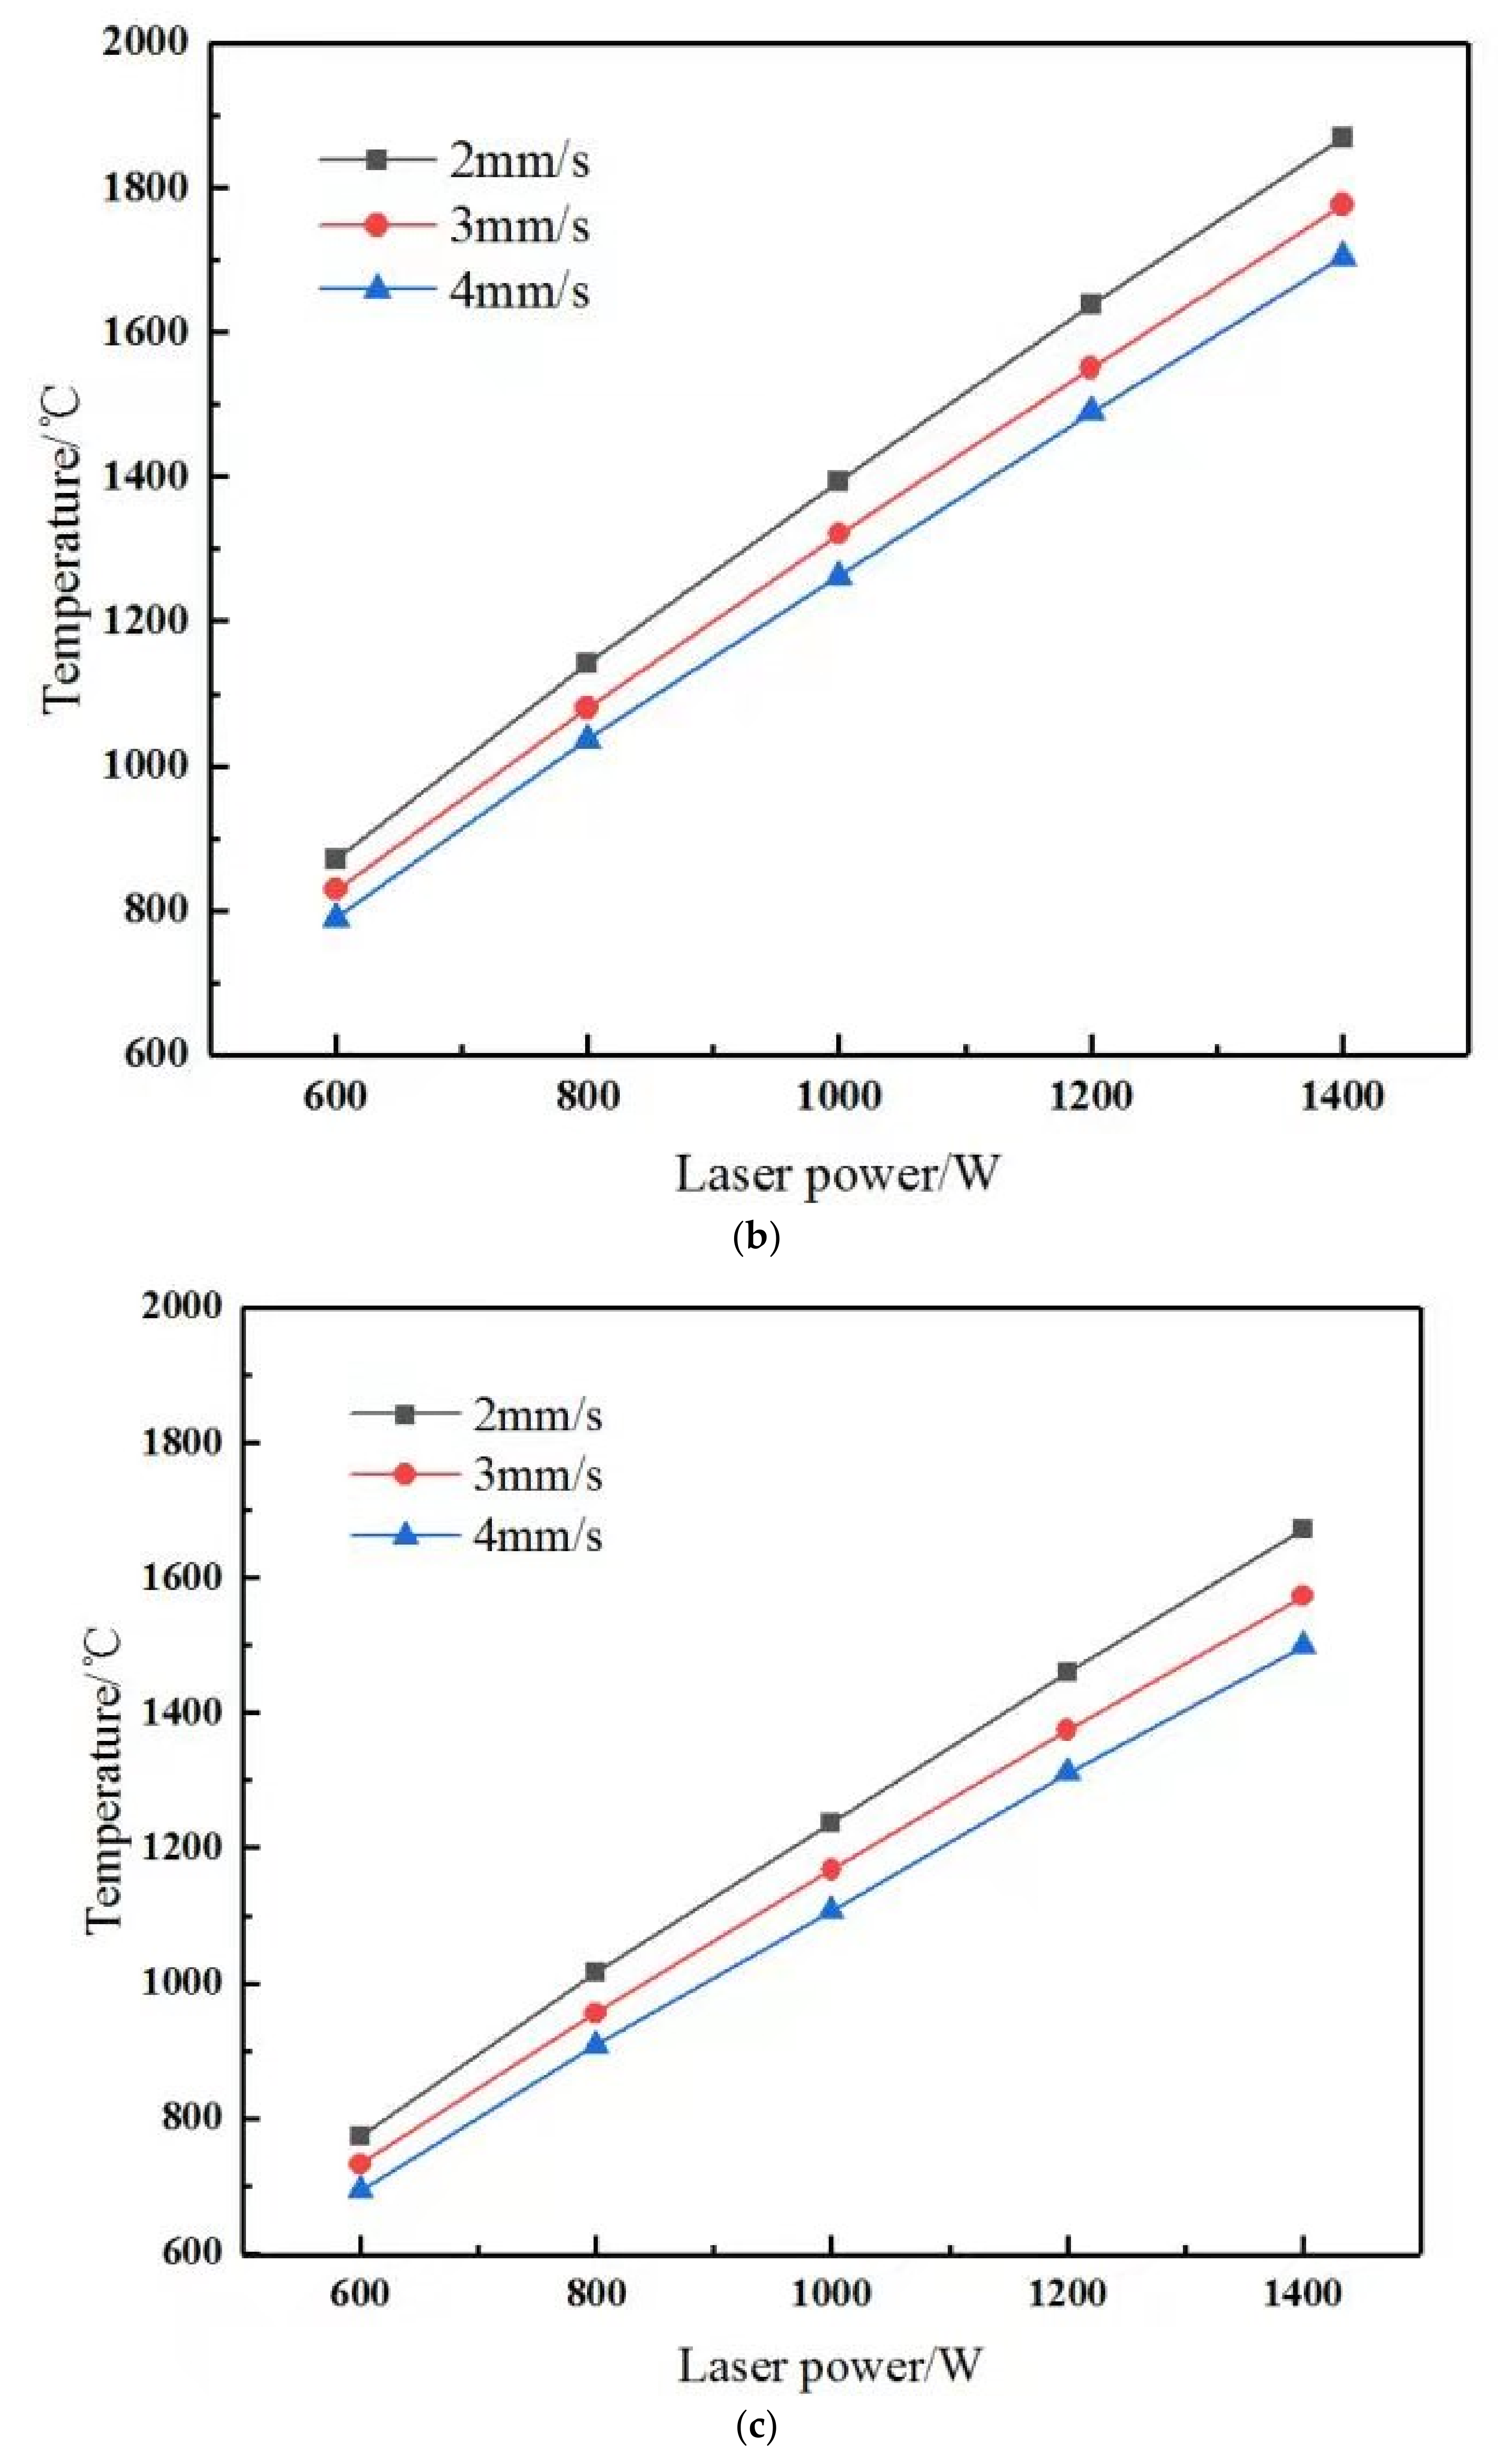
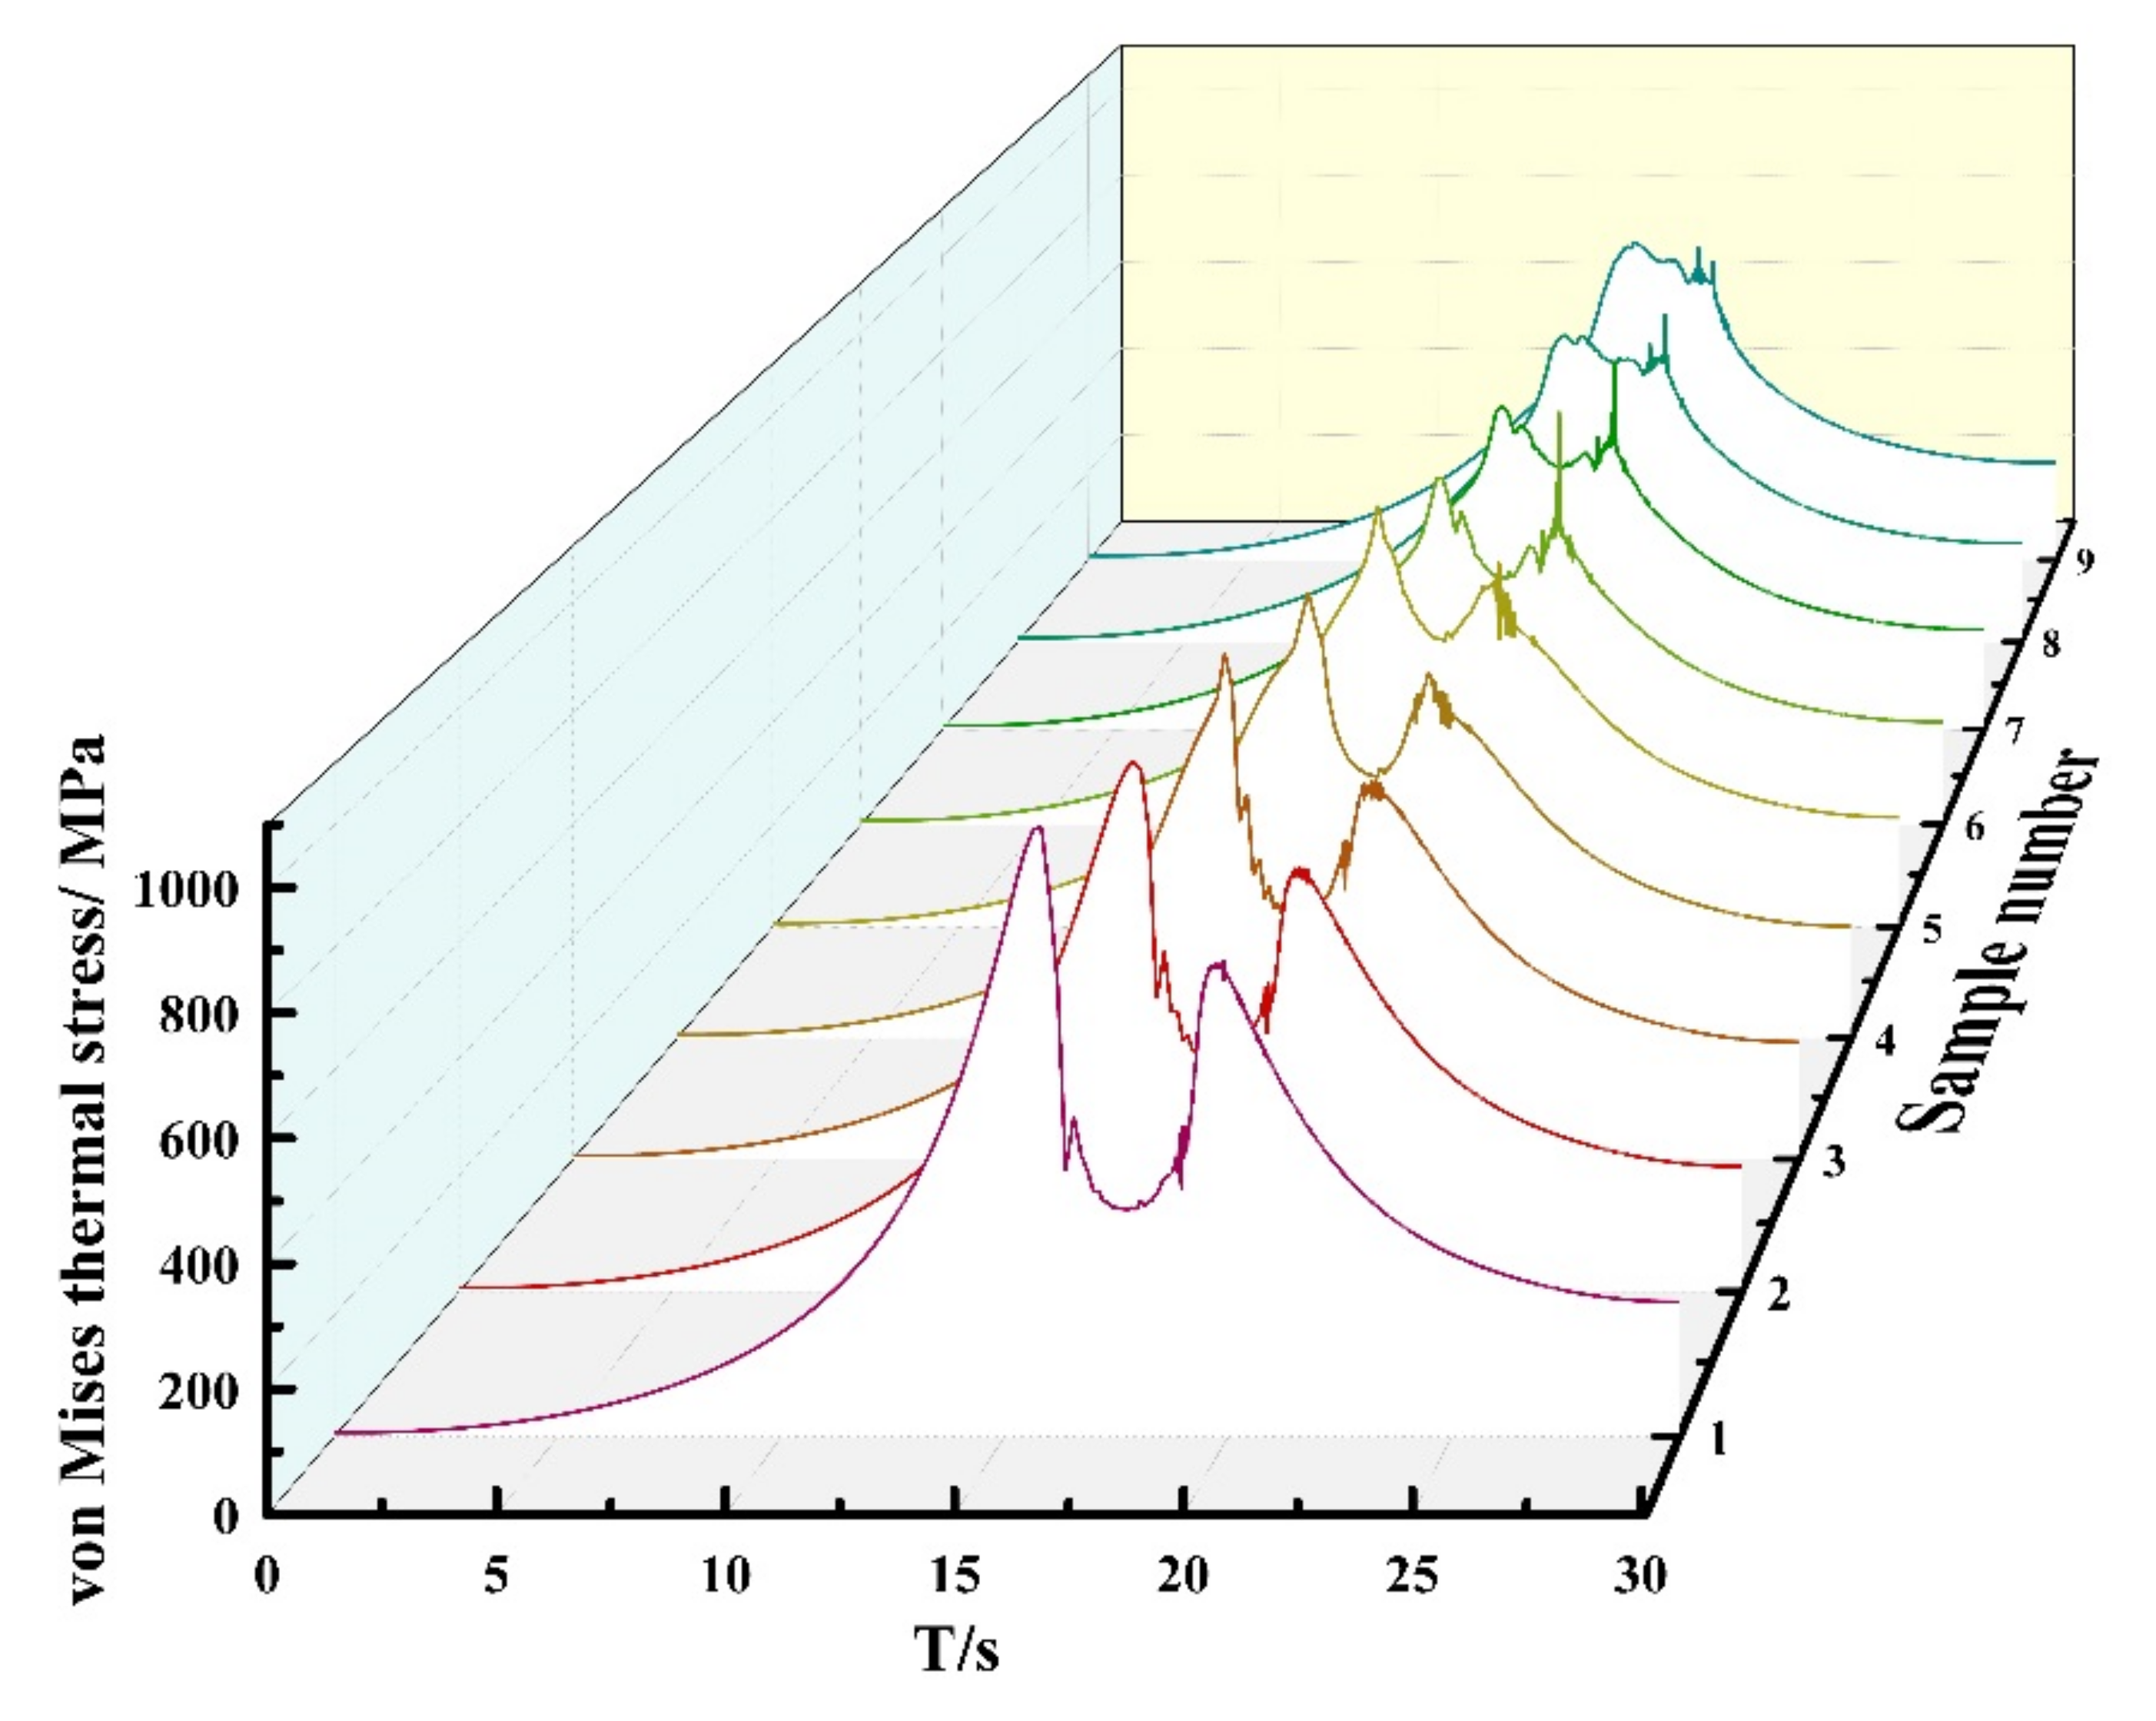
  • The temperature field and thermal stress field of the cladding layer were analyzed. The laser center temperature of the cladding layer at the same horizontal plane is greater than that on both sides. The temperature difference between the two sides of the laser center is not so great. The laser power is proportional to the temperature of cladding, the maximum temperature increases with the laser power. The scanning speed is inversely proportional to the maximum temperature during cladding, and the maximum temperature decreases with the increase of scanning speed. The laser power and scanning speed are proportional to the thermal stress at the sample point and the thermal stress increases with the increase of laser power and scanning speed. For the von Mises thermal stress cycle curve, the thermal stress curve of most samples has two peaks. This is mainly due to the solid-liquid phase transition process in laser cladding, but when the sample point is outside the molten pool, because the material at the sample point is not melted, then the corresponding peak value of the von Mises thermal stress curve is not obvious. Based on this feature, the depth of the molten pool can be predicted.
  • The residual stress of the cladding layer was simulated according to the analysis results of the temperature and stress field. The cladding layer mainly bears residual tensile stress, because its cooling shrinkage is inhibited by the matrix. On the cross section of the cladding layer, the maximum tensile stress appears on both sides of the cladding layer close to the substrate, where cracks always appear.
  • The cladding experiment investigates that the simulation results of von Mises thermal stress cycle and residual stress are correct.

Author Contributions

Conceptualization, F.Y.; methodology, F.Y.; software, F.Y.; validation, L.F.; formal analysis, F.Y.; investigation, F.Y.; data curation, F.Y.; writing—original draft preparation, F.Y.; writing—review and editing, F.Y.; visualization, F.Y., L.F. All authors have read and agreed to the published version of the manuscript.

Funding

This research received no external funding.

Institutional Review Board Statement

Not applicable.

Informed Consent Statement

Not applicable.

Conflicts of Interest

The authors declare no conflict of interest.

References

  1. Cao, J.; Lu, H.F.; Lu, J.Z. Effects of Tungsten Carbide Particles on Microstructure and Wear Resistance of Hot-Working Die Prepared via Laser Cladding. Chin. J. Lasers 2019, 46, 702001. [Google Scholar]
  2. Cui, C.; Wu, M.P.; Xia, S.H. Effect of Heat Treatment on Properties of Laser Cladding Cobalt-Based Coating on 42CrMo Steel Surface. Chin. J. Lasers 2020, 47, 602011. [Google Scholar]
  3. Li, G.S.; Li, J.H.; Feng, W.L. Effects of specific powder and specific energy on the characteristics of NiWC25 by laser cladding. Surf. Technol. 2019, 48, 253–258. [Google Scholar]
  4. Li, J.H.; Li, G.S.; Zhang, D.Q. Study on microhardness of Laser cladding NJ-4 powder. Surf. Technol. 2018, 47, 77–83. [Google Scholar]
  5. Chen, H.; Lu, Y.; Sun, Y.; Wei, Y.; Wang, X.; Liu, D. Coarse TiC particles reinforced H13 steel matrix composites produced by laser cladding. Surf. Coat. Technol. 2020, 395, 125867. [Google Scholar] [CrossRef]
  6. Zhao, S.J.; Qi, W.J.; Hang, Y.F. Numerical simulation study on thermal cycle characteristics of temperature field TC4 surface laser cladding Ni60 base coating. Surf. Technol. 2020, 49, 301–308. [Google Scholar]
  7. Wang, X.; Yu, Y.G.; Hang, E.Z. Research status of laser cladding temperature field simulation. Therm. Spray Technol. 2019, 11, 10–15. [Google Scholar]
  8. Muvvala, G.; Mullick, S.; Nath, A.K. Development of process maps based on molten pool thermal history during laser cladding of Inconel 718/TiC metal matrix composite coatings. Surf. Coat. Technol. 2020, 399, 126100. [Google Scholar] [CrossRef]
  9. Kong, F.; Kovacevic, R. Modeling of heat transfer and fluid flow in the laser multilayered cladding process. Metall. Mater. Trans. B 2010, 41, 1310–1320. [Google Scholar] [CrossRef]
  10. Liu, H.; Yu, G.; He, X.L. Three-dimensional numerical simulation of transient temperature field and coating geometry in powder feeding laser cladding. Chin. J. Lasers 2013, 40, 1203007. [Google Scholar] [CrossRef]
  11. Xu, W.F.; Ma, J.; Luo, Y.X. Microstructure and high-temperature mechanical properties of laser beam welded TC4/TA15 dissimilar titanium alloy joints. Trans. Nonferrous Met. Soc. China 2020, 30, 160–170. [Google Scholar] [CrossRef]
  12. Song, B.; Yu, T.; Jiang, X.; Xi, W.; Lin, X. Effect of laser power on molten pool evolution and convection. Numer. Heat Transf. Part A Appl. 2020, 78, 1777795. [Google Scholar] [CrossRef]
  13. He, S.Y.; Liu, X.D.; Zhao, S.Z. Microstructure and Wear Resistance of Carbon Fibers Reinforced 316L Stainless Steel Prepared Using Laser Cladding. Chin. J. Lasers 2020, 47, 0502010. [Google Scholar]
  14. Song, P.F.; Jiang, F.L.; Wang, Y.L. Advances in the preparation of high entropy alloy coatings by laser cladding. Surf. Technol. 2020, 1, 18. [Google Scholar]
  15. Deirmina, F.; Peghini, N. Heat treatment and properties of a hot work tool steel fabricated by additive manufacturing. Mater. Sci. Eng. A 2019, 753, 109–121. [Google Scholar] [CrossRef]
  16. Zhu, J.; Zhang, Z. Improving strength and ductility of H13 die steel by pre-tempering treatment and its mechanism. Mater. Sci. Eng. A 2019, 752, 109–114. [Google Scholar] [CrossRef]
  17. Wang, Y.; Song, K. Microstructure evolution mechanism near the fracture lip of 4Cr5MoSiV1 steel during deforming at 580 °C. J. Mater. Res. Technol. 2019, 8, 6390–6395. [Google Scholar] [CrossRef]
  18. Krylova, S.E.; Romashkov, E.V. Special aspects of thermal treatment of steel for hot forming dies production. Mater. Today Proc. 2019, 19, 2540–2544. [Google Scholar] [CrossRef]
  19. Kar, A.; Mazumder, J. One-dimensional diffusion model for extended solid solution in laser cladding. J. Appl. Phys. 1987, 61, 2645–2655. [Google Scholar] [CrossRef]
  20. Hoadley AF, A.; Rappaz, M. A thermal model of laser cladding by powder injection. Metall. Trans. B 1992, 23, 631–642. [Google Scholar] [CrossRef]
  21. Han, L.; Phatak, K.M.; Liou, F.W. Modeling of laser cladding with powder injection. Metall. Mater. Trans. B 2004, 35, 1139–1150. [Google Scholar] [CrossRef]
  22. Cho, C.D.; Zhao, G.P.; Kwak, S.Y. Computational mechanics of laser cladding process. J. Mater. Process. Technol. 2004, 153–154, 494–500. [Google Scholar] [CrossRef]
  23. Jendrzejewski, R.; Sliwinski, G.; Krawczuk, M. Temperature and stress fields induced during laser cladding. Comput. Struct. 2004, 82, 653–658. [Google Scholar] [CrossRef]
  24. Toyserkani, E.; Khajepour, A.; Corbin, S. 3-D finite element modeling of laser cladding by powder injection: Effects of laser pulse shaping on the process. Opt. Lasers Eng. 2004, 41, 849–867. [Google Scholar] [CrossRef]
  25. He, X.; Mazumder, J. Transport phenomena during direct metal deposition. J. Appl. Phys. 2007, 101, 53113. [Google Scholar] [CrossRef]
  26. He, X.; Yu, G.; Mazumder, J. Temperature and composition profile during double-track laser cladding of H13 tool steel. J. Phys. D Appl. Phys. 2010, 43, 015502. [Google Scholar] [CrossRef]
  27. Farahmand, P.; Kovacevic, R. An experimental-numerical investigation of heat distribution and stress field in single-and multi-track laser cladding by a high-power direct diode laser. Opt. Laser Technol. 2014, 63, 154–168. [Google Scholar] [CrossRef]
Figure 1. Mesh division of finite element model.
Coatings 11 00203 g001
Figure 2. Planar continuous heat source model.
Coatings 11 00203 g002
Figure 3. Sample points locations and number.
Coatings 11 00203 g003
Figure 4. Laser heat source loading model.
Coatings 11 00203 g004
Figure 5. Maximum temperature variation with power of horizontal sample points at different scanning speed. (a) Sample point 10, (b) Sample point 6, (c) Sample point 11.
Coatings 11 00203 g005aCoatings 11 00203 g005b
Figure 6. Von Mises thermal stress distribution at the same location under six schemes.
Coatings 11 00203 g006aCoatings 11 00203 g006b
Figure 7. Thermal cycle curve.
Coatings 11 00203 g007
Figure 8. Von Mises thermal stress cycle.
Coatings 11 00203 g008
Figure 9. Path location diagram.
Coatings 11 00203 g009
Figure 10. Residual stress distribution in two paths. (a) Residual stress distribution in path 1. (b) Residual stress distribution in path 2.
Coatings 11 00203 g010
Figure 11. Experimental and simulation results.
Coatings 11 00203 g011
Figure 12. Crack location of cladding layer cross section.
Coatings 11 00203 g012
Table 1. Chemical composition of H13 steel.
ElementCSiMnCrMoVPSFe
Percentage content/wt%0.380.920.2851.20.950.020.03Bal.
Table 2. Chemical composition of Ni60 alloy powder.
ElementCCrSiFeBNi
Percentage content/wt%0.8164.015.0 Ma3.2Bal.
Table 3. Maximum thermal stress of von Mises.
Laser Power/W12001400
Scanning speed/(mm·s−1)234234
Maximum thermal stress of von Mises/MPa102010501070113011501170
Publisher’s Note: MDPI stays neutral with regard to jurisdictional claims in published maps and institutional affiliations.

