Abstract
The 3-coat-1-bake coating system has been widely employed in automobile body painting. This study examined whether the appearance (waviness) of the coating film can be improved by reducing the difference in the shrinkage percentage (by weight) between the primer surfacer and the basecoat and the clearcoat after flow/leveling stops in the clearcoat while baking. To delay the time of flow/leveling stops in the clearcoat (tC) and to reduce the difference in the shrinkage percentage between the basecoat and clearcoat, solventborne clearcoats were prepared by blocking all or part of the isocyanate group with 3,5-dimethylpyrazole (DMP). tC was measured using the electric-field tweezers system while baking at 140 °C. The respective shrinkage percentages of the primer surfacer, basecoat, and clearcoat (ωS, ωB, and ωC, respectively) were measured after tC. tC increased as the DMP content of the solventborne clearcoat increased. The ωC value is lower than the ωS and ωB values when the DMP content is zero; however, the ωC value increased when tC increased, and the ωS and ωB values decreased as tC increased. Wavescan Wa, Wb, Wc, and Wd decreased (i.e., improved the appearance) as |ωS − ωB| + |ωB − ωC| decreased. We confirmed that reducing the difference in the shrinkage percentage between the primer surfacer, basecoat, and clearcoat after tC is an effective way to improve the appearance.
1. Introduction
A variety of coating methods and materials have been introduced for different coating applications for protecting parts and structures against mechanical and chemical damage. A review [1] has been published. An article for coating on flexible substrates [2] and an article for coating to bio-applications [3] are also published.
For automobile bodies, in a conventional manufacturing process, paint is applied to the steel sheets by electrodeposition followed by baking. Then, a primer surfacer is applied and baked, followed by the deposition of a basecoat and clearcoat by a wet-on-wet process. Subsequently, baking is performed again. However, in recent years, car manufacturers have been required to reduce the environmental burden of their manufacturing processes, which mainly involves reducing carbon dioxide emissions [4]. Currently, the standard coating method is called 3-coat-1-bake (3C1B), in which the primer surfacer, basecoat, and clearcoat are applied by a wet-on-wet-on-wet process without baking the primer surfacer.
Coating and baking processes generate heterogeneous wavelengths on the coating film surface. Unfortunately, the extent of this waviness is larger in the 3C1B process than in the conventional 3-coat-2-bake painting, which degrades the appearance of the coating surface. Variety of methods have been proposed to resolve this problem, and many fundamental studies on automotive paint appearance have been performed. For example, Peters et al. evaluated texture evolution during the curing process [5]. Ellwood et al. have evaluated the effect of particle droplet size on the appearance of coating surface [6]. Domenico et al. have studied the effect of bell application parameters on the appearance of coating surface [7]. Osterhold et al. have characterized the surface structure of plastics coatings [8] and appearance of the surfaces [9]. Lin et al. have reviewed several factors that affect the appearance of coating surface and studied the effect of crosslinking chemistry on substrate telegraphing [10]. Recently, the authors suggested a 3C1B coating system by adopting base resins with a low glass transition temperature to promote levelling and by reducing the melamine content of the paint to minimize shrinkage during baking [11]. Then, Hayashi et al. developed a new 3C1B coating system with waviness equivalent to a conventional 3-coat-2-bake coating system for economy-class automobiles [12]. However, the authors seek novel concept of another 3C1B coating system which is applicable to luxury-class automobiles which coating appearance has less waviness than economy-class. Carbon dioxide emissions can be more reduced during painting if 3C1B coating system is applied to luxury-class automobiles, too. Therefore, car manufacturers also seek another 3C1B coating system which is environmentally friendly for the luxury-class automobiles.
In this study, we focused on the shrinkage during bake and examined whether the appearance is improved by reducing the difference in the shrinkage percentage between the primer surfacer and the basecoat and the clearcoat after flow/leveling stops in the clearcoat while baking. Figure 1 and Figure 2 show a schematic representation of the telegraphing of interface waviness. Figure 1 shows that the shrinkage percentage is different between the upper and lower layers after flow/leveling stops in the upper layer, and Figure 2 shows that the shrinkage percentage is the same between the upper and lower layers after flow/leveling stops in the upper layer. Although Figure 1 shows that telegraphing occurs on the surface, Figure 2 shows that telegraphing does not occur. Thus, it is considered that the waviness of the interfaces does not correspond to the waviness of the surface. Consequently, if the difference in the shrinkage percentage can be reduced to nearly zero, the waviness of the interfaces will not be telegraphed or reduced, which minimizes the waviness of the surface. So far there is some literature provided that minimizing whole shrinkage percentage of multilayer coating films can improve appearance, but no literature or patent provided that minimizing shrinkage percentage difference between those layers also can improve appearance. In this study, we examined whether this consideration is correct.
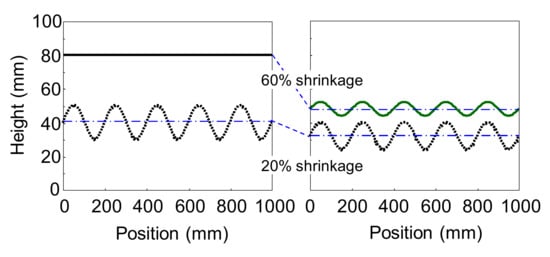
Figure 1.
Schematic representation of telegraphing of interface waviness (shrinkage percentage between upper layer and lower layer is different).
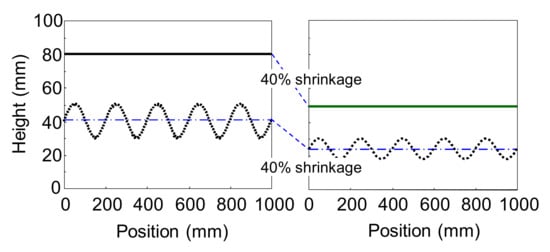
Figure 2.
Schematic representation of telegraphing of interface waviness (shrinkage percentage between upper layer and lower layer is same).
Based on the coating film, which consists of a melamine-curable primer surfacer, basecoat, and isocyanate-curable 2K-clearcoat, the shrinkage percentage after flow/leveling stops in the clearcoat follows basecoat > primer surfacer > clearcoat. This occurs because:
- The crosslinking reaction is faster for isocyanate than for melamine;
- Isocyanate crosslinking is an addition reaction, and melamine crosslinking is a condensation reaction.
- The amount of melamine resin follows basecoat > primer surfacer. We examined the relationship between the appearance and melamine resin amount in the basecoat or blocking agent amount for isocyanate in the clearcoat.
2. Materials and Methods
2.1. Materials
Table 1 shows the compounds prepared in this study as follows: a melamine-curable waterborne primer surfacer, waterborne basecoats with different melamine resin contents, and solventborne clearcoats, in which the curing agent isocyanate was partially or completely blocked by 3,5-dimethylpyrazole (DMP). A waterborne primer surfacer with a Tg of 20 °C was prepared by synthesizing the hydroxyl-containing acrylic resin AcEm-1 with the addition of Cymel 325 (melamine resin manufactured by Allnex, Frankfurt, Germany) as a curing agent, titanium dioxide (mixed with carbon black pigment) for pigment dispersion, an organic solvent, and other additives (Table 2). A waterborne basecoat with a Tg of 20 °C was prepared by synthesizing the hydroxyl-containing acrylic resin AcEm-2 and adding Cymel 325, an aluminum flake disperser, an organic solvent, and other additives (Table 3). The solventborne clearcoat was obtained by synthesizing a hydroxyl-containing acrylic resin and using four types of isocyanate blockers (manufactured by blending polyisocyanate Duranate TPA-100 and DMP; Asahikasei Chemicals, Tokyo, Japan) (Table 4). After adding organic solvents and additives, four types of solventborne clearcoats were prepared (Table 5).

Table 1.
Curing agents.
Table 2.
Formulation of waterborne primer surfacer (wt.%).
Table 3.
Formulation of waterborne basecoats (wt.%).
Table 4.
Formulation of blocked isocyanate (wt.%).
Table 5.
Formulation of solventborne clearcoats (wt.%).
2.2. Appearance Evaluation
As a substrate, an electrodeposition-coated steel plate was prepared with a surface roughness (Ra) of 0.14 μm measured according to JIS B0601-2001 using a Surftest SJ-301 manufactured by Mitsutoyo (Kawasaki, Japan). A wet-on-wet-on-wet process was used for the application. The various combinations of waterborne primer surfacer, waterborne basecoat, and solventborne clearcoat on the substrate are shown in Table 6. Then, the sample was baked (horizontally) under the following conditions: 10-min flash-off followed by a 30-min pass at 140 °C. After baking, the wavescan values Wa (a digitized waviness with a wavelength of 0.1 to 0.3 mm), Wb (0.3 to 1.0 mm), Wc (1 to 3 mm), and Wd (3 to 10 mm) were measured at room temperature. Better appearance was obtained when the wavescan values were smaller. The coatings were applied using an air-spray handgun (W-71S: spray distance = 30 cm; manufactured by Anest Iwata (Yokohama, Japan). After applying the waterborne primer surfacer, the sample was pre-heated with a 3-min flash-off and a 3-min pass at 80 °C. After applying the waterborne basecoat, the sample was further heated with a 1.5-min flash-off and a 3-min pass at 80 °C. The target film thicknesses of the primer surfacer, basecoat, and clearcoat were 20, 15, and 35 μm, respectively. The wavescan values Wa, Wb, Wc, and Wd were measured using a wavescan instrument manufactured by BYK-Gardner. The results are presented as the averages and standard deviations of three independent measurements.
Table 6.
Paint combinations and shrinkage percentages after tC.
2.3. Measurement of Flow/Leveling Stop Time in the Clearcoat
The abovementioned clearcoat was applied to a stainless-steel plate (40 × 50 × 0.5 mm) using a bar coater. The target film thickness was 100 μm after baking. Then, the sample was set in the electric-field tweezers system developed by Sakai Laboratory (Institute of Industrial Technology, University of Tokyo and manufactured by Kyoto Denshi Kogyo (Kyoto, Japan) (Figure 3) [13]. This system deforms the coating surface using an electric field and measures the viscosity from the recovery behavior. The measurement conditions were as follows: needle-to-surface distance = 100 μm; voltage = 5 V; voltage ON time = 1.0 s; and voltage OFF time = 1.0 s. The voltage ON and OFF cycle was repeated. After the application of the clearcoat, the temperature was increased from 20 °C to 140 °C in 20 °C/minute steps and held at 140 °C for 24 min. While heating and maintaining the temperature, the position of the sample surface was detected by irradiating the surface with laser light and capturing the surface-reflected light with a photodetector. By converting the detected position into voltage, the level above and below the position of the sample surface was read as voltage fluctuation (Figure 4). The voltages were recorded at 0.01-s intervals. After completing the measurement, the fluctuation width a of the detected voltage owing to the ON/OFF voltage was smoothed by the simple moving average method every 20 points (Figure 5). The time required to reach 5% of the maximum fluctuation width amax was taken as the time that the flow/leveling stopped (abbreviated as tC) (Figure 6). The measurement was performed with n = 2.
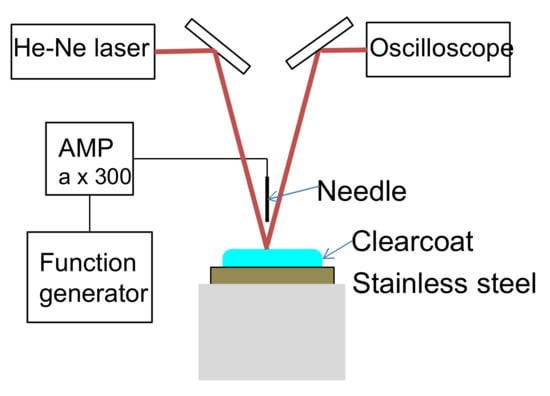
Figure 3.
Electric-field tweezers system.
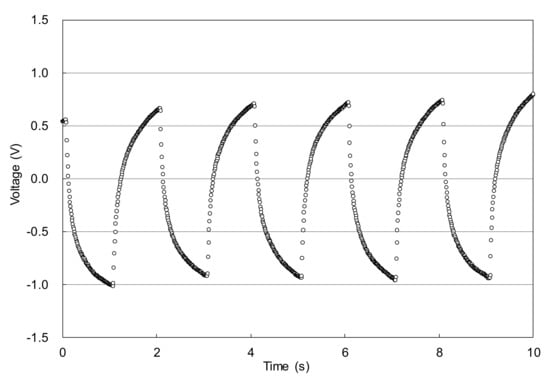
Figure 4.
Example of time dependence of detected voltage.
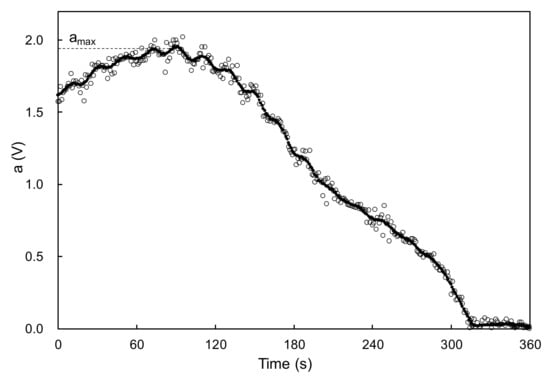
Figure 5.
Example of time dependence of fluctuation width a and determination of amax.
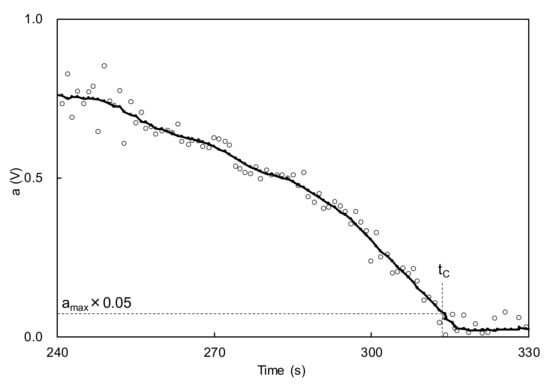
Figure 6.
Example of time dependence of fluctuation width a (expansion of Figure 5) and determination of tC.
2.4. Measurement of Shrinkage Rate ω after Flow/Leveling Stop in the Clearcoat
The waterborne primer surfacer, waterborne basecoat, and solventborne clearcoat described above were air-sprayed on a weighed stainless-steel foil to form the film thicknesses after baking of 20, 15, and 35 μm (booth temperature: 23 °C; 68% relative humidity). Prior to baking, the film was pre-heated twice for 3 min at 80 °C (only for the waterborne primer surfacer) and pre-heated once for 3 min at 80 °C (only for the waterborne basecoat). Then, the film was baked for a pass equivalent to tC at 140 °C. Then, the film was weighed and baked for a pass equivalent to further (30 − tC) at 140 °C, followed again by weighing. The shrinkage rate by weight ω was calculated using Equation (1). Each measurement was performed with n = 3. ωS denotes the shrinkage percentage of the waterborne primer surfacer after tC; ωB denotes the shrinkage percentage of the waterborne basecoat after tC, and ωC denotes the shrinkage percentage of the solventborne clearcoat after tC:
where, ωx is the shrinkage percentage after tC (%), X is the weight of the stainless-steel foil (g), Y is the weight of the stainless-steel foil and coating film (g) after baking for a pass equivalent to tC at 140 °C, and Z is the weight of the stainless-steel foil and coating film (g) after baking for a 30-min pass at 140 °C.
ωx = 100 (Y − Z)/(Z − X) x = S, B, C
2.5. Measurement of Viscosity
The viscosities of waterborne basecoat and solventborne clearcoat were measured while increasing the shear rate from 10−1 to 103 s−1. Measurements were performed using an ARES-G2 rheometer (TA Instruments, New Castle, DE, USA) at 25.0 ± 0.1 °C. The geometry of the solventborne clearcoat samples was set by a 25-mm-diameter cone plate (angle = 0.04 rad). The gap was set to 50 μm.
3. Results and Discussion
3.1. Relationship Between tC and ω
In the solventborne clearcoat, tC increased with an increase in the amount of DMP (Figure 7). This can be explained by the negligible viscosity increase. Clearly, the crosslinking reaction proceeds only above a certain temperature threshold even when DMP blocking increases the temperature. Figure 8 shows ωS, ωB, and ωC versus tC from Table 6, when the amounts of waterborne primer surfacer and waterborne basecoat were fixed and the DMP content of the solventborne clearcoat was varied (combinations 1, 5, 6, and 7 in Table 6). Both ωS and ωB decreased with an increase in tC; however, ωC increased under the same condition. This is attributed to the volatilization of DMP after the flow/leveling stop in the clearcoat.
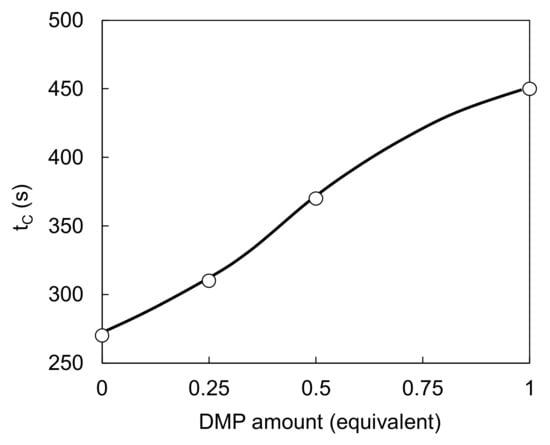
Figure 7.
Relationship between DMP amount and tC.
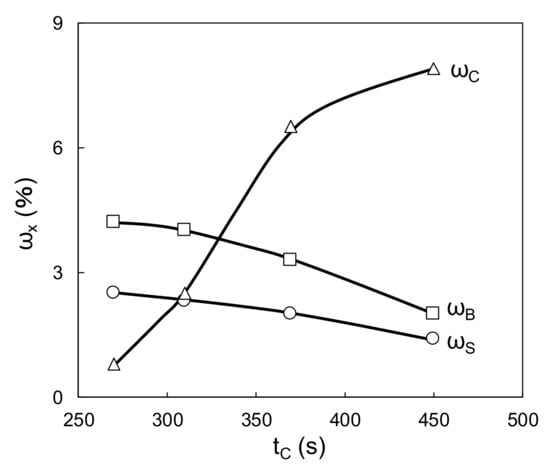
Figure 8.
Relationship between tC and ω (ωS; primer surfacer, ωB; basecoat; ωC; clearcoat).
3.2. Appearance Improvement by Reduction of Melamine Resin in the Basecoat
Table 6 shows the ω and shrinkage percentage differences in each combination. ωB decreased as the melamine resin content decreased. This occurs because the amounts of volatile compounds (e.g., alcohols by condensation reaction between acrylic and melamine resins) decreased. Whereas |ωS − ωB| decreased and then increased as the melamine resin content increased. |ωB − ωC| decreased as the amount of melamine resin decreased.
Figure 9 and Figure 10 show the relationships between the four wavescan values and |ωS − ωB| and |ωB − ωC|, respectively. Wa, Wb, Wc, and Wd fluctuated as |ωS − ωB| increased, and monotonically increased as |ωB − ωC| increased. Furthermore, given that the viscosity of the waterborne basecoat under a high shear rate (104·s−1) barely changed in response to the melamine resin content (calculated by extrapolating from viscosities of 630 s−1 and 1000 s−1, see Figure 11), the atomization state at the time of spraying is unlikely to depend on the samples. Then, Wa, Wb, Wc, and Wd tend to increase when |ωS − ωB| + |ωB − ωC| increases (Figure 12). These results suggest that the surface waviness of the clearcoat is governed by the different shrinkage percentages between the layers after the flow/leveling stops in the clearcoat. We noted that reduction of melamine resin in the basecoat can reduce volatile organic compounds during baking coating film.
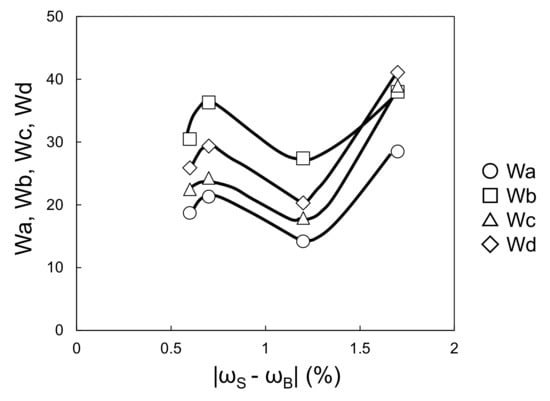
Figure 9.
Relationship between |ωS − ωB| and Wa–Wd (changing melamine resin content in waterborne basecoat).
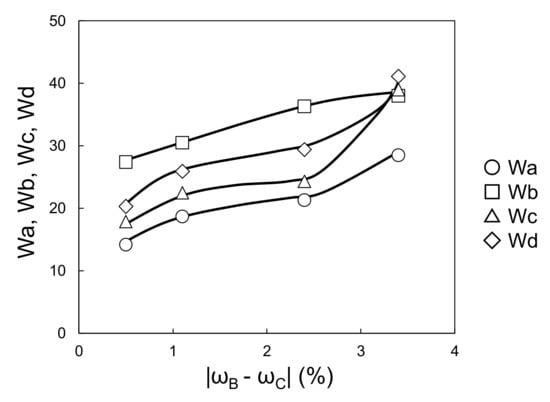
Figure 10.
Relationship between |ωB − ωC| and Wa–Wd (changing melamine resin content in waterborne basecoat).
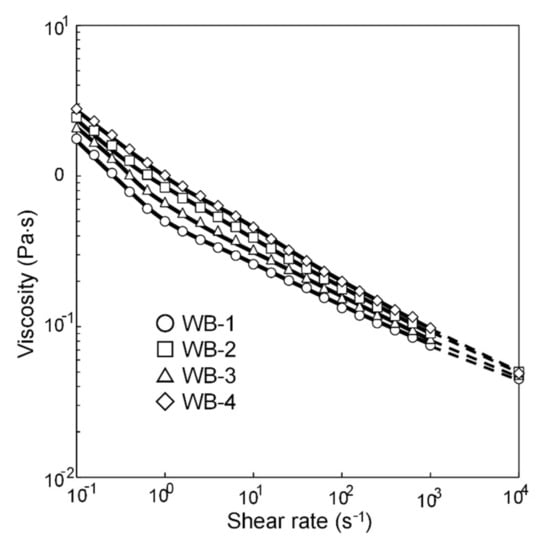
Figure 11.
Shear rate dependence of viscosity of waterborne basecoats.
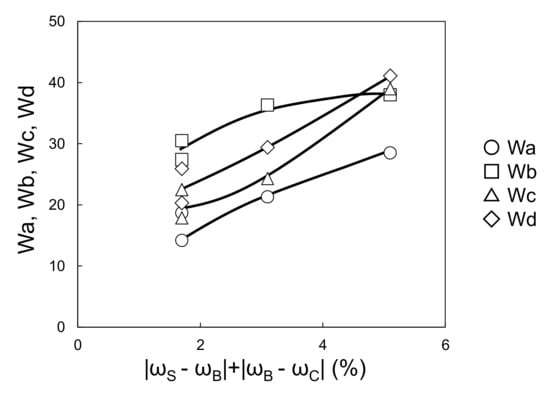
Figure 12.
Relationship between |ωS − ωB| + |ωB − ωC| and Wa–Wd (changing melamine resin content in waterborne basecoat).
3.3. Appearance Improvement by the Addition of DMP into the Clearcoat
Table 6 shows |ωS − ωB|, |ωB − ωC|. The ωB value decreased as tC increased, and ωC increased as the amount of blocking agent increased. Consequently, |ωS − ωB| decreased when DMP increased, and |ωB − ωC| is equivalent to blocking agent amounts of 0.25 < 0 < 0.5 < 1.0. Figure 13 shows that Wa, Wb, Wc, and Wd increased when |ωS − ωB| + |ωB − ωC| increased. This suggests that in this coating system, the surface appearance is predominantly governed by the shrinkage differences at the interfaces. Figure 14 shows an actual image of the surface of the coatings.
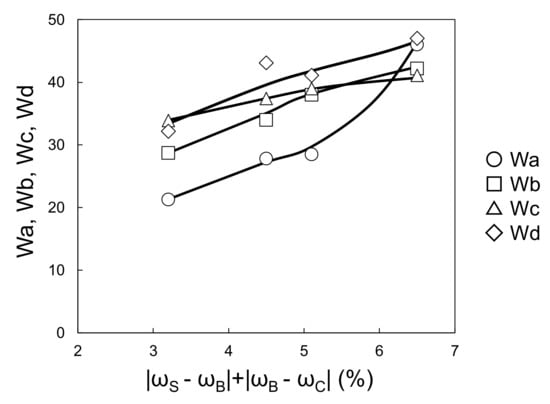
Figure 13.
Relationship between |ωS − ωB| + |ωB − ωC| and Wa–Wd (changing DMP content in solventborne clearcoat).
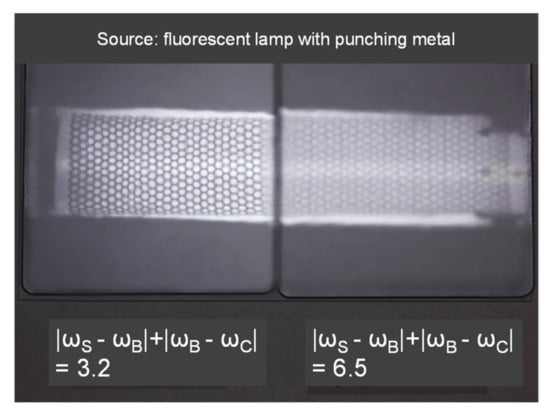
Figure 14.
Image of coating surface of two panels (left;|ωS − ωB| + |ωB − ωC| = 3.2, right; |ωS − ωB| + |ωB − ωC| = 6.5, source; fluorescent lamp with punching metal).
The abovementioned results confirm that if ω is obtained through the accurate measurement of the flow/leveling stops, then appearance can be related to the shrinkage percentage between the paint layers even in systems containing different types of clearcoats. Table 7 lists Wa, Wb, Wc, and Wd.
Table 7.
Wavescan values obtained by changing basecoat and clearcoat.
Surface waviness is affected by the atomization and leveling of the clearcoat. The viscosity was assumed to be almost independent of the DMP content of the clearcoat. However, after determining the viscosity behavior, the role of viscosity in the relationship between clearcoat atomization and surface appearance was reconsidered. The amount of blocking agent, 0.25 < 0.5 < 0 < 1.0, is equivalent to |ωB − ωC|. If atomization and leveling of the clearcoat markedly reduce Wa, Wb, Wc, and Wd, the viscosity at the high shear rate (104 s−1) of the clearcoat (calculated by extrapolating viscosities of 630 s−1 and 1000 s−1) can be considered to be equivalent to the blocking agent amount of 0.25 < 0.5 < 0 < 1.0. However, the viscosity was equivalent to the blocking agent amounts of 1.0 < 0 < 0.25 < 0.5 (Figure 15) and did not correlate with Wa, Wb, Wc, and Wd. Thus, in this coating system, the atomization of the clearcoat had only a small effect on the surface appearance.
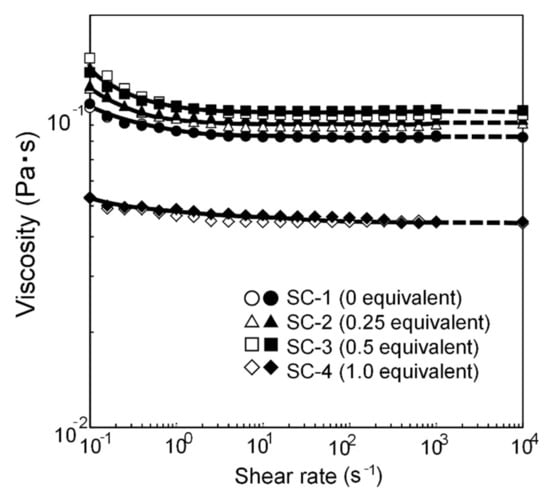
Figure 15.
Shear rate dependence of viscosity of solventborne clearcoats.
We noted that increasing of DMP as blocking agent in the clearcoat can increase volatile organic compounds during baking coating film.
4. Conclusions
This study examined whether the surface appearance of a 3C1B coating system can be effectively improved by reducing the shrinkage percentage difference between the primer surfacer/basecoat layer and between the basecoat/clearcoat layer after flow/leveling stops in the clearcoat layer.
- This shrinkage percentage difference was reduced by decreasing the shrinkage percentage of the basecoat by reducing melamine resin content in the basecoat. Wa, Wb, Wc, and Wd started to decrease when the shrinkage percentage difference between the primer surfacer and the basecoat plus between the basecoat and the clearcoat layers decreased.
- Also, the shrinkage percentage difference was reduced by increasing the shrinkage percentage of the clearcoat by mixing DMP into an isocyanate-curable solventborne clearcoat. At t = tC (measured using the electric-field tweezers system), the wavescan values Wa, Wb, Wc, and Wd started to decrease when the shrinkage percentage difference between those layers decreased.
These results demonstrate that the shrinkage percentage difference between the layers after the flow/leveling stops in the clearcoat layer can be reduced by controlling the time to tC (by mixing DMP into the clearcoat), which leads to an improvement in appearance.
Author Contributions
Conceptualization, S.Y. and K.T.; methodology, S.Y. and K.T.; writing—original draft preparation, S.Y.; writing—review and editing, S.Y.; All authors have read and agreed to the published version of the manuscript.
Funding
This research received no external funding.
Data Availability Statement
No new data were created or analyzed in this study. Data sharing is not applicable to this article.
Acknowledgments
The authors would like to express their sincere gratitude to Hiroshi Nakamura and Masahiko Ishii of the Toyota Central R & D Labs, Inc. for their useful discussions and guidance in preparing this manuscript.
Conflicts of Interest
The authors declare no conflict of interest.
References
- Fotovvati, B.; Namdari, N.; Dehghanghadikolaei, A. On coating techniques for surface protection: A review. J. Manuf. Mater. Process. 2019, 3, 28. [Google Scholar] [CrossRef]
- Chelu, M.; Stroescu, H.; Anastasescu, M.; Calderon-Moreno, J.M.; Preda, S.; Stoica, M.; Fogarassy, Z.; Petrik, P.; Gheorghe, M.; Parvulescu, C. High-quality PMMA/ZnO NWs piezoelectric coating on rigid and flexible metallic substrates. Appl. Surf. Sci. 2020, 529, 147135. [Google Scholar] [CrossRef]
- Ibrahim, H.; Dehghanghadikolaei, A.; Advincula, R.; Dean, D.; Luo, A.; Elahinia, M. Ceramic coating for delayed degradation of Mg-1.2 Zn-0.5 Ca-0.5 Mn bone fixation and instrumentation. Thin Solid Films 2019, 687, 137456. [Google Scholar] [CrossRef]
- Shibata, H.; Iida, T.; Nasu, Y. Concept and topics of automotive production process for paint shop. J. Jpn. Surf. Finish. 2018, 69, 290. [Google Scholar] [CrossRef]
- Peters, C.A.; Nichols, M.E.; Ellwood, K.R. The evolution of surface texture in automotive coatings. J. Coat. Technol. Res. 2011, 8, 469–480. [Google Scholar] [CrossRef]
- Ellwood, K.R.; Tardiff, J.L.; Alaie, S.M. A simplified analysis method for correlating rotary atomizer performance on droplet size and coating appearance. J. Coat. Technol. Res. 2014, 11, 303. [Google Scholar] [CrossRef]
- Di Domenico, J.; Henshaw, P. The effects of basecoat bell application parameters on elements of appearance for an automotive coatings process. J. Coat. Technol. Res. 2012, 9, 675. [Google Scholar] [CrossRef]
- Osterhold, M.; Armbruster, K. Characterizing the surface structure of plastics coatings. Prog. Org. Coat. 2006, 165, 2006. [Google Scholar] [CrossRef]
- Osterhold, M.; Armbruster, K. Characterizing the appearance of medium glossy surfaces. Prog. Org. Coat. 2009, 440, 2009. [Google Scholar] [CrossRef]
- Lin, J.L.; Shen, J.; Zimmer, M.E. Appearance of Automotive Coatings. In Protective Coatings; Springer: Cham, Switzerland, 2017; Volume 377. [Google Scholar] [CrossRef]
- Yomo, S.; Tachi, K.; Narita, T. Improving the appearance of 3-coat-1-bake multilayer films on automotive bodies. Prog. Org. Coat. 2018, 299, 2018. [Google Scholar] [CrossRef]
- Hayashi, H.; Ishii, M. SAE Technical Paper, No. 2014-01-1048; SAE International: Warrendale, PA, USA, 2014. [Google Scholar]
- Sakai, K.; Yamamoto, Y. Electric field tweezers for characterization of liquid surface. Appl. Phys. Lett. 2006, 211911, 2006. [Google Scholar] [CrossRef]


Publisher’s Note: MDPI stays neutral with regard to jurisdictional claims in published maps and institutional affiliations. |
© 2021 by the authors. Licensee MDPI, Basel, Switzerland. This article is an open access article distributed under the terms and conditions of the Creative Commons Attribution (CC BY) license (http://creativecommons.org/licenses/by/4.0/).