Article

Characterization of Beeswax, Candelilla Wax and Paraffin Wax for Coating Cheeses

by
Adolfo Bucio
1,*,
Rosario Moreno-Tovar
2,3,
Lauro Bucio
2,
Jessica Espinosa-Dávila
3 and
Francisco Anguebes-Franceschi
4
1
Colegio de Postgraduados, Campus Tabasco, Km 3.5 Carretera Cárdenas-Huimanguillo, Cárdenas, Tabasco CP 86500, Mexico
2
Laboratorio de Cristalofísica y Materiales Naturales, Instituto de Física, Universidad Nacional Autónoma de México, Circuito de la Investigación Científica s/n, Ciudad Universitaria, Coyoacán, Ciudad de México CP 04510, Mexico
3
Laboratorio de Biopolímeros, Departamento de Biotecnología, Universidad Autónoma Metropolitana Unidad Iztapalapa, Av. San Rafael Atlixco No. 186, Col. Vicentina, Ciudad de México CP 09340, Mexico
4
Facultad de Química, Universidad Autónoma del Carmen, Ciudad del Carmen CP 24180, Campeche, Mexico
*
Author to whom correspondence should be addressed.
Coatings 2021, 11(3), 261; https://doi.org/10.3390/coatings11030261
Submission received: 1 February 2021 / Revised: 17 February 2021 / Accepted: 19 February 2021 / Published: 24 February 2021
(This article belongs to the Section Coatings for Food Technology and System)

Abstract

:
A study on the physical and mechanical properties of beeswax (BW), candelilla wax (CW), paraffin wax (PW) and blends was carried out with the aim to evaluate their usefulness as coatings for cheeses. Waxes were analyzed by X-ray diffraction (XRD), Fourier Transform Infrared Spectroscopy (FTIR), differential scanning calorimetry (DSC), permeability, viscosity, flexural and tensile tests and scanning electron microscopy. Cheeses were coated with the waxes and stored for 5 weeks at 30 °C. Measured parameters were weight, moisture, occurrence and degree of fractures, and dimensional changes. The crystal phases identified by XRD for the three waxes allowed them to determine the length of alkanes and the nonlinear compounds in crystallizable forms in waxes. FTIR spectra showed absorption bands between 1800 and 800 cm−1 related to carbonyls in BW and CW. In DSC, the onset of melting temperature was 45.5 °C for BW, and >54 °C for CW and PW. Cheeses coated with BW did not show cracks after storage. Cheeses coated with CW and PW showed microcraks, and lost weight, moisture and shrunk. In the flexural and tensile tests, BW was ductile; CW and PW were brittle. BW blends with CW or PW displays a semi ductile behavior. Cheeses coated with BW blends lost less than 5% weight during storage. The best waxes were BW and the blends.

Graphical Abstract

1. Introduction

Waxes are a heterogeneous class of lipids containing hydrocarbons and other non-polar substances. Natural waxes can be of vegetable, animal, or mineral origin. Waxes from animals and vegetable sources are mixtures of long-chain fatty acids, esters of aliphatic alcohols and hydrocarbons; those from mineral origins are composed mainly of paraffinic hydrocarbons [1]. Waxes have many industrial uses. Some waxes are used as primary coatings for some hard or semi hard cheese varieties [2]. Waxes for cheese coatings are used in the following way: they are heated to become molten, and then cheeses are dipped in the molten waxes and then are cooled after withdrawal. Waxes protect cheeses from water evaporation and weight loss and also prevent mold growth during storage and transportation [2,3,4]. Although some other materials are also used for cheese packaging, many traditional cheese manufacturers use waxes [5,6], mainly paraffin wax (PW) and mixtures, as cheese coatings [6,7,8,9,10,11,12,13]. Its use is very convenient and environmentally friendly at small-scale use, and preserves the nostalgic image of many traditional brands of cheese that have used waxes for cheese coating for ages.
Waxes for coating cheeses ideally should have at least the following characteristics: low propensity to fracture when subjected to external forces [3,14] and low water vapor permeance. Moreover, they should have the Generally Recognized as Safe (GRAS) Status and a low impact on the environment. In order to prevent defects in cheese coatings, conventional waxes of mineral origin can be replaced with microcrystalline waxes, triglycerides, or fatty acids [3]. PW blends with some organic clays also improve both strength and ductility [14]. Donhowe and Fennema suggested that some food-grade waxes with low water permeability, such as beeswax (BW) and candelilla wax, obtained from the shrub (Euphorbia antisyphilitica) (CW) may be suitable materials for use in foods [15].
However, it is important to measure the resistance to fracture of the wax films [16]. There is a study that shows evidence that beeswax can be used as a good coating for cheese, but the mechanisms are not described [10]. Cheese coated with 100% BW and stored for 30 days at 4 °C keeps its moisture as high as vacuum-packaged cheese. Sometimes BW is adulterated with PW or microcrystalline wax to reduce the cost of the raw materials. As an example, it can be mentioned the waxes used for bee production systems [17]. Some researchers stated that CW could replace BW in different food systems [18]; however, for the coating of cheeses or foods, no available information was found.
BW is generally used in combination with other polymers to make coatings. The main purpose of this component applied in fruits and legumes is to reduce water loss while maintaining a certain level of oxygen and carbon dioxide exchange [15]. Because respiration is kept at a low level, the shelf life is extended in fruits and legumes. BW is generally mixed with other compounds, such as polysaccharides (cellulose, starch, chitosan and their derivatives) and proteins (gelatin and soy protein) [19]. Examples of foods coated with beeswax as ingredients are various fruits and vegetables [20,21]. In paper, BW has a role in reducing the water vapor permeance and filling pores [22].
Candelilla wax is generally used in combination with other materials to confer a hydrophobic layer in coatings for fruits protection [23]. It is also used in vegan formulations [24]. The use of candelilla as a coating in mixtures prevents weight loss, impart gloss and prolong shelf-life in fruits and vegetables [25]. Candelilla wax is extracted from the wild shrub, E. antisyphilitica. Wax production by this plant occurs mainly during the dry season as an adaptive mechanism to reduce excessive water loss on the stem surface and to avoid plant desiccation [26]. Candelilla is hard and brittle, its surface can reach high brightness levels, which is one of the most valued properties for various applications such as coating of chocolates and fruits [23].
The objective of this research was to carry out a comparative study on some physical, chemical, mechanical and technological properties of BW, CW and mixtures of PW and BW with CW or PW as coatings for Poro cheese.

2. Materials and Methods

2.1. Waxes

Three kind of waxes were used: BW was supplied by Beekeepers Association of Tabasco, Mexico; CW by Ceras Naturales Mexicanas, S.A. de C.V., Saltillo, Coahuila, Mexico; and PW, melting point 64−66 °C by Petrowax S.A. de C.V, Mexico which is currently used by the local cheese makers and which is commonly used to make candles. Two binary mixtures, CWx/BW(1 − x) and PWx/BW(1 − x) (x = 0.25, 0.5, 0.75 and 1), were prepared as melting waxes in a Teflon pan at 100 °C. Four replicates of each binary mixture were assessed for the experimental characterization of the waxes.

2.2. Cheese

For the experiments, we choose a semi-dry cheese to use experimental waxes for coatings [27]. The selected cheese was Poro cheese. This cheese is characterized by a water activity (aw) <0.95, a low pH value (~4.5); humidity (29% ± 0.2%) and 3–4% NaCl [28,29]. Storage lasts up to 5 weeks at room temperature [29]. Cheeses were purchased from Quesos de Poro Genuino de Balancán, Tabasco SPR, México. The cheeses have been made from raw milk and are manufactured following traditional techniques [27].

2.3. Characterization of Waxes

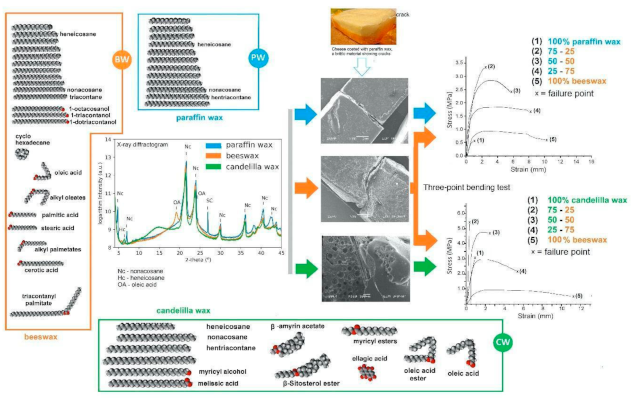
X-ray Diffraction (XRD)

Samples of waxes were characterized by XRD to identify the crystalline phases. Wide-angle XRD analysis was performed on a D8 Advance diffractometer (Bruker AXS, Billerica, MA, USA) operating at conditions of 40 KV and 30 mA, with a CuKα radiation. The diffracted intensities corresponding to the 2θ angle were collected from 4 to 90° by means of a lynx-eye detector. The diffractograms for PW, CW and BW allowed identifying crystalline phases by consulting the International Centre for Diffraction Data database (ICDD) [30].

2.4. Fourier Transform Infrared Spectroscopy (FTIR)

FTIR spectra of the waxes were determined in Attenuated Total Reflectance (ATR) mode using a FTIR spectrometer (Perkin Elmer 100, Perkin Elmer, Waltham, MA, USA), in the 650 to 4000 cm−1 zone, using 16 scans. No specific preparation was required for the analysis of the wafer-shaped samples [31].

2.5. Raw Waxes Characterization by Thermal Analysis

Differential scanning calorimetry (DSC) and thermogravimetric analysis (TGA) were carried out in a Thermal Analysis System TA Instruments SDT Q600 (TA Instruments, Castle, MA, USA). The heating rate was 10 °C/min in an air atmosphere. The sample amount was between 5 and 10 mg. An additional DSC was carried out at a heating rate of 5 °C/min from room temperature to 100 °C to obtain well-defined peaks for the melting point. Waxes were analyzed by three characteristics: (a) recording the solid-liquid transition temperatures by DSC [32]; (b) by looking at the shape of DSC; and (c) by determination of melting enthalpies [33].

2.6. Water Vapor Permeance (WVP) and Water Vapor Transmission Rate (WVTR)

WVP and WVTR were measured using a variation of the “dry and wet cup method” [34]. BW, CW, PW, as well as the binary mixtures including BW, as one ingredient were melted and poured in a silicone mold of 2 cm diameter and 0.5 mm thickness. Samples were preconditioned at 30 ± 2 °C for 24 h. The thickness at five points for each wafer sample was measured with a digital micrometer (Mitutoyo, Kanagawa, Japan). Samples were assessed with 80%/43% of relative humidity (RH) (dry cup method) and 43%/80% RH (wet cup method) kept at 30 ± 2 °C. A saturated solution of (NH4)2SO4 was used to generate 80% RH; and a saturated K2CO3 solution to generate a 40% RH. The weight change of the glass cup was recorded until the sample reached a constant weight. Calculations were made according to the standard [34]. At least three replicates of each film type were tested for WVP and WVTR.

2.7. Viscosity

An Anton Paar rheometer MCR 101/301/501 (Anton Paar, Graz, Austria) was used with continuous strain in the shear rate range from 2 to 100 s−1. The measuring cell of the device represents a system of coaxial cylinders consisting of the outer fixed cylinder with a cylindrical rotor immersed into it. Waxes were placed in the annular gap between the cylinders and were heated with the Peltier system. The device was controlled with the Rheo-plus/32 V3.40 program at 70–100 °C, the temperature of waxes for cheese waxing [35].

2.8. Density of Waxes

The density of waxes at 25 °C were determined with the American Society for Testing Materials (ASTM [36] method. The Density of waxes at 100 °C were determined by weighing molten waxes into a pycnometer of known volume kept in a stove at 100 °C [37]. A glass thermometer was calibrated at 0 °C [38].

2.9. Mechanical Properties of Waxes

A three-point bending test and tensile test were performed for each specimen in a Shimadzu, Autograph AG-100 KNG, Universal Testing Machine (Shimadzu Scientific Instruments, Kyoto, Japan), with a crosshead speed of 0.5 mm/min. Specimens for the three-point-bending test consisted of prisms with a rectangular cross-section (5 × 3 mm2) width and thickness respectively, and 38 mm length. The distance between the two support points was 30 mm. Samples for the tensile test consisted of “I” shaped specimens with a rectangular cross-section (5 × 3 mm2) width and thickness respectively, and 31 mm length. Stress–strain curves were plotted for each specimen.

2.10. Scanning Electron Microscopy (SEM)

Samples of fractured surfaces were examined using a scanning electron microscope (JSM-5600 LV JEOL, Tokyo, Japan) operated at an accelerating voltage of 5–20 kV. The micrographs were obtained from samples as pieces that were fixed by means of a carbon tape were placed on an aluminum cylindrical sample-holder and covered with a thin film of gold.

2.11. Cheese Coatings

Four cheese blocks of approximately 15 × 7 × 6 cm3 were dipped in molten waxes of each mixture at 100 °C for 10 s; afterward, they were placed in a waxed paper at room temperature. The weight of coating materials was calculated by subtracting the weight of cheeses before and after coating. Thickness of coatings were measured after removing coatings. The cheeses were stored for 5 weeks at 30 °C and 40% RH. Evaporative weight loss of cheeses was calculated weekly by measuring the weight difference [3]. The dry matter of cheeses was measured by Association of Official Agricultural Chemists (AOAC) method 926.08 [39]. Water activity (aw) was measured at 25 ± 1 °C with Aqualab model CX2, Decagon Devices, Pullman, WA, USA.

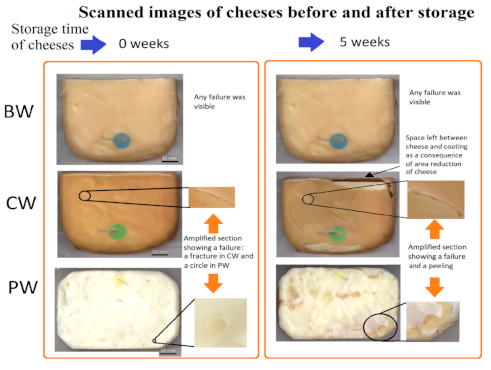
2.12. Degree of Cracking of Coatings during Cheese Storage

Images of cheese coatings were recorded with an HP Scanjet G4050 (Hewlett-Packard Inc., Palo Alto, CA, USA) with a resolution of 2400 dpi. A millimetric paper was placed over the scanner’s glass plate, beside the cheese’s area to be used as reference to measure total cheese area; and dimensions of the cracks. The degree of cracking was calculated by measuring peeled areas in the wax coatings of cheeses. The Digitizelt ver 2.5.3 software (Braunschweig, Germany) was used to digitize scanned images. Standards [40,41] were used as guides to examine wax coatings of cheeses for five weeks. A failure was called a crack only if the underlying surface of cheese was visible in some of the stages of cheese storage. The report consisted of (i) the length of cracks, and (ii) the area peeled by cracks (degree of cracking) Area reduction was measured examining the digitalized images of cheese before and after cheese storage, calculating the percentage of change.

2.13. Statistical Analysis

Statistical analysis was done using SPSS 15 software (SPSS Inc., Chicago, IL, USA). For each variable, a comparison of different means between waxes, a one-way analysis of variance (ANOVA), and Tukey’s multiple range test (P < 0.05) was performed. Samples with non-homogeneous variances were assessed by the Kruskal–Wallis test, which uses ranks for variance analysis. Significance between the samples at the end of the testing period (5 week) were analyzed by the Mann–Whitney test (P < 0.05).

3. Results and Discussion

Although the wax compositions were not thoroughly analyzed in this study, information from X-ray diffraction (XRD), Fourier Transform Infrared Spectroscopy (FTIR) were compared to the literature regarding their composition. It is important to understand the main components involved in their physical properties and interactions during crystallization and coating formation.

3.1. DRX

The diffractograms for BW, CW and PW show the assignments of identified crystalline phases to the Bragg peaks by consulting the ICDD database (Figure 1a,c). They are listed in Table 1 for a comparative purpose. As a general observation, BW contained the structure of the crystalline phase of n-alkanes and fatty acids; CW contained alkanes and other crystalizable groups and PW contained solely straight-chain alkanes. For BW (Figure 1a), the phases that reasonably match with the Bragg peaks were n-nonacosane, C29H60 (Powder Diffraction File, PDF 40-1997); with n-heneicosane, C21H44 (31-1705); n-tricosane-n-pentacosane, C25H52 (53-1798); n-tricosane, C23H48 (43-1854); n-pentacosane, C25H52 (53-1793) and particularly oleic acid, C18H34O2 (37-1810). In the same way, for CW (Figure 1b), the identified phases were also n-nonacosane, C29H60 (40-1997) with the very clear presence of n-heneicosane, C21H44 (31-1705); accompanied with tritriacontane, C33H68 (54-1717); triacontanoic acid, C30H60O2 (34-1796) and sitosterol, C29H50O (10-0545). For the case of PW (Figure 1c) the phases were: n-nonacosane, C29H60 (40-1997); n-heneicosane, C21H44 (31-1705); n-tricosane-n-pentacosane, C23H48, C25H52 (53-1798); n-tricosane, C23H48 (43-1854); and n-pentacosane, C25H52 (53-1793). They have been previously reported for BW [42,43,44]; CW [45,46,47]; and PW [1,42]. Hentriacontane, C31H64, has been reported as the major constituent for CW [47,48]; but diffractometer data for this phase was not found in the database. Oleic acid was clearly detected as a minor compound in BW, and could be present as a trace compound for CW. The diffracted intensities were considerably stronger as follows PW > BW > CW. Higher diffracted intensities in PW were related to the presence of straight alkanes (CnH2n+2 [48]. Linear alkanes show more crystallinity than nonlinear alkanes [49]. A high degree of crystallinity generally requires greater energy for solid-liquid transitions [enthalpy of fusion]; as it was observed in PW with different crystallinities [1]. All the samples were measured under the same experimental conditions in the DRX.

3.2. Wax Characterization by Fourier Transform Infrared Spectroscopy

Figure 1 shows the FTIR spectra of the three kinds of waxes. The absorption bands related to alkanes were similar for the three waxes; the following bands can be assigned: C–H stretching (at 2950 and 2850 cm−1); C–H bend or scissoring (1466 cm−1); and C–H rock, methyl, seen only in long-chain alkanes (725 cm−1). In previous studies, similar spectral bands to those described in this study were reported for BW [50,51,52]; CW [53]; and for PW [52,54]. Spectral region between 1800 and 800 cm−1 has been considered as a fingerprint region for BW because of a high number of absorption bands. The sharp band between 1700 and 1750 cm−1 arises from the carbonyls in the ester linkages between the fatty acids and glycerol backbone [55,56]. Such absorption is attributed to the beeswax monoesters, which are the major ester component (∼40%) of beeswax [45]. BW and CW were similar in many functional groups; However, band 1378 cm−1 was reported as a characteristic band in BW [57]. In our study, it was also present in CW.

3.2.1. DSC and TGA

Thermal analysis is shown in Figure 2; some key points of DSC are summarized in Table 1. It can be seen that DSC curves for BW were broader than for CW and PW. The lowest melting temperature for BW was 45.5 °C, approximately 10 °C lower than the values for CW and PW. That means that during cooling, BW has a longer time to spread on the surfaces before waxes get solidified, and it reduces the probability of the occurrence of failures.
The peak melting temperature and enthalpy for BW was 70 °C and 192 J/g, respectively (Figure 2a). The lower and upper temperature limits associated with a complete melting of BW are listed in Table 1. The TGA indicates that the sample lost weight starting at around 209 °C and then changed its slope in a complicated way according to the complex composition of BW, particularly around 10% wt. of long-chain molecules which decompose at higher temperatures (Figure 2g).
The results of DSC are in general agreement with other studies [58,59] where melting temperature had similar values (69.6 °C for BW). Other authors have recorded lower peak melting temperatures (≈63 °C) and enthalpies (between 182–186 J/g). It has been suggested that waxes obtained from honeybee’s hives built-in warmer places, could be of higher peak melting temperatures than waxes from cold places [58]. It has also been demonstrated that organisms respond to high temperatures producing waxes with high peak melting temperatures [60].
The peak melting temperature and enthalpy for CW were 76 °C and 177.5 J/g, respectively (Figure 2b). Both values were very close to 77 °C and 116–161/g [61]. Other authors [46] have also recorded lower melting enthalpies (149.75 g−1) than that obtained in this study for CW. In this case, it is also feasible that CW samples contained a little amount of non-crystalline wax. This is in agreement with the diffuse scattering component observed in the X-ray diffractogram for CW (Figure 1b).
Peak melting temperature and enthalpy for PW was 66 °C and 199 J/g, respectively; the lower and upper-temperature limits associated with the melting transition peak of PW (Figure 2c,f) were closer to those values described previously for intermediate crystalline PW [1]. The enthalpy of 199 J/g is slightly higher than that obtained for intermediate crystalline wax (173 J/g) [1]. As higher enthalpies are inherent of amorphous waxes, then it is feasible that a PW sample contains a small amount of non-crystalline wax. This is in agreement with the diffuse scattering component observed in the X-ray diffractogram for PW (Figure 1c). Concerning TGA results, around 90 wt.% of the PW sample (Figure 2) was lost by combustion starting at 216 °C, and the remaining 10% was slowly lost in a relatively long range of temperature from 312 to 535 °C (Figure 2i), likely related to the presence of long-chain molecules in PW.

3.2.2. Viscosity

Viscosity values of the three waxes at 100 °C allowed to coat cheeses thoroughly during dipping time (Figure 3a,d). However, during cooling at 70 °C, PW flowed better than the other waxes. At 70 °C, CW stabilized quicker than BW. BW had less viscosity than CW (Table 1). Because viscosity can be measured only at temperatures near above melting point peak; DSC can be helpful to describe the temperature of the liquid–solid transition. In the rheometer reading, the viscosity measurements indicated that the molten waxes change the fluid’s viscosity significantly at different temperatures shown in Figure 3a,d. The viscosity from highest to lowest was CW > BW > PW. A Lower viscosity in PW than the other waxes is due to a more uniform laminar flow related to the presence of low density linear short hydrocarbon chains (Table 1) (alkanes) [1]. The highest viscosity in CW could be related to the longest hydrocarbon chains, some of them nonlinear. BW’s high viscosity can be resultant of long esters mixed with some hydrocarbon chains.

3.2.3. Density

The three waxes showed higher density at 25 °C than at 100 °C (Table 1); thus, specific volume is reduced after the waxes are cooled and solidified. In this study, the density at 25 °C from highest to lowest was CW > BW > PW. It can be assumed that after cheese is dipped in molten wax, and cooled at room temperature; the specific volume of waxes will be reduced (shrunk), generating contraction forces in the waxes. Because the different compounds of waxes have different melting points and densities, it could be expected that they will produce irregularly shaped layers after waxes are cooled [62] in the cheeses.

3.2.4. Water Vapor Permeance and Water Vapor Transmission Rate

The WVP of PW, CW and BW has as low permeability values as many “plastics” used for packaging, such as low-density polyethylene or polyvinyl chloride [63,64,65]. In the dry cup method (80/43% RH) CW and BW exhibited higher WVP than PW. PW displayed the smallest WVP of the waxes tested (0.89 × 10⁻⁵ g/[m2hPa]). The same situation can be observed for the wet method (Table 2). The absence of polar compounds and the composition of alkanes in PW are likely responsible for its excellent water vapor barrier properties. The different degrees of higher permeability to water vapor in CW, BW and blends are probably attributable to the specific larger concentration of fatty acids, fatty alcohols and esters in the specific wax or specific blend [15].
BW, CW and PW are very good barriers to moisture transfer due to their hydrophobic nature [63,64,65]. Weight changes in the cups coated in the experiments performed in this study for the three waxes were not higher than 1% of the original weight after 20 days of measurements. That information shows that there was a low permeability to water vapor in the three materials.
Brittleness of waxes is the main constraint to their use as coatings. It is very difficult to avoid the appearance of cracks during application of these lipids to foods and during subsequent handling of the foods [54,63]; therefore, some authors recommend that some waxes should be combined with hydrocolloids to form more resistant films [65]. Differences in permeability among the wax films are attributed mainly to differences in chemical composition and crystal type as determined by X-ray diffraction [15].

3.2.5. Weight Loss of Cheese

The best waxes to coat cheeses were BW and blends. The worst were CW and PW (Figure 3e,f). In the first experiment, the cheese coated with BW1.0, at five weeks showed the least weight loss (BW1.0, P < 0.05) (Figure 3e,f) in relation to cheeses coated with the other waxes and their mixtures. The greatest weight loss was recorded in both CW1.0 and PW1.0. It was previously reported little changes in weight in the cheeses coated with BW1.0 and stored in refrigeration for several weeks [10]. The mixtures with BW0.25/CW0.75 and BW0.25/PW0.75 and the other mixtures were effective coatings, because weight reduction was less than 5%. A value acceptable for cheese coatings [3].
In the second experiment (Table 3), moisture content and water activity (aw) for the cheese coated with BW were significantly higher (P < 0.05) than the values for cheeses coated with CW1.0 and PW1.0.

3.2.6. Image Analysis of Coatings of Cheeses

Image analyses allowed to make a rough and fine assessment of how fractures developed in cheese coated by CW and PW. Fractures were scarcely visible in BW during the whole experiment. In coatings of CW and PW some failures were detected at the beginning of the experiments; in CW they showed up as deep cracks failures. In PW defects showed as pinholes (Figure 4). Initial failures might lead to further damage in coatings. Cracking and breaking of a cheese coating results in a shrinkage caused by the loss of moisture through evaporation from cheese [66]. A defective coating is: “a brittle coating of PW that breaks and peels off in the form of scales or flakes” [9]. Initial defects in the barrier film recorded in CW and PW might explain a significant moisture loss [P ≤ 0.05] through a cracked section leading to significant loss of weight of cheeses [P ≤ 0.05], and significant shrinkage of cheeses [P ≤ 0.05]. In CW, cracks appeared as irregular linear cracks, as shown in Figure 4 and Table 3.
There were significant differences in the cracks, area peeled by cracks, and area reduction in cheese coated with BW, CW and PW according to multiple comparison tests across [Kruskal–Wallis test; χ2 = 8.11, degrees of freedom (d.f.) = 2, P = 0.017]. The differences between BW in comparison of either CW and PW were highly significant [Mann–Whitney U-test; z = −2.36, P = 0.018, two-sided], suggesting that CW and PW had more likelihood to cracking than BW [Table 2], suggesting that cheese coated with CW and PW shrunk more than cheese coated with BW. It is feasible that shrinkage of cheese releases empty spaces between coatings and cheese surfaces, weakening coatings support and they become more susceptible to cracking.
Microcracks might appear in brittle materials, such as CW, which do not resist deformation after liquid–solid transition. BW, however, is viscoelastic, and it is more easily deformed after liquid–solid transition [62]. The greater viscoelasticity of the BW than PW or CW make it more flexible and less susceptible to crack after shrinkage [62]. BW contains a small number of unsaturated hydrocarbons with low melting point such as oleic acid which are responsible for its flexibility [16,43]. They also have been related to resilience and stiffness in BW [58,67]. On this respect, oleic acid has been identified clearly as a minor component in BW and as a trace compound in CW (Figure 1 and Table 1). In Figure 5 major differences in the acid oleic content between BW and CW in the X-ray diffractogram can be observed in a logarithmic scale.

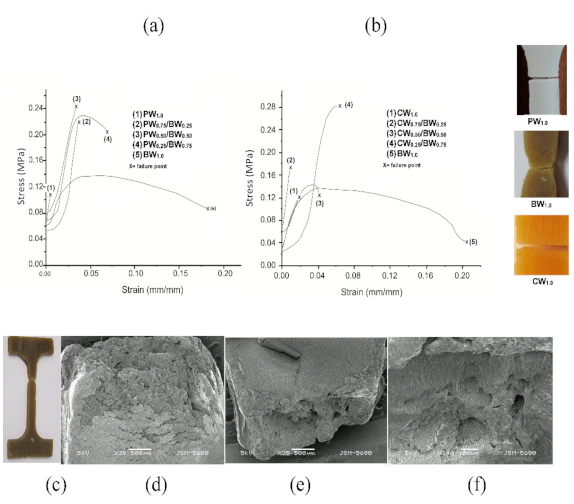
3.2.7. Mechanical Properties and Microstructure of Waxes

Food packaging materials must support handling, shipping and storage to preserve the integrity of the food product. Waxes applied as coatings in cheeses should protect them during storage. Waxes should be resistant to fractures and produce ductile fractures. Mechanical testing showed that BW had a ductile behavior after a stress applied (i.e., capable of deformation without fracture). The other waxes were more resistant to fracture but yield brittle fractures. In the flexural test, specimens of BW1.00 exhibit the highest physical plasticity [see picture of BW1.0 in the bottom of Figure 6, and bent after flexural test, as a result of a great displacement of materials. CW1.00 and PW1.00 exhibited a brittle behavior with increasing loads (Figure 6a,b). Specimens made of wax blends showed stress–strain curves with some plastic deformation because BW was present in the blend, in equal or higher proportion than CW or PW. Samples of PW and CW showed cracks and fractures perpendicular to the applied normal stress (see picture PW1.0 at the bottom of Figure 6). Micrographs of CW in a fractured surface specimen exhibited spherical pores (~20 μm) (see picture of CW1.0 in the bottom of Figure 6). Holes subjected to a uniform stress generally trigger a nucleation and a successive crack formation and propagation [68]. Reassembled pieces are shown in the lower part of Figure 6.
Wax blends containing either BW0.25/CW0.75 or BW0.25/PW0.75 exhibited the highest flexural strength. The results are somewhat opposite to those previously observed [60], who found the highest flexural strength in samples of PW0.25/BW0.75. However, in that study; the speed of the crosshead in the Universal Testing Machine was 10 mm/min, 20 times faster than in our study.
Elongation tests were carried out to obtain additional information of the mechanical properties of waxes (Figure 7) [69]. Micrographs of BW showed rearrangements of materials flowing aligned in the direction of the axial shear forces (Figure 7c,f). A principal effect of plasticity is to truncate the elastic stress distribution by limiting the shear stress to the flow stress [59]. Specimens of PW1.00 and CW1.00 after elongation test behave as brittle and highly susceptible materials to cracking. Elongation test was more sensitive to stress than the tensile test [~10 times]. The stress–strain curves of specimens made of BW0.5/PW0.5 or BW0.5/CW0.5 behave as brittle materials (Figure 7a,b); they got fractured after deforming elastically. Brittle materials generally exhibit failure with stress as low as 5% (0.05 mm/mm) of axial load.
Wax blends containing either BW0.5/CW0.5 or BW0.5/PW0.5 were within this category. Specimens containing higher amounts of BW such as BW0.75/CW0.25 or BW1.0 behave as ductile materials. Samples of BW1.00 exhibited the highest plastic deformation with an elongation of approximately 10%; after reaching its maximum capacity, they gradually got deformed forming a neck and failed in a cup-and-cone fracture, which is indicative of plastic deformation (Figure 7c,f). The conical tip and the cracked bands on the sides of the conical tip are evidence of highly plastic materials [70]; (Figure 7d,f). Cracked bands are formed when samples are being stretched, until they finally break. Chemical and physical properties of waxes depend on the length of alkanes, the ramifications, the unsaturation and the content of other compounds such as alcohols and fatty acids. An experimental study demonstrated that fatty acids confer ductile properties to BW [58], because the experimental removal of the fatty acids from BW diminished yield stress, resilience and stiffness [58]. Fatty acids such as oleic acid have lower melting point, density and viscosity than the other components. In this study, oleic acid was identified in both BW and CW, although the XRD signal for CW could barely be seen.
Materials in contact with foods or medicines or biological matrices should fulfil various characteristics according to the functionality that they will have [62].
Like other natural materials with the characteristics of flexibility and strength for optimal performance, BW and mixtures are the preferred materials used in cheese protection due to their flexibility and strength. As with other natural material, it can be re-used or composted after use [71].

4. Conclusions

The present study describes some chemical and physical characteristics of BW, CW, PW and blends related to their behavior as cheese coatings. Single BW consists of a heterogeneous mixture of alkanes with esters, free fatty acids, and carboxylic acids. It has the broadest melting temperature curve; unimodal and without shoulders. The onset of melting temperature was 45.5 °C, a closer value to the room temperature than the other waxes. It has a very high viscosity at the peak of melting temperature. Specimens made of BW exhibited a ductile behavior (plastic deformation) under increasing flexural loads. As a coating for cheese, BW did not show the appearance of fractures during cheese storage. CW had the longest alkanes of the three waxes; they were either straight or nonlinear. CW also has esters, free fatty acids, and carboxylic acids (Figure 5). CW exhibited the highest melting temperature with the sharpest peaks, it begins to melt at 55 °C, a very high temperature above the room temperature; it also has the highest viscosity at temperatures at the peak of the melting temperature. Specimens made of CW resist the highest flexural load, which caused brittle fractures. Inner images of specimens made of CW fractured shows bubbles. As a coating for cheese, CW shows the appearance of fractures during cheese storage. PW had short straight alkanes. PW exhibited the highest enthalpy of fusion. It has the lowest viscosity at the peak of melting temperature. Specimens made of PW resisted the lowest flexural load, which caused a brittle fracture. As a coating for cheese, it shows the appearance of fractures during cheese storage. Specimens made of mixtures of either CW or PW with BW behave differently from single waxes.
The more the BW in the mixture the higher the ductility. Blends 0.5/0.5 were stronger and became partly ductile. Evidence of plasticity or ductility for single BW and wax blends was observed as a flow of materials by Scanning Electron microscopy. Under flexural static loadings, the stress–strain curves of wax blends gradually change behavior from brittle to plastic as the BW content in the blend increases. Cheeses coated with BW or blends containing BW with either CW or PW during storage for 5 weeks’ loss less than 5% of the original cheese weight. Cheeses with single CW and PW lose more than 10% of cheese weight after five weeks. The occurrence of microcracks in CW and PW, likely allowed moisture migration from cheese to the environment, causing the loss of weight, aw and shrinkage of volume of cheeses. Blends containing BW with CW and PW are easy to use, environmentally friendly and provide good mechanical and barrier properties to contribute to a longer shelf life for cheese.

Author Contributions

Conceptualization, A.B. and L.B.; Data curation, A.B., R.M.-T., L.B. and J.E.-D.; Formal analysis, R.M.-T., L.B. and F.A.-F.; Funding acquisition, A.B.; Methodology, A.B.; Supervision, L.B.; Writing—original draft, A.B.; Writing—review & editing, A.B. and L.B. All authors have read and agreed to the published version of the manuscript.

Funding

This research was partially funded by “Queso poro genuino de Balancan S.P.R de R.L”, Consejo de Ciencia y Tecnologia del Estado de Tabasco [CCYTET] and Consejo Nacional de Ciencia y Tecnologia [CONACYT].

Data Availability Statement

The data that support the findings of this study are available from the corresponding author upon reasonable request.

Acknowledgments

The authors acknowledge to A. Morales Espino from LAREC-IFUNAM for the XRD measurements; C. Zorrilla, M. Monroy and M. Aguilar-Franco from the Laboratorio Central de Microscopia, IFUNAM, for obtaining the SEM images; E. Orozco and E. Martinez-Acevedo for the mechanical testing.

Conflicts of Interest

The authors declare no conflict of interest.

References

  1. Mansoori, A.G.; Barnes, H.; Webster, G.M. Petroleum waxes. In Fuels and Lubricants Handbook: Technology, Properties, Performance, and Testing, 2nd ed.; Totten, G.E., Ed.; American Society for Testing & Materials (ASTM): West Conshohocken, PA, USA, 2003; Volume 19, pp. 525–556. [Google Scholar]
  2. Karaman, A.D.; Özer, B.; Pascall, M.A.; Alvarez, V. Recent advances in dairy packaging. Food Rev. Int. 2005, 31, 295–318. [Google Scholar] [CrossRef]
  3. Kevelam, W.J.; Koopmans, W.C.; Meijer, W. Cheese Coating Compositions with Improved Wax Adhesion Properties. European Patent 1642505 B1, 11 November 2009. Available online: https://patents.google.com/patent/EP1642505B1/en (accessed on 18 November 2020).
  4. Poças, M.d.F.; Pintado, M. Packaging and the Shelf Life of Cheese. In Food Packaging and Shelf Life: A Practical Guide, 1st ed.; Robertson, G.L., Ed.; CRC Press: Boca Raton, FL, USA, 2010; pp. 103–126. [Google Scholar]
  5. Fröhlich-Wyder, M.T.; Bisig, W.; Guggisberg, D.; Jakob, E.; Turgay, M.; Wechsler, D. Cheeses with propionic acid fermentation: Chapter 35. In Cheese: Chemistry, Physics and Microbiology, 4th ed.; McSweeney, P., Fox, P., Cotter, P., Everett, D., Eds.; Academic Press: Cambridge, MA, USA, 2017; pp. 889–910. [Google Scholar]
  6. González-Córdova, A.; Yescas, F.; Ortiz-Estrada, C.; Hernández-Mendoza, A.; Vallejo-Cordoba, B. Invited review: Artisanal Mexican cheeses. J. Dairy Sci. 2016, 99, 3250–3262. [Google Scholar] [CrossRef] [Green Version]
  7. Alvarez, V.B.; Pascall, M.A. Packaging. In Encyclopedia of Dairy Sciences, 2nd ed.; Fuquay, J.W., Fox, P.F., McSweeney, P.L.H., Eds.; Academic Press: Cambridge, MA, USA, 2011; pp. 3124–3131. [Google Scholar]
  8. Schneider, Y.; Kluge, C.; Weiβ, U.; Rohm, H. Packaging Materials and Equipment. In The Technology of Cheese Making; Law, B.A., Tamime, A.Y., Eds.; Wiley-Blackwell: Hoboken, NJ, USA, 2010; pp. 413–439. [Google Scholar]
  9. Hui, Y.H. Fermented Animal Products and Their Manufacture. In Handbook of Animal-Based Fermented Food and Beverage Technology; CRC Press: Boca Raton, FL, USA, 2012; pp. 3–30. [Google Scholar]
  10. Yilmaz, F.; Dagdemir, F.E. The effects of beeswax coating on quality of Kashar cheese during ripening. Int. J. Food Sci. Technol. 2012, 47, 2582–2589. [Google Scholar] [CrossRef]
  11. Costa, M.J.; Maciel, L.C.; Teixeira, J.A.; Vicente, A.A.; Cerqueira, M.A. Use of edible films and coatings in cheese preservation: Opportunities and challenges. Food Res. Int. 2018, 107, 84–92. [Google Scholar] [CrossRef] [PubMed] [Green Version]
  12. Fox, P.F.; Guinee, T.P.; Cogan, T.M.; Mc Sweeney, P.L. Fundamentals of Cheese Science, 4th ed.; Springer: Boston, MA, USA, 2017; pp. 185–229. [Google Scholar]
  13. Todaro, M.; Palmeri, M.; Cardamone, C.; Settanni, L.; Mancuso, I.; Mazza, F.; Scatassa, M.L.; Corona, O. Impact of packaging on the microbiological, physicochemical and sensory characteristics of a “pasta filata”cheese. Food Packag. Shelf 2018, 17, 85–90. [Google Scholar] [CrossRef]
  14. Wang, J.; Severtson, S.J.; Geil, P.H. Brittle–ductile transitions and the toughening mechanism in paraffin/organo-clay nanocomposites. Mater. Sci. Eng. A 2007, 467, 172–180. [Google Scholar] [CrossRef]
  15. Donhowe, G.; Fennema, O. Water vapor and oxygen permeability of wax films. J. Am. Oil Chem. Soc. 1993, 70, 867–873. [Google Scholar] [CrossRef]
  16. Irvine, O.R.; Bullock, D.H.; Edmond, R.E. Paraffin and Microcrystalline Waxes as Cheese Coating Materials. Can. J. Agric. Sci. 1955, 35, 153–167. [Google Scholar]
  17. Bernal, J.; Jimenez, J.J.; Del Nozal, M.J.; Toribio, L.; Martin, M.T. Physico-chemical parameters for the characterization of pure beeswax and detection of adulterations. Eur. J. Lipid Sci. Technol. Eur. 2005, 107, 158–166. [Google Scholar] [CrossRef]
  18. Toro-Vazquez, J.F.; Morales-Rueda, J.A.; Dibildox-Alvarado, E.; Charó-Alonso, M.; Alonzo-Macias, M.; González-Chávez, M.M. Thermal and Textural Properties of Organogels Developed by Candelilla Wax in Safflower Oil. J. Am. Oil Chem. Soc. 2007, 84, 989–1000. [Google Scholar] [CrossRef]
  19. Xie, B.; Zhang, X.; Luo, X.; Wang, Y.; Li, Y.; Li, B.; Liu, S. Edible coating based on beeswax-in-water Pickering emulsion stabilized by cellulose nanofibrils and carboxymethyl chitosan. Food Chem. 2020, 331, 127108. [Google Scholar] [CrossRef]
  20. Oliveira, V.R.L.; Santos, F.K.G.; Leite, R.H.L.; Aroucha, E.M.M.; Silva, K.N.O. Use of biopolymeric coating hydrophobized with beeswax in post-harvest conservation of guavas. Food Chem. 2018, 259, 55–64. [Google Scholar] [CrossRef]
  21. Velickova, E.; Winkelhausen, E.; Kuzmanova, S.; Alves, V.D.; Moldão-Martins, M. Impact of chitosan-beeswax edible coatings on the quality of fresh strawberries (Fragaria ananassa cv. Camarosa) under commercial storage conditions. LWT-Food Sci. Technol. 2013, 52, 80–92. [Google Scholar] [CrossRef]
  22. Zhang, W.; Xiao, H.; Qian, L. Enhanced water vapour barrier and grease resistance of paper bilayer-coated with chitosan and beeswax. Carbohydr. Polym. 2014, 101, 401–406. [Google Scholar] [CrossRef]
  23. Aguirre-Joya, J.A.; Álvarez, B.; Ventura, J.M.; García-Galindo, J.O.; De León-Zapata, M.A.; Rojas, R.; Saucedo, S.; Aguilar, C.N. Edible Coatings and Films from Lipids, Waxes, and Resins. In Edible Food Packaging: Materials and Processing Technologies; Ribeiro Cerqueira, M.A.P., Correia Pereira, R.N., da Silva Ramos, O.L., Couto Teixeira, J.A., Vicente, A.A., Eds.; CRC Press: Boca Raton, FL, USA, 2017; pp. 121–152. [Google Scholar]
  24. Aguirre-Joya, J.A.; Cerqueira, M.A.; Ventura-Sobrevilla, J.; Aguilar-Gonzalez, M.A.; Carbó-Argibay, E.; Castro, L.P.; Aguilar, C.N. Candelilla wax-based coatings and films: Functional and physicochemical characterization. Food Bioprocess Technol. 2019, 12, 1787–1797. [Google Scholar] [CrossRef]
  25. Paredes-Lopez, O.; Camargo-Rubio, E.; Gallardo-Navarro, Y. Use of coatings of candelilla wax for the preservation of limes. J. Sci. Food Agric. 1974, 25, 1207–1210. [Google Scholar] [CrossRef] [PubMed]
  26. Rojas-Molina, R.; De León-Zapata, M.A.; Saucedo-Pompa, S.; Aguilar-Gonzalez, M.A.; Aguilar, C.N. Chemical and structural characterization of Candelilla (Euphorbia antisyphilitica Zucc.). J. Med. Plants Res. 2013, 7, 702–705. [Google Scholar]
  27. Cervantes, F.; Villegas, A.; Cesín, A.; Espinoza, A. Los Quesos Mexicanos Genuinos; Mundi-Prensa México: Mexico City, Mexico, 2008. [Google Scholar]
  28. Hernández-Mendoza, A.; Reyes-Díaz, R.; Vallejo-Cordoba, B.; González-Córdova, A.F. Poro de Tabasco Cheese: Chemical Composition and Microbiological Quality during Its Artisanal Manufacturing Process. J. Dairy Sci. 2020, 103, 3025–3037. [Google Scholar] [CrossRef]
  29. Perez Pacheco, F.; Bucio, G.A. Microbial safety of raw milk cheese traditionally made at a pH below 4.7 and with other hurdles limiting pathogens growth. In Current Research, Technology and Education Topics in Applied Microbiology and Microbial Biotechnology; Formatex Research Center: Badajoz, Spain, 2010; pp. 1205–1216. [Google Scholar]
  30. ICDD. Powder Diffraction File; International Centre for Diffraction Data: Newtown Square, PA, USA, 2007. [Google Scholar]
  31. Derrick, M.R.; Stulik, D.; Landry, J.M. Infrared Spectroscopy in Conservation Science; Getty Publications: Los Angeles, CA, USA, 2000. [Google Scholar]
  32. ASTM. Standard Test Method for Measurement of Transition Temperatures of Petroleum Waxes by Differential Scanning Calorimetry [DSC]; Designation D4419-90; ASTM International: West Conshohocken, PA, USA, 2015. [Google Scholar]
  33. ASTM. Standard Test Method for Transition Temperatures and Enthalpies of Fusion and Crystallization of Polymers by Differential Scanning Calorimetry; Designation D3418-15; ASTM International: West Conshohocken, PA, USA, 2015. [Google Scholar]
  34. ASTM. Standard Test Methods for Water Vapor Transmission of Organic Coating Films; Designation D1653-03; ASTM International: West Conshohocken, PA, USA, 2003. [Google Scholar]
  35. Steffe, J.F. Rheological Methods in Food Process Engineering, 2nd ed.; Freeman Press: East Lansing, MI, USA, 1996. [Google Scholar]
  36. ASTM. Standard Test Methods for Density and Specific Gravity [Relative Density] of Wood and Wood-Based Materials; Designation D2395-14; ASTM International: West Conshohocken, PA, USA, 2014. [Google Scholar]
  37. Sward, G.G. Density, Specific Gravity, and Bulking Values. In Paint Testing Manual; ASTM International: West Conshohocken, PA, USA, 1972. [Google Scholar]
  38. ASTM. Standard Specification for ASTM Liquid-In-Glass Thermometers; Designation E1-14; ASTM International: West Conshohocken, PA, USA, 2014. [Google Scholar]
  39. AOAC. Official Methods of Analysis of AOAC International; AOAC: Rockville, MD, USA, 2005. [Google Scholar]
  40. ASTM. Standard Test Method for Evaluating Degree of Cracking of Exterior Paints; Designation D661-93; ASTM International: West Conshohocken, PA, USA, 2005. [Google Scholar]
  41. ASTM. Standard Test Method for Evaluating Degree of Checking of Exterior Paints; Designation D660-93; ASTM International: West Conshohocken, PA, USA, 2011. [Google Scholar]
  42. Bennett, H. Industrial Waxes, Vol. 1; Chemical Publishing Company: Gloucester, MA, USA, 1963. [Google Scholar]
  43. Tulloch, A.P. The composition of BW and other waxes secreted by insects. Lipids 1970, 5, 247–258. [Google Scholar] [CrossRef]
  44. Chibnall, A.C.; Piper, S.H.; Pollard, A.; Williams, E.F.; Sahai, P.N. The constitution of the primary alcohols, fatty acids and paraffins present in plant and insect waxes. Biochem. J. 1934, 28, 2189–2208. [Google Scholar] [CrossRef]
  45. Hodge, W.H. The mexican candelilla wax plant and its wax. Econ. Bot. 1956, 10, 134–154. [Google Scholar] [CrossRef]
  46. Morales-Rueda, J.A.; Dibildox-Alvarado, E.; Charó-Alonso, M.A.; Weiss, R.G.; Toro-Vazquez, J.F. Thermo-mechanical properties of candelilla wax and dotriacontane organogels in safflower oil. Eur. J. Lipid Sci. Technol. 2009, 111, 207–215. [Google Scholar] [CrossRef]
  47. Serrato-Palacios, L.L.; Toro-Vazquez, J.F.; Dibildox-Alvarado, E.; Aragón-Piña, A.; Morales-Armenta, M.R.; Ibarra-Junquera, V.; Pérez-Martínez, J.D. Phase Behavior and Structure of Systems Based on Mixtures of n-Hentriacontane and Melissic Acid. J. Am. Oil Chem Soc. 2015, 92, 533–540. [Google Scholar] [CrossRef]
  48. Dorset, D.L. The crystal structure of waxes. Acta Crystallogr. B Struct. Sci. 1995, 51, 1021–1028. [Google Scholar] [CrossRef] [Green Version]
  49. Dorset, D.L. Crystallography of the Polymethylene Chain: An Inquiry into the Structure of Waxes International Union of Crystallography Monography on Crystallography; Oxford University Press: Oxford, UK, 2005. [Google Scholar]
  50. Zimnicka, B.; Hacura, A. An Investigation of Molecular Structure and Dynamics of Crude Beeswax by Vibrational Spectroscopy. Pol. J. Environ. Stud. 2006, 15, 112–114. [Google Scholar]
  51. Maia, M.; Barros, A.I.; Nunes, F.M. A novel, direct, reagent-free method for the detection of beeswax adulteration by single-reflection attenuated total reflectance mid- infrared spectroscopy. Talanta 2012, 107, 74–80. [Google Scholar] [CrossRef]
  52. Svečnjak, L.; Baranović, G.; Vinceković, M.; Prđun, S.; Bubalo, D.; Gajger, I.T. An approach for routine analytical detection of beeswax adulteration using FTIR-ATR spectroscopy. J. Apic. Sci. 2015, 59, 37–49. [Google Scholar] [CrossRef] [Green Version]
  53. Edwards, H.G.M.; Falk, M.J.P. Fourier-transform Raman spectroscopic study of unsaturated and saturated waxes. Spectrochim. Acta A 1997, 53, 2685–2694. [Google Scholar] [CrossRef]
  54. Svečnjak, L.; Chesson, L.A.; Gallina, A.; Maia, M.; Martinello, M.; Mutinelli Necati Muz, M.; Nunes, F.M.; Saucy, F.; Tipple, B.J.; Wallner, K.; et al. Standard methods for Apis mellifera beeswax research. J. Apic. Res. 2019, 58, 1–108. [Google Scholar] [CrossRef] [Green Version]
  55. Nielsen, S. Food Analysis; Food Science Text Series; Springer: Cham, Switzerland, 2019. [Google Scholar] [CrossRef]
  56. Rodriguez-Saona, L.; Ayvaz, H.; Wehling, R.L. Infrared and Raman Spectroscopy. In Food Analysis, 5th ed.; Nielsen, S., Ed.; Food Science Text Series; Springer: Lafayette, IN, USA, 2017; pp. 107–128. [Google Scholar]
  57. Bernardini, F.; Tuniz, C.; Coppa, A.; Mancini, L.; Dreossi, D.; Eichert, D.; Turco, G.L.; Biasotto, M.; Terrasi, F.; De Cesare, N.; et al. Beeswax As Dental Filling On A Neolithic Human Tooth. PLoS ONE 2012, 7, e44904. [Google Scholar] [CrossRef]
  58. Buchwald, R.; Greenberg, A.R.; Breed, M.D. A biomehanical perspective on beeswax. Am. Entomol. 2005, 51, 39–41. [Google Scholar] [CrossRef] [Green Version]
  59. Masae, M.; Pitsuwan, P.; Sikong, L.; Kooptarnond, K.; Kongsong, P.; Phoempoon, P. Thermo-physical characterization of paraffin and beeswax on cotton fabric. Sci. Technol. Asia. 2014, pp. 69–77. Available online: https://www.tci-thaijo.org/index.php/SciTechAsia/article/view/41129 (accessed on 11 November 2019).
  60. Neidleman, S.L. Effects of temperature on lipid unsaturation. Biotechnol. Genet. Eng. Rev. 1987, 5, 245–268. [Google Scholar] [CrossRef] [Green Version]
  61. Lai, O.M.; Lo, S.K. Thermal Technique: Differential Scanning Calorimetry (DSC). In Modern Techniques for Food Authentication; Sun, D.-W., Ed.; Academic Press: Cambridge, MA, USA, 2008; pp. 543–584. [Google Scholar]
  62. Shellhammer, T.H.; Rumsey, T.R.; Krochta, J.M. Viscoelastic properties of edible lipids. J. Food Eng. 1997, 33, 305–320. [Google Scholar] [CrossRef]
  63. Kamper, S.L.; Fennema, O. Water vapor permeability of edible bilayer films. J. Food Sci. 1984, 49, 1478–1481. [Google Scholar] [CrossRef]
  64. Kester, J.J.; Fennema, O. Resistance of lipid films to water vapor transmission. J. Am. Oil Chem. Soc. 1989, 66, 1139–1146. [Google Scholar] [CrossRef]
  65. Morillon, V.; Debeaufort, F.; Blond, G.; Capelle, M.; Voilley, A. Factors affecting the moisture permeability of lipid-based edible films: A review. Crit. Rev. Food Sci. 2002, 42, 67–89. [Google Scholar] [CrossRef] [PubMed]
  66. Young, H.H.; Rubinstein, D. Wax Composition. U.S. Patent No. 2,394,833, 12 February 1946. Available online: https://patents.google.com/patent/US2394833A/en (accessed on 18 November 2020).
  67. Buchwald, R.; Breed, M.D.; Bjostad, L.; Hibbard, B.E.; Greenberg, A.R. The role of fatty acids in the mechanical properties of beeswax. Apidologie 2009, 40, 585–594. [Google Scholar] [CrossRef] [Green Version]
  68. Chen, J.; Cao, R. Micromechanism of Cleavage Fracture of Metals: A Comprehensive Microphysical Model for Cleavage Cracking in Metals; Butterworth-Heinemann: Waltham, MA, USA, 2015. [Google Scholar]
  69. Kotsiomiti, E.; Mccabe, J.F.J. Experimental wax mixtures for dental use. J. Oral Rehab. 1997, 24, 517–521. [Google Scholar] [CrossRef]
  70. Callister, W.D.; Rethwisch, D.G. Materials Science and Engineering; John Wiley and Sons: New York, NY, USA, 2011. [Google Scholar]
  71. Perdiou, A.S.; Eldin, R.A.; Hajaj, K.R.; Rominu, M.; Sinescu, C.; Negrutiu, M.; Hajaj, T.A. Comparative Evaluation of Stress Resistance Between Nano-hybrid Composite and Ormocer Restorations on Posterior Teeth-in vitro Study. Mater. Plast. 2020, 57, 8–12. [Google Scholar] [CrossRef]
Figure 1. Left: X-ray diffractograms for (a) beeswax, BW; (b) candelilla wax, CW; (c) paraffin wax, PW. Right: Fourier Transform Infrared spectra (FTIR) for (d) BW; (e) CW, and (f) PW.
Coatings 11 00261 g001
Figure 2. Above: DSC plots in a range temperature from room temperature to 100 °C for (a) beeswax, BW, (b) candelilla wax, CW, (c) paraffin wax, PW, heat rate at 5 °C/min. Middle: DSC plots in a range temperature from room temperature to 800 °C for (d) beeswax, BW, (e) candelilla wax, CW, (f) paraffin wax, PW, heat rate at 10 °C/min. Bottom: TGA plots in a range temperature from room temperature to 800 °C for (g) beeswax, BW, (h) candelilla wax, CW, (i) paraffin wax, PW, heat rate at 10 °C/min.
Coatings 11 00261 g002
Figure 3. Viscosity of waxes at (a) 100 °C, (b) 90 °C, (c) 80 °C, (d) 70 °C; and weight loss of cheese coated with (e) PWx/BW1x blend (x = 1.0, 0.75, 0.50, 0.25, 0) and (f) CWx/BW1x blend (x = 1.0, 0.75, 0.50, 0.25, 0).
Coatings 11 00261 g003
Figure 4. Scanned images of cheeses before and after storage. Cheese coating at the beginning of the study and after 5 weeks of storage: Beeswax (BW), candelilla wax (CW), and paraffin wax (PW).
Coatings 11 00261 g004
Figure 5. Composition linked to mechanical properties of beeswax (associated with orange box and arrows), paraffin wax (associated to blue) and candelilla wax (associated with green).
Coatings 11 00261 g005
Figure 6. Flexural stress–strain curves of specimens made of two binary mixtures: (a) CWx/BW1−x, candelilla wax blended with increasing content of beeswax, (b) PWx/BW1 − x, (x = 1.0, 0.75, 0.50, 0.25, 0). Paraffin wax blended with increasing content of beeswax. SEM images showing fractures generated during flexural test of a specimen made of BW1.0, beeswax showing plastic deformation, CW1.0, candelilla wax showing elliptical holes and PW1.0, paraffin showing a typical brittle failure.
Coatings 11 00261 g006
Figure 7. Elongation stress–strain curves of specimens made of (a) PW, paraffin wax blended with increasing content of BW, beeswax; (b) CW, candelilla wax blended with increasing content of BW. Pictures of some fractured specimens of pure waxes (left); (c) Specimen made of BW, showing a failure after elongation test; SEM images of BW showing a: (d) convex region; (e) concave region; (f) amplified concave region.
Coatings 11 00261 g007
Table 1. Characteristics of waxes.
Characteristics of WaxesBWCWPW
Crystal phases identified by Χ-ray Diffraction *---
C29H60 (straight-chain alkane), n-nonacosane (40-1997)XXX
C21H44 (straight-chain alkane), n-heneicosane (31-1705)XXX
C23H48, C25H52 (straight-chain alkanes), n-tricosane, n-pentacosane (53-1798)X-X
C23H48 (straight-chain alkane), n-tricosane (43-1854)X-X
C25H52 (straight-chain alkane) n-pentacosane (53-1793)m-X
C33H68 (straight-chain alkane), n-tritriaacontane (54-1717)-X-
C30H60O2 (straight-chain, saturated fatty acid), triacontanoic acid (34-1796)-X-
C18H34O2 (nonlinear, saturated fatty acid), oleic acid (34-1810)mtr-
C29H50O (terpene), β-sitosterol (10-0545)-X-
Other Physical Characteristics
Peak melting temperature (°C)707666
Enthalpy (J/g)192177.5199.0
Lower temperature limit for melting (°C)45.554.556
Upper temperature limit for melting (°C)88.491.481.9
Density 100 °C (g/cm3)0.820.900.78
Density 25 °C (g/cm3)0.950.980.87
Kinematic viscosity (centistokes) 100 °C8.916.24.6
Kinematic Viscosity (mPa·s) at Various Temperatures
100 °C4.78.301.9
95 °C5.310.12.1
90 °C6.310.92.4
85 °C7.013.12.8
80 °C8.215.73.2
* Note: X = major phase; m = minor phase; tr = trace compound. After the name, the code for PDF (powder diffraction file) of the ICDD database (ICDD, 2007), has been included.
Table 2. Water Vapor Permeance (WVP) and water vapor transmission rate (WVTR) at 30 ± 2 °C.
Conditions80/43% RH * (Dry Cup Method)43/80% RH * (Wet Cup Method)
WaxThickness
Mm
WVP
g / ( m 2 hPa )   × 10 5
WVTR
g/(m2day)
Thickness
mm
WVP
g / ( m 2 hPa )   × 10 5
WVTR
g/(m2day)
BW0.633.2219.420.461.247.00
CW0.784.1834.700.806.6335.01
PW0.580.895.730.551.177.96
BW25/CW750.811.318.910.682.9119.74
BW50/CW500.741.7812.730.501.7713.37
BW75/CW250.762.0315.280.872.4220.05
* RHs are inside and outside the glass vial.
Table 3. Parameters measured in cheeses and wax coatings during storage at 30 °C, 40% RH.
VariablesStatistical Test *Waxes
BWCWPW
Wax weight/cheese weight (% w/w)ANOVA6.16.135.4
Thickness of coatings (mm)ANOVA1.01.00.98
Weight change (%) of cheese after 5 weeks of storageANOVA3.2 A11.6 B11.2 B
Moisture (%)(at 0 weeks of storage)ANOVA34.934.934.9
Moisture (%) (at 5 weeks of storage)ANOVA33.8 C24 A25.7 B
aw (at 0 weeks of storage)ANOVA0.950.950.95
aw (at 5 weeks of storage)ANOVA0.94 C0.87 A0.91 B
Cracks (average of the length of cracks)KW0.11 A132.8 B122.5 B
Area peeled by cracks (% in cheese area)KW0.006 A7. 29 B7.19 B
Area reduction (%)KW0.3 A5.58 B4.84 B
* KW = Kruskal–Wallis test; aw = Water activity. Water activity is defined as follows: aw = P/Po; A,B,C Values within rows with different superscripts differ (P < 0.05) Values without superscripts do not differ.
Publisher’s Note: MDPI stays neutral with regard to jurisdictional claims in published maps and institutional affiliations.

