Article

Attenuation of Barkhausen Noise Emission due to Variable Coating Thickness

by
Katarína Zgútová
* and
Martin Pitoňák
Faculty of Civil Engineering, University of Žilina, Univerzitná 1, 01026 Žilina, Slovakia
*
Author to whom correspondence should be addressed.
Coatings 2021, 11(3), 263; https://doi.org/10.3390/coatings11030263
Submission received: 29 January 2021 / Revised: 18 February 2021 / Accepted: 20 February 2021 / Published: 24 February 2021

Abstract

:
Monitoring of the stress state of bridges by the use of the Barkhausen noise technique has been already introduced and this method can be adapted for monitoring of component’s overstressing. Measurement of Barkhausen noise on real bridges is carried out through the coating applied as a layer to increase the corrosion resistance of bodies. However, it was found that the thickness of the coating could vary, which in turn affects the Barkhausen noise signals and makes it difficult to assess the real stress state. For this reason, this paper deals with attenuation of Barkhausen noise emission due to variable thicknesses of coatings on the steel S460MC. It was found that increasing the thickness progressively decreases the Barkhausen noise emission and shifts the Barkhausen noise envelopes to the higher magnetic fields. Furthermore, the thickness of the coating also affects the relationship between the tensile stress and the Barkhausen noise.

1. Introduction

Magnetic Barkhausen noise (MBN) is a technique sensitive to the stress state of ferromagnetic bodies [1,2,3]. MBN originates from the irreversible and discontinuous jumps of domain walls (DWs) [4,5]. These jumps can be initiated by an alternating magnetic field and/or oscillating stress and produce electromagnetic (and acoustic) pulses. DWs tend to align along the direction of tensile stresses, which in turn increases MBN in this direction, whereas DWs align perpendicular to the direction of compressive stresses, which decreases MBN in the direction of compressive stresses [3,6]. This behavior explains the sensitivity of MBN towards the different magnitudes and regimes of stresses as has been reported in many studies [1,2,3,7]. This technique has already been introduced as a method capable to assess the real stress state in bridges and other civil constructions. It has been already reported that MBN can be applied for the detection of overstressing in wires [8], the corrosion extent [9], or the assessment of the prestress in real bridges [10]. Overstressing can occur as a result of an aggressive corrosion attack and the consequent reduction of the effective cross section area and the corresponding increase of true stress. Overstressing as a result of heavy corrosion can reach the ultimate strength of components and result in their rupture [11]. Furthermore, rupture of certain components in the structure can redistribute the stress to the neighboring regions and accelerate its collapse [12,13]. In order to improve the corrosion resistance of bridges made of steels, their surface is coated by protective multilayers of variable thickness and composition [14,15]. Due to the quite large dimensions of bridges and the corresponding steel components (being welded together), deposition of these layers is carried out by hand using spraying systems or brushes. It was found that the thickness of the coating could vary, which in turn affects MBN and makes it difficult to assess the real stress state [16]. For this reason, MBN on real bridges has to be measured in different neighboring positions in a certain region of a bridge, and statistical data processing should be carried out.
It is well known that the alterations in the near surface layer can contribute to the MBN. For instance, thermal softening of hardened components increases MBN [17], whereas surface hardening decreases MBN [18,19]. Stupakov [20] reported on the marked contribution of the surface decarburized layer to the MBN, whereas Santa-aho [21] demonstrated a decrease of MBN as a result of the thin layer containing only non-ferromagnetic nitrides on the surface after plasma nitridation. The plasma nitriding process produces a surface layer of several micrometers in thickness and this layer, together with alteration of the underlying diffusion layer, decreases MBN [22,23]. Čillikova et al. [24] also reported about MBN originating from the hardened components subjected to the coating process, and compared samples undergoing different coating regimes and the corresponding thickness of the near surface non-ferromagnetic layer, and the underlying ferromagnetic matrix.
This paper deals with the attenuation of Barkhausen noise emission due to the variable thickness of a non-ferromagnetic coating on the ferromagnetic steel S460MC (U.S. Steel, Košice, Slovakia). This study also investigates how the variable thickness of the coating affects the relationship between the tensile stress and MBN parameters extracted from the raw MBN signals. The employed coating and the technique of its deposition are not novel but conventional in order to model the real conditions on the real bridges investigated before [16]. The novelty of this work can be viewed in investigation of the MBN technique as a promising tool for assessment of the variable coating thickness. Furthermore, the potential of this technique for monitoring the stress state and the superimposing contribution of the sensing coil lift-off due to variable coating thickness is discussed as well. In order to investigate the aforementioned aspects, MBN emission originated from the samples of variable coating thickness in the unloaded state and at the varying amplitude of elastic stresses were analyzed.

2. Experimental Conditions

Experiments were carried out on 7 specimens of width 12 mm, thickness 5 mm, and length 200 mm, made of steel S460MC. Mechanical properties of this steel are as follows: yield strength 540 MPa, ultimate strength 610 MPa, and elongation to break 26.3%. The chemical composition of this steel is indicated in Table 1. The high strength and outstanding formability of this low alloyed steel was obtained during hot rolling. The microstructure of S460MC was composed of fine ferrite grains (appearing white on optical images) and a limited volume of pearlite islands (appearing dark on optical images) as Figure 1 illustrates.
Apart from the uncoated sample, the samples were subjected to the deposition of coatings of different thickness (Hempadur 17360 two-component zinc rich epoxy primer, Hempel A/S, Lyngby, Denmark). The coating cures to a hard wearing and highly weather-resistant coating. In order to simulate the variation of coating thickness on the real bridge, the aforementioned Hempadur 17360 was deposited on the sample’s surface. The nominal thickness of the multilayer on the real bridge was 240 μm. However, it was found that the real thickness on the real bridge investigated in the previous study [16] varied from 220 up to 450 μm (measured by the CM-8825FN, Guangzhou Landtek Instruments Co. Ltd., Guangzhou, China) since the deposition process was made via the handmade spraying. For this reason, the samples were coated under the same conditions in the same company as that spraying the bridge investigated before in [16]. A 24-h time period was allowed between the consecutive depositions (in order to dry each layer before the next deposition). The thickness of the coating on the sample was measured after each deposition step and the samples were removed from the spraying after the different number of spraying cycles in order to vary the thickness of the coating. The number of layers varied from 2 (for the thinnest coating) up to 4 (for the thickest coating). The final thickness of the coating (and the consecutive growth of coating thickness) was measured by the use of a coating thickness gauge CM-8825FN in five different positions. This gauge uses magnetic induction and the eddy current principle to measure the thickness of magnetic coatings on a non-magnetic base, and non-magnetic coatings on a magnetic base. The thickness of the coatings was varied (see Table 2) in order to match the coating thickness range found on a real bridge (investigated in [16]).
MBN was analyzed by the use of a RollScan 350 (Stresstech, Jyväskylä, Finland) and analyzed with MicroScan 600 software magnetisation voltage 16 V, frequency 125 Hz, sensor type S1-18-12-01, frequency range of MBN pulses in the range 20–1000 kHz). MBN values were obtained by averaging 6 MBN bursts (3 magnetizing cycles). MBN refers to the rms (effective) value of the signal. The hot rolling process produces sheets of typical magnetic anisotropy where the easy axis of magnetization can be found in the rolling direction (RD), whereas the hard axis of magnetization is referred to as TD (transversal, perpendicular to the RD). For this reason, MBN was measured in the RD and TD directions. In addition to the conventional MBN parameter (rms value of the signal), the number of MBN pulses, the peak position (PP), and full width at half maximum (FWHM) of the MBN envelope were also analyzed. The PP of MBN usually refers to the position of the magnetic field in which the MBN envelope attains the maximum. MBN measurements were carried out on the unloaded and loaded samples. The samples were loaded by progressively increasing the uniaxial tensile stresses (TS) from 0 up to 300 MPa, with a regular step of 25 MPa (in the elastic regime of loading only), by the use of an Instron 5985 device (Instron, Norwood, MA, USA) (see Figure 2).
To observe the thickness of coating by the use of light microscopy (LM, Olympus SZx16 and Zeiss AxioCam MRc5, Boston Microscopes, MA, USA), all coated samples were investigated along the sample’s width. The samples were cut by the use of a Struers Secotom-50 (Struers Inc., Cleveland, OH, USA) and routinely prepared for metallographic observation: hot molded, ground, polished and etched by 3% Nital for 5 s.

3. Results of Experiments and Their Discussion

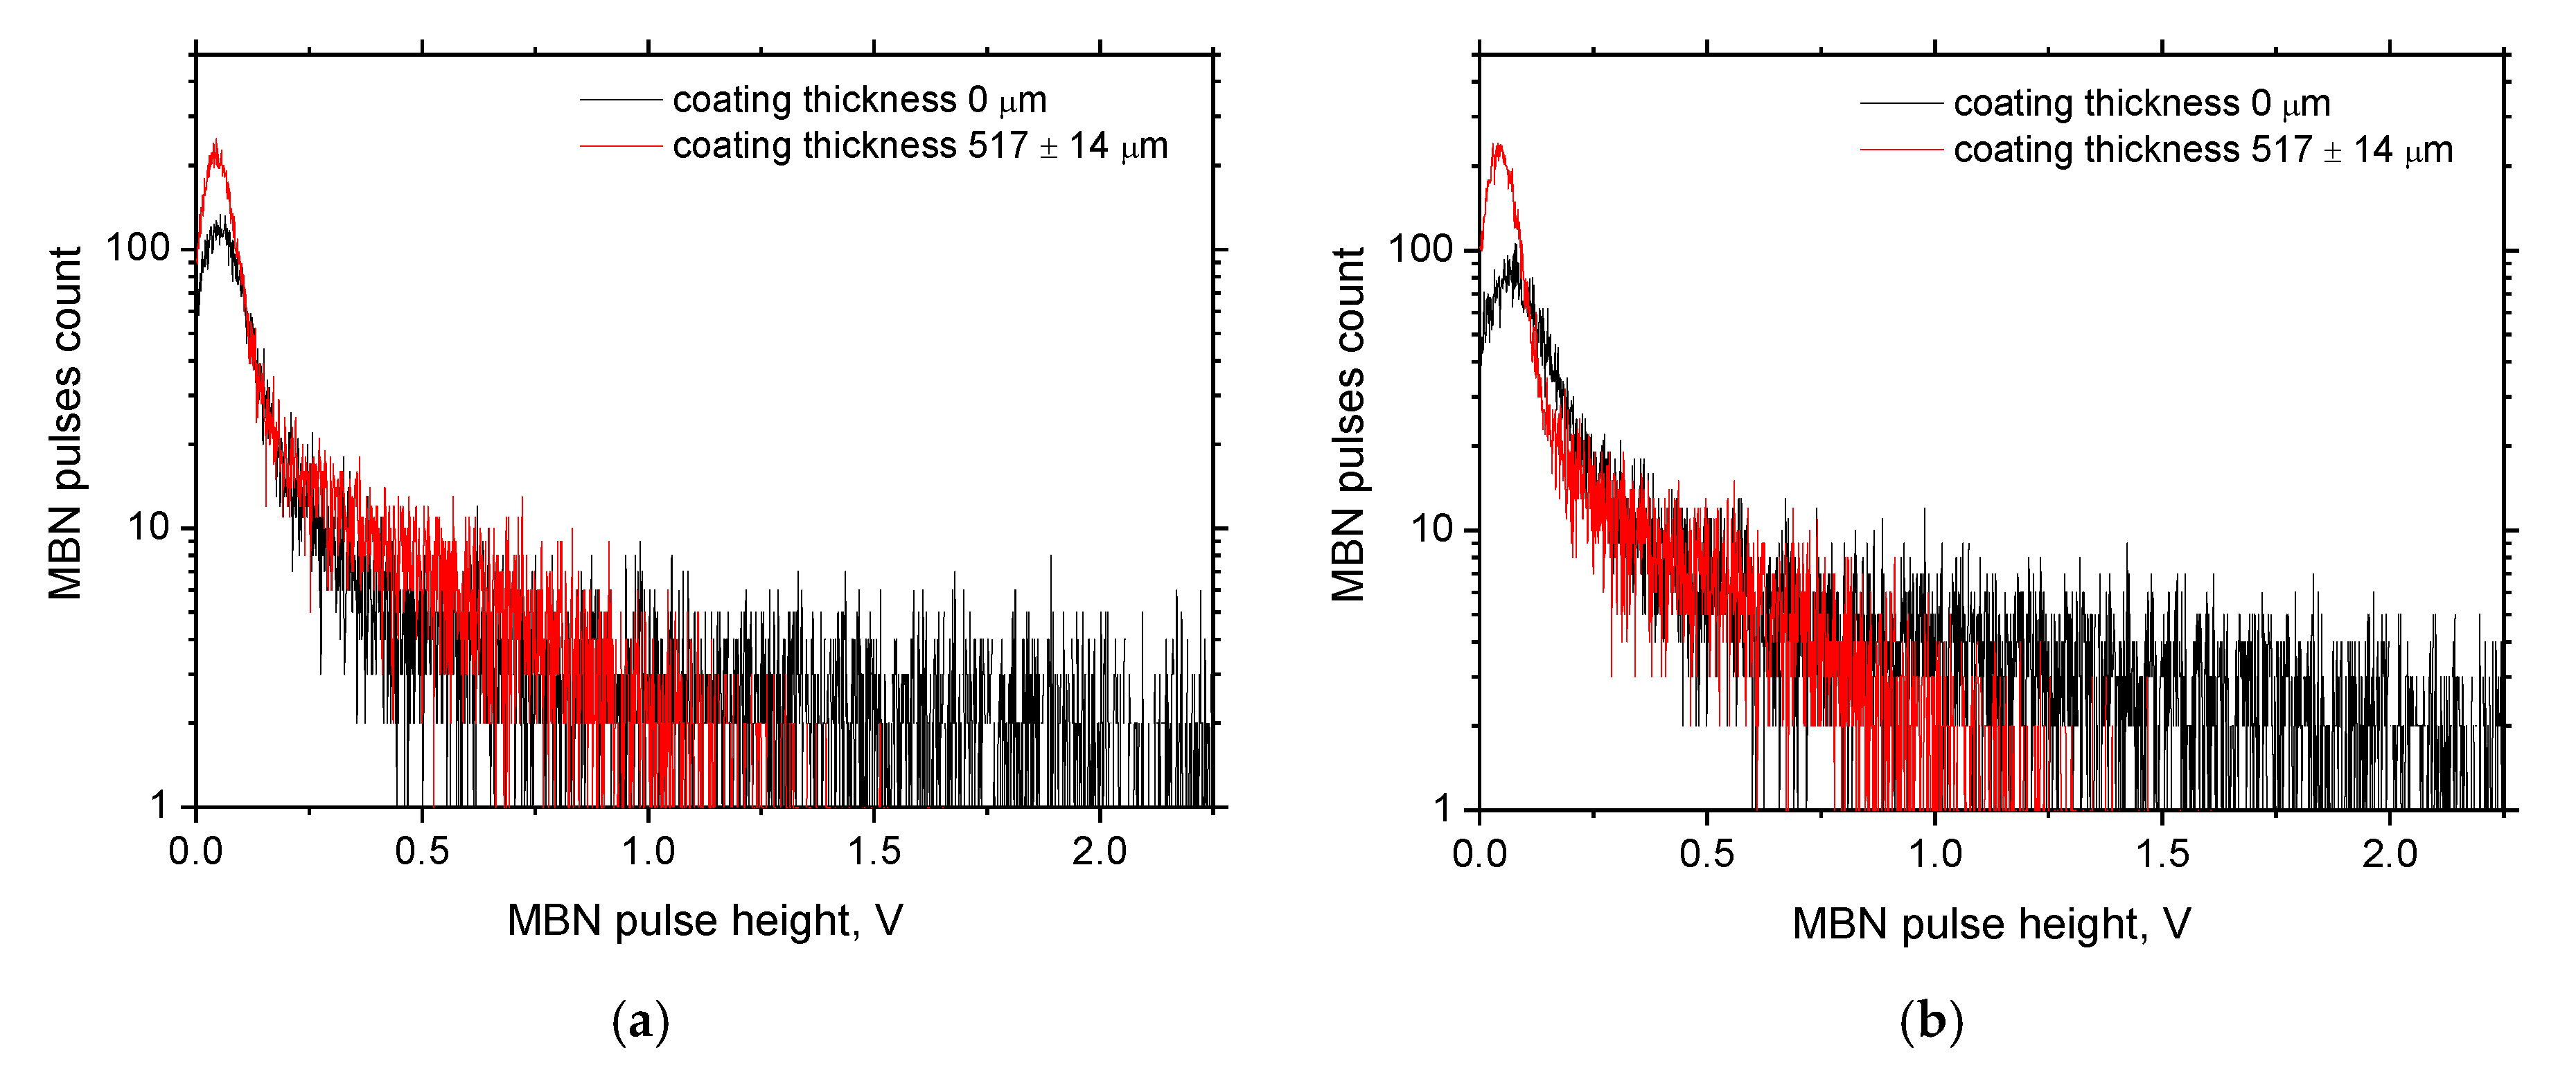
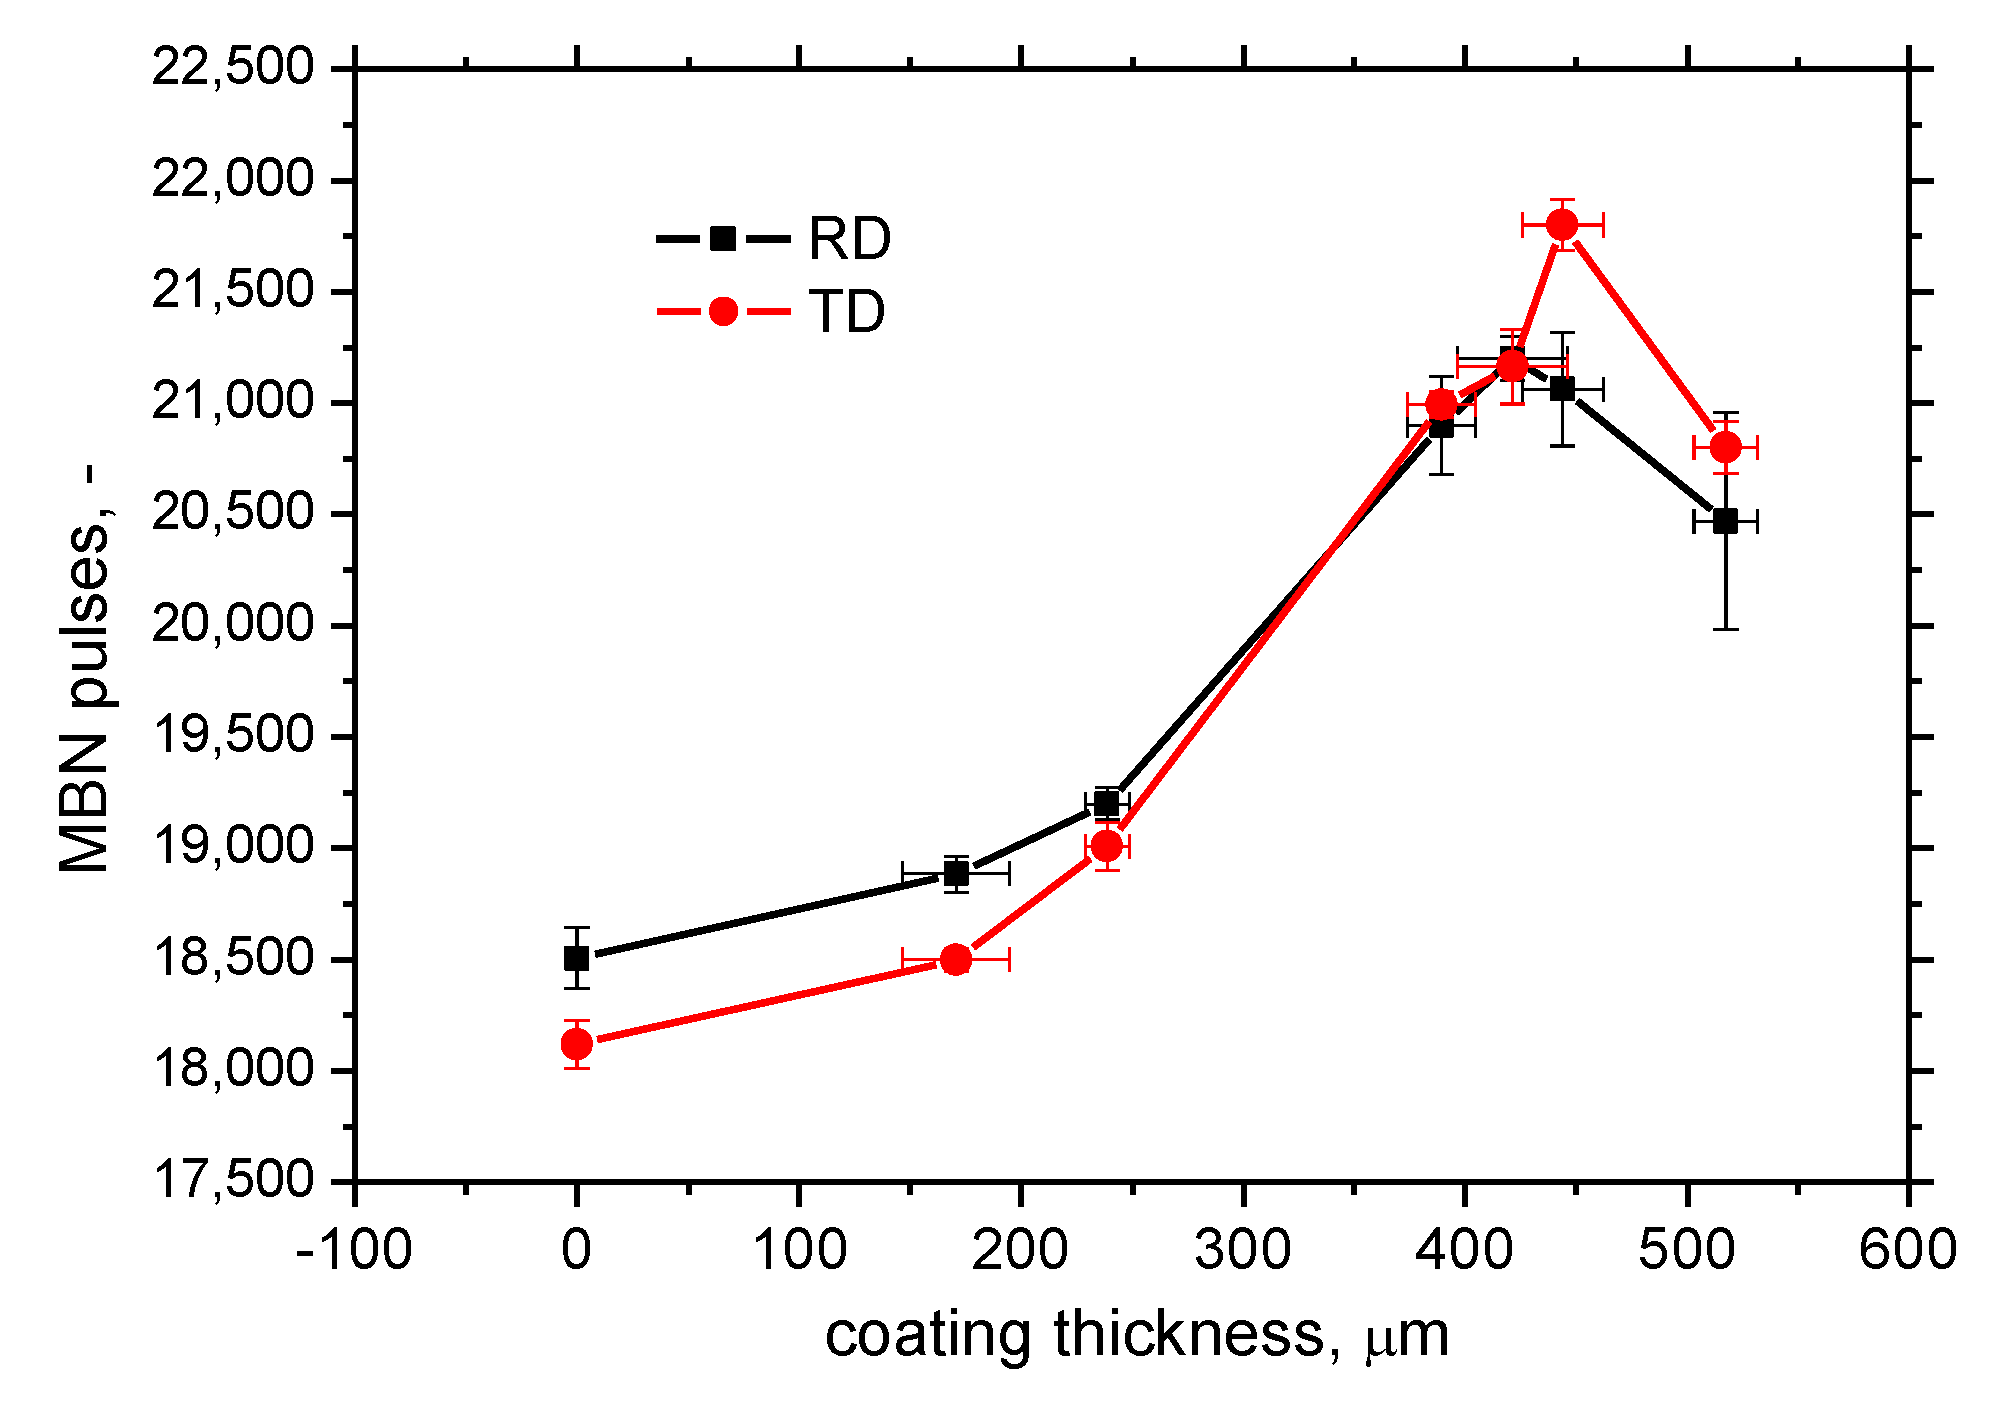
3.1. Unloaded Samples
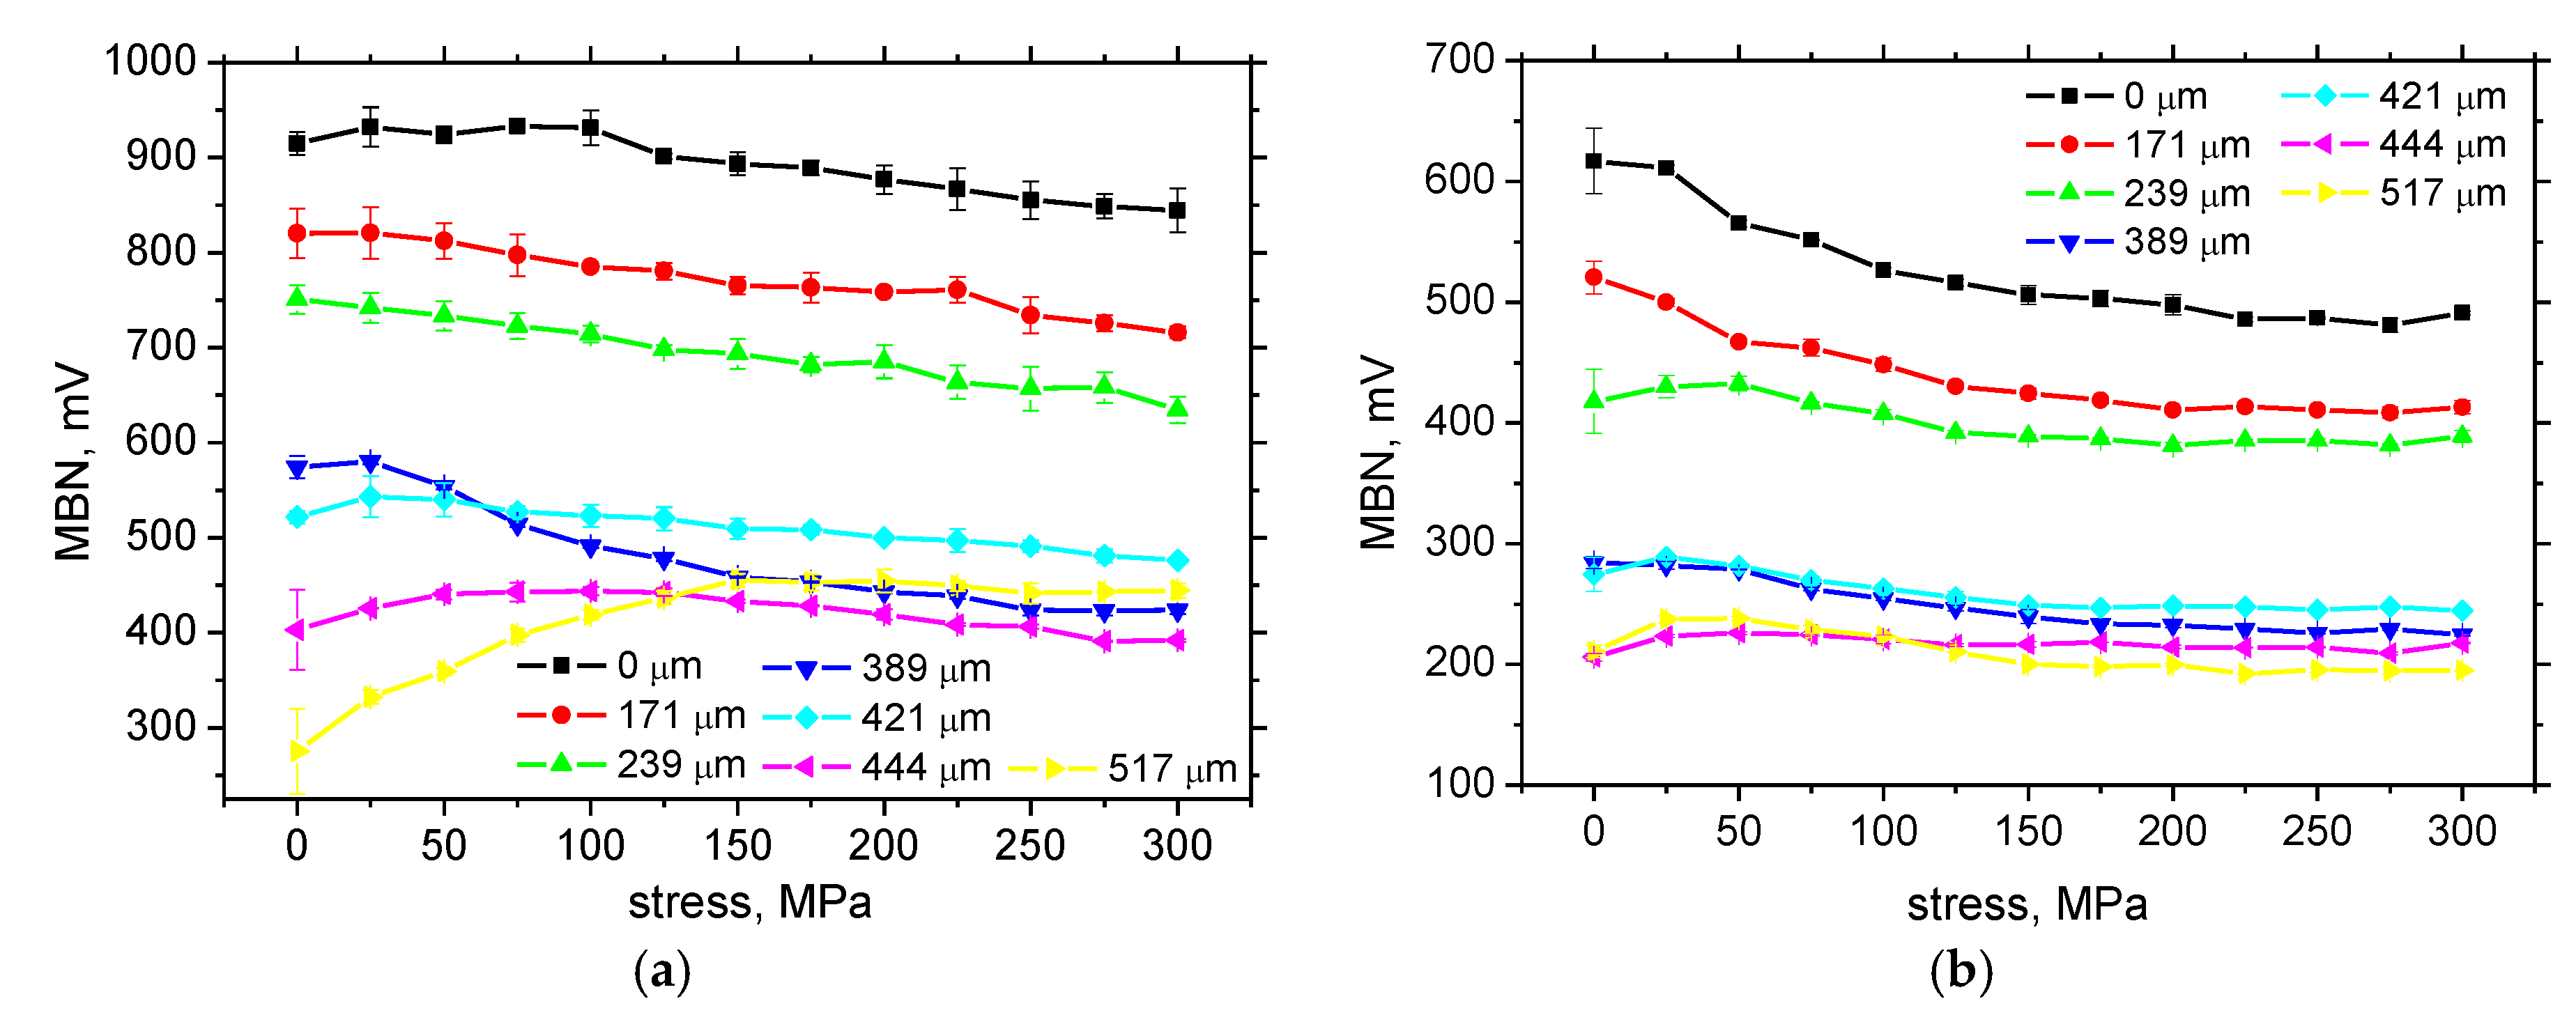
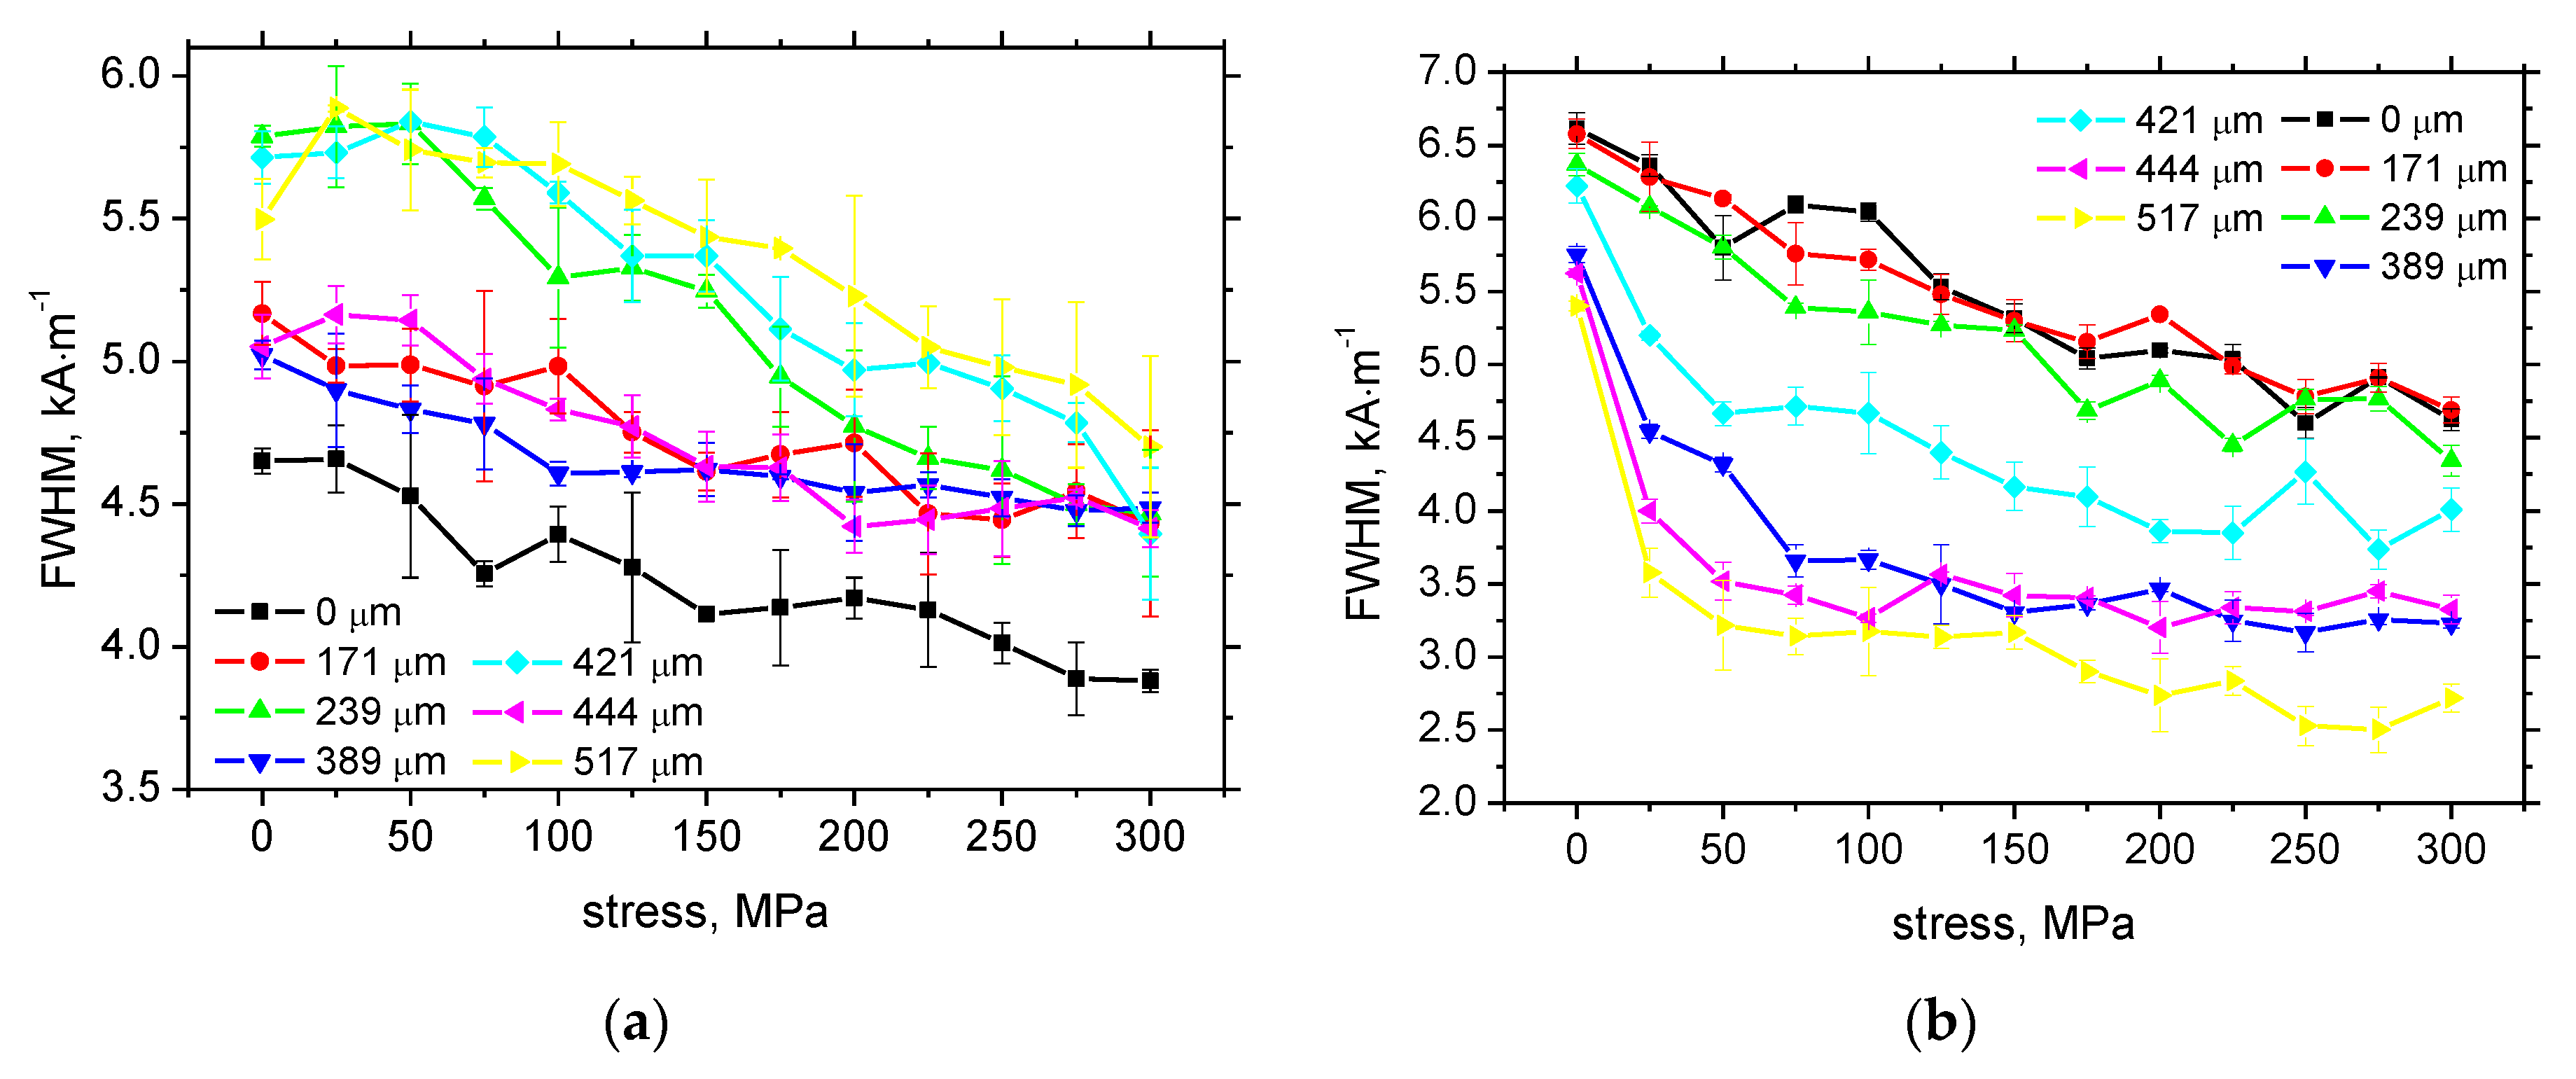
Figure 3 illustrates the variable final thickness of the coating and the contribution of each layer to the final thickness. This figure also demonstrates the presence of air gaps between the neighboring layers of variable thickness. Figure 4 depicts the good correlation between the thickness of the coating measured by the use of the thickness gauge CM-8825FN, and the corresponding LM observation. The red line in Figure 4 represents the best fit as the boundary in which the coating thickness measured by the use of the thickness gauge CM-8825FN and LM were equal. It can be seen that the thickness of the coating measured by the use of the thickness gauge CM-8825FN was a little bit lower than that obtained from the LM observations.
Figure 5 clearly demonstrates that MBN progressively decreases along with the increasing coating thickness. MBN for the RD are higher as compared with the TD due to the strong magnetic anisotropy produced by hot rolling, and the corresponding preferential DWs alignment in RD. This figure also depicts that the difference between RD and TD reduces for the coatings of the higher thickness. It is worth to mention that the MBN signal originates from the ferromagnetic matrix made of S460MC lying under the non-ferromagnetic multilayer coating (apart from the small contribution of the MBN signal originating from the sensor [25]). The progressive and quite marked decrease of MBN versus increasing coating thickness can be attributed to two main aspects. The first one is associated with the increasing gap between the pick-up sensor and the ferromagnetic surface of S460MC, which makes the magnetic field weaker in the near surface as well as subsurface layers. For this reason, some DWs remain unpinned and produce zero MBN signals. The weaker magnitude of the magnetizing field also decreases the speed at which the magnetizing field H alternates with time t (dH/dt), as the force initiating the DWs unpinning and affecting their free path of motion [26]. The second aspect is associated with the attenuation of the produced MBN pulses. It should be considered that the electromagnetic pulses initiated by the alternating magnetic field propagate towards the free surface through the coating (through the underlying layers and air gaps), and their magnitude decreased along with increasing distance between the surface of the ferromagnetic S460MC and pick-up coil, which was equal to the coating thickness.
Figure 6 illustrates that the increasing coating thickness also altered the MBN envelopes. The maximum of these envelopes was shifted towards the higher magnetic fields, and the maximum was reduced. The progressive shift of the envelope’s maximum corresponds with PP as illustrated in Figure 7. The main reason is due to the coating on the steel surface, which makes the real magnetic fields in the ferromagnetic matrix weaker. Hence, the DWs unpinning occurred later at stronger magnetic fields during the cyclic magnetization within the hysteresis loop. The decreasing maximum of the MBN envelopes was mainly due to weaker real magnetic fields in the sample (some DWs remain unpinned) and the superimposing contribution of the attenuation of electromagnetic pulses during their propagation towards the free surface.
Figure 6 and Figure 7 show that the samples seem to behave as harder from the magnetic point of view (shift of MBN envelopes to the higher magnetic fields and increasing PP). However, in reality, the magnetic and the corresponding mechanical hardness of the ferromagnetic matrix remained unchanged, and the evolution of MBN envelopes and the corresponding PP is driven by the opposition of the coating against magnetization and the MBN signal acquisition.
Finally, it can be seen that PP in the TD are higher as compared with the RD (see Figure 7) since RD represents the easy axis of magnetization, whereas TD represents the hard one as a result of the predominating crystallographic orientation of S460MC after hot rolling, and the corresponding DWs alignment in the RD [27,28,29]. Therefore, stronger magnetic fields are needed to initiate DWs motion in the TD. Figure 7 also shows that the degree of magnetic anisotropy (expressed in PP) decreases along with the coating thickness, and completely disappears for the higher coating thicknesses.
Evolution of FWHM as the MBN feature obtained from MBN envelopes did not exhibit an unambiguous tendency versus coating thickness (see Figure 8). This parameter refers to the width of magnetic field (half of this width) in which the MBN pulses can be detected. Local maximums in the evolutions for RD and TD make it difficult to distinguish among the different thickness of coatings. On the other hand, the MBN pulses height distribution exhibits a systematic evolution when the MBN pulses of high strength tend to disappear at the expense of an increasing number of weaker ones (in RD and TD, see Figure 9 and Figure 10). The decreasing strength of the MBN pulses versus coating thickness is driven by the increasing degree of MBN signal attenuation and corresponds with the aforementioned explanations. However, the increasing number of MBN pulses is controversial. Due to the decreasing MBN versus coating thickness, it can be reported that the increasing number of MBN pulses of low height dominate over the decreasing (or missing) number of MBN pulses of high height [9,30]. One might expect that the number of MBN pulses versus coating thickness drops down since only stronger pulses are capable of attaining the free surface, whereas the weaker ones are fully attenuated inside the coating and their contribution to the entire MBN emission is zero. It seems that the MicroScan software employs the floating threshold for counting MBN pulses and in this particular case this MBN parameter becomes polluted by the MBN pulses originating from the sensing probe itself.
The number of MBN pulses and their strength are important MBN features since both directly contribute to the MBN as the effective value (rms), which is driven by the synergistic effect of MBN pulses number n, and their magnitude Xi as follows:
r m s = 1 n i = 1 n X i 2
The decreasing MBN along with the increasing coating thickness proves that the increasing number of MBN pulses plays only a minor role, and their reduced magnitude predominates [9,27].

3.2. Tensile Test

The coating on the sample surface alters the relationship of TS versus MBN (and the extracted MBN parameters such as PP and FWHM). Figure 11a demonstrates that the relationship between TS and MBN was flat for lower TS, followed by a moderate decrease of MBN above 100 MPa. It is well known that MBN tended to grow with TS due to the alignment of DWs in the direction of stress. However, such an evolution occurs when the energy of magnetocrystalline anisotropy is more than the magnetoelastic one [4,5,31]. Figure 11a clearly demonstrates that MBN dropped down versus TS for samples with coatings of medium thickness. Expressed in other words, a decreasing MBN versus TS can be detected when the energy of magnetocrystalline anisotropy is fully consumed by the magnetoelastic energy. As soon as the coating thickness attains 389 μm, the initial increase of MBN versus TS can be seen. Amiri et al. [31] reported that at low applied stress, crystal anisotropy plays the main role on the magnetization process and MBN increases, while at higher stresses, stress anisotropy plays the main role and MBN decreases. This means that in the case of the lower tensile stresses, the easy axis is controlled by crystal anisotropy. Thus, the domains and the corresponding domain walls turn into the direction of the magnetic easy axis. On the other hand, at the higher TS, the domain and domain walls are forced to turn into the direction of the new easy axis, which is controlled by stress. Figure 11 demonstrates that the coating on the surface (and its variable thickness) altered the relationship between the aforementioned energies. Figure 11a shows that the region in which MBN was increasing versus TS widened along with increasing coating thickness.
Evolution of MBN versus TS (Figure 11b) exhibited a mainly descending tendency for the uncoated sample, and the samples of lower coating thickness, followed by a saturation phase for higher TS as a result of the preferential orientation of DWs in the RD. The relationship becomes flatter along with increasing coating thickness. Figure 11 also demonstrates that the differences between the samples with a coating of thickness above 239 μm were low, especially for the higher TS and TD.
The evolution of PP versus TS (see Figure 12a) corresponded with the relationship of MBN versus TS where the decreasing MBN was closely connected with the increasing magnetic hardness of the body, and vice versa [10,28]. For this reason, the progressive decrease of MBN for the uncoated sample (and samples of lower coating thickness) occurred together with increasing PP in RD. As soon as MBN versus TS saturates for the samples of the thicker coating, PP also tended to saturate versus TS. PP versus TS in the TD exhibited poor sensitivity, and hence PP in TD could not be employed for assessment of TS (see Figure 12b).
FWHM in RD exhibited quite good sensitivity of this MBN parameter for assessment of TS (see Figure 13a). This MBN parameter has already been reported as being suitable for assessment of TS when conventional MBN or/and PP exhibit poor sensitivity [32]. Figure 13a illustrates that FWHM progressively decreased with TS, but the FWHM-TS curves were mixed with unambiguous tendency with respect to the variable coating thickness. FWHM in TD also exhibited an acceptable sensitivity of this MBN parameter against TS. FWHM in TD progressively and markedly (nearly linearly) dropped down with TS for the uncoated sample, and the samples with coating of thicknesses of 171 and 239 μm. Samples with the thicker coatings exhibited quite a steep initial drop for lower TS followed by only a moderate decrease, or saturation, for higher TS (see Figure 13b).
Finally, it can be reported that the number of MBN pulses (in RD and TD) remained nearly unchanged along with increasing TS with no marked or valuable progress. Due to poor sensitivity, this MBN parameter is not suitable for assessing the magnitude of TS in this particular case.

4. Conclusions

The presence of a coating on the surface of a bridge made of S460MC steel makes it difficult to assess the real magnitude of TS by the use of MBN technique (and the extracted MBN parameters) alone, when the thickness of the coating varied as a result of application by hand. Figure 11, Figure 12 and Figure 13 clearly demonstrate that MBN, PP, and FWHM did not usually exhibit values, which can be exclusively associated with the exact coating thickness and the superimposed TS as soon as the higher magnitudes of TS (which are more critical with respect of over-stressing), were considered (also taking into consideration the standard deviations of the measured parameters). Relationships of MBN versus TS (in RD and TD) were too flat or/and saturated early. The high PP values in RD for the high TS obtained from the samples of lower coating thickness overlapped with the PP values for the samples of higher coating thickness and low TS. Furthermore, within the whole range of the investigated TS, PP values for the samples of higher coating thickness were not sensitive to TS. FWHM in TD exhibited a progressive decrease for lower coating thicknesses, but FWHM for the higher TS coincide with FWHM for low TS and a high coating thickness. Furthermore, FWHM in TD and the higher coating thickness exhibited early saturation. FWHM in RD exhibited a progressive decrease versus TS within the whole range of TS. However, the missing trend with respect of the variable coating thickness made it impossible to propose the reliable concept in which information about the coating thickness and the superimposed TS could be assessed (by the use of FWHM only).
For these reasons, it should be reported that information obtained from MBN emission (MBN, PP, and FWHM values) should be combined with measurements of the real coating thickness. Figure 4 demonstrates that information about coating thickness obtained from the CM-8825FN gauge fit very well with that obtained from the LM observations. As soon as the thickness of the coating in certain positions was measured by the use of CM-8825FN, the real TS could be assessed by the use of the known calibration curves, such as those illustrated in Figure 11, Figure 12 and Figure 13. It is considered that the multiparametric assessment of TS (by the use of all sensitive MBN parameters such as MBN, PP, and FWHM) would increase the reliability of the proposed concept.
The assessment of true stress through the coating of unknown thickness requires combination of MBN emission with another non-destructive technique. Moreover, the finding of this study could not be directly linked with the real bridges when the mechanical properties of steel or/and the properties of coating (mechanical, physical, chemical, etc.) were remarkably different from those employed in this study.
However, notwithstanding, portability, very fast response (in a few seconds), and execution of monitoring in a quite simple manner can be reported as the main benefits of MBN technique. The MBN technique is sensitive to the variable coating thickness and stress state (or/and microstructure) whereas the ultrasonic, tomography, XRD, eddy current, strain gauge methods, tensile tests, or hardness measurements [33,34,35,36] cannot provide complex information about the investigate body (furthermore, some of them are destructive). Moreover, these techniques mostly cannot be carried in a simple manner directly on the real bridges and assessment of coating thickness and/or stress state is performed in the laboratory only due to limited (or none) portability of sophisticated devices.

Author Contributions

Conceptualization, K.Z.; methodology, K.Z. and M.P.; software, M.P.; validation, K.Z.; formal analysis, K.Z.; investigation, M.P. and K.Z.; resources, M.P.; data curation, K.Z.; writing—original draft preparation, K.Z. and M.P.; writing—review and editing, K.Z. and M.P.; visualization, M.P.; supervision, M.P.; project administration, K.Z. All authors have read and agreed to the published version of the manuscript.

Funding

This research received no external funding.

Informed Consent Statement

Informed consent was obtained from all subjects involved in the study.

Data Availability Statement

The raw data required to reproduce these findings cannot be shared easily due to technical limitations (especially MBN raw signals are too large due to very high sampling frequency). However, authors can share the data on any individual request (please contact the corresponding author by the use of its mailing address.

Conflicts of Interest

The authors declare no conflict of interest.

References

  1. Liu, J.; Tian, G.Y.; Gao, B.; Zeng, K.; Zheng, Y.; Chen, J. Micro-macro characteristics between domain wall motion and magnetic Barkhausen noise under tensile stress. J. Magn. Magn. Mater. 2020, 493, 165719. [Google Scholar] [CrossRef]
  2. Kypris, O.; Nlebedim, I.C.; Jiles, D.C. Measuring stress variation with depth using Barkhausen signals. J. Magn. Magn. Mat. 2016, 407, 377–395. [Google Scholar] [CrossRef]
  3. Karpuschewski, B.; Bleicher, O.; Beutner, M. Surface integrity inspection on gears using Barkhausen noise analysis. Proc. Eng. 2011, 19, 162–171. [Google Scholar] [CrossRef] [Green Version]
  4. Jiles, D. Introduction to Magnetism and Magnetic Materials, 3rd ed.; Taylor & Francis Group: New York, NY, USA, 2016. [Google Scholar]
  5. Chikazumi, S. Physics of Ferromagnetism, 2nd ed.; Oxford University Press: Oxford, UK, 2005. [Google Scholar]
  6. Sorsa, A.; Santa-Aho, S.; Wartiainen, J.; Souminen, L.; Vippola, M.; Leviskä, K. Effect of shot peening parameters to residual stress profiles and Barkhausen noise. J. Non-Destruct. Eval. 2018, 37, 1–11. [Google Scholar] [CrossRef] [Green Version]
  7. Gatelier-Rothea, C.; Chicois, J.; Fougeres, R.; Fleischmann, P. Characterization of pure iron and (130 ppm) carbon-iron binary alloy by Barkhausen noise measurements: Study of the influence of stress and microstructure. Acta Metal. 1998, 46, 4873–4882. [Google Scholar] [CrossRef]
  8. Neslušan, M.; Bahleda, F.; Trojan, K.; Pitoňák, M.; Zgútová, K. Barkhausen noise in over-stressed wires. J. Magn. Magn. Mater. 2020, 513, 167134. [Google Scholar] [CrossRef]
  9. Neslušan, M.; Bahleda, F.; Minárik, P.; Zgútová, K.; Jambor, M. Non-destructive monitoring of corrosion extent in steel rope wires via Barkhausen noise emission. J. Magn. Magn. Mater. 2019, 484, 179–187. [Google Scholar] [CrossRef]
  10. Neslušan, M.; Bahleda, F.; Moravčík, M.; Zgútová, K.; Pastorek, F. Assessment of tendons prestressing after long-term service via the Barkhausen noise technique. Materials 2019, 12, 3450. [Google Scholar] [CrossRef] [Green Version]
  11. Blisťan, P.; Pacaiova, H. Modelling environmental influence on the pipelines integrity. In Proceedings of the 11th International Multidisciplinary Scientific GeoConference, Albena, Bulgaria, 26 June–5 July 2011. [Google Scholar]
  12. Anania, L.; Badala, A.; D’Agata, G. Damage and collapse mode of existing post tensioned precast concrete bridge: The case of Petrulla viaduct. Eng. Struct. 2018, 162, 226–244. [Google Scholar] [CrossRef]
  13. Xu, J.; Sun, H.; Cai, S. Effect of symmetrical broken wires damage on mechanical characteristics of stay cable. J. Sound Vib. 2019, 461, 114920. [Google Scholar] [CrossRef]
  14. Krkoška, L.; Moravčík, M.; Zgútová, K.; Neslušan, M.; Uhričík, M.; Bahleda, F.; Pitoňák, M. Investigation of Barkhausen noise emission in steel wires subjected to different surface treatments. Coatings 2020, 10, 912. [Google Scholar] [CrossRef]
  15. Knudsen, O.; Matre, H.; Dorum, C.; Gagné, M. Experiences with thermal spray zinc duplex coatings on road bridges. Coatings 2019, 9, 371. [Google Scholar] [CrossRef] [Green Version]
  16. Zgútová, K.; Neslušan, M.; Kolářik, K.; Šrámek, J. Non-destructive evaluation of stress state of the highway bridge via Barkhausen noise technique. In Proceedings of the Progress in Mechanics and Materials in Design, 7th International conference on Mechanics and Materials in Design, Albufeira, Portugal, 11–15 June 2017. [Google Scholar]
  17. Neslušan, M.; Čížek, J.; Kolařík, K.; Minárik, P.; Čilliková, M.; Melikhová, O. Monitoring of grinding burn via Barkhausen noise emission in case-hardened steel in large-bearing production. J. Mater. Process. Technol. 2017, 240, 104–117. [Google Scholar] [CrossRef]
  18. Čížek, J.; Neslušan, M.; Čilliková, M.; Mičietová, A.; Melikhova, O. Modification of steel surfaces induced by turning: Non-destructive characterization using Barkhausen noise and positron annihilation. J. Phys. D Appl. Phys. 2014, 47, 1–17. [Google Scholar] [CrossRef]
  19. Santa-aho, S.; Vippola, M.; Sorsa, A.; Leiviskä, K.; Lindgren, M.; Lepistö, T. Utilization of Barkhausen noise magnetizing sweeps for case-depth detection from hardened steel. NDTE Int. 2012, 52, 95–102. [Google Scholar] [CrossRef]
  20. Stupakov, A.; Perevertov, O.; Tomáš, I.; Skrbek, B. Evaluation of surface decarburization depth by magnetic Barkhausen noise technique. J. Magn. Magn. Mater. 2011, 323, 1692–1697. [Google Scholar] [CrossRef]
  21. Sorsa, A.; Santa-aho, S.; Aylott, C.; Shaw, B.A.; Vipplola, M.; Leviskä, K. Case depth prediction of nitride samples with Barkhausen noise measurement. Metals 2019, 3, 325. [Google Scholar] [CrossRef] [Green Version]
  22. Holmberg, J.; Lundin, P.; Ovalisson, J.; Sevim, S. Nondestructive testing of surface characteristics after nitro carburizing of three different steel grades. In Proceedings of the 12th International Conference on Barkhausen noise and Micromagnetic Testing, Dresden, Germany, 24–26 September 2017. [Google Scholar]
  23. Stupakov, A.; Farda, R.; Neslušan, M.; Perevertov, A.; Uchimoto, T. Evaluation of nitride case depth by the magnetic Barkhausen noise. J. Nondestruct. Eval. 2017, 36, 73. [Google Scholar] [CrossRef]
  24. Čilliková, M.; Uríček, J.; Neslušan, M.; Ballo, V.; Mičietová, A. Monitoring of thermal damage after deposition of coatings via Barkhausen noise technique. Acta Phys. Polonica A 2020, 137, 637–640. [Google Scholar] [CrossRef]
  25. Blažek, D.; Neslušan, M.; Mičica, M.; Pištora, J. Extraction of Barkhausen noise from the measured raw signal in high-frequency regimes. Measurement 2016, 94, 456–463. [Google Scholar] [CrossRef]
  26. Varga, R. Domain Walls and Their Dynamics, 1st ed.; Pavol Jozef Šafárik University: Košice, Slovakia, 2014. [Google Scholar]
  27. Manh, T.L.; Caleyo, F.; Hallen, J.M.; Pérez-Benitez, J.A.; Espina-Hernández, J.H. Novel method for the accurate determination of magnetocrystalline energy from Barkhausen noise in ferromagnetic materials. Mater. Sci. Eng. B 2017, 225, 98–107. [Google Scholar] [CrossRef]
  28. Chávez-Gonzalez, A.F.; Martínez-Ortiz, P.; Pérez-Benitez, J.A.; Espina-Hernández, J.H.; Caleyo, F. Comparison of angular dependence of magnetic Barkhausen noise of hysteresis and initial magnetization curve in API5L steel. J. Magn. Magn. Mater. 2017, 446, 18–27. [Google Scholar] [CrossRef]
  29. Caldas-Morgan, M.; Padovese, L.R. Fast detection of the magnetic easy axis on steel sheet using the continuous rotational Barkhausen method. NDTE Int. 2012, 45, 148–155. [Google Scholar] [CrossRef]
  30. Neslušan, M.; Minárik, P.; Grenčík, J.; Trojan, K.; Zgútová, K. Non-destructive evaluation of the railway wheel surface damage after long-term operation via Barkhausen noise technique. Wear 2019, 420–421, 195–206. [Google Scholar] [CrossRef]
  31. Amiri, M.S.; Thielen, M.; Rabung, M.; Marx, M.; Szielasko, K.; Boller, C. On the role of crystal and stress anisotropy in magnetic Barkhausen noise. J. Magn. Magn. Mater. 2014, 372, 16–22. [Google Scholar] [CrossRef]
  32. Šrámek, J.; Neslušan, M.; Bahleda, F.; Zgútová, K.; Schenk, P. Influence of sample size and magnetizing voltage on Barkhausen noise during bending and uniaxial tensile test. Acta Phys. Polonica A 2020, 137, 640–643. [Google Scholar] [CrossRef]
  33. Beamish, D. Coating thickness measurement. Met. Finish. 2000, 98, 559–560. [Google Scholar] [CrossRef]
  34. Bahleda, F.; Bujňáková, P.; Koteš, P.; Hasajová, L.; Nový, F. Mechanical properties of cast-in anchor bolts manufactured of reinforcing tempcore steel. Materials 2019, 12, 2075. [Google Scholar] [CrossRef] [Green Version]
  35. Wang, Y.; Fan, M.; Cao, B.; Ye, B.; Wen, D. Measurement of coating thickness using lift-off point of intersection features from pulsed eddy current signals. NDTE Int. 2020, 116, 102333. [Google Scholar] [CrossRef]
  36. Pietsch, S.; Peter, A.; Wahl, P.; Khinast, J.; Heinrich, S. Measurement of granule layer thickness in a spouted bed coating process via optical coherence tomography. Powder Technol. 2019, 356, 139–147. [Google Scholar] [CrossRef]
Figure 1. Fine ferrite matrix of S460MC, 3% Nital.
Coatings 11 00263 g001
Figure 2. Brief sketch of magnetic Barkhausen noise (MBN) sensor positioning during uniaxial tensile test.
Coatings 11 00263 g002
Figure 3. Metallographic images of coatings. (a) Coating thickness 171 ± 24 μm, (b) coating thickness 239 ± 10 μm, (c) coating thickness 389 ± 15 μm, (d) coating thickness 421 ± 25 μm, (e) coating thickness 444 ± 18 μm, and (f) coating thickness 517 ± 14 μm.
Coatings 11 00263 g003
Figure 4. Correlation between coating thickness obtained from light microscopy (LM) and measured by the use of CM-8825FN gauge.
Coatings 11 00263 g004
Figure 5. Coating thickness (obtained from the LM observation) versus MBN.
Coatings 11 00263 g005
Figure 6. MBN envelopes. (a) Rolling direction (RD) and (b) TD.
Coatings 11 00263 g006
Figure 7. Coating thickness (obtained from the LM observations) versus peak position (PP).
Coatings 11 00263 g007
Figure 8. Coating thickness (obtained from the LM observations) versus full width at half maximum (FWHM).
Coatings 11 00263 g008
Figure 9. MBN pulses height distribution. (a) RD and (b) TD.
Coatings 11 00263 g009
Figure 10. Coating thickness (obtained from the LM observations) versus number of MBN pulses.
Coatings 11 00263 g010
Figure 11. MBN versus tensile stress for the different coating thickness. (a) RD and (b) TD.
Coatings 11 00263 g011
Figure 12. PP versus tensile stress for the different coating thickness. (a) RD and (b) TD.
Coatings 11 00263 g012
Figure 13. FWHM versus tensile stress for the different coating thickness. (a) RD and (b) TD.
Coatings 11 00263 g013
Table 1. Chemical composition of S460MC in wt.%.
FeCMnSiPSAlTiNbV
balance0.0821.0400.0190.0060.0030.0550.0010.0500.054
Table 2. Number of layers and the measured thickness by the use of CM-8825FN.
Number of Layers233334
Measured thickness (μm)171 ± 24239 ± 10389 ± 15421 ± 25444 ± 18517 ± 14
Publisher’s Note: MDPI stays neutral with regard to jurisdictional claims in published maps and institutional affiliations.

