Article

Influence of Microdefect Size on Corrosion Behavior of Epoxy-Coated Rebar for Application in Seawater-Mixed Concrete

1
Institute of Metal Research, Chinese Academy of Sciences, Shenyang 110016, China
2
School of Materials Science and Engineering, University of Science and Technology of China, Hefei 230026, China
*
Author to whom correspondence should be addressed.
Coatings 2021, 11(4), 439; https://doi.org/10.3390/coatings11040439
Submission received: 26 February 2021 / Revised: 25 March 2021 / Accepted: 25 March 2021 / Published: 11 April 2021

Abstract

:
Corrosion behavior of epoxy-coated rebar with different size of microdefects in uncarbonated/carbonated simulated pore solution (U/CSPS) of seawater concrete was investigated. Specimens in both solutions underwent two stages of corrosion, according to the electrochemical impedance spectroscopy (EIS) response. The initial stage was the extension of corrosion. The second stage was dominated by the diffusion process, due to the corrosion products blocking the defects and hindering the transportation of the reaction matter. Local electrochemical impedance spectroscopy (LEIS), scanning vibrating electrode technique (SVET) measurements and the observation of corrosion products indicated that 50 μm might be the threshold, because the corrosion of specimens with defects bigger than 50 μm in diameter was significantly more severe. Crevice corrosion was identified to occur in the experiments. The corrosion products of specimens in USPS and CSPS were mainly Fe3O4 and FeOOH, respectively. α-FeOOH and β-FeOOH exhibited an anion ion-selective property in the corrosion process, which induced crevice corrosion in CSPS. In particular, it is contended herein that Fe3O4 has the cation ion-selective property to protect the substrate in USPS.

1. Introduction

Due to the costs of transportation and fresh water, in far-sea marine construction, seawater and sea sand concrete have been regarded as effective alternatives for ordinary Portland cement-based concrete [1,2]. Despite its economic efficiency and convenience, seawater-mixed concrete introduces more Cl, which has a great impact on the service life of structures in marine environments [3]. Organic coatings have been widely used for the protection of metals as physical barriers between steels and corrosive environments [4,5,6], and epoxy-coated rebar (ECR) is one of the applications. The epoxy is usually formulated with bisphenolamine, applied with electrostatic spraying and cured at over 200 ℃ [7]. It has strong adhesion with the metal, excellent mechanical properties, stable chemical properties, great solvent resistance and alkaline resistance, as well.
However, defects may occur during the preparation, transportation and construction of ECR. Microdefects are very difficult to detect in engineering applications and do exert a negative impact on the service life of reinforced concrete structures. The regions without the protection of the coating are presumed to be where the initiation of corrosion occurs. Corrosion behavior and mechanisms of defective coated steel have been studied extensively. Fernández-Álvarez et al. [8] proposed that the corrosion proceeds by anodic undermining when defective coatings are immersed in 3.5 wt.% NaCl solutions. As the reaction proceeds, oxygen is consumed in cathodic reduction, and corrosion products form in the defect, hindering the transportation of dissolved oxygen. Therefore, these regions are polarized anodically and, in turn, give rise to the formation of cathodic areas [9,10]. Furthermore, as O2 is reduced to OH at the cathodic areas, the dissolution of oxide film on the substrate or degradation of coatings in a high alkalinity environment (pH 10~14) [11] causes the disbonding of coatings [12]. These cathodic areas around the defect will do damage to the coating–substrate adhesion, resulting in the delamination or blistering of coatings [9,13].
Mao et al. [14] suggested that corrosion behavior of ECR with a pinhole defect exhibited three stages when immersed in the uncarbonated/carbonated simulated pore solution. The initial and second stages were controlled by the competitive adsorption of Cl and OH and the concentration of O2, respectively. In the third stage, localized corrosion occurred under the coating around the pinhole, which was probably induced by ion diffusion at the coating/steel interface. Jorcin et al. [15] adopted local electrochemical impedance mapping (LEIM) and found corrosion occurred under the coating away from the scribe defect, as well. The size of an electrode exposed to some aggressive electrolyte (e.g., seawater) has a great influence on the resistance to pitting corrosion [16,17,18]. Zhong et al. [19] proposed that the corrosion process of the coated metal was dependent on the size of the defect: for small defects, e.g., 200 μm in diameter, as indicated by the measured local electrochemical impedance spectroscopy (LEIS) plots, localized corrosion was mainly controlled by the diffusion process, due to the blocking effect of the corrosion products; in the presence of a big defect, e.g., up to 1000 μm in diameter, the blocking effect didn’t apply, due to the relatively open geometry. There is a common misconception that the defect on the coating might induce high local corrosion rates and thus lose some steel cross-section. Arnoud et al. [20] adopted electrochemical impedance spectroscopy (EIS) and scanning vibrating electrode technique (SVET) techniques to investigate the corrosion behavior of coated steel with microcracks and found that the mechanism was uniform corrosion. Sylvia et al. [21] proposed that ECR can prolong the service life of a concrete structure, even in the presence of defects in the epoxy coating.
Corrosion products and the process of their transformation to stable end-products significantly influence the electrochemical corrosion process. In the marine environment, the first step of the corrosion process is proposed to be the formation of FeCl3 or green rust, which further transforms to β-FeOOH by slow hydrolysis [22]. The transformation of β-FeOOH to other iron oxides depends on some extra conditions [23]. Refait et al. [24] found that the final corrosion products, iron oxide and/or oxyhydroxide, are determined by the ratio R′ of [Cl]/[OH]. When the R′ > 1.75, for example, the initial hydroxide was a chloride-containing ferrous hydroxide, probably 2Fe(OH)2·FeOHCl, which also transformed into green rust, later. Besides lepidocrocite, some goethite and akaganeite appeared in increasing quantities with increasing R′.
As mentioned above, there have been many studies about the influence of defective coatings on the steel substrate. However, the research on microdefects, especially those smaller than 200 μm in diameter, has not been carried out yet. In addition, the effect of corrosion products on the mechanism of microdefect corrosion also needs to be studied. In this research, EIS, LEIS and SVET were used to investigate the corrosion behavior of ECR with a microdefect of hundreds, even dozens, of micrometers in diameter. The corrosion products generated in uncarbonated simulated pore solution (USPS) and carbonated simulated pore solution (CSPS) were analyzed to characterize how the corrosion mechanisms worked in different environments. The results and the fundamental knowledge in this study are beneficial for the appropriate application of epoxy-coated rebar in seawater-mixed concrete systems.

2. Experimental

2.1. Materials and Sample Preparation

The reinforcing steel bar used in this experiment is Grade 420 (American grade), and its chemical composition is listed in Table 1. The reinforcing steel bar was cut into a cube with a specimen surface area of 10 mm × 10 mm. The working electrode surface was wet ground with SiC papers from 200 to 800 grits and rinsed with distilled water, dried with an air blower and cleaned with ethanol before coating. The fusion-bonded epoxy used in this study was provided by the Institute of Metal Research, Chinese Academy of Sciences.
Before the electrostatically spraying process, the specimens were preheated to 240 ℃ for 20 min. Then they were covered with the powder epoxy coating and cured at 210 ℃ for 20 min. The thicknesses of the coatings could be controlled by the length of time the electrostatic gun passed over the panel. Specimens with the 200 ± 20 μm coatings were selected, measured by a thickness gauge. All of the coated specimens were tested for defects by an electric spark detector to ensure that the coatings were well-cured. The backs of specimens were connected with a copper wire and mounted in epoxy resin with the coating exposed for electrochemical measurement. A microdefect through the coating of 800, 400, 200, 100 or 50 μm in diameter was made on a specimen, respectively, for the experiment by the laser-beam drilling machine. In this research, the specimens with different defects would be named as those shown in Table 2.

2.2. Experimental Condition

In order to simulate the situation in seawater-mixed concrete with chloride ion penetration and carbon dioxide diffusion in concrete pores, specimens were immersed in the uncarbonated simulated pore solution or carbonated simulated pore solution. The composition and pH of these solutions are shown in Table 3. All experiments were carried out at an average temperature of 25 ℃, and the solutions were replaced with fresh solutions every week.

2.3. Electrochemical Measurements

The electrochemical measurements for the specimens were carried out using a Parstat4000A electrochemical workstation (AMETEK, Berwyn, USA) at 25 °C. A conventional three-electrode electrolytic cell was used in this investigation, consisting of a mounted specimen with an exposure area of 1 cm2 as the working electrode, a platinum sheet (30 mm × 30 mm) as the counter electrode and a saturated calomel electrode (SCE) as the reference electrode. Each experiment was repeated at least three times to make sure of the reproducibility of the experimental data.
The EIS tests were carried out with an amplitude perturbation of 10 mV over the frequency ranging from 100 kHz to 10mHz at open circuit potential (OCP). The concentration for EIS measurements was in a 0.1 M NaCl aqueous solution. The results were analyzed by the Zsimpwin software for data modeling and curve-fitting. Prior to potentiodynamic polarization tests, the working electrode was stabilized by immersion in USPS and CSPS, respectively, for at least 30 min. The potentiodynamic polarization measurements were performed from −0.25 V vs. OCP to +0.8 V vs. SCE at a scan rate of 0.333 mV/s.

2.4. LEIS and SVET Measurements

The LEIS and SVET measurements were performed on a VersaSCAN scanning electrochemical system (AMETEK, Berwyn, USA) in a 0.001 M NaCl aqueous solution with low conductivity (about 70 μS/cm) to optimize resolution. The microprobe with a 5 μm tip moved 50 µm/step over a 3 × 3 mm microdefect-centered region of the electrode surface. The distance between the tip and coating was about 100 µm. For the LEIS measurements, the disturbance amplitude was 10 mV, and the excitation frequency was chosen as 1 kHz. The SVET microprobe was vibrated above the defect at a frequency of 80 Hz with an amplitude of 30 μm. The LEIS and SVET data were calibrated and converted into impedance or current density maps by Origin.

2.5. Microstructure and Chemical Analyses

The coatings were removed by acetone when all of the specimens immersed in the simulated pore solution (SPS) reached the last stage of corrosion. The morphology and elemental composition of the corrosion product were observed and characterized, respectively, by scanning electron microscopy (Philips XL 30 type Field Emission ESEM, FEI, Morristown, NJ, USA) and energy-dispersive X-ray spectroscopy (EDS). Confocal Raman Microscopy (Alpha300R, WITec, Ulm, Germany) and X-ray diffractometer (Bruker D8 DISCOVER, Billerica, MA, USA) were adopted to characterize the chemical composition of the oxide layer. Additionally, specimens with the size of 2 mm × 2 mm × 0.5 mm were used to simulate the dissolution and formation of oxide film at the bottom of the defect. They were preheated to 240 ℃ for 20 min, as well, and then immersed in USPS and CSPS for 2 or 24 h. The thickness and chemical composition of the preheating oxide film before and after immersion in SPS were examined by X-ray photoelectron spectroscopy (Escalab 250, Thermo, Waltham, MA, USA). The sputtering rate of the XPS Ar+ ion beam was about 0.1 nm/s.

3. Results and Discussion

3.1. Electrochemical Properties

3.1.1. Potentiodynamic Polarization Curves

To characterize the corrosion tendency of specimens with different size of microdefect in two kinds of simulated pore solutions, the potentiodynamic polarization experiments were carried out. The specimens were immersed in USPS and CSPS, respectively, for 2 h, and open-circuit potential was stabilized before test. According to the Tafel extrapolation method reported by King et al. [25], the fitting data of potentiodynamic polarization experiments were obtained by CorrView2, and the results are listed in Table 4.
It is shown in Figure 1 and Table 4 that, as the defect diameter downsized, the corrosion potential of the specimens increased, and the corrosion current, on the contrary, decreased in USPS and CSPS. It is obvious that the defect size of the coating determined the corrosion tendency at the initial stage of immersion. The smaller defect meant the smaller damage to the protection of epoxy coatings and the smaller contact region of the corrosive solution and metal substrate. Thus, the dissolution of the preheating oxide film, which was caused by Cl, was alleviated, and the corrosion potential increased. Moreover, the alkalinity of the simulated solution had a crucial influence on the corrosion behavior of the samples. Compared with CSPS, the results exhibited higher corrosion potential and lower corrosion current for the same specimens in USPS. In an environment with high pH, OH dominated in the competitive adsorption with Cl [26], and the oxide film formed on the surface of the substrate, preventing the erosion of Cl. Owing to the protective effect of OH, the smaller-defect samples, such as S200, S100 and S50, in USPS had a minor difference for corrosion potential and current intensity. When exposed to CSPS, the corrosion tendency of S50 was significantly weaker than those with larger defects, based on the much higher corrosion potential and lower corrosion current of S50. It is indicated that alkalinity and defect size are the predominant influence on corrosion behavior in USPS and CSPS, respectively.

3.1.2. EIS Test Results

EIS experiment was adopted to investigate the corrosion behavior of defective samples immersed in USPS and CSPS. The results showed that all of the defective specimens, in both two simulated pore solutions, underwent two corrosion stages. The corrosion process was simulated by two electrochemical equivalent circuits, shown in Figure 2 [27,28].
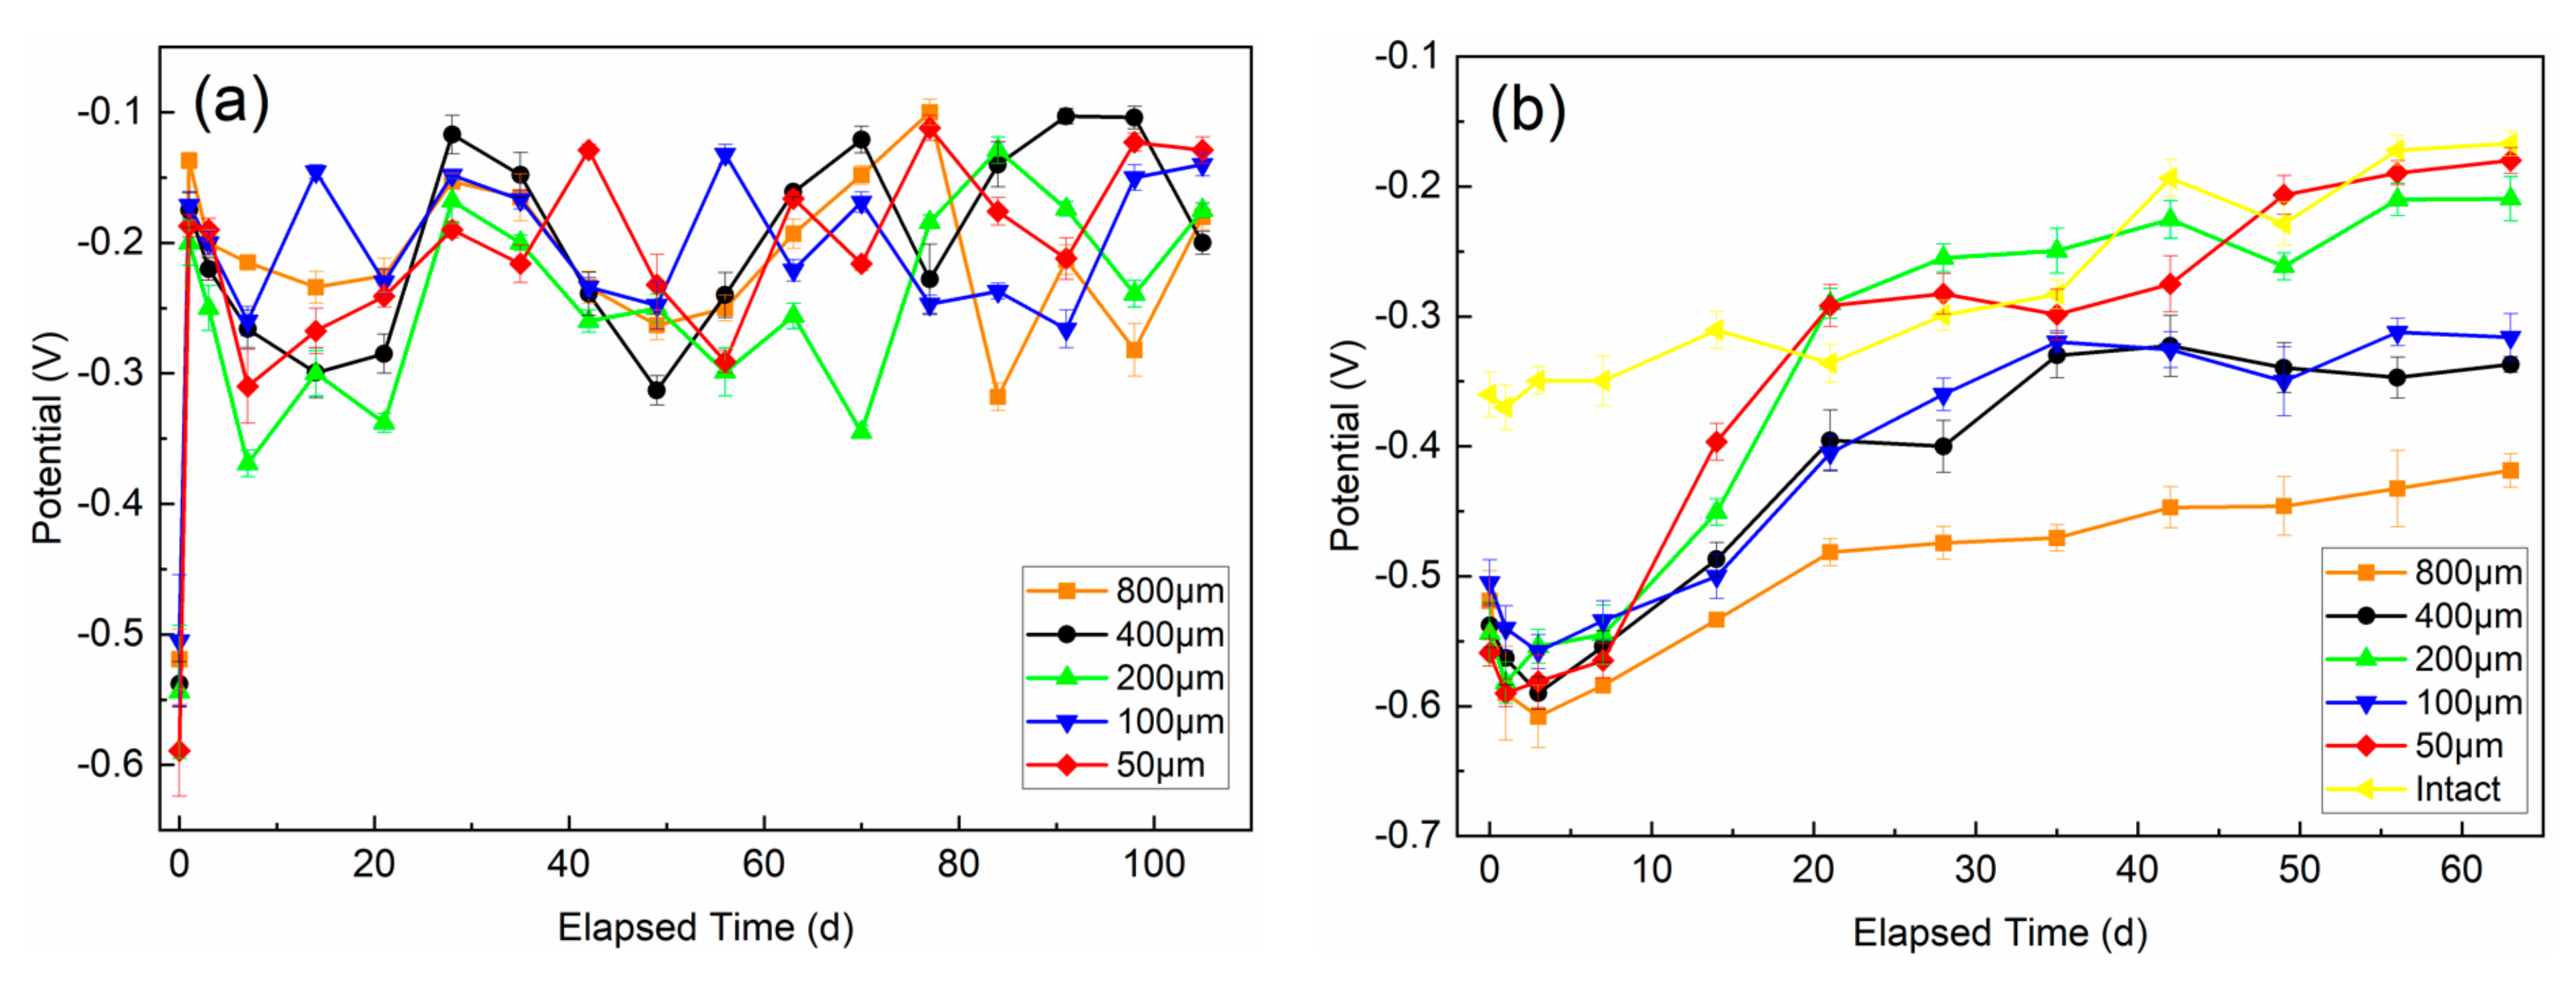
The open-circuit potential was stabilized before every EIS test, and the values of different specimens at different periods were recorded to make OCP versus elapsed time curves in two environments (Figure 3). At the initial stage immersed in USPS, the OCP of specimens increased dramatically and stabilized between −0.1 V and −0.3 V, eventually. The higher alkalinity of USPS made specimens maintain a relatively high OCP, because the substrate at the bottom of the defect was passivated by OH, and the corrosion proceeded relatively slowly. Moreover, the curve in Figure 3a shows more fluctuations, i.e., relatively unstable OCP, which might be caused by the repeated dissolution and formation of corrosion products at the bottom of the defect in the latter corrosion process. By contrast, the OCP values of specimens immersed in CSPS, shown in Figure 3b, decline slightly in the first three days and then increase gradually, distributed from −0.15 V to −0.45 V at last. Compared with USPS, Cl was the dominant influence of the corrosion in CSPS. The oxide film was dissolved, and the OCP decreased at the initial stage. As the preheating oxide film was consumed and new corrosion product layers formed, the OCP increased gradually.
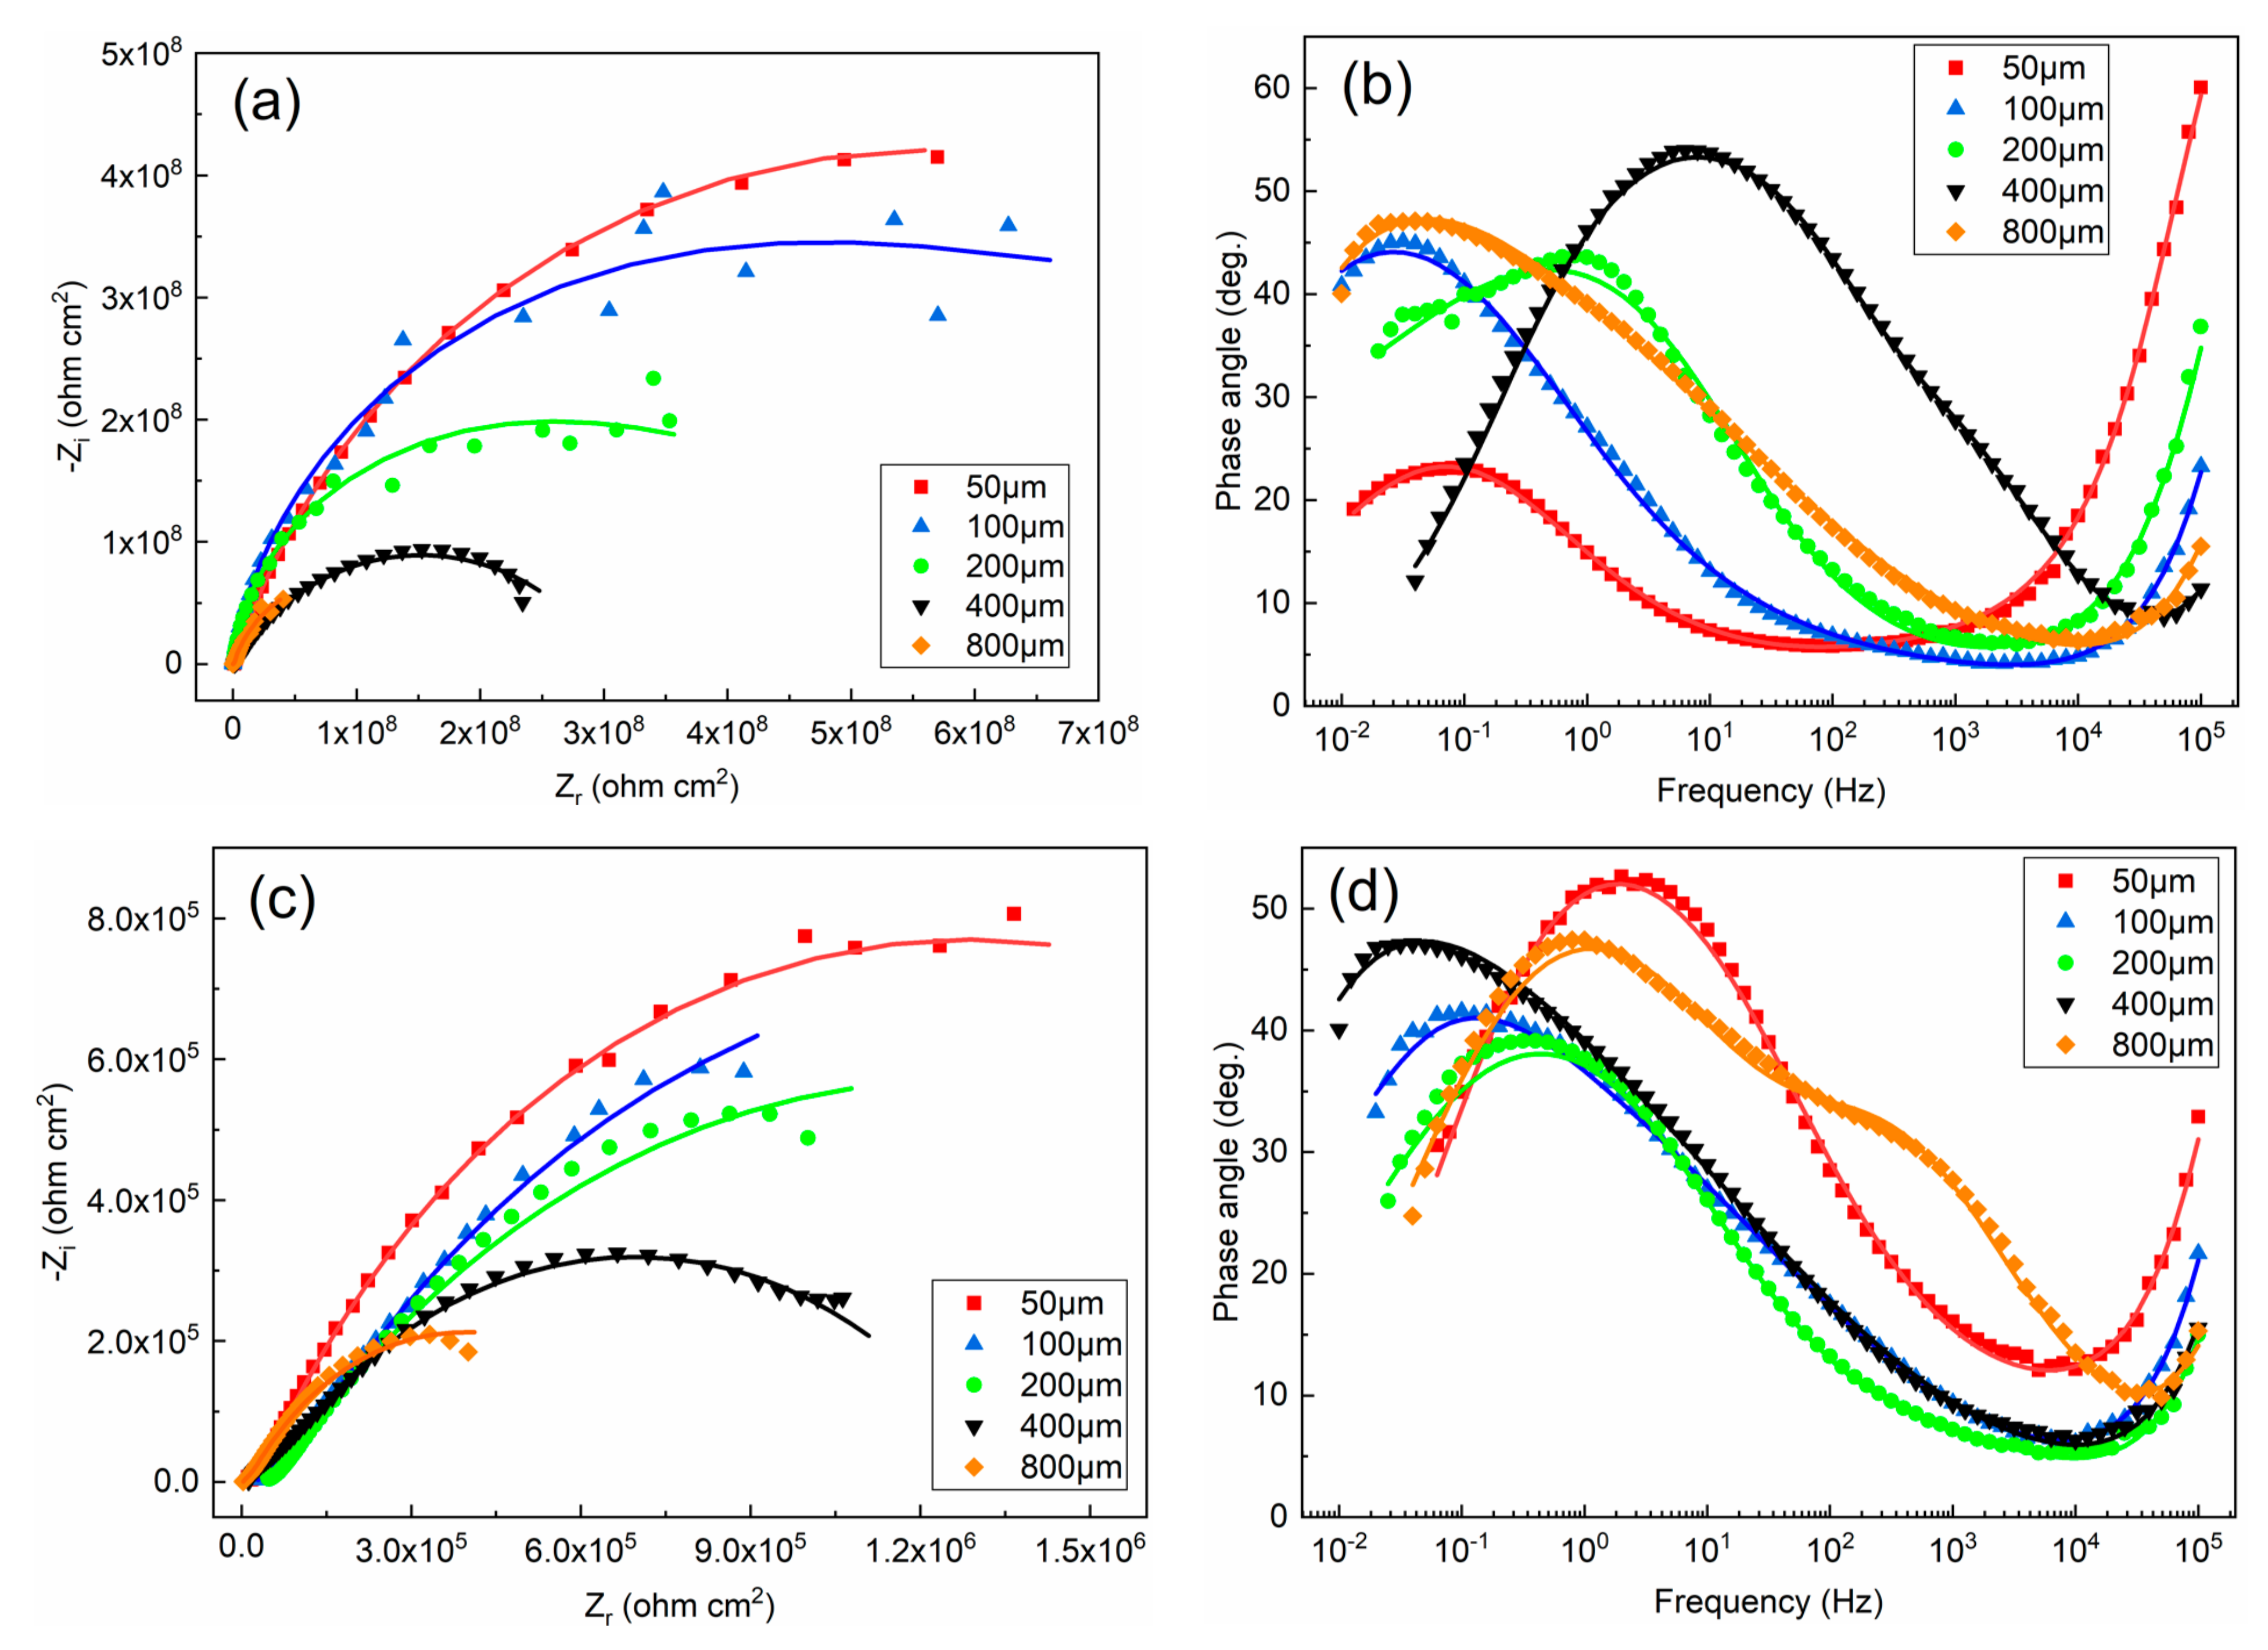
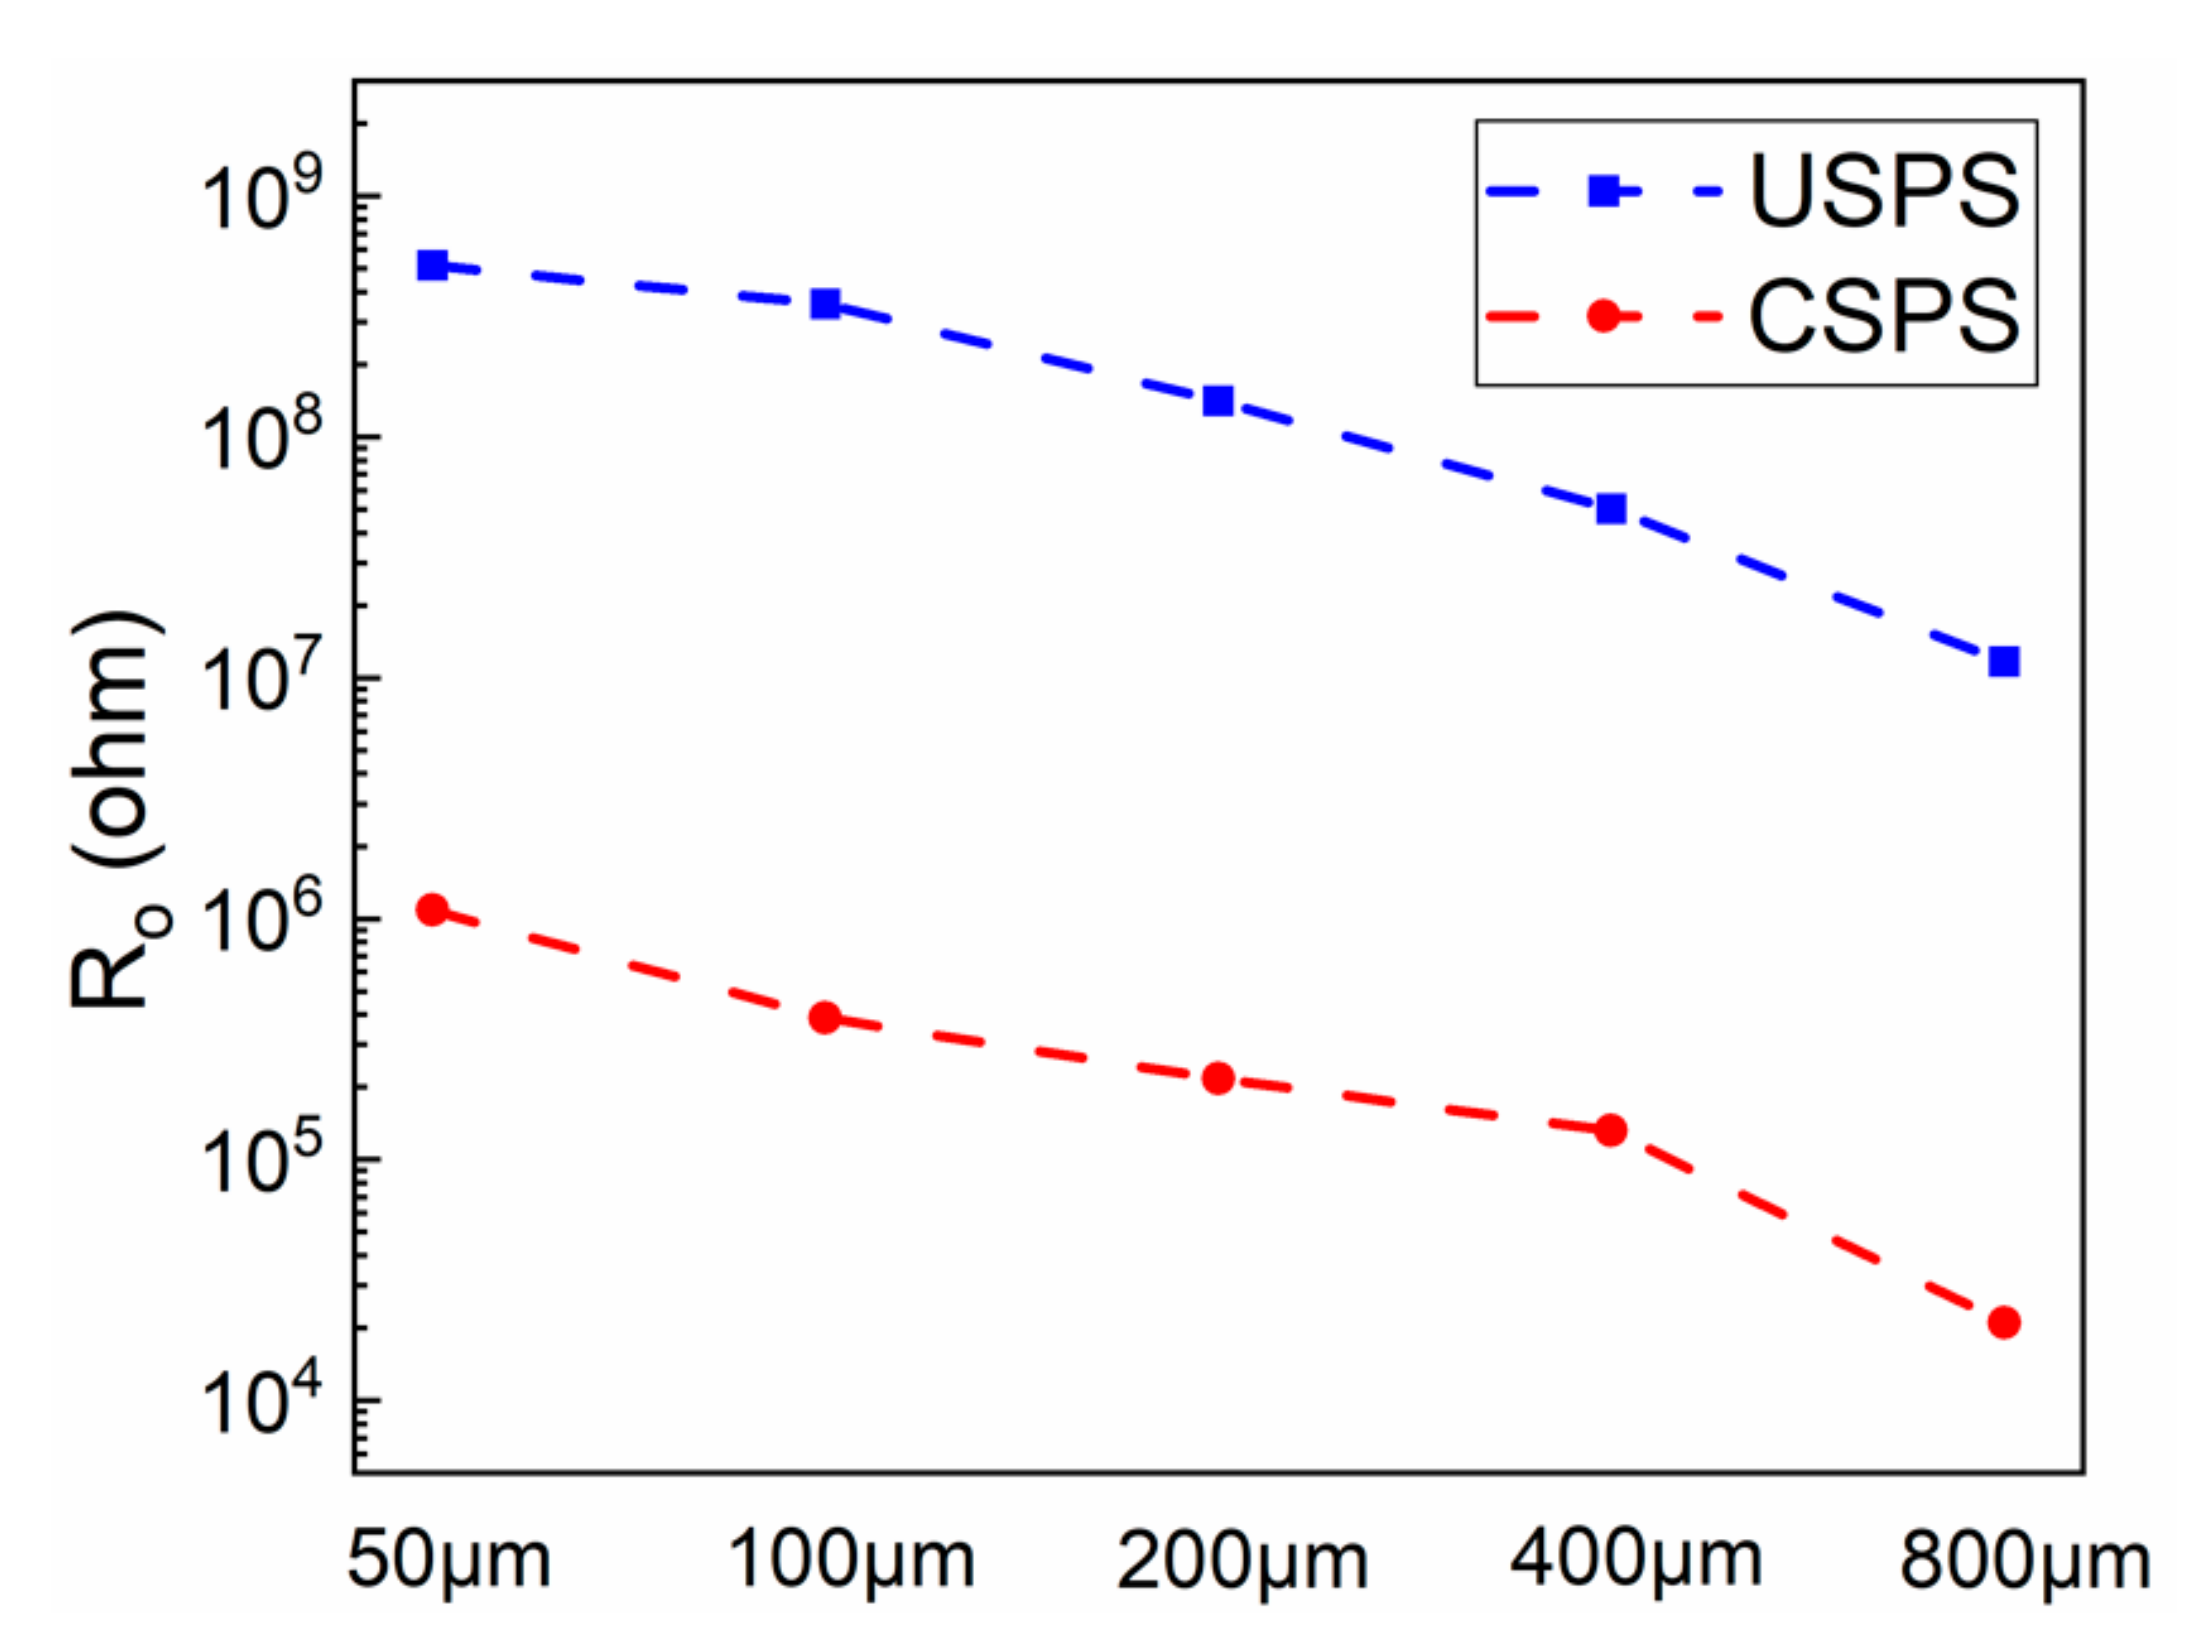
After immersion for 24 h, the Nyquist plots (Figure 4a,c) of every defective sample, either in USPS or CSPS, showed a semicircular arc. As the size of the defect decreased, the radius of the impedance arc increased. Based on the curves in Bode plots (Figure 4b,d), two time-constants can be identified, which represent two different interface reactions occurring in the measurement frequency range. The high-frequency part is related to the electrical behavior of the epoxy-coating, and the low-frequency response corresponds to the reactions that occurred at the bottom of the defect. The reaction process can be well-simulated by the equivalent circuit shown in Figure 2a. Rs represents the solution resistance of the SPS in the circuit; Ro and Cf represent the pore resistance in microdefects and the capacitance of epoxy-coating respectively; Rct and CPEdl correspond to the charge transfer resistance and the electrical double layer capacitance at the substrate–solution interface. Figure 5 depicts the variation of the Ro with the size of the defect in two simulated solutions. The pore resistance in USPS was almost three orders of magnitude larger than that in CSPS. Regardless of whether in USPS or CSPS, Ro increased with the downsizing of defects, which indicated the better corrosion resistance of small defects.
When immersed in USPS for 21 days or in CSPS for 3 days, respectively, the S50 first moved into the second corrosion stage. A straight line with an approximately 45° slope appeared in the Nyquist plots (Figure 6a,c). Two time constants were still exhibited in the Bode plots, so the equivalent circuit, shown in Figure 2b, was adopted to fit the curves. Zw represented the Warburg impedance. It is obvious that the time for the defective specimens to enter the second corrosion stage was determined by the size of the microdefect. The smaller the defects, the earlier the corrosion processes were hindered by the diffusion process. Small defects (e.g., 50 μm in diameter) were more likely to be blocked by corrosion products. Oxygen transport and, more generally, transport of matter were hindered by the thick corrosion layer, which, to some extent, prevented the substrate from the invasion of Cl. Furthermore, the defective samples in CSPS were controlled by diffusion mechanism much earlier than those in USPS. Theoretically, the high alkalinity environment was in favor of the formation of the compact oxide film. The reason why corrosion in USPS was not controlled by the diffusion process easily might be the relatively thin rust layer. As for CSPS, the corrosion was more severe, and corrosion products deposited quickly to block the defect.

3.1.3. LEIS and SVET Test Results

LEIS and SVET were employed to obtain the local electrochemical impedance and corrosion current density near the defect of each specimen at different corrosion periods immersed in two simulated pore solutions.
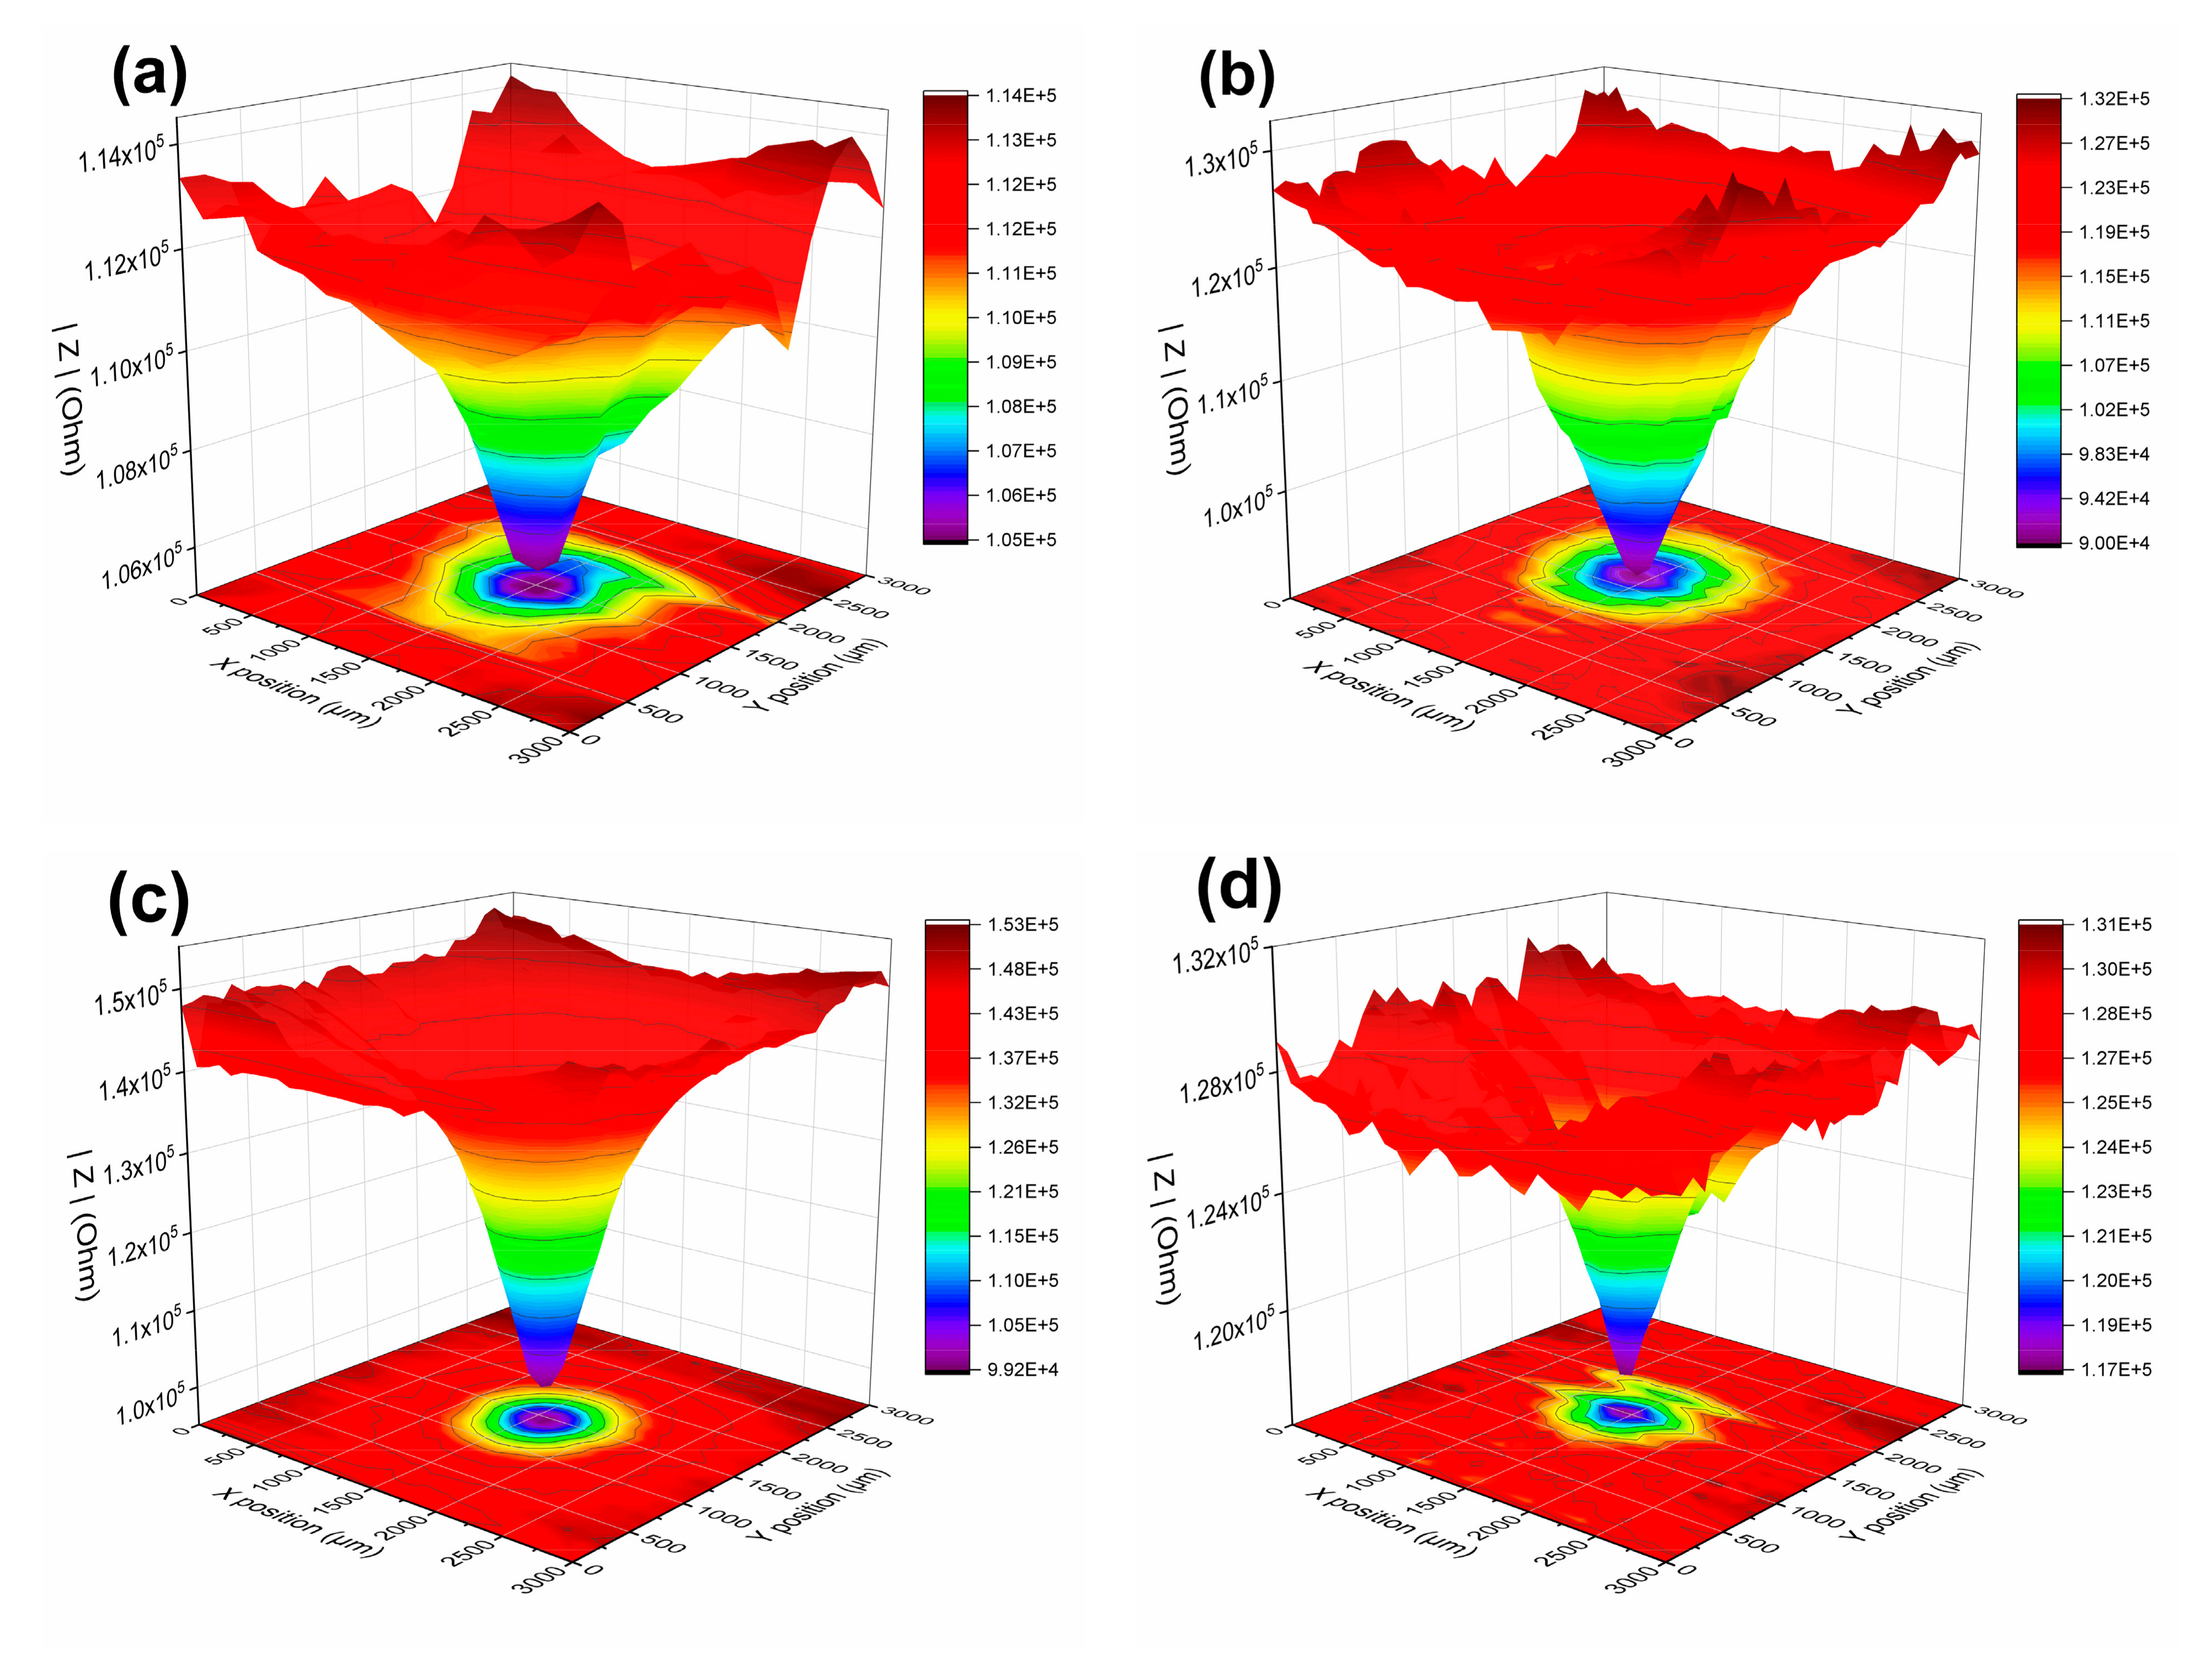
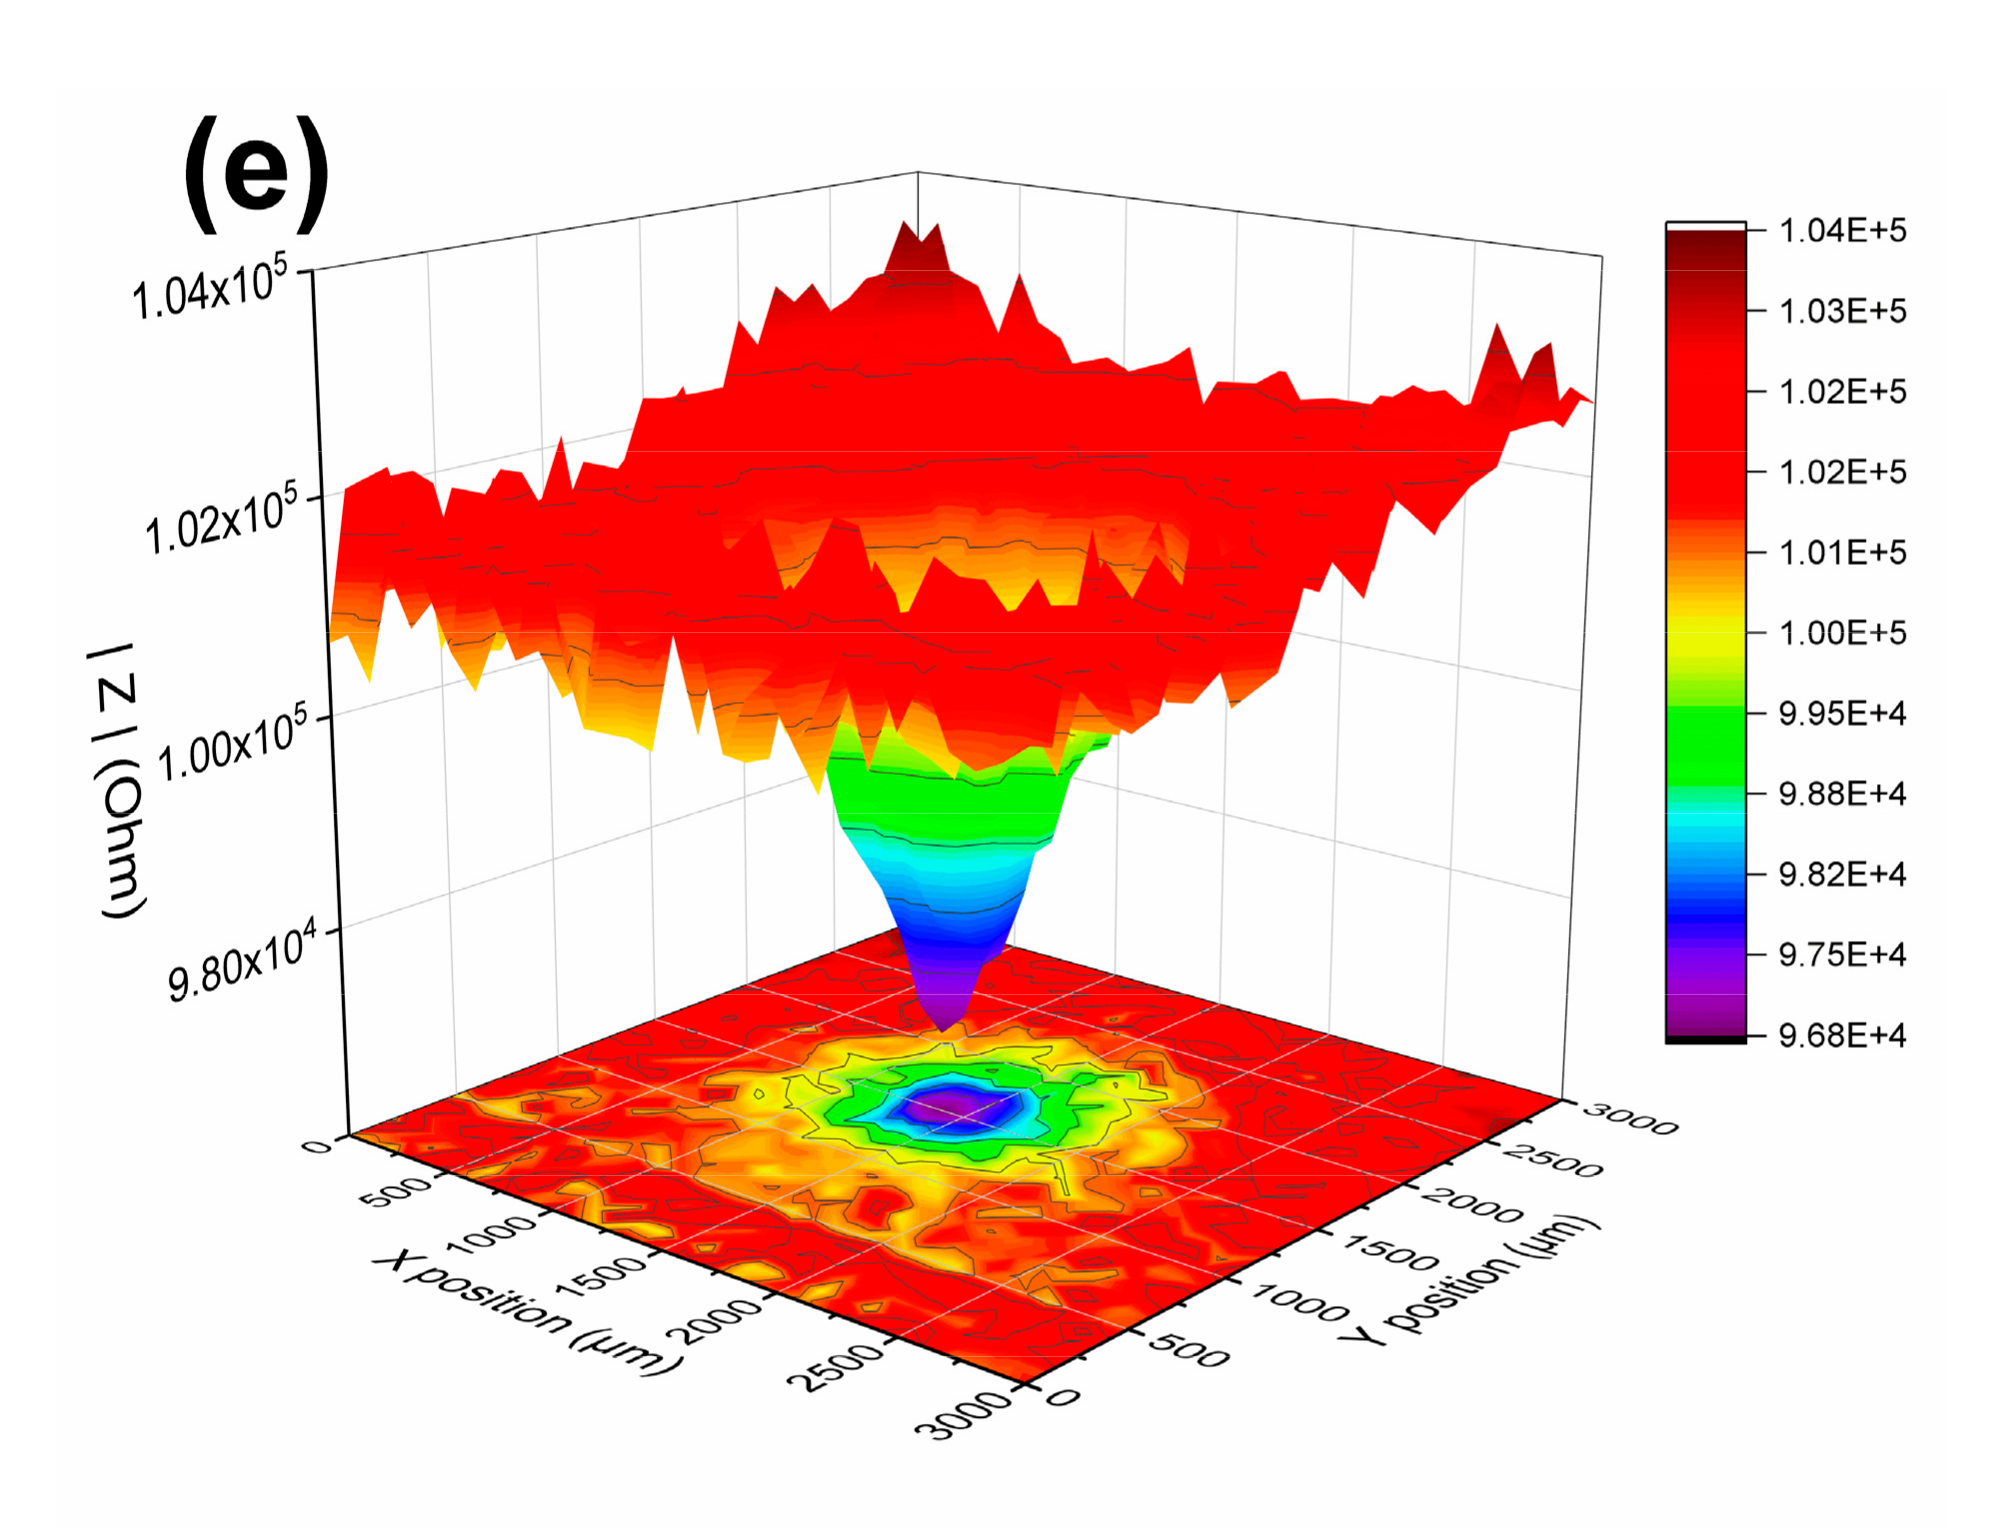
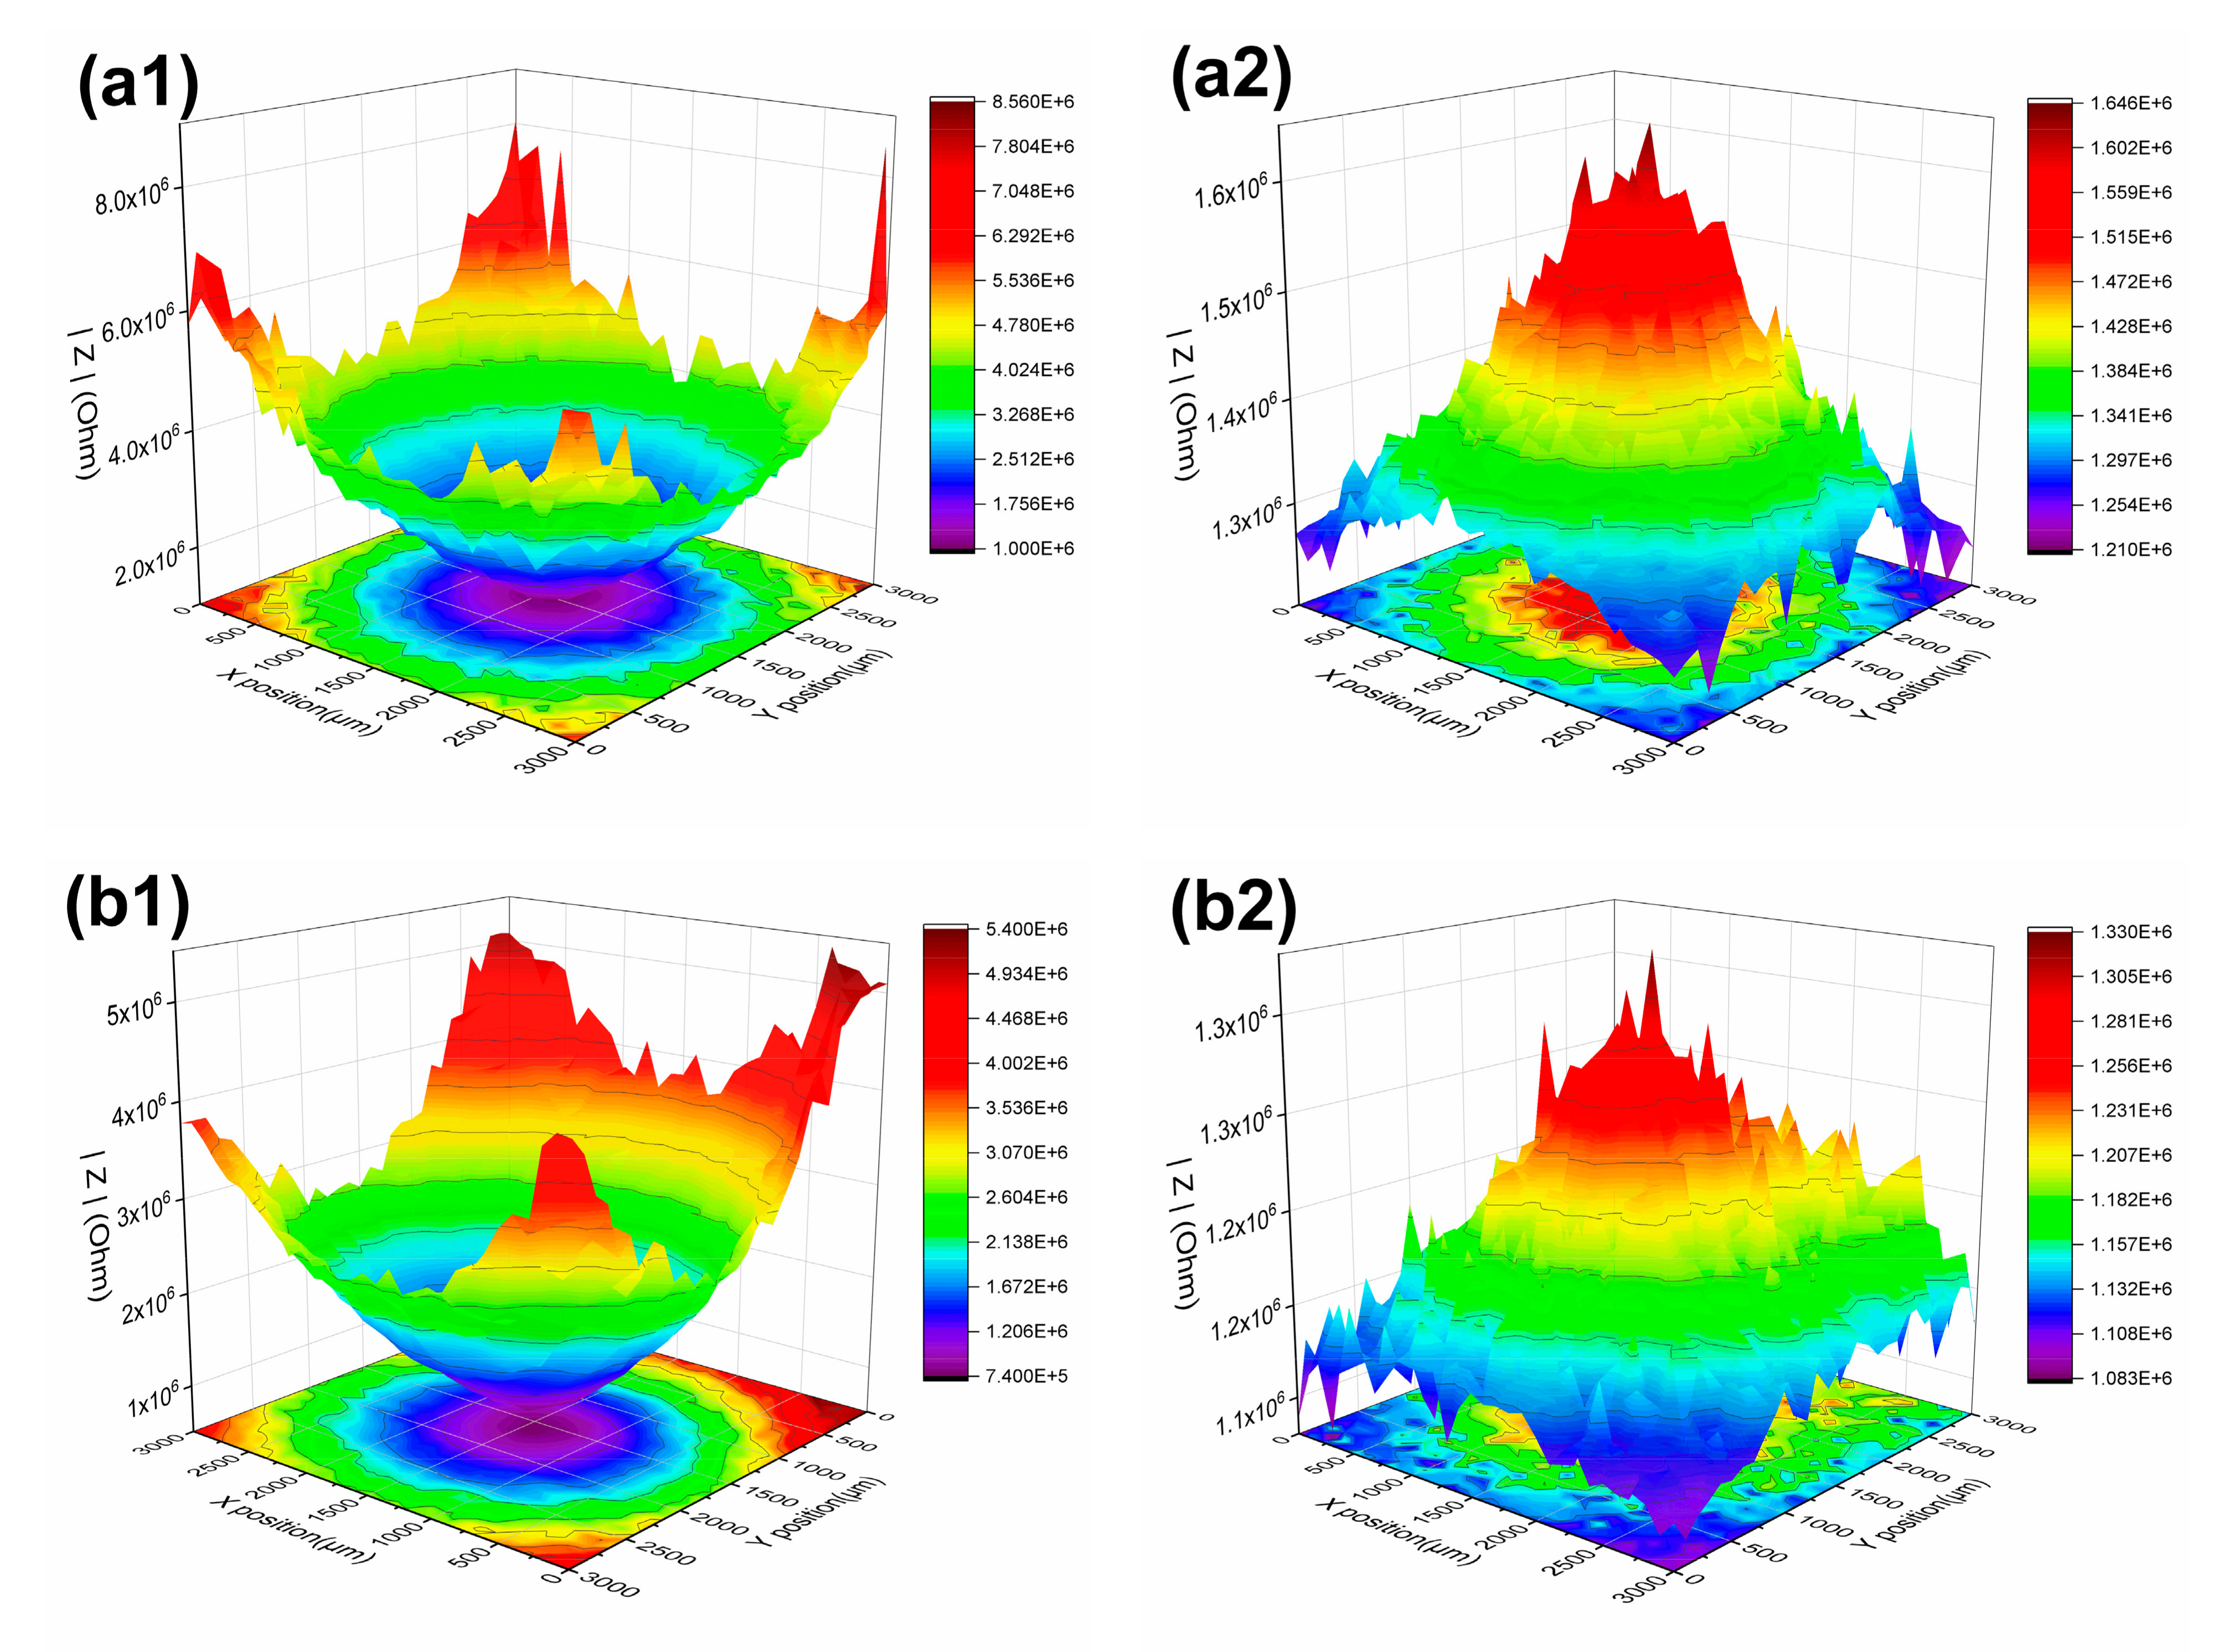
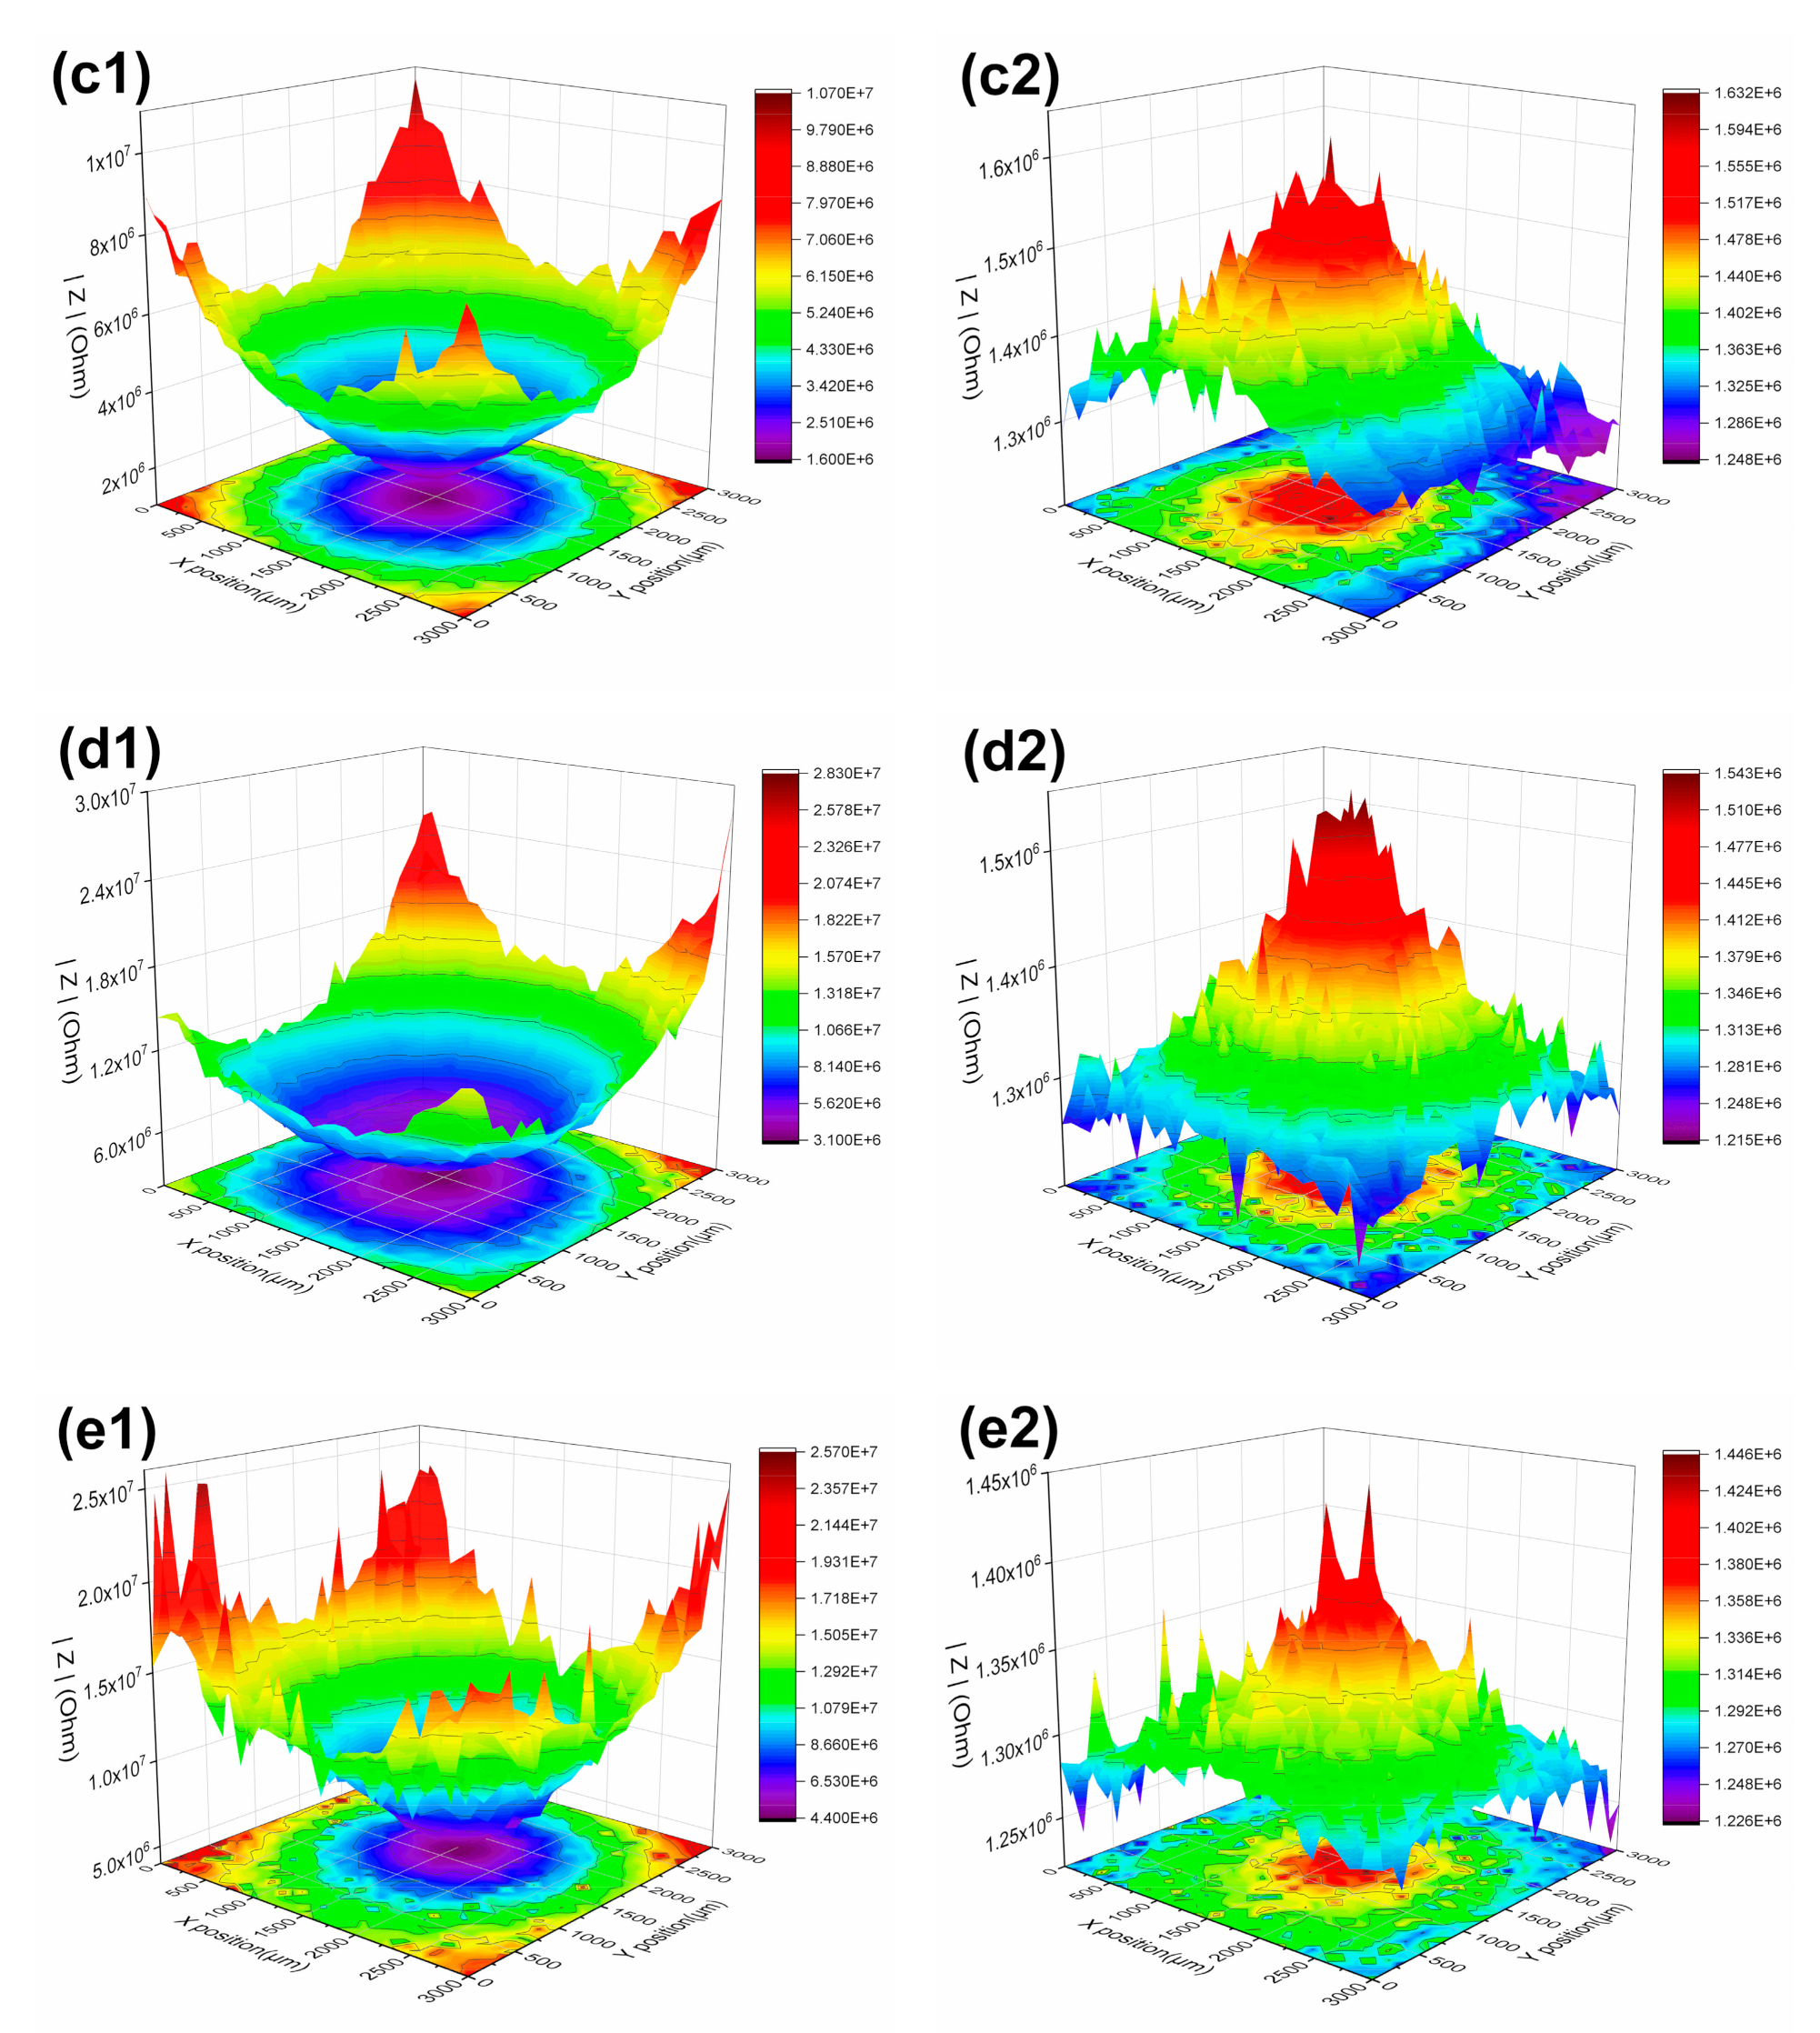
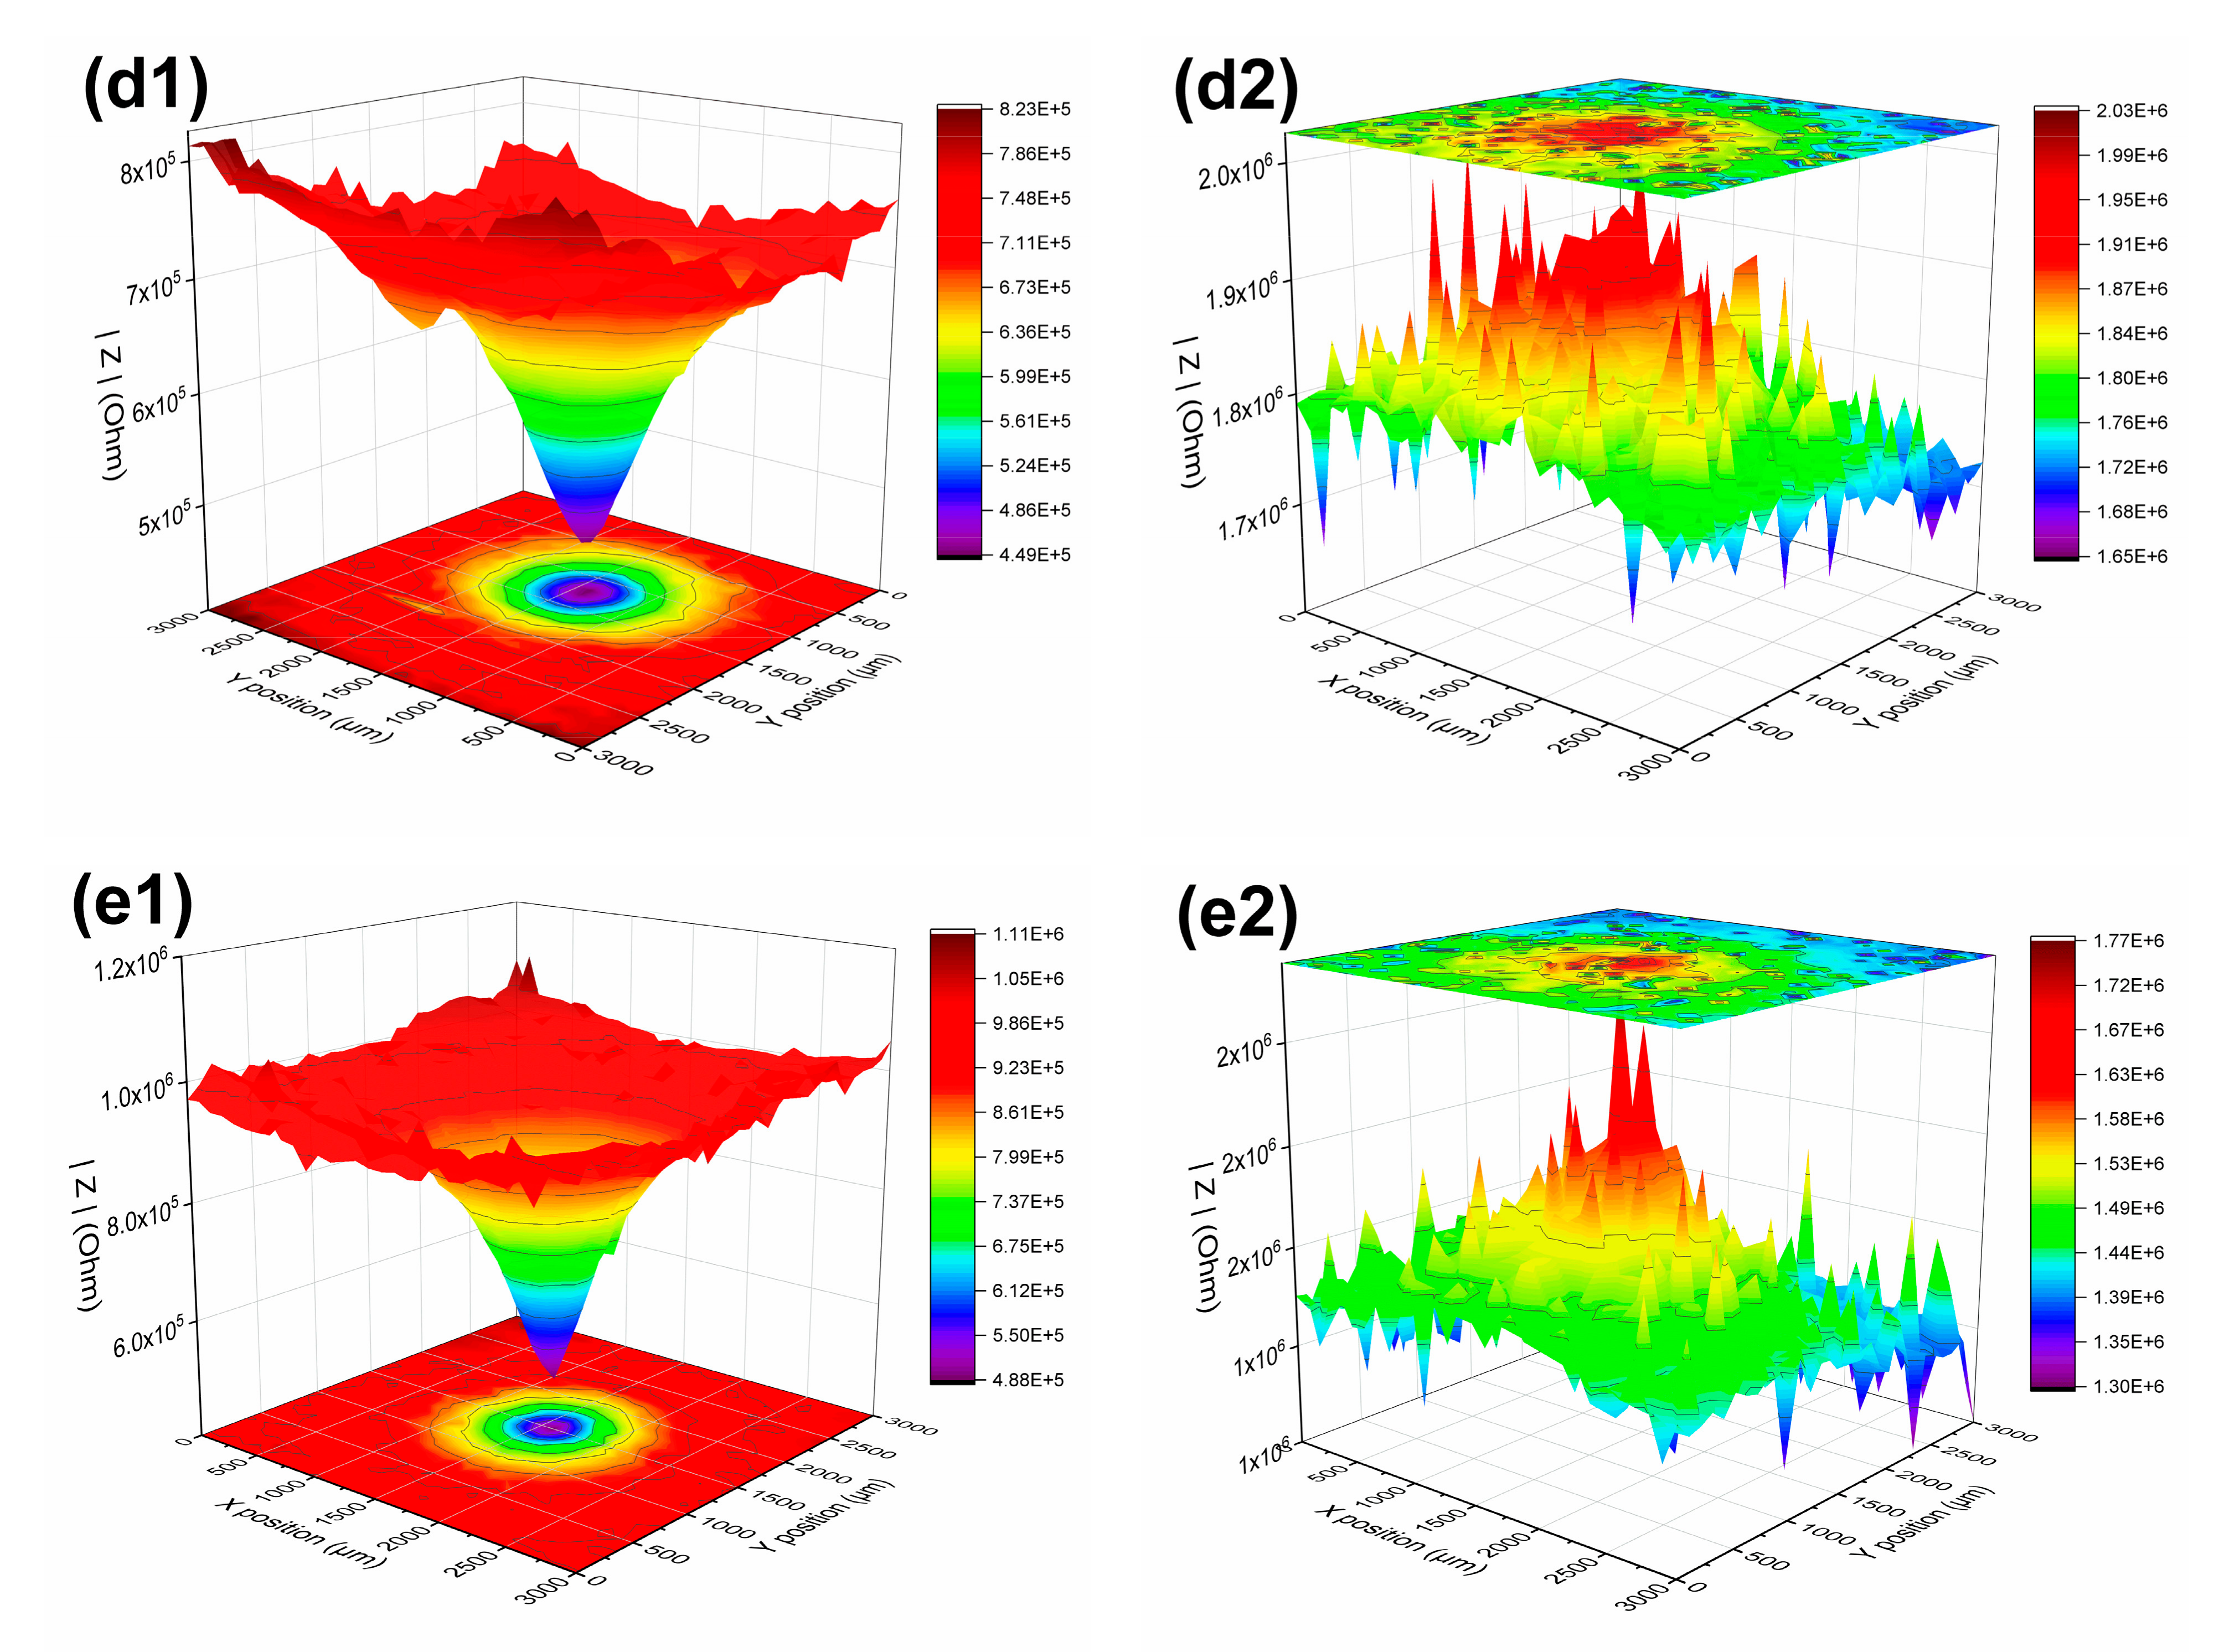
The overview of the defect and periphery impedance obtained in LEIS experiments, is shown in Table 5. Figure 7 clearly exhibits that the LEIS plots of the defective samples before the immersion in SPS are displayed as a funnel shape. The impedance of defects was the minimum of the plot, about 1×10⁵ Ω. Plateaus were clearly observed around the defects. They were the regions covered by coatings, and the impedance was several decades of kiloohm higher than the defect. The impedance of all the specimens increased by an order of magnitude, at least, due to the passivation of OH after being immersed in USPS for 24 h (Figure 8a1–e1). Additionally, the plateaus disappeared, possibly when the electrolyte penetrated from the defect to the substrate–coating interface during the immersion, expanding the relatively low impedance area. The impedance of S100 and S50 was much higher than that of S800~S200. It indicated that the passivation was more pronounced at the smaller defects due to their narrow geometry. After the immersion in USPS for 84 days (Figure 8a2–e2), the impedance of the defect reversed, and its value climbed to 1.4~1.6 MΩ. When the specimens were immersed in CSPS, the impedance in the test region slowly increased, and it merely increased several times after 21 days (Figure 9a1–e1). Similar to the situation of USPS, the impedance of the defect reversed to 1.7~2 MΩ after being exposed to USPS for 63 days (Figure 9a2–e2). As for USPS, the dramatic increase of impedance at the initial stage of immersion is attributed to the higher alkalinity. OH dominated in the reaction compared to Cl and passivated the substrate, forming a compact oxide layer. In the last period of immersion, the corrosion products accumulated and blocked the microdefects, and the impedance of defects reversed. The contributions of rust layers formed in CSPS to the corrosion resistance were much less than those in USPS. This must be related to the composition and electrochemical activity of the products. It should be clear that the impedance in LEIS experiments depended on the corrosion resistance of the specimens, on the one hand, and the distance between the microprobe and the sample surface, on the other hand. After being immersed in CSPS for a long time, the impedance was much higher than the initial stage, because the corrosion products crept horizontally and radiated from the defects to the ambient. That means crevice corrosion occurred and the coatings were delaminated, increasing the distance between the probe and the substrate.
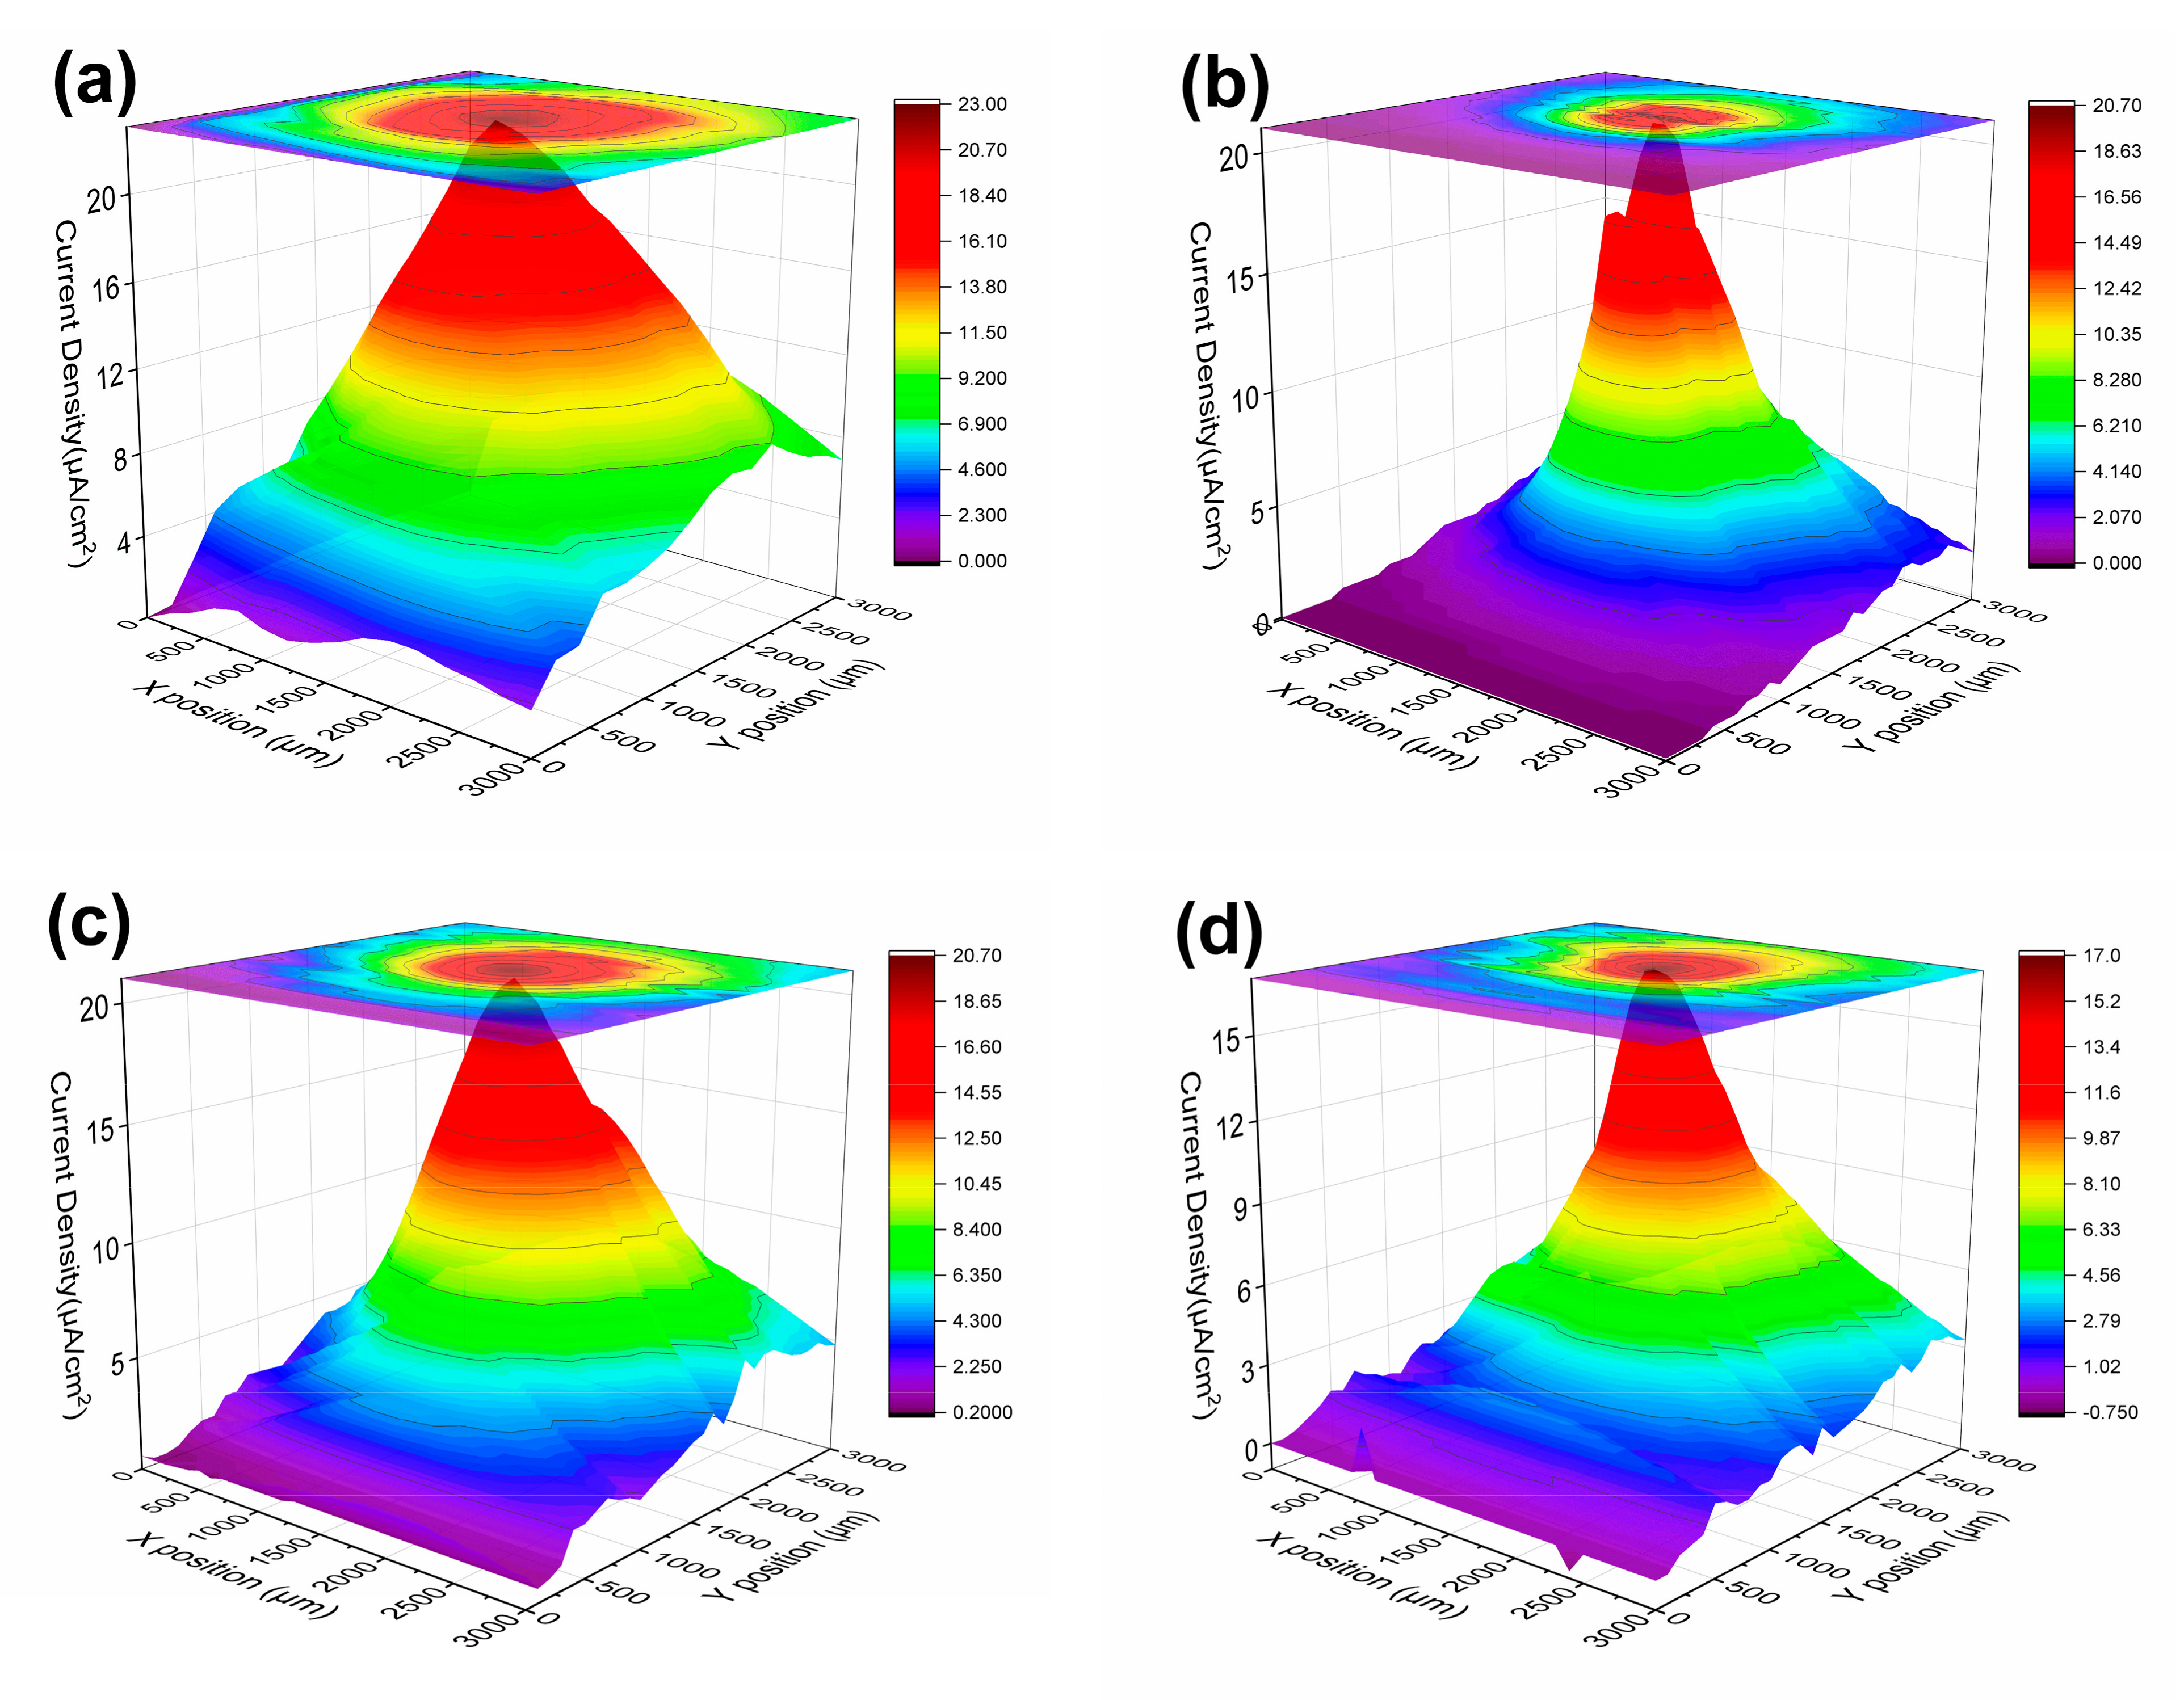
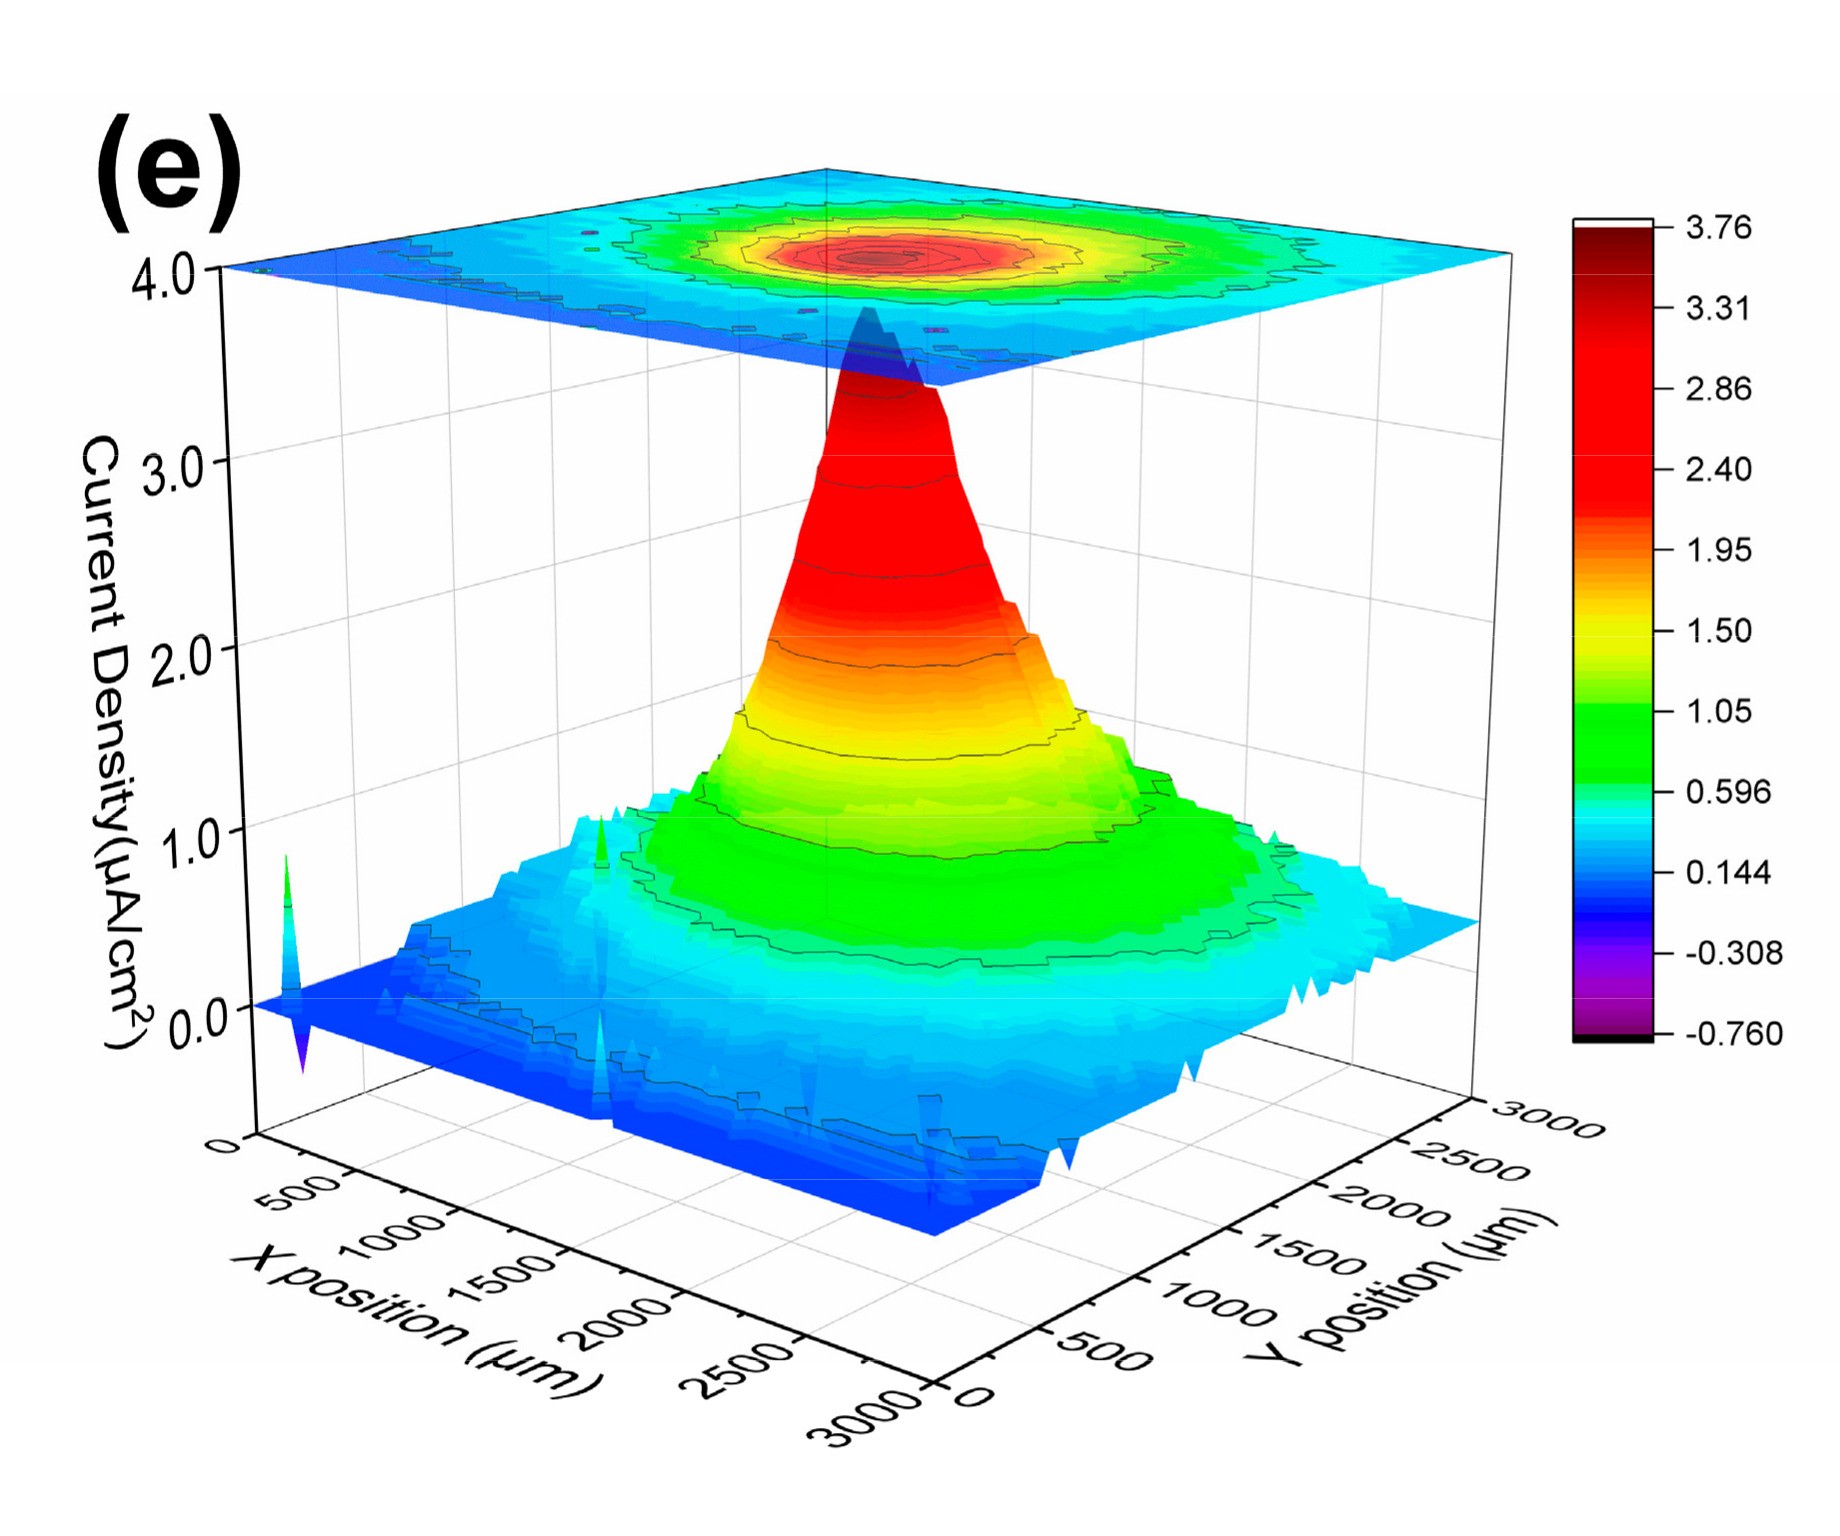
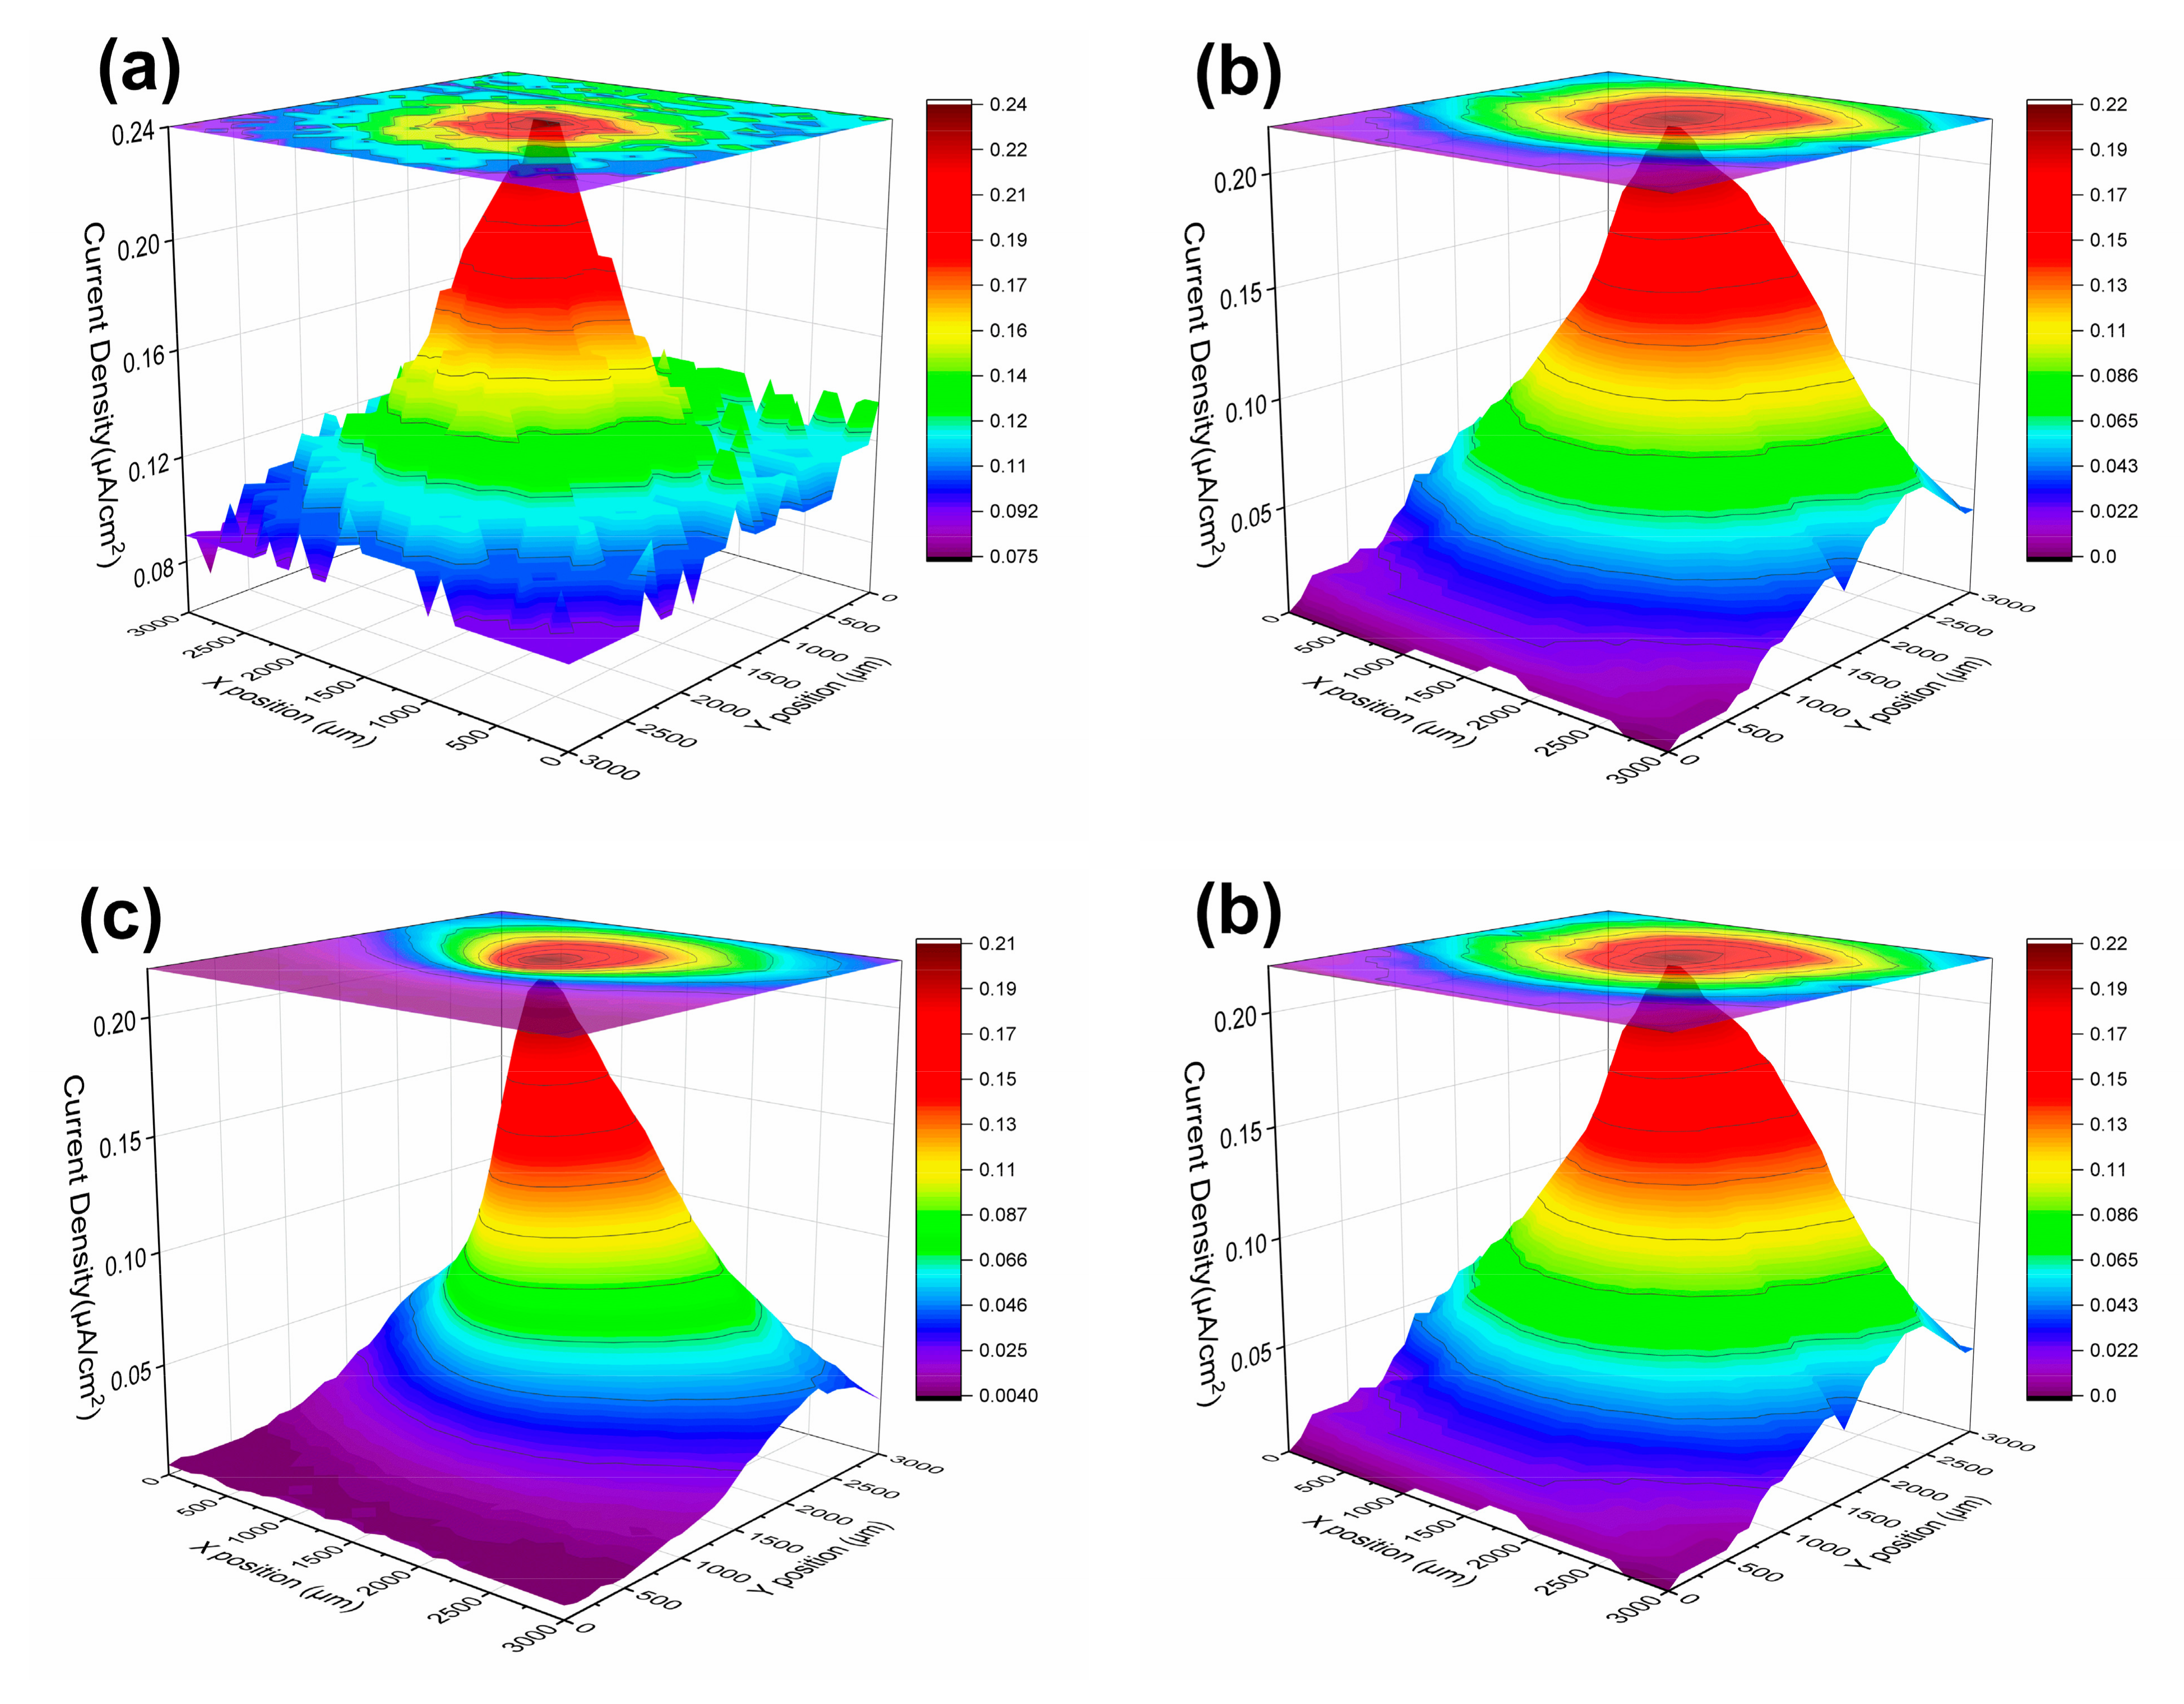
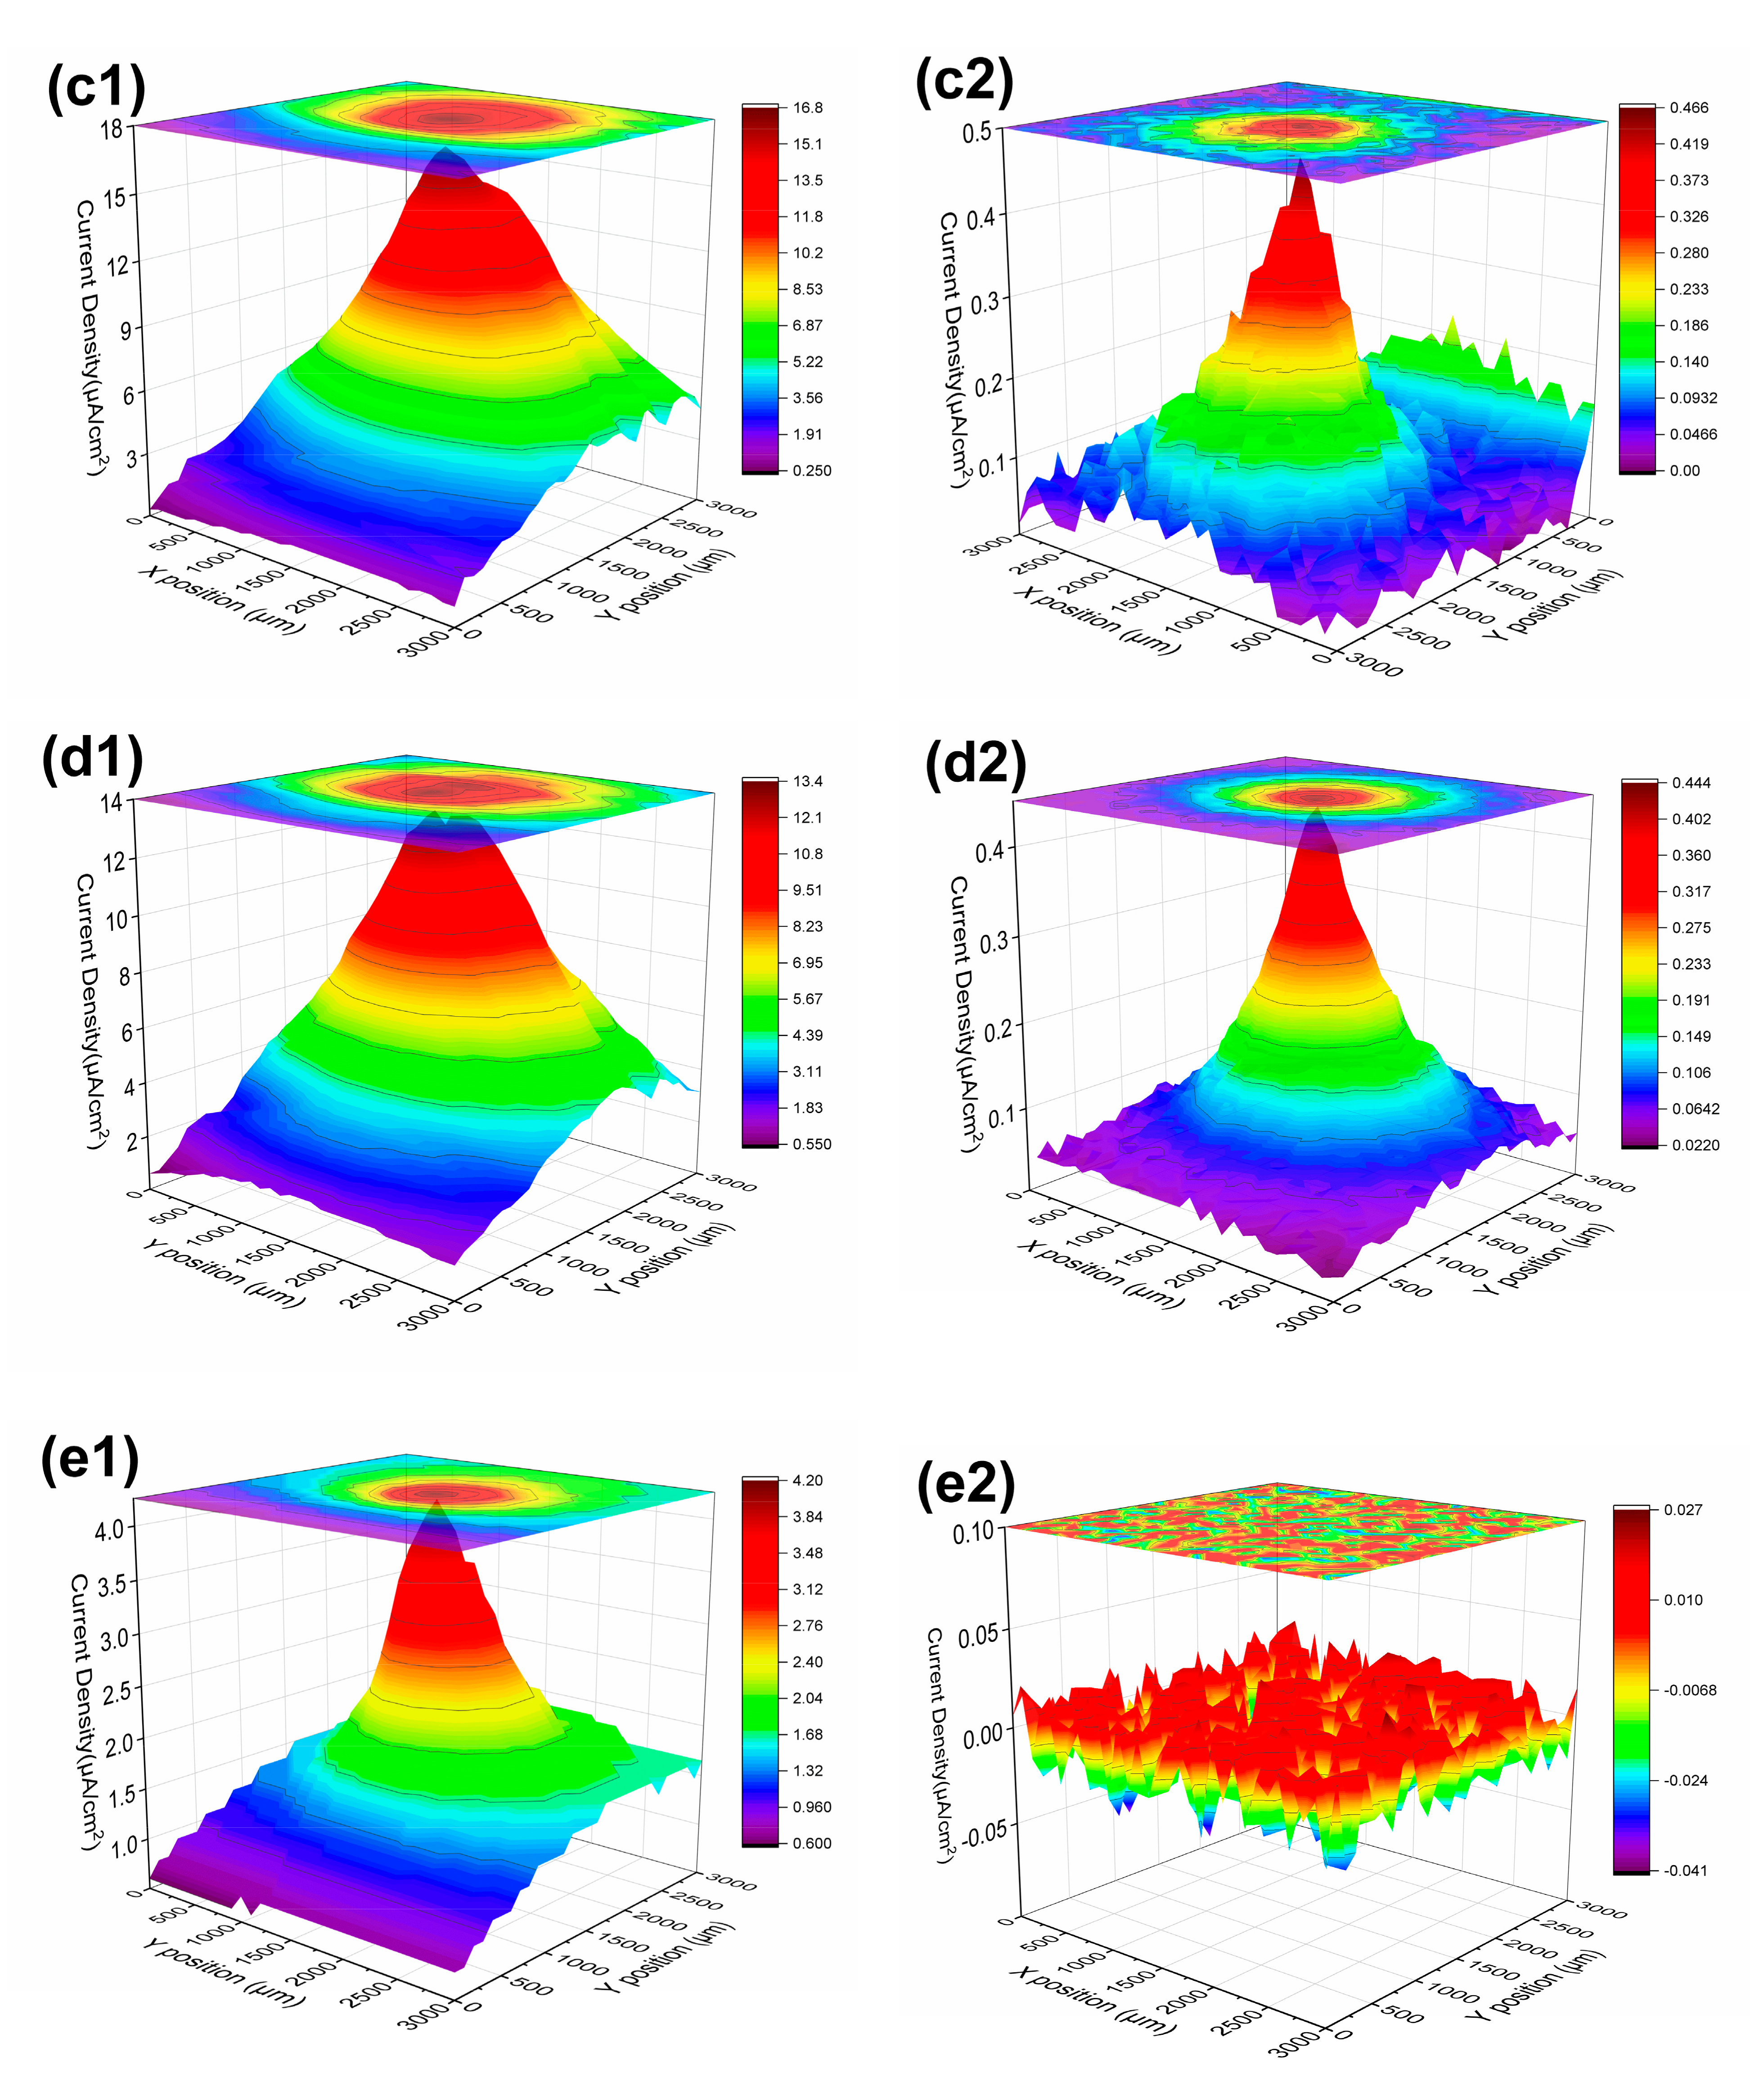
The overview of the defect current density obtained in SVET experiments is shown in Table 6. Figure 10 shows the local current density plots of defective samples before being immersed in SPS with the inverted funnel shape. The current density at the defect was the maximum, with a value of about 20 μA/cm2 for S800~S100 and a much smaller value of about 4 μA/cm2 for S50. The current density around the defect decreased to 0 μA/cm2 gradually as the distance from the defect increased. When immersed in USPS, the current density of the specimens decreased drastically and maintained a minuscule value throughout the experiment. The current signal of specimens could not be detected until the final stage (Figure 11) of the immersion. The values decreased to approximately 0.2 μA/cm2 for S800~S200 and 0.1 μA/cm2 for S100, compared to Figure 10. As for S50, the funnel shape disappeared, and current density uniformly distributed to −0.015~0.045 μA/cm2. However, it was quite different for the situation in CSPS. In the first 24 hours (Figure 12a1–e1), the current density of all the specimens decreased a bit and then kept decreasing slowly as the immersion time went by. As is exhibited in Figure 12a2–e2, after 63 days in CSPS, the current density at the defect decreased to about 0.5μA/cm2 for S800~S100. As the same of Figure 11e, S50 kept a uniform and dramatically low current density around −0.041~0.027 μA/cm2. That the oxide film formed in the USPS due to the passivation of OH might tremendously hinder the ion transportation in the corrosion process, resulting in a low reaction current density around the defect. The electrochemical reaction at the defect was active at the initial stage when the specimens were exposed to CSPS, and lots of corrosion products were generated. The oxide layer, however, was relatively porous or facilitated the transformation of reactive ions, which maintained the high current density for a long period. It was not until the last stage of the experiment that the corrosion products accumulated to hinder the reaction. In addition, there was an immensely weak current signal for S50, meaning that corrosion hardly occurred in this situation.

3.2. Corrosion Products Analysis

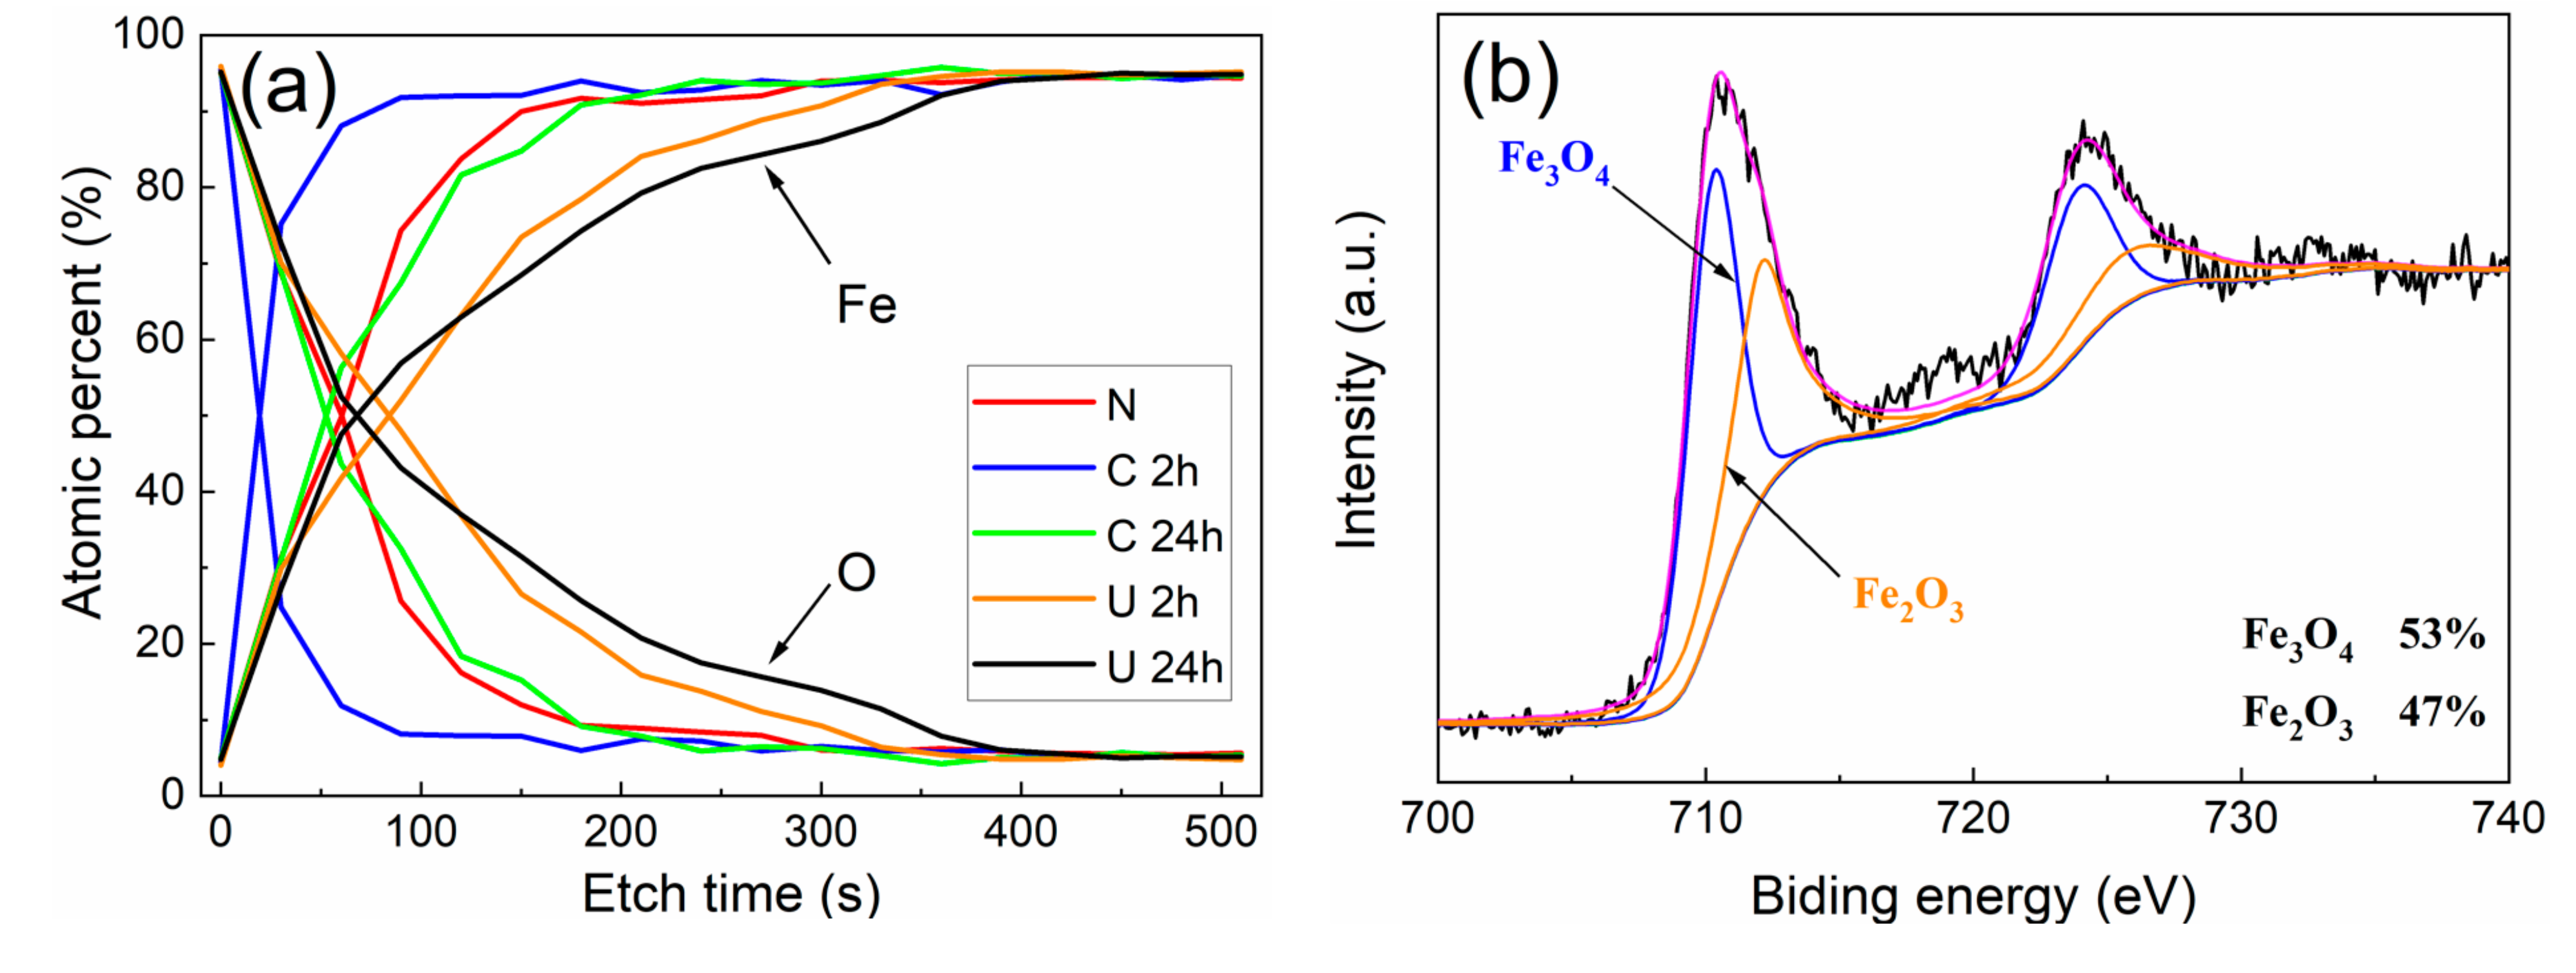
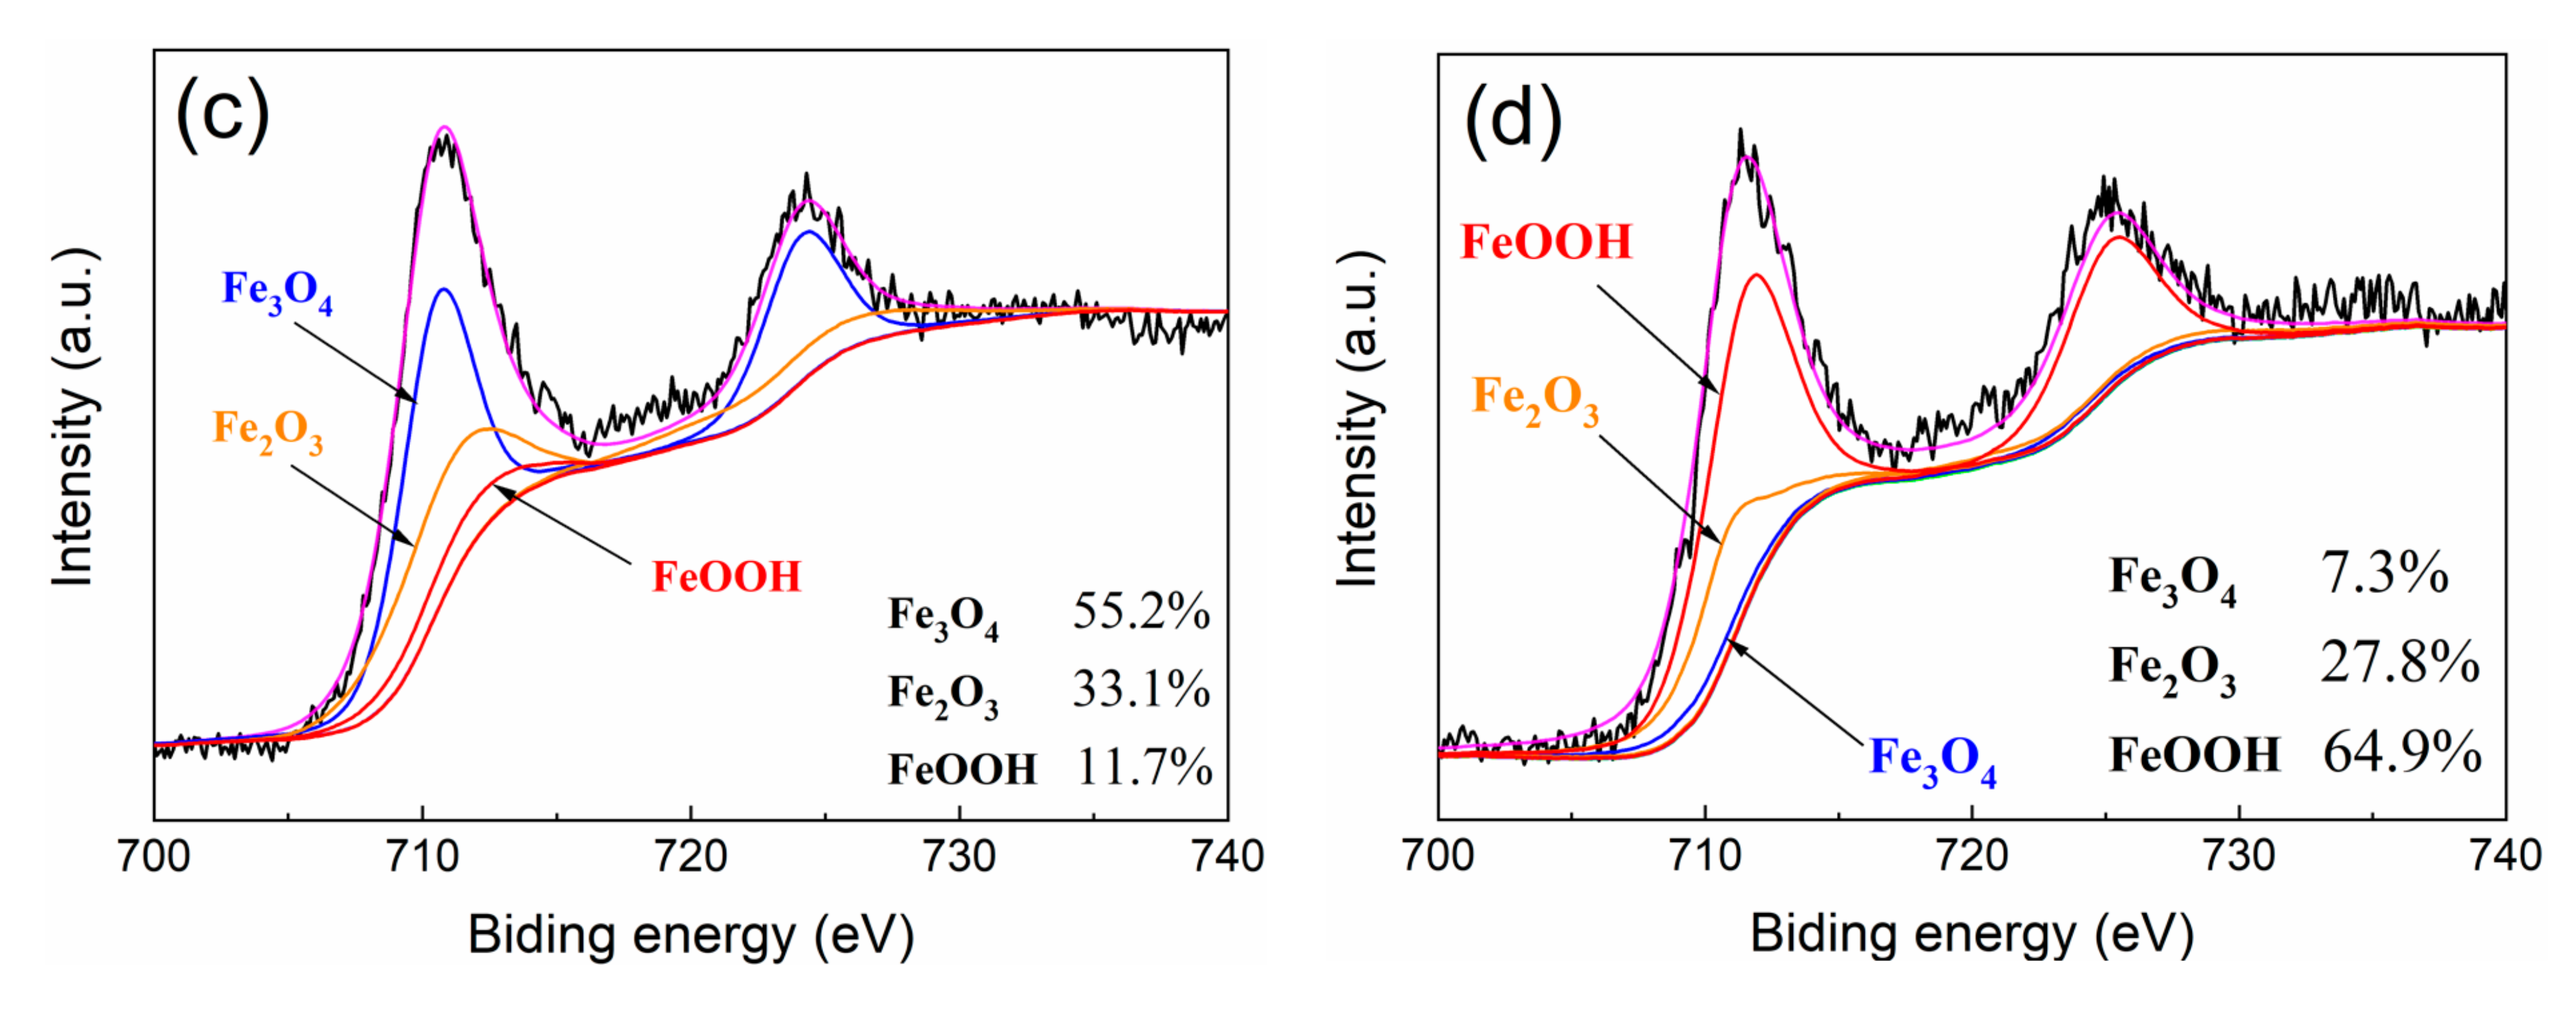
Ar+ beam etching was adopted to measure the thickness of preheating oxide after the immersion in both SPS for 0, 2 or 24 h, respectively. When the specimens were exposed to USPS and CSPS, respectively, for 24 h, the composition of oxide film was analyzed by XPS. Bare rebar samples with the size of 2 mm × 2 mm × 0.5 mm were preheated at 240 ℃ for 20 min, the same procedure of defective specimens. Previous studies reported that the oxidation state of iron can be determined by analyzing the binding energy of Fe 2p1/2 or Fe 2p3/2 [29,30,31]. As is known, the binding energy of Fe 2p1/2 is equal to the binding energy of Fe 2p3/2 plus 13.6 eV. Referring to the Handbook of Monochromatic XPS Spectra [32], the peak of Fe 2p3/2 binding energy in Fe3O4 was 710.5 eV; the Fe 2p3/2 peak in Fe2O3 was 710.8 eV; the Fe 2p3/2 peak in FeOOH was 711.5 eV. The data of XPS experiments were fitted by XPS Peak.
It is presented in Figure 13a,b that the oxide film on the surface of the preheated specimens was mainly composed of Fe3O4 and Fe2O3, and the proportion was roughly equal. Since the Ar+ beam etching rate was 0.1 nm/s, the thickness of the preheated oxide layer could be speculated to be about 30nm. Immersed in USPS for 2 h and 24 h, the thickness of the oxide film increased to 38 nm and 42 nm, respectively. The proportion of Fe3O4 in the oxide layer increased slightly after 24 h, while the content of Fe2O3 partially decreased, with some FeOOH being generated. For the specimens in CSPS, the oxide film was rapidly dissolved in the first 2 h to a thickness of merely about 8nm. However, after 24h, the oxide layer regenerated to a thickness of 24 nm. According to Figure 13d, Fe3O4 was almost consumed during this process, and the content of Fe2O3 was halved, with a great deal of FeOOH being generated. It is obvious that the concentration of Fe3O4 was negatively correlated with that of FeOOH [33] and their proportions were controlled by OH.
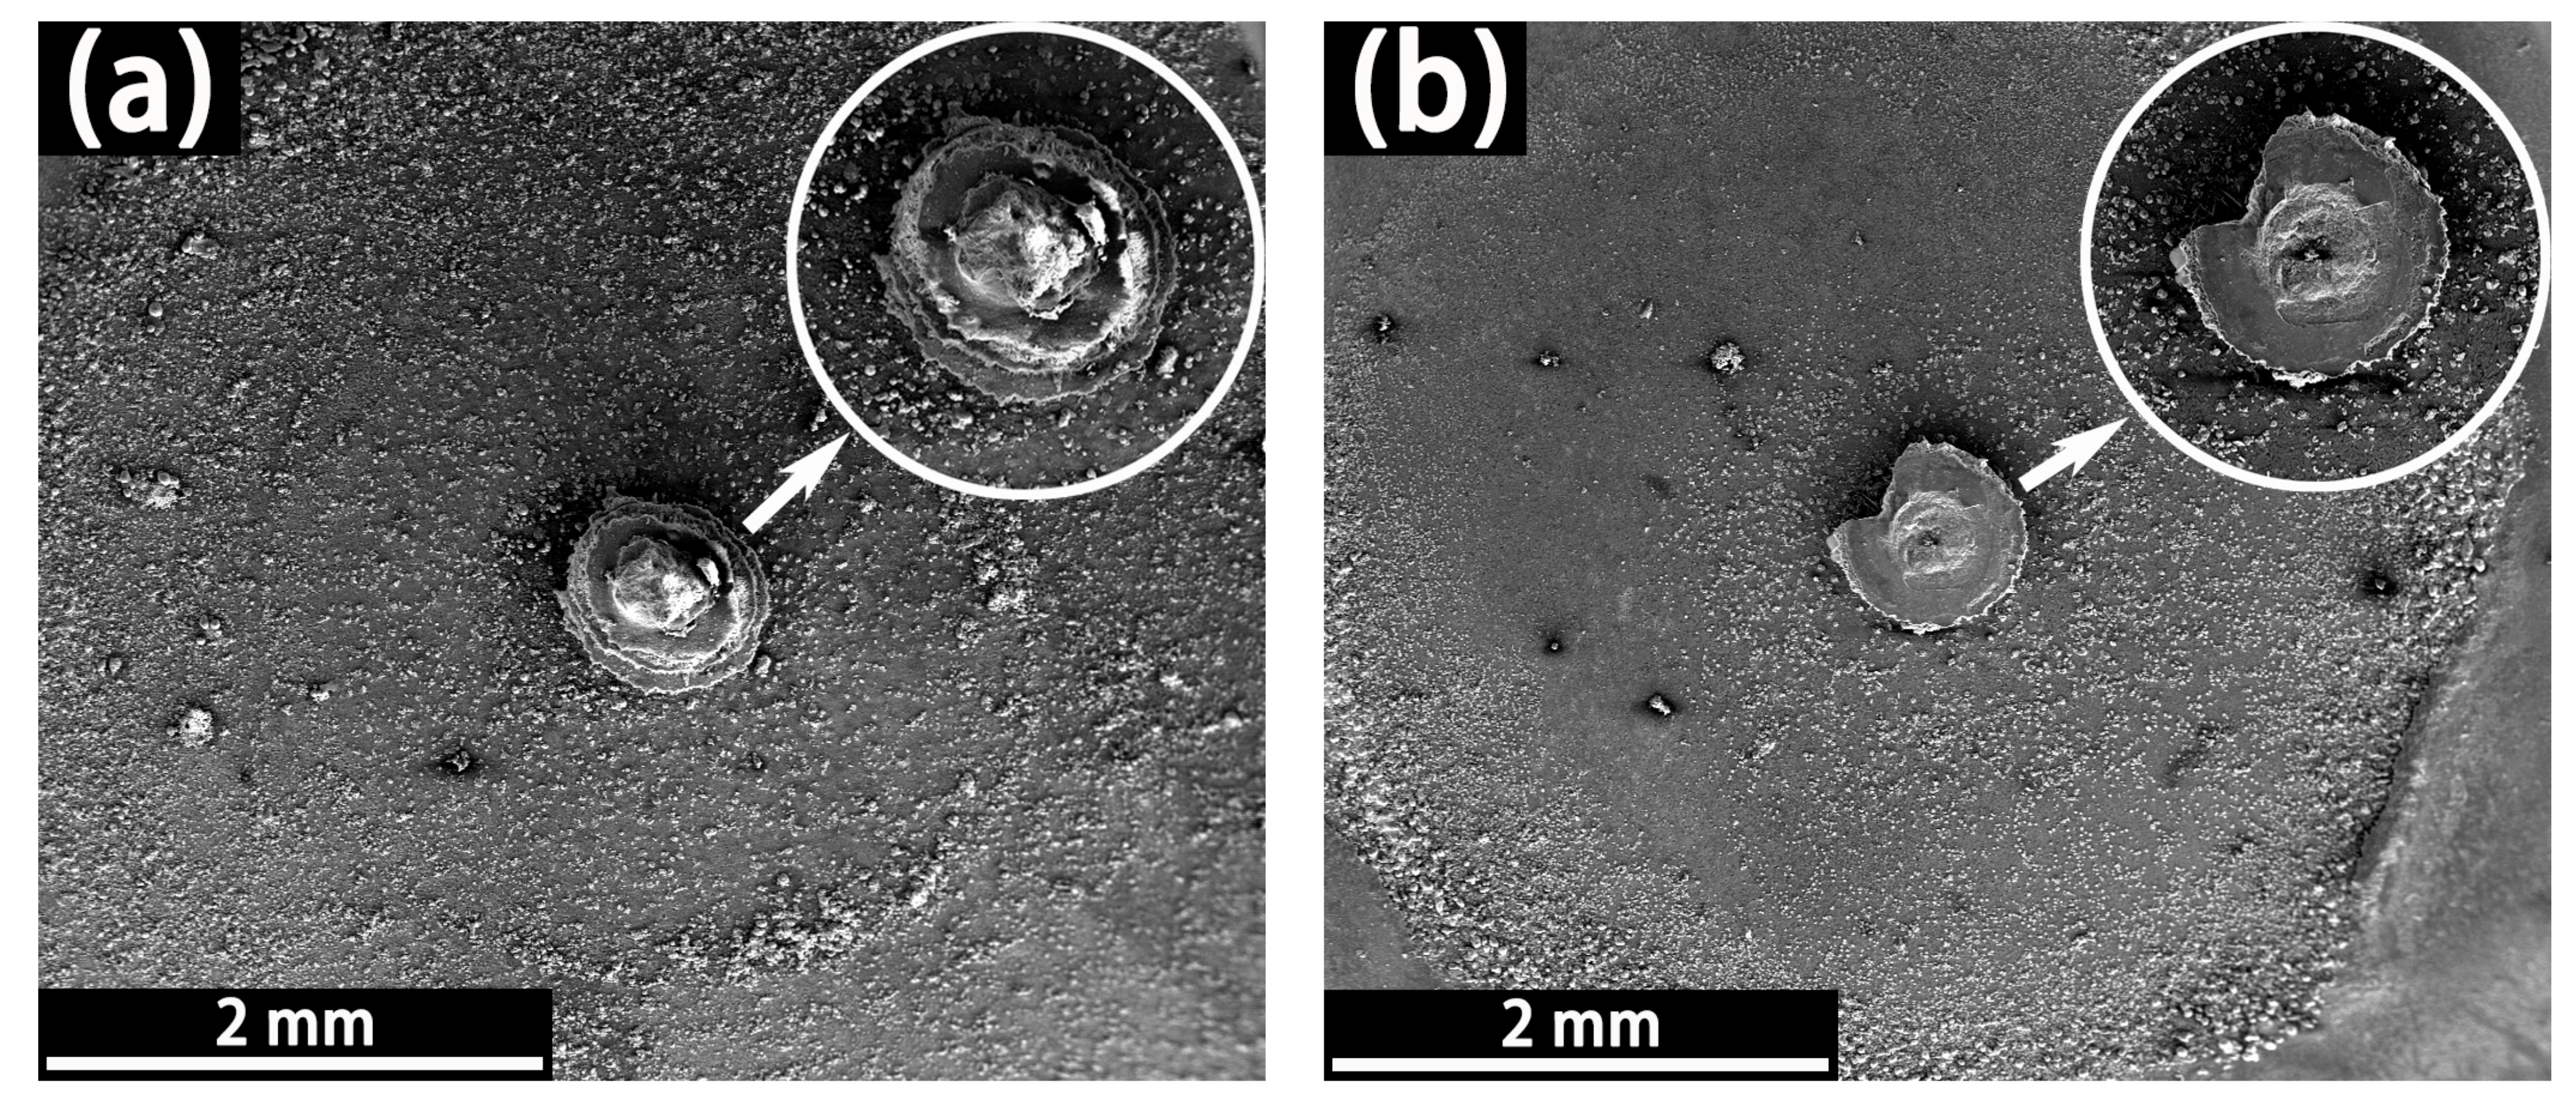
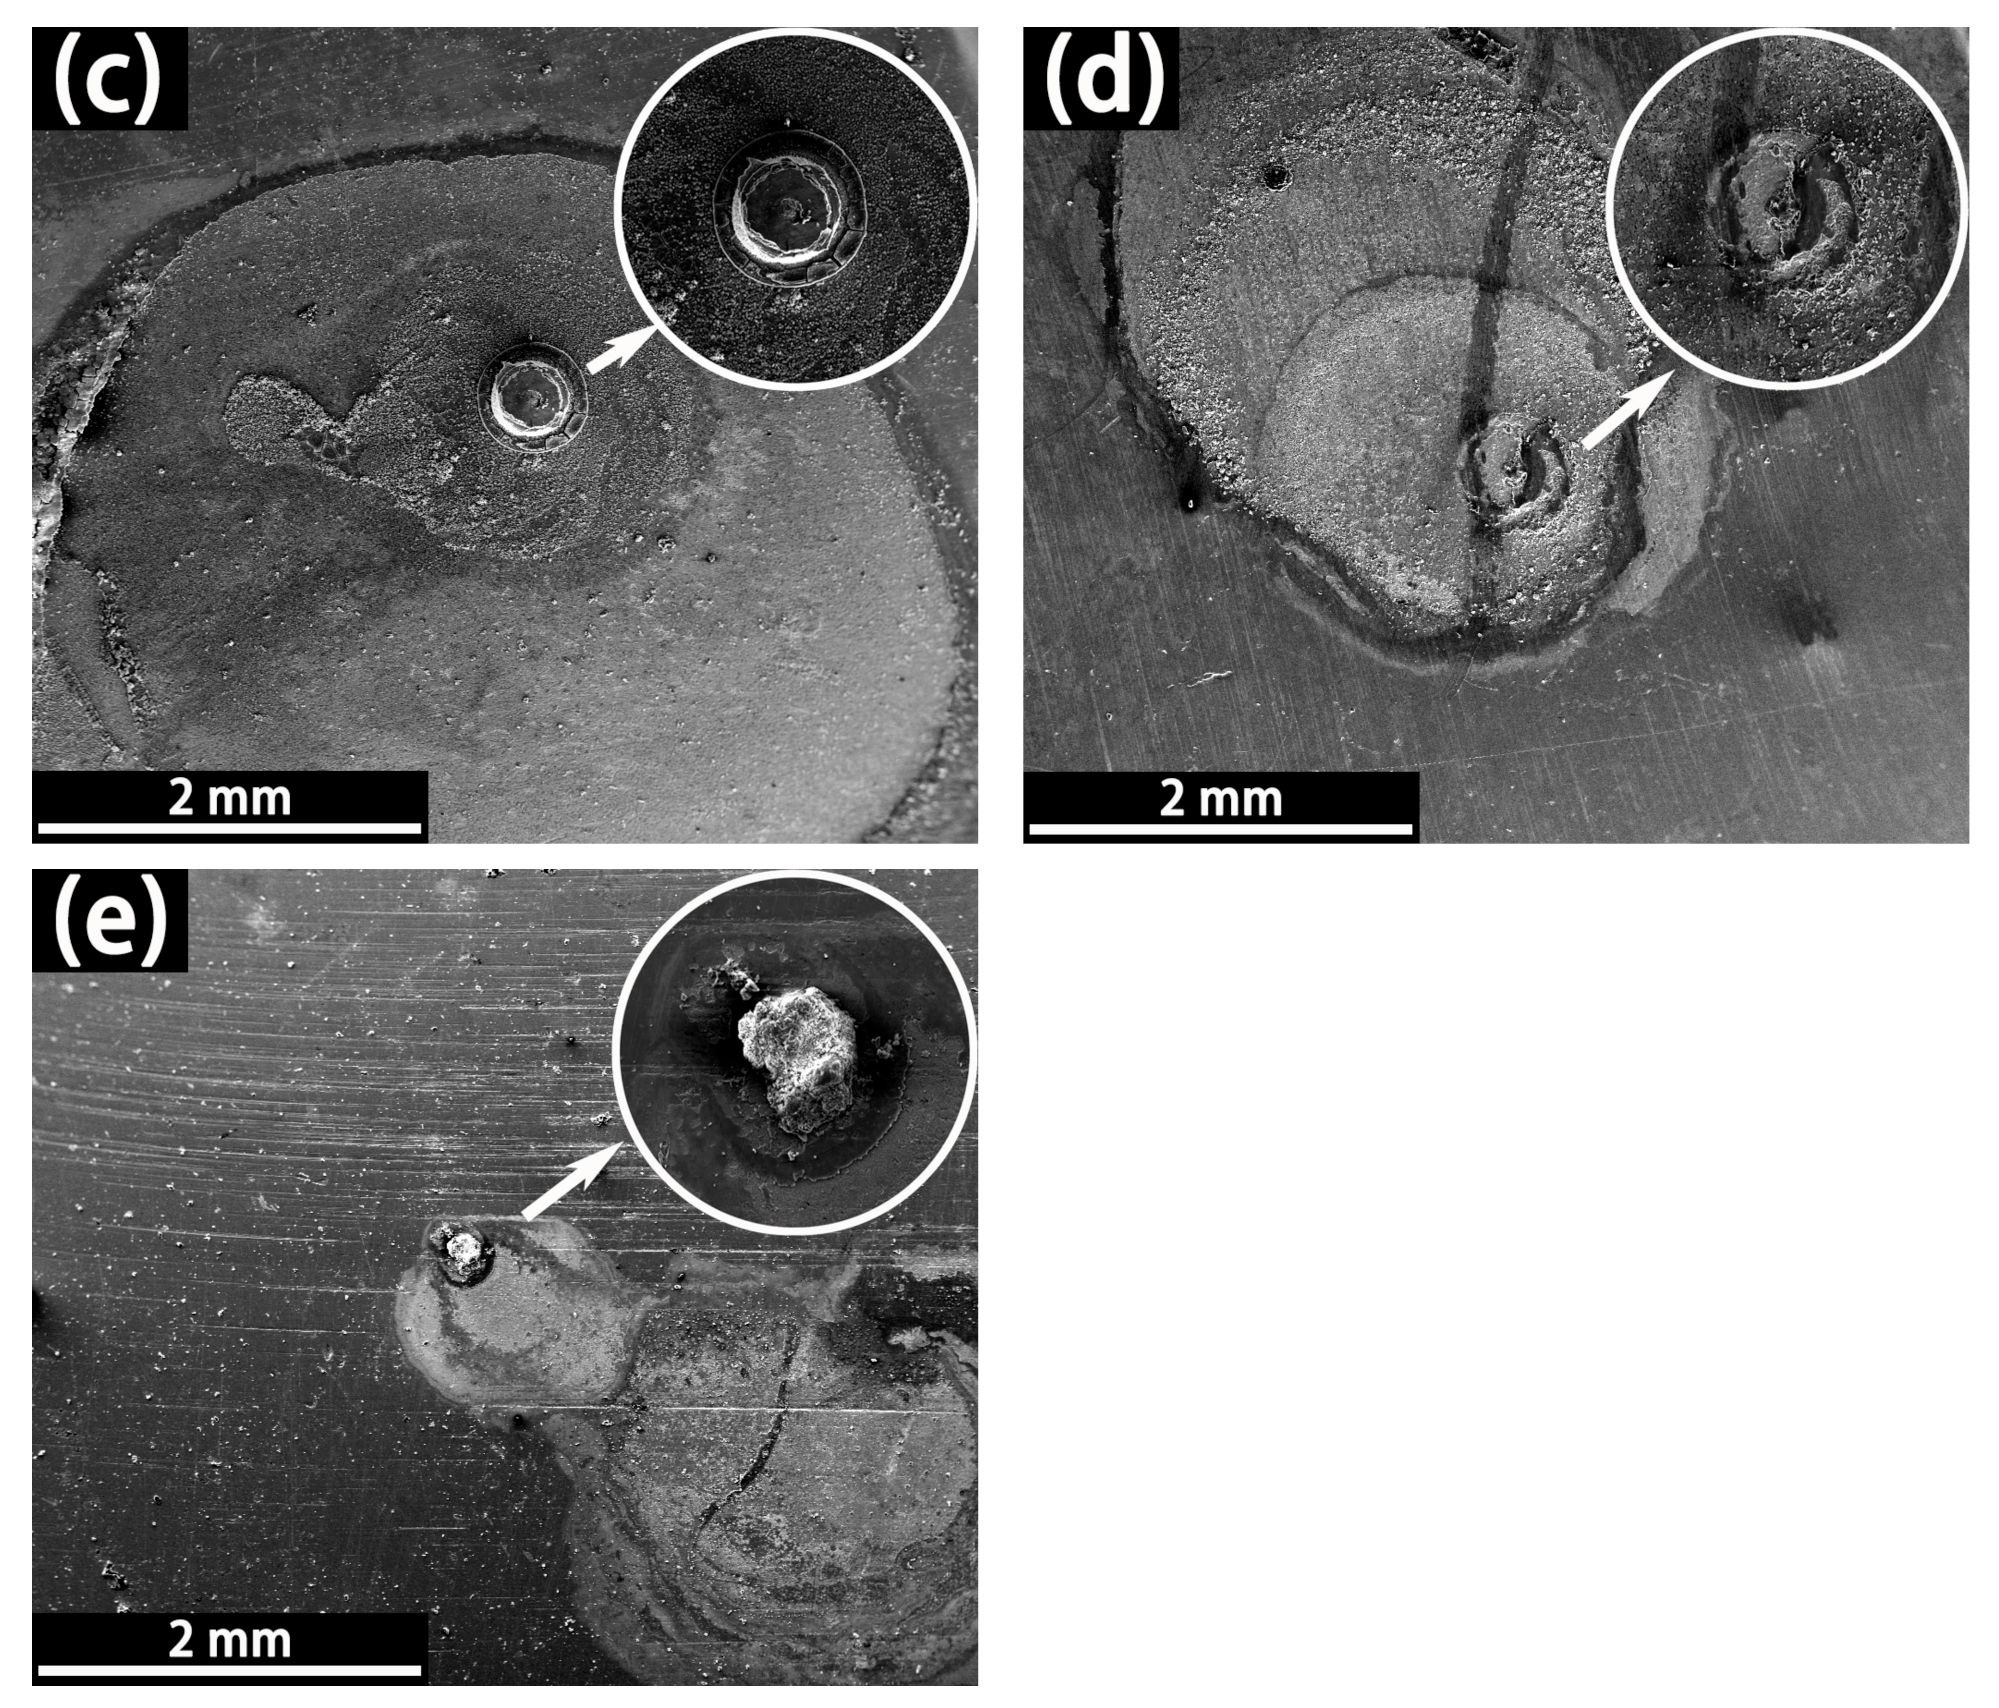
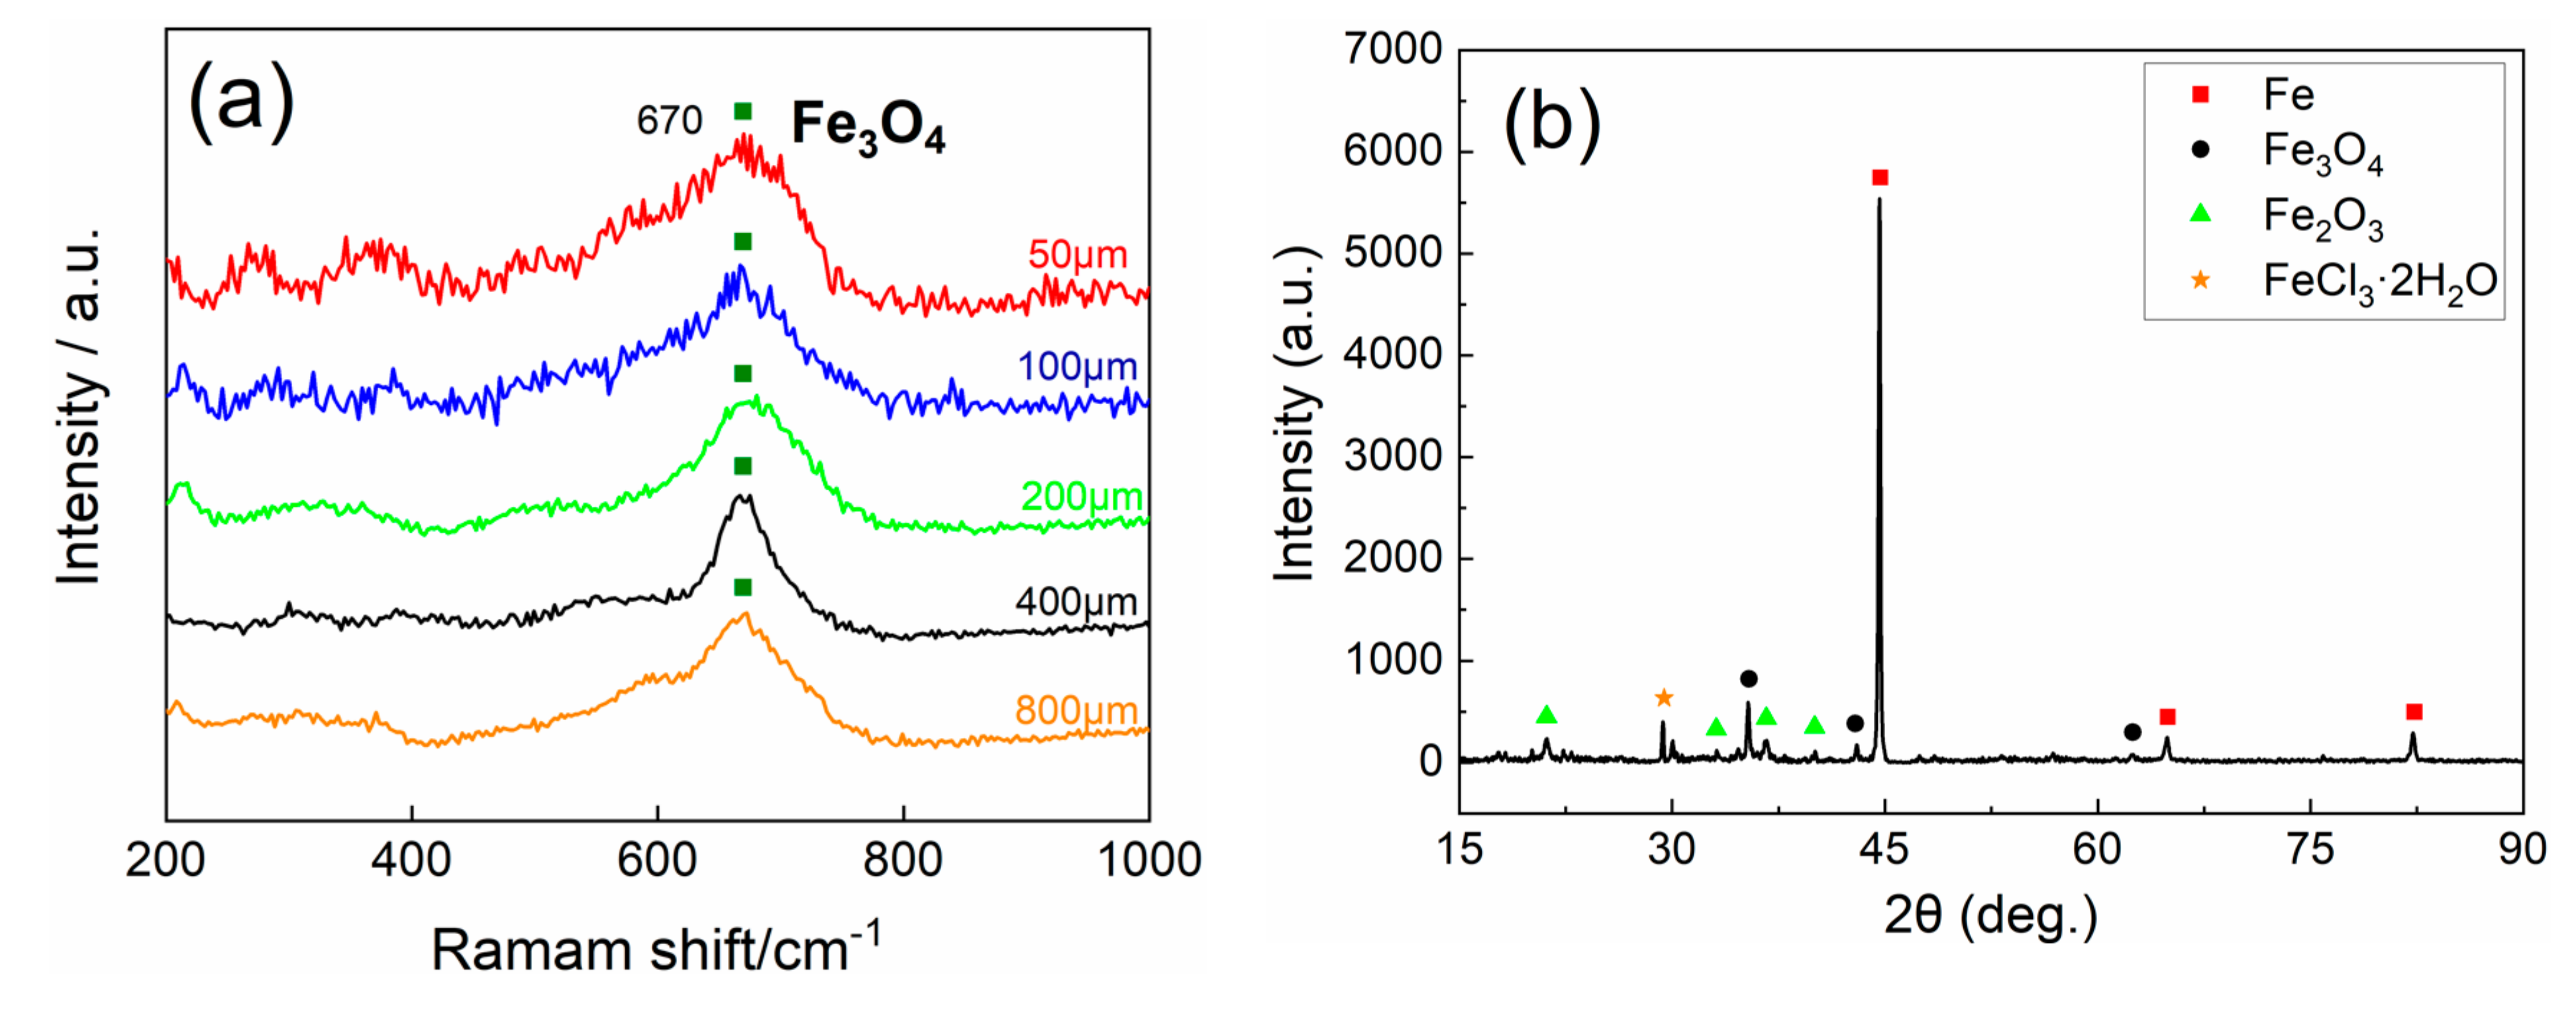
After the immersion of specimens in USPS for 84 days (the corrosion of all specimens reached the second stage), coatings were removed with acetone. The SEM micrographs of corrosion products on the surface of the substrate are shown in Figure 14. It was exhibited that there were prominent stratiform corrosion products with diameters of several hundreds of micrometers at the defects of S800~S200. The products of S50 and S100, most of which might have been taken by the coatings during the peeling process, were tremendously smaller, with a diameter of about decades of micrometers. What’s more, there are some thin corrosion products away from the defect. It is clear that, after a long period of immersion, the corrosion products completely blocked the microdefect, thereby slowing down the further corrosion. Moreover, some cathodic areas formed, and the products undermined the adhesion of the coating and substrate. Combined with XRD and Raman spectroscopy analysis (Figure 15), the corrosion products were mainly composed of Fe3O4 and Fe2O3.
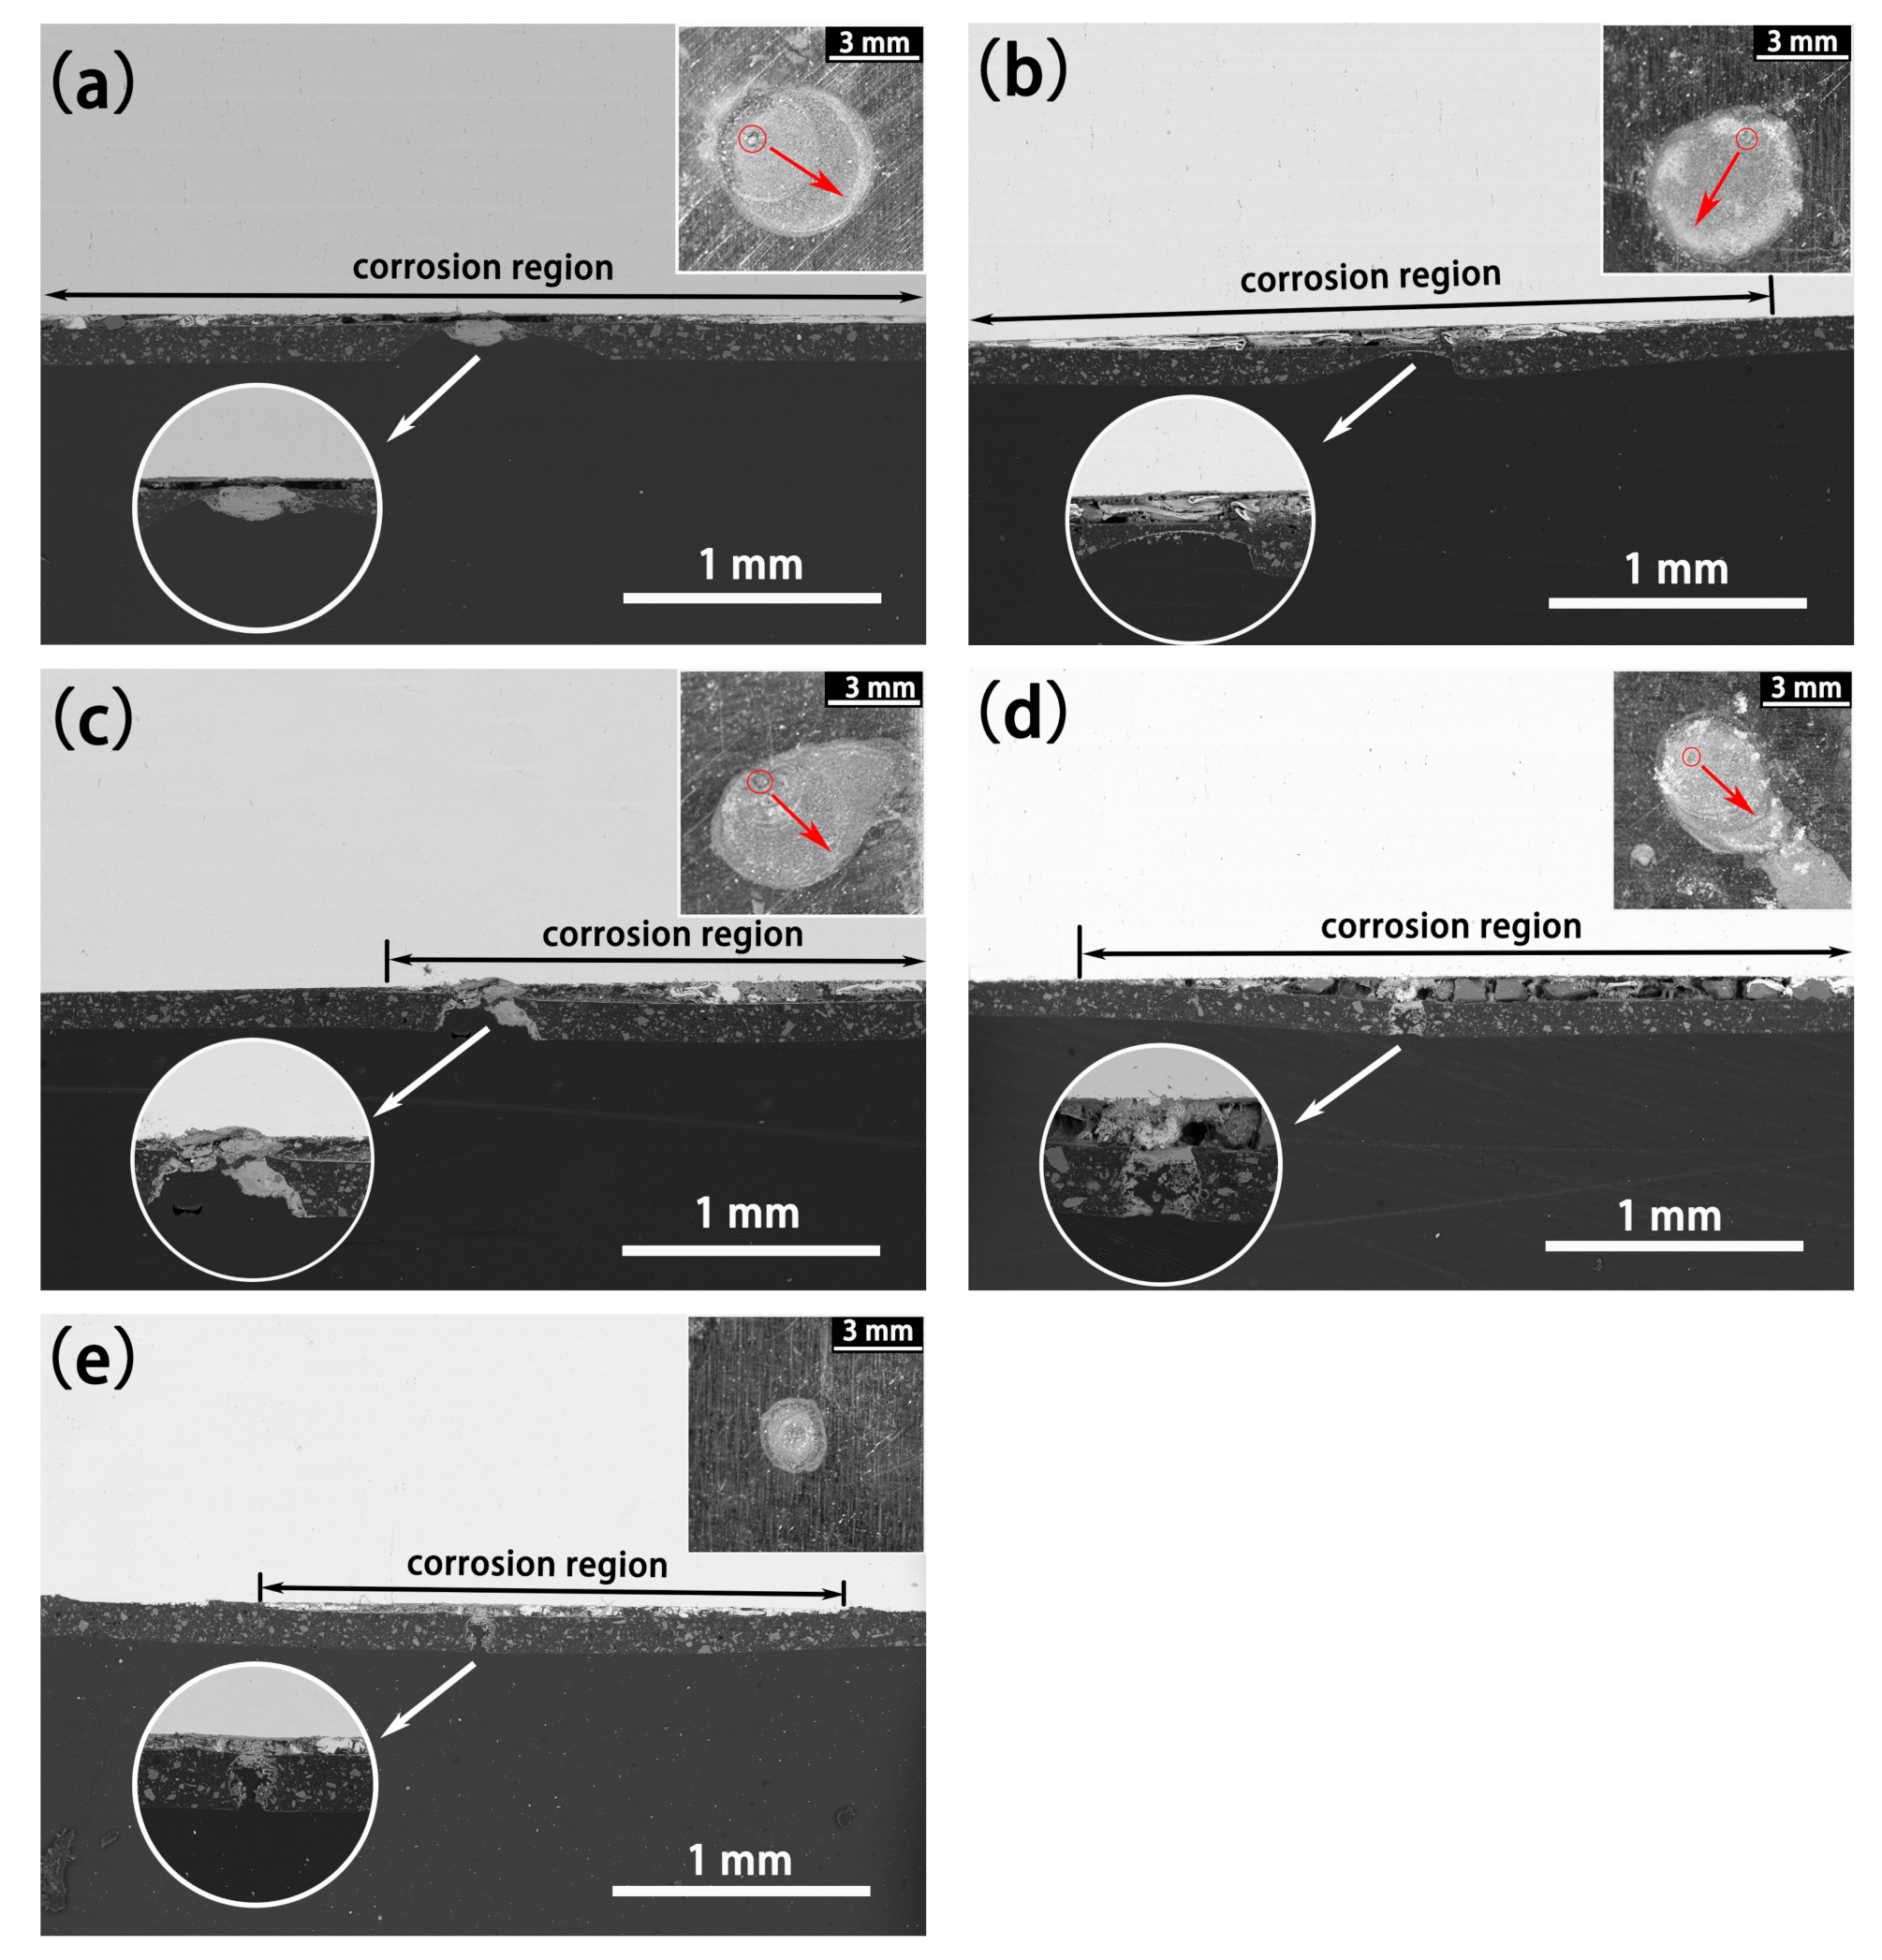
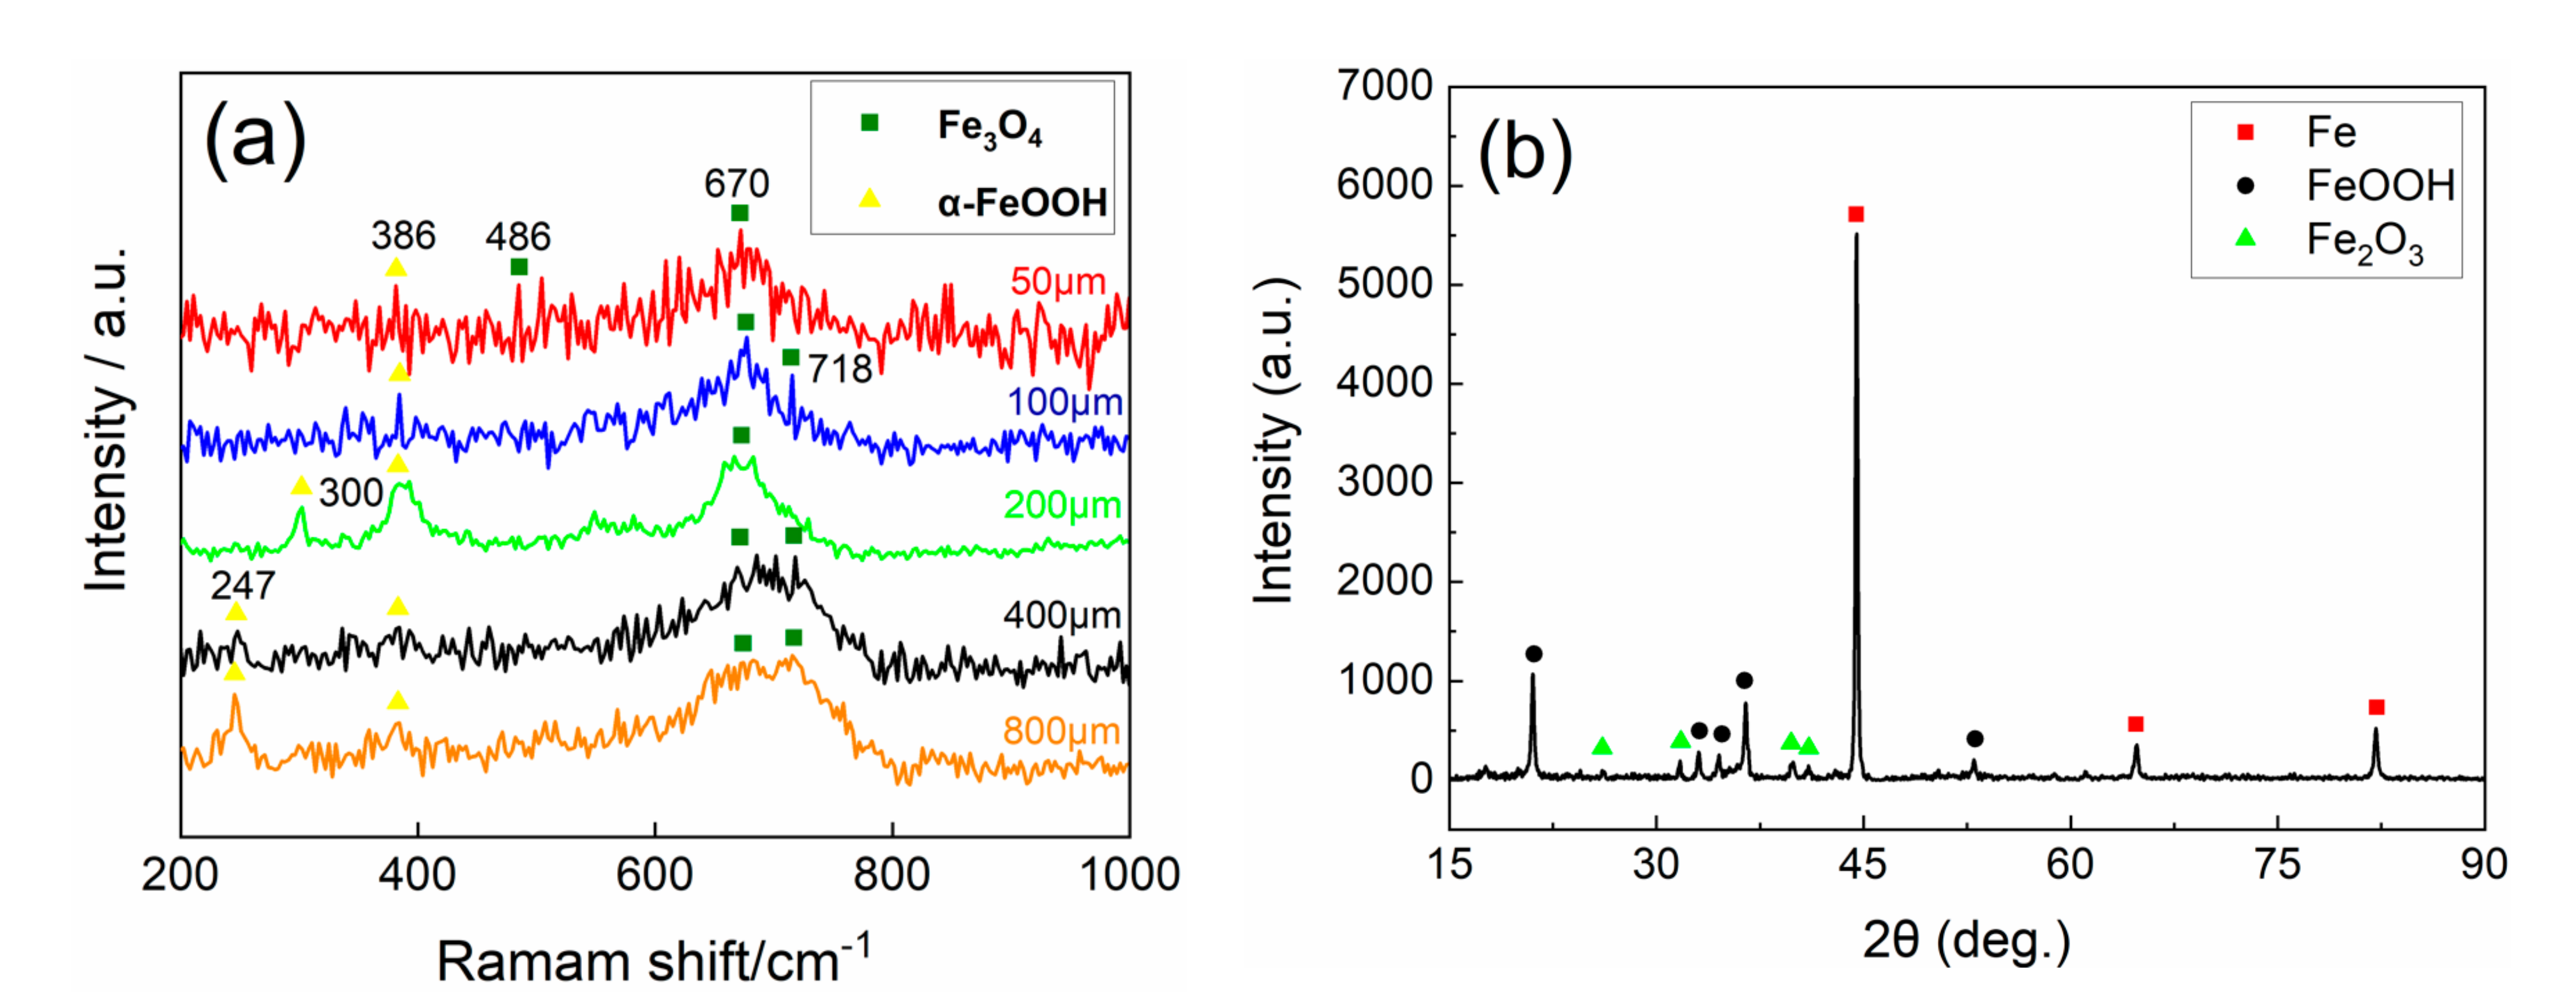
According to the metallographic diagram inserted in Figure 16, it can be seen that the corrosion products areas of S800~S100 were much larger than that of S50. Additionally, the SEM micrographic cross-sections showed that the corrosion products were asymmetric, with respect to the defects. The rust layer of S50 was much narrower and thinner than those of other specimens. It is indicated that S50 was equipped with a better corrosion resistance than others in CSPS. Furthermore, the corrosion products were radiating from the defect with a preferred orientation. Corrosion products, shown in SEM micrographic cross-sections, crept along the substrate–coating interface, and the coatings were disbonded from the rebars. Furthermore, there was no longitudinal erosion to the substrate, which meant it was crevice corrosion, rather than pitting, that occurred in this experiment. Different from the composition of rust layers in USPS, the final products in CSPS were mainly composed of Fe3O4, Fe2O3 and α-FeOOH, as is shown in Figure 17.
Figure 18 shows the schematics of the corrosion mechanism when defective specimens were immersed in CSPS and USPS. They could explain the phenomena and results in this experiment, to some extent. In CSPS, due to the existence of defects, the exposed substrate became anodic, and Fe2+ was generated rapidly by the effect of Cl. The insoluble ferrous oxide and oxyhydroxide were generated at first, e.g., green rust, and then transformed into α-FeOOH and β-FeOOH by oxidation and hydrolysis [34]. The formation of β-FeOOH required halogens, such as Cl, to stabilize the tunnel structure of β-FeOOH crystals [22,33]. Therefore, β-FeOOH would transform into α-FeOOH when removed from the solution, and this is why only α- FeOOH was detected in this experiment.
As reported by Zhang et al. [35] and Wang et al. [36], α-FeOOH and β-FeOOH exhibited an anion ion-selective property. They worked as a reservoir of Cl, transferring Cl from the solution to the surface of the steel and hindering the outward diffusion of iron ions. After a long period of corrosion, the defect was blocked by the products, and the oxygen was consumed. Some substrate-coating crevices at the edge of the defect were oxygen-deficient, and the external oxygen was relatively enriched, which means the differential concentration cell formed. The steel at the crevices continued to dissolve, but Fe2+ could not diffuse outward, due to the anion ion-selective effect, resulting in the excess of Fe2+ in this region. The external Cl migrated to the crevices for electrical neutrality, and the cathode process, in the meantime, shifted to outside of this region. The ferrous chloride hydrolyzed then increased the acidity and induced the regional corrosion again. At the same time, because of the accumulation and the block of corrosion products, a new differential concentration cell formed. This process seems to be autocatalysis and self-sustaining, so the corrosion products formed with a preferred orientation. As for S50, with a relatively small defect, the blocking by corrosion products were more effective; the transportation distance of substances in the corrosion process was shorter, and the differential concentration cell was hardly generated in this condition.
The slight crevice corrosion and cathodic corrosion occurred when specimens were immersed in USPS. The compact corrosion products accumulated and blocked the defects, which were mainly composed of Fe3O4. Thanks to the high alkalinity, specimens exhibited a better corrosion resistance than those in CSPS. In addition, we speculated that Fe3O4 has the cation ion-selective property, hindering the invasion of Cl and promoting the outward diffusion of iron ions. Fe3O4, which retarded the corrosion, continued to generate on the rust–solution interface with the consumption of O2 and OH.

4. Conclusions

The corrosion behaviors of epoxy-coated rebar with different microdefects immersed in USPS and CSPS have been investigated, respectively. The main conclusions of this study are as follows:
  • The defect size of epoxy-coated rebar is a crucial influence on the corrosion behavior. In the same conditions, the corrosion of S800~S100 was much more severe than that of S50. This indicates that the defect with a diameter of 50 μm might be a threshold. The deterioration of substrate and coatings caused by the defect smaller than 50 μm in diameter is much less than that of larger defects.
  • The corrosion mechanism in both SPS is crevice corrosion rather than pitting in this experiment, though there are microdefects on the coatings. The corrosion process is autocatalysis and self-sustaining in CSPS.
  • Specimens in USPS acquire a better corrosion resistance than those in CSPS, which means the high alkalinity of concrete can effectively alleviate the erosion of Cl.
  • The corrosion products do have a prominent influence on corrosion behavior. Experiments indicate that α-FeOOH and β-FeOOH exhibit the anion ion-selective property in the corrosion process. The existence of FeOOH facilitates the penetration of Cl to the substrate and hinders the diffusion of Fe2+ to the rust–solution interface. The enrichment of iron ions and chloridion under the rust induce the crevice corrosion.
  • It is speculated that Fe3O4 has the cation ion-selective property, hindering the invasion of Cl and promoting the penetration of iron ions to the rust–solution interface. Iron ions react with O2, and the new Fe3O4 layer generates on the rust, which protects the substrate ulteriorly.

Author Contributions

Conceptualization, Y.W.; formal analysis, H.Z. and H.C.; investigation, L.W.; resources, J.L. and Y.W.; data curation, L.W. and H.Z.; writing—original draft preparation, L.W.; writing—review and editing, H.Z.; supervision, Y.W. All authors have read and agreed to the published version of the manuscript.

Funding

This work was supported financially by the Strategic Precursor Research Program of the Chinese Academy of Sciences (No. XDA13040501) and National Natural Science Foundation of China (No.52071320).

Institutional Review Board Statement

Not applicable.

Informed Consent Statement

Not applicable.

Conflicts of Interest

The authors declare no conflict of interest.

References

  1. Li, Y.; Zhao, X.; Singh, R.R.; Al-Saadi, S. Experimental study on seawater and sea sand concrete filled GFRP and stainless steel tubular stub columns. Thin-Walled Struct. 2016, 106, 390–406. [Google Scholar] [CrossRef]
  2. Wang, Z.; Zhao, X.-L.; Xian, G.; Wu, G.; Raman, R.S.; Al-Saadi, S.; Haque, A. Long-term durability of basalt- and glass-fibre reinforced polymer (BFRP/GFRP) bars in seawater and sea sand concrete environment. Constr. Build. Mater. 2017, 139, 467–489. [Google Scholar] [CrossRef]
  3. Ann, K.Y.; Song, H.-W. Chloride threshold level for corrosion of steel in concrete. Corros. Sci. 2007, 49, 4113–4133. [Google Scholar] [CrossRef]
  4. Deflorian, F.; Rossi, S.; Fedel, M. Organic coatings degradation: Comparison between natural and artificial weathering. Corros. Sci. 2008, 50, 2360–2366. [Google Scholar] [CrossRef]
  5. Xia, D.H.; Wang, J.; Wu, Z.; Qin, Z.; Xu, L.; Hu, W.; Behnamian, Y.; Luo, J.L. Sensing corrosion within an artificial defect in or-ganic coating using SECM. Sens. Actuators B Chem. 2019, 280, 235–242. [Google Scholar] [CrossRef]
  6. Rosales, B.M.; Sarli, A.R.D.; Rincón, O.d.; Rincón, A.; Elsner, C.I.; Marchisio, B. An evaluation of coil coating formulations in marine environments. Prog. Org. Coat. 2004, 50, 105–114. [Google Scholar] [CrossRef]
  7. Zayed, A.M.; Sagues, A.A. Corrosion at surface damage on an epoxy-coated reinforcing steel. Corros. Sci. 1990, 30, 1025–1044. [Google Scholar] [CrossRef]
  8. Fernández-Álvarez, M.; Velasco, F.; Bautista, A.; Gonzalez-Garcia, Y.; Galiana, B. Corrosion Protection in Chloride Environments of Nanosilica Containing Epoxy Powder Coatings with Defects. J. Electrochem. Soc. 2020, 167, 161507. [Google Scholar] [CrossRef]
  9. Funke, W. Blistering of paint films and filiform corrosion. Prog. Org. Coat. 1981, 9, 29–46. [Google Scholar] [CrossRef]
  10. Zou, Y.; Wang, J.; Zheng, Y. Electrochemical techniques for determining corrosion rate of rusted steel in seawater. Corros. Sci. 2011, 53, 208–216. [Google Scholar] [CrossRef]
  11. Leng, A.; Streckel, H.; Stratmann, M. The delamination of polymeric coatings from steel. Part 1: Calibration of the Kelvinprobe and basic delamination mechanism. Corros. Sci. 1998, 41, 547–578. [Google Scholar] [CrossRef]
  12. Deflorian, F.; Rossi, S. An EIS study of ion diffusion through organic coatings. Electrochim. Acta 2006, 51, 1736–1744. [Google Scholar] [CrossRef]
  13. Leidheiser, H.L., Jr.; Wang, W.; Igetoft, L. The mechanism for the cathodic delamination of organic coatings from a metal surface. Prog. Org. Coat. 1983, 11, 19–40. [Google Scholar] [CrossRef]
  14. Mao, Y.-Z.; Wei, Y.-H.; Zhao, H.-T.; Lv, C.-X.; Cao, H.-J.; Li, J. Corrosion Behavior of Epoxy-Coated Rebar with Pinhole Defect in Seawater Concrete. Acta Met. Sin. Engl. Lett. 2018, 31, 1171–1182. [Google Scholar] [CrossRef] [Green Version]
  15. Jorcin, J.-B.; Aragon, E.; Merlatti, C.; Pébère, N. Delaminated areas beneath organic coating: A local electrochemical impedance approach. Corros. Sci. 2006, 48, 1779–1790. [Google Scholar] [CrossRef]
  16. Burstein, G.; Ilevbare, G. The effect of specimen size on the measured pitting potential of stainless steel. Corros. Sci. 1996, 38, 2257–2265. [Google Scholar] [CrossRef]
  17. Li, L.; Sagüés, A.A. Chloride Corrosion Threshold of Reinforcing Steel in Alkaline Solutions—Effect of Specimen Size. Corrosion 2004, 60, 195–202. [Google Scholar] [CrossRef]
  18. Angst, U.; Rønnquist, A.; Elsener, B.; Larsen, C.K.; Vennesland, Ø. Probabilistic considerations on the effect of specimen size on the critical chloride content in reinforced concrete. Corros. Sci. 2011, 53, 177–187. [Google Scholar] [CrossRef]
  19. Zhong, C.; Tang, X.; Cheng, Y. Corrosion of steel under the defected coating studied by localized electrochemical impedance spectroscopy. Electrochim. Acta 2008, 53, 4740–4747. [Google Scholar] [CrossRef]
  20. De Vooys, A.; van der Weijde, H. Investigating cracks and crazes on coated steel with simultaneous SVET and EIS. Prog. Org. Coat. 2011, 71, 250–255. [Google Scholar] [CrossRef]
  21. Kessler, S.; Angst, U.; Zintel, M.; Gehlen, C. Defects in epoxy-coated reinforcement and their impact on the service life of a concrete structure A study of critical chloride content and macro-cell corrosion A study of critical chloride content and mac-ro-cell corrosion. Struct. Concr. 2015, 16, 398–405. [Google Scholar] [CrossRef]
  22. Nishimura, T.; Katayama, H.; Noda, K.; Kodama, T. Electrochemical behavior of rust formed on carbon steel in a wet/dry en-vironment containing chloride ions. Corrosion 2000, 56, 935–941. [Google Scholar] [CrossRef]
  23. Musić, S.; Gotić, M.; Popović, S. X-ray diffraction and Fourier transform-infrared analysis of the rust formed by corrosion of steel in aqueous solutions. J. Mater. Sci. 1993, 28, 5744–5752. [Google Scholar] [CrossRef]
  24. Refait, P.; Génin, J.-M. The oxidation of ferrous hydroxide in chloride-containing aqueous media and pourbaix diagrams of green rust one. Corros. Sci. 1993, 34, 797–819. [Google Scholar] [CrossRef]
  25. King, A.D.; Birbilis, N.; Scully, J.R. Accurate Electrochemical Measurement of Magnesium Corrosion Rates; a Combined Im-pedance, Mass-Loss and Hydrogen Collection Study. Electrochim. Acta 2014, 121, 394–406. [Google Scholar] [CrossRef]
  26. Tang, Y.M.; Dun, Y.C.; Miao, Y.F.; Zhao, X.H.; Zuo, Y. Influence of the C-S-H Amount on [Cl]/[OH] Ratio of Simulated Con-crete SPS and the Corrosion Susceptibility of Steel. J. Wuhan Univ. Technol. 2017, 32, 430–436. [Google Scholar] [CrossRef]
  27. Macedo, M.C.S.S.; Margarit-Mattos, I.C.P.; Fragata, F.L.; Jorcin, J.B.; Pébère, N.; Mattos, O.R. Contribution to a better under-standing of different behaviour patterns observed with organic coatings evaluated by electrochemical impedance spectros-copy. Corros. Sci. 2009, 51, 1322–1327. [Google Scholar] [CrossRef] [Green Version]
  28. Zou, F.; Thierry, D. Localized electrochemical impedance spectroscopy for studying the degradation of organic coatings. Electrochim. Acta 1997, 42, 3293–3301. [Google Scholar] [CrossRef]
  29. Mi, W.B.; Jiang, E.Y.; Bai, H.L. Fe3+/Fe2+ ratio controlled magnetic and electrical transport properties of polycrystalline Fe3(1-delta)O4 films. J. Phys. D Appl. Phys. 2009, 42, 7. [Google Scholar] [CrossRef]
  30. Fujii, T.; de Groot, F.M.F.; Sawatzky, G.A.; Voogt, F.C.; Hibma, T.; Okada, K. In situXPS analysis of various iron oxide films grown byNO2-assisted molecular-beam epitaxy. Phys. Rev. B 1999, 59, 3195–3202. [Google Scholar] [CrossRef] [Green Version]
  31. Aronniemi, M.; Sainio, J.; Lahtinen, J. Chemical state quantification of iron and chromium oxides using XPS: The effect of the background subtraction method. Surf. Sci. 2005, 578, 108–123. [Google Scholar] [CrossRef]
  32. Crist, B.V. Handbook of Monochromatic XPS Spectra. IEEE Electr. Insul. Mag. 1999, 19, 47. [Google Scholar]
  33. Asami, K.; Kikuchi, M. In-depth distribution of rusts on a plain carbon steel and weathering steels exposed to coastal–industrial atmosphere for 17 years. Corros. Sci. 2003, 45, 2671–2688. [Google Scholar] [CrossRef]
  34. Cornell, R.M.; Schwertmann, U. The Iron Oxides: Structure, Properties, Reactions, Occurrences and Uses, 2nd ed.; John Wiley & Sons: Hoboken, NJ, USA, 2003. [Google Scholar]
  35. Zhang, Q.C.; Wu, J.S.; Wang, J.J.; Zheng, W.L.; Chen, J.G.; Li, A.B. Corrosion behavior of weathering steel in marine atmos-phere. Mater. Chem. Phys. 2003, 77, 603–608. [Google Scholar] [CrossRef]
  36. Wang, J.; Wang, Z.Y.; Ke, W. A study of the evolution of rust on weathering steel submitted to the Qinghai salt lake atmos-pheric corrosion. Mater. Chem. Phys. 2013, 139, 225–232. [Google Scholar] [CrossRef]
Figure 1. Potentiodynamic polarization curves of specimens with different microdefects immersed in uncarbonated simulated pore solution (USPS) (a) and carbonated simulated pore solution (CSPS) (b) for 2 h.
Coatings 11 00439 g001
Figure 2. Electrical equivalent circuit used to simulate the electrochemical impedance spectroscopy (EIS) data of defective specimens in stage Ⅰ (a) and stage Ⅱ (b).
Coatings 11 00439 g002
Figure 3. Open circuit potential (OCP)-elapsed time curves of defective specimens in USPS (a) and CSPS (b).
Coatings 11 00439 g003
Figure 4. Nyquist (a,c) and Bode (b,d) plots of specimens with different defects immersed in USPS (a,b) and CSPS (c,d) for 24 h.
Coatings 11 00439 g004
Figure 5. The variation trend of the Ro with the size of the defects in USPS and CSPS for 24 h.
Coatings 11 00439 g005
Figure 6. Nyquist (a,c) and Bode (b,d) plots of specimens with different defects at corrosion stage Ⅱ in different solutions: USPS (a,b) and CSPS (c,d).
Coatings 11 00439 g006
Figure 7. Local electrochemical impedance spectroscopy (LEIS) mappings around the defects of S800 (a), S400 (b), S200 (c), S100 (d) and S50 (e) before being immersed in simulated pore solution (SPS).
Coatings 11 00439 g007aCoatings 11 00439 g007b
Figure 8. LEIS mappings around the defects of S800 (a1,a2), S400 (b1,b2), S200 (c1,c2), S100 (d1,d2) and S50 (e1,e2) after being immersed in USPS for 24 h (a1e1) and 84 d (a2e2).
Coatings 11 00439 g008aCoatings 11 00439 g008b
Figure 9. LEIS mappings around the defects of S800 (a1,a2), S400 (b1,b2), S200 (c1,c2), S100 (d1,d2) and S50 (e1,e2) after being immersed in CSPS for 21 d (a1e1) and 63 d (a2e2).
Coatings 11 00439 g009aCoatings 11 00439 g009b
Figure 10. Scanning vibrating electrode technique (SVET) mappings around the defects of S800 (a), S400 (b), S200 (c), S100 (d) and S50 (e) before being immersed in SPS.
Coatings 11 00439 g010aCoatings 11 00439 g010b
Figure 11. SVET mappings around the defects of S800 (a), S400 (b), S200 (c), S100 (d) and S50 (e) after being immersed in USPS for 84 d.
Coatings 11 00439 g011aCoatings 11 00439 g011b
Figure 12. SVET mappings around the defects of S800 (a1,a2), S400 (b1,b2), S200 (c1,c2), S100 (d1,d2) and S50 (e1,e2) after being immersed in CSPS for 24 h (a1e1) and 63 d (a2e2).
Coatings 11 00439 g012aCoatings 11 00439 g012b
Figure 13. XPS graphs of substrate surface under different conditions: (a) XPS depth etching diagram; (b) XPS spectrum of Fe 2p on surface of specimen before immersed in SPS; (c,d) XPS spectra of Fe 2p on the surface of specimens immersed in USPS and CSPS, respectively, for 24 h.
Coatings 11 00439 g013aCoatings 11 00439 g013b
Figure 14. SEM micrographs of corrosion products under coating after being immersed in USPS for 84 days: (a) S800, (b) S400, (c) S200, (d) S100, (e) S50.
Coatings 11 00439 g014aCoatings 11 00439 g014b
Figure 15. Ramam spectrum (a) and X-ray diffraction (b) analysis of the rust layer after immersed in USPS for 84 days.
Coatings 11 00439 g015
Figure 16. SEM micrographic cross-sections of defects with metallographs of corrosion products under coating inserted after being immersed in CSPS for 63 days: (a) S800, (b) S400, (c) S200, (d) S100, (e) S50.
Coatings 11 00439 g016
Figure 17. Ramam spectrum (a) and X-ray diffraction (b) analysis of the rust layer after being immersed in CSPS for 63 days.
Coatings 11 00439 g017
Figure 18. Schematic of the corrosion mechanism when defective specimens were immersed in CSPS (a) and USPS (b).
Coatings 11 00439 g018
Table 1. Chemical composition of the reinforcing steel bar used in this study.
ElementCSiMnPSCrNiCuVFe
wt.%0.220.431.250.0170.020.030.020.020.035Bal
Table 2. Abbreviations for the specimens with different sizes of defects.
Diameter of Defect (μm)80040020010050
NameS800S400S200S100S50
Table 3. Composition and pH of simulated pore solutions.
SolutionConcentration (mol/L)pH
NaOH Ca(OH)2NaHCO3Na2CO3NaCl
USPS0.1saturated000.613.2
CSPS000.060.040.69.8
Table 4. Fitting data of polarization curves.
SolutionFitting Data Specimen
80040020010050
USPSEcorr (V)−0.368−0.261−0.183−0.161−0.149
Icorr (A/cm2)7.74 × 10−103.22 × 10−109.546 × 10−111.07 × 10−109.31× 10⁻¹¹
CSPSEcorr (V)−0.488−0.437−0.379−0.349−0.169
Icorr (A/cm2)1.06× 10−79.39 × 10−83.24 × 10−93.89 × 10−101.17 × 10⁻¹⁰
Table 5. Overview of the defect and periphery impedance obtained in LEIS experiments.
S800S400S200S100S50
Impedance (Ohm)
USPS0 hdefect1.05 × 1050.90 × 1050.99 × 1051.17 × 1050.96 × 105
periphery1.14 × 1051.32 × 1051.53 × 1051.31 × 1051.04 × 105
24 hdefect1.00 × 1060.74 × 1061.60 × 1063.10 × 1064.40 × 106
periphery8.56 × 1065.40 × 1061.07 × 1072.83 × 1072.57 × 107
84 daysdefect1.21 × 1061.08 × 1061.24 × 1061.21 × 1061.22 × 106
periphery1.64 × 1061.33 × 1061.63 × 1061.54 × 1061.40 × 106
CSPS0 hdefect1.05 × 1050.90 × 1050.99 × 1051.17 × 1050.96 × 105
periphery1.14 × 1051.32 × 1051.53 × 1051.31 × 1051.04 × 105
21 daysdefect3.21 × 1055.34 × 1053.28 × 1054.49 × 1054.88 × 105
periphery4.04 × 1056.97 × 1054.43 × 1058.23 × 1051.11 × 106
63 daysdefect1.47 × 1061.30 × 1061.38 × 1061.65 × 1061.30 × 106
periphery1.81 × 1061.73 × 1061.78 × 1062.03 × 1061.77 × 106
Table 6. Overview of the defect current density obtained in SVET experiments.
S800S400S200S100S50
Current Density (μA/cm2)
USPS0 h23.020.720.717.03.76
84 d0.240.220.210.090−0.015~0.045
CSPS0 h23.020.720.717.03.76
21 d14.912.416.813.44.20
63 d0.6760.5300.4660.444−0.041~0.027
Publisher’s Note: MDPI stays neutral with regard to jurisdictional claims in published maps and institutional affiliations.