Next Article in Journal
Effect of Carrier Gas Flow Field on Chemical Vapor Deposition of 2D MoS2 Crystal
Next Article in Special Issue
Addendum: Gilani et al. Formulation and Optimization of Nano Lipid Based Oral Delivery Systems for Arthritis. Coatings 2021, 11, 548
Previous Article in Journal
Surface and Interface Investigation of a 15th Century Wall Painting Using Multispectral Imaging and Pulse-Compression Infrared Thermography
Previous Article in Special Issue
A Facile Urea-Assisted Thermal Decomposition Process of TiO2 Nanoparticles and Their Photocatalytic Activity
 
 
Addendum published on 30 June 2021, see Coatings 2021, 11(7), 781.
Article

Formulation and Optimization of Nano Lipid Based Oral Delivery Systems for Arthritis

by
Sadaf Jamal Gilani
1,*,
May Nasser Bin-Jumah
2,3,
Syed Sarim Imam
4,
Sultan Alshehri
4,
Mohammed Asadullah Jahangir
5 and
Ameeduzzafar Zafar
6
1
Department of Basic Health Sciences, Preparatory Year, Princess Nourah bint Abdulrahman University, Riyadh 11671, Saudi Arabia
2
Biology Department, College of Science, Princess Nourah bint Abdulrahman University, Riyadh 11671, Saudi Arabia
3
Environment and Biomaterial Unit, Health Sciences Research Center, Princess Nourah bint Abdulrahman University, Riyadh 11671, Saudi Arabia
4
Department of Pharmaceutics, College of Pharmacy, King Saud University, Riyadh 11451, Saudi Arabia
5
Department of Pharmaceutics, Nibha Institute of Pharmaceutical Sciences, Rajgir 803116, India
6
Department of Pharmaceutics, College of Pharmacy, Jouf University, Aljouf Region 72341, Saudi Arabia
*
Author to whom correspondence should be addressed.
Coatings 2021, 11(5), 548; https://doi.org/10.3390/coatings11050548
Submission received: 23 March 2021 / Revised: 25 April 2021 / Accepted: 29 April 2021 / Published: 6 May 2021

Abstract

:
Rheumatoid arthritis is an autoimmune disease characterized by chronic synovitis that leads to tissue dysfunction as well as loss of complete function. There are several synthetic NSAIDs, glucocorticoids and biological drugs that are commonly used to treat arthritis. These drugs have severe life-threatening side effects. The use of a bioactive compound (Apigenin) could be an alternative to synthetic conventional delivery systems. It is a poorly water-soluble drug having a wide range of pharmacological activities. It has been reported for potential anti-inflammatory and anti-arthritic activity. In the present study, Apigenin (APG) solid lipid nanoparticles were prepared using the solid lipid (glyceryl mono stearate, GMS), surfactant (d -α-Tocopheryl polyethylene glycol 1000 succinate, TPGS) and sonication time (ST). The optimized APG SLNs showed a particle size of 161.7 nm and encapsulation efficiency of 80.44 ± 4.11%. It was further coated with 0.1% w/v chitosan (APG-CH-SLNs) and showed the particle size, PDI and zeta potential of 185.4 nm, 0.45 + 26.7 mV, respectively. The significant (p < 0.001) enhancement in drug release, permeation and mucoadhesive study was observed after chitosan coating. The antioxidant study results depicted an increase in antioxidant property. Finally, the anti-arthritic biochemical parameters revealed marked changes in the results in comparison to arthritic control animals. From the study, it was concluded that APG-loaded mucoadhesive lipid nanoparticles are an alternative to the synthetic oral delivery systems.

1. Introduction

Rheumatoid arthritis (RA) is a chronic systemic inflammatory disorder characterized by synovitis. In RA, there is localized damage that takes place on the articular cartilage, tendon, ligament and bone which gives loss of function [1]. It occurs in all age groups and the maximum affected persons are in the age group of 35–50 years. It affects around ~1% of the world total population, and women are more affected than men [2]. There is an increase in proinflammatory cytokines [Tumor necrosis factor (TNF-α), Interleukin 6 (IL-6), Interleukin (IL-1β)] and a decrease in anti-inflammatory cytokines mainly IL-4 and IL-6. There are many nonsteroidal anti-inflammatory drugs, steroids, anti-rheumatic drugs that are commonly used to control the disease. These drugs give symptomatic relief but the major drawback of these drugs is the severe side effects like ulcer, hypertension gastrointestinal disturbance and stroke [3]. To overcome the effects of synthetic drugs the use of herbal bioactive compounds gives a better alternative to drug-resistant, side effects and reduced toxicity.
The use of a bioactive drug has been widely used to treat local and systemic diseases. APG is a flavonoid found in various fruits, flowers, vegetables and tea. It has been reported for different biological activity such as anti-inflammatory, antidiabetic anti-tumour, antiarthritic, and antioxidant activities [4,5]. APG has also shown the antiarthritic activity by inhibiting the colleganse activity involved in RA. It inhibits the proteolytic activity, secretion, and gene expression of matrix metalloproteinase-3 (MMP-3) which help in effective treatment in arthritis [6] and suppress the excess production of cytokines induced by tumour necrosis factor (TNFά) in mice [7]. The clinical application is limited due to its poor aqueous solubility and bioavailability. It belongs to BCS class II drug and has a reported aqueous solubility <2 μg/mL [8]. Poor aqueous solubility is one of the factors that is leading to poor absorption in gastro-intestinal tract (GIT). It has been metabolized after oral administration. So, there is a need to prepare novel formulation to overcome these drawbacks.
The application of nanoformulations have shown multidisciplinary use in the diagnosis and treatment of different diseases. It can easily target the affected inflamed area by controlling the release of the therapeutic drug. It can protect the drug from degradation and modulate the drug release [1]. Among different nanoformulations, the use of solid lipid nanoparticles (SLNs) has found to be a potential oral delivery system. It has provided high drug load, stability and prolonged drug release. It is prepared with biodegradable lipids and provides greater solubility and bioavailability [9,10].
There are several oral SLNs formulations that are prepared with different types of lipids and functions as enhancers in gastrointestinal region (GIT), and this helps to enhance the oral bioavailability. The lipids used to prepare SLNs are recognized as safe with no or minimal toxicity [11,12]. The loading of drugs into SLNs alter the intestinal permeability after oral absorption. Drugs absorb to the systemic circulation via the lymphatic system through M cells of Peyer’s patches found in the ileum [13]. SLNs are absorbed lymphatically and also bypass the first pass circulation via the liver [14]. However, nanoparticles can also be cleared quickly by macrophages in the reticuloendothelial system (RES) and obstruct the drug to reach the inflamed joints. The enhanced drug penetration gives enhanced drug absorption as well as distribution to tissues and bones. It helps to reach a high concentration in the synovium joint, and also helps to get increased anti-inflammatory response [15,16].
Chitosan (CH) is a cationic, nontoxic, natural polysaccharide polymer obtained from chitin [17]. It is biocompatible, biodegradable and widely used to enhance the mucoadhesive property. It is also used as a permeation enhancer as well as reported for antioxidant activity [18]. The cationic charge on the chitosan surface binds to the negatively charged cell membranes and helps to disrupt the plasma membrane, reduces the trans-epithelial electric resistance and increases the transcellular as well paracellular diffusion of the drugs [19,20]. Due to the enhanced mucoadhesive property the residence time of the loaded drug increases and gives high drug absorption [21]. The chitosan-coated SLNs showed higher therapeutic efficacy due to the greater surface area available for drug absorption. The presence of chitosan on the outer surface of SLNs gives enhanced bio adhesion to the gut wall, prolonged APG uptake from SLNs lipid, and protect from enzymatic degradation.
The present study aimed to prepare and optimize APG solid lipid nanoparticles (APG-SLNs) using Box Behnken design. The selected optimized formulation was coated with chitosan to enhance the mucoadhesion and permeation. The drug release study, mucoadhesive study and permeation study were performed to check the difference in the formulation performance. Finally, the selected chitosan-coated SLNs were assessed for anti-arthritic activity on the suitable animal model.

2. Material and Methods

2.1. Materials

Apigenin was purchased from Beijing Mesochem Technology Co. Ltd. Beijing, China. GMS and TPGS were procured from Gattefosse (Saint-Priest, France) and Sigma-Aldrich, Saint Louis, MO, USA. Milli Q water was used for the study and other ingredients and solvents were used of analytical grade. Dialysis bag (Molecular weight cut off 1,20,000 KDa) and standard 2,2-diphenyl-1-picrylhydrazyl (DPPH) kit was purchased from Sigma-Aldrich, Saint Louis, MO, USA. The biochemical assay kits purchased from Dhiti diagnostics, New Delhi, India. The animals were procured from animal house HSK college of Pharmacy, Karnataka. The animals were housed in standard condition, food and water were provided. The study was approved from institutional animal ethics committee, HSK college of Pharmacy (HSKCP/IAEC-2B) dated 07/09/20.

2.2. Methods

2.2.1. HPLC Method

HPLC method was performed as per the reported procedure with slight modification [6]. The method was developed on HPLC equipment (Waters 2695, Massachusetts, USA) connected with UV detector (Waters 2475 Multi lambda). The column (C18-Hypersil, ODS, 250mm × 4.6 mm × 5 µm) and mobile phase used for this study was acetonitrile and HPLC grade water (50:50, v/v). The flow rate 1 mL/min was maintained with injection volume of 10 µL. The detection was done at 340 nm using Empower software. The retention time was found to be 4.5 min.

2.2.2. Optimization

The prepared APG-SLNs were optimized using the three-factors at three-level Box Behnken Design (Design Expert 9.0.3.1 software) [22,23]. The factors GMS (A), TPGS (B) and ST (C) were taken as independent factors for the study. Their effects were observed on the particle size (PS, Y1) and entrapment efficiency (EE, Y2). The design showed 15 formulation runs with three common compositions termed as a center point. The obtained data were used for statistical optimization using ANOVA. The different statistical model equations were generated to evaluate the interaction terms [24]. The model equations, contour plots and 3D surface plots for each response was used to assess the impact of formulation variables on PS and EE. The predicted R2, experimental R2, and p values were also used to evaluate the validity of the data [25]. The formulation factors with low, middle and high value of independent variables are shown in Table 1.

2.2.3. Method of Preparation

APG-SLNs were prepared by the reported melt emulsification and ultra-sonication method with slight modification [26]. The different levels of the independent variables used to prepare the SLNs are shown in Table 1. Accurately weighed quantity of GMS as solid lipid was first melted in a porcelain dish at 85 °C. APG was added to the lipid phase for complete solubilization. Separately, TPGS solution in double distilled water was prepared and added drop-wise into the lipid phase at same temperature with stirring to prepare the primary emulsion. The prepared primary emulsion was probe sonicated using an ultrasonic probe for 4 to 8 min with a 3 s pulse-on and pulse-off period in cold conditions at 4 °C. The obtained nano emulsion was further cooled in ice condition for 30 min to form lipid nanoparticles (APG-SLNs). The prepared anionic solid lipid nanoparticles were coated with a cationic polymer of chitosan [27]. The prepared NPs were added to chitosan solution (0.1% w/v) with continuous stirring for an hour. The chitosan solution was prepared by dissolving chitosan in acetic acid (1% v/v). The prepared APG-SLNs was added dropwise to the ice-cooled chitosan solution in an ice bath with continuous homogenization for 45 min until the formation of the coated APG-CH-SLNs.

2.2.4. Particle Characterization

The particle characterization (PS, PDI, ZP) of prepared APG-SLNs and APG-CH-SLNs was evaluated by Zeta sizer (Malvern Instruments Ltd., Malvern, UK). The samples were diluted (100-fold) in double-distilled water and evaluated. ZP was assessed to check the surface charge on the particles. The optimized sample was evaluated for surface morphology using transmission electron microscopy. The diluted sample was taken on a carbon grid and the excess was removed. Finally, the sample was examined under a high-resolution microscope to capture the image.

2.2.5. Entrapment Efficiency

APG entrapment efficiency was assessed by evaluating the free APG in the prepared SLNs. The formulations were centrifuged at 10,000 rpm using a high-speed centrifuge (Sigma laboratory, Osterode, Germany). The supernatant was collected, diluted and unentrapped APG content was calculated at 330 nm by using a UV spectrophotometer. DL and EE were calculated by the below equations:
% EE = Total   APG Free   APG Total   APG × 100

2.2.6. Mucoadhesion Study

The prepared formulations were assessed for mucoadhesive study to check the effect of chitosan coating on the SLNs. APG, APG-SLNs and APG-CH-SLNs (1 mL) were collected and mixed with mucin solution (1 mg/mL). The mixtures were incubated at 37 °C for 2 h and then centrifuged at 10,000 rpm for 60 min. The supernatant was collected, diluted and mucin content was evaluated at 258 nm using a UV spectrophotometer. The below equation was used to calculate the mucoadhesion efficiency:
ME = Ci Cf Ci × 100
Ci: Initial mucin concentration; Cf: Final mucin concentration.

2.2.7. Release Study

The release study was performed to check the release pattern of APG from the prepared SLNs. The selected formulations (APG-SLNs and APG-CH-SLNs) and APG dispersion contained ~2 mg of APG was filled in the dialysis bag. The study was performed in phosphate buffer saline (pH 7) with ethanol (20% v/v) at a temperature of 37 ± 0.5 °C. At a specific interval, the released content was removed and replenished with the fresh release media to mimic the same condition. The release content was diluted, filtered and the drug content at each time point was measured at 330 nm [28].

2.2.8. Permeation Study

The permeation study of the prepared three samples (APG dispersion, APG-SLNs and APG-CH-SLNs) was assessed for the permeation across the goat intestine. The diffusion cell (effective area 1 cm2) was used to study the permeation study. The intestine was collected from a local slaughterhouse and stored at −18 °C for use. The intestine was flushed with a physiological solution for 2 h at room temperature to remove the intestinal contents [29]. The samples which contain 2 mg of APG were filled into the donor compartment of the diffusion cell. The membrane was fixed between the two cells and donor compartment covered with the parafilm. The receptor cell filled with permeation media (volume 50 mL) and temperature was fixed at 37 ± 0.5 °C. The donor compartment was magnetically stirred, after a specific interval (up to 6 h) the permeated content was collected and replaced with fresh media. The released content was analyzed with the reported HPLC method [8].

2.2.9. Antioxidant Study

APG is a flavonoid and has potential antioxidant activity. The change in colour from dark brown to colorless leads to the reduction in absorbance and indicates the antioxidant potential. The comparative studies of APG, APG-SLNs and APG-CH-SLNs were performed as per the reported method [30]. From each sample, a different concentration (0.1 mL) was mixed with DPPH solution (0.9 mL). The samples were incubated for 1 h in dark condition at room temperature. DPPH solution with methanol was considered as blank and the samples were assessed at 517 nm using a UV spectrophotometer. The change in the colour of the DPPH methanolic solution was quantified as reduction in absorbance, which gives the antioxidant potential. The antioxidant compound neutralizes the DPPH radical by the donation of an electron, which leads to a direct reduction. The DPPH radical scavenging activity of each sample was performed in triplicate and calculated by below equation:
Inhibition   % = Control Treated Control ×   100
where, Ai: Absorbance of control; Af: absorbance of test.

2.2.10. Anti-Arthritic Activity

Experimental Design

The study was performed with five groups of rats (n = 6). The groups were divided as Normal control rats (Group 1), Ccomplete Freund’s adjuvant (CFA) induced arthritic model rats (Group 2), APG-CH-SLNs treated rats (50 mg/kg, Group 3), pure APG treated rats (50 mg/kg, Group 4) [31], Indomethacin treated group (5 mg/kg, Group 5). On the first day, arthritis was induced in every group (except the normal control group) via intradermal injection of CFA (0.1 mL) at the right hind footpad. The rats in group III, IV and V were orally administered with APG-CH-SLNs, APG dispersion and Indomethacin through intragastric gavage, for 28 successive days following induction of arthritis. The paw swelling was evaluated at 7-day intervals for 28 days, using a plethysmometer. On completion of the experiment, the rats were sedated with isoflurane and euthanized using cervical dislocation.

Biochemical Estimation

Blood and ankle joint samples were obtained for biochemical studies. Samples of blood withdrawn from the femoral artery were placed at room temperature to coagulate and then centrifuged for 15 min at 3000 rpm. The serum samples obtained were subjected to being assayed for pro-inflammatory cytokines i.e., TNF-α and IL-1β using commercial ELISA assay kits in line with the manufacturer’s guidelines. Tissues from excised ankle joints were homogenized in ice-cold 10% phosphate buffer, pH 7.4, and centrifuged at 4 °C for 30 min at 10,000 rpm. The supernatants were used for assay of the antioxidant enzymes SOD and CAT, as well as levels of MDA using standard assay kits (Sigma Aldrich), according to the kit instructions.

Paw Edema

The carrageenan-induced paw edema model was used to assess the prepared formulation potential. The rats were injected with carrageenan (0.1 mL) in normal saline into the sub planter area of the right hind paw [32]. The dose was given orally 1 h before injection and paw volume was measured by using plethysmograph at 0, 1, 3, 6, 12 and 24 h.

Writhing Study

The writhing study was performed to check the number of writhing in a specific time with all treated groups as per the reported procedure [33]. The intraperitoneal injection of acetic acid (0.8% in distilled water) was given to induce writhing. The number of counts counted after 30 min of injection and the calculation was performed for the treated groups with the below equation:
Inhibition   % = Control Treated Control ×   100

2.2.11. Statistical Analysis

The data are expressed as mean ± SEM (n = 6). All the treatment groups compared with control group using one way ANOVA followed by Tukey- Kramer test. All statistical analyses were done using SPSS version 22.0. The significance of differences was assumed at p < 0.05 at different level.

3. Results and Discussion

3.1. Optimization

APG-SLNs were optimized by three factors at three levels of Box Behnken design. The independent factors GMS (X1) in the concentration range of 250 mg (low level) to 350 mg (high level), TPGS (X2) in the concentration range of 175 mg (low level) to 225 mg (high level) and ST (X3) of 4 min (low level) to 8 min (high level) were taken to prepare APG–SLNs (Table 1). The design showed 15 formulation compositions to prepare APG-SLNs. There are three common compositions shown by the software to check the error in the results. The effect of GMS (A), TPGS (B) and ST (C) was assessed on the PS (Y1) and EE (Y2). The study design showed a 3D response surface plot to evaluate the independent and combined effects of each variable. The data were fitted to different kinetics models; and the best-fitted model was found to be quadratic model. The equations showed low p-value (p < 0.05) and good correlation coefficient (R2 > 0.9). It indicates that the quadratic polynomial model is highly significant to represent the interaction between the independent variables. The positive sign in the polynomial equation gives a synergistic effect on the response. It means as the level of independent variables increases their response favours the optimization. The negative sign indicates an antagonistic effect on the dependent variables. Analysis of variance (ANOVA) was carried out for the polynomial equations and the significant effect on the variables was assessed by high F value and low p-value (p ˂ 0.05). Finally, the results demonstrated that GMS, TPGS and ST has shown a significant effect on PS and EE. The results of the actual value were found much closer to the predicted value, as depicted in Table 2.

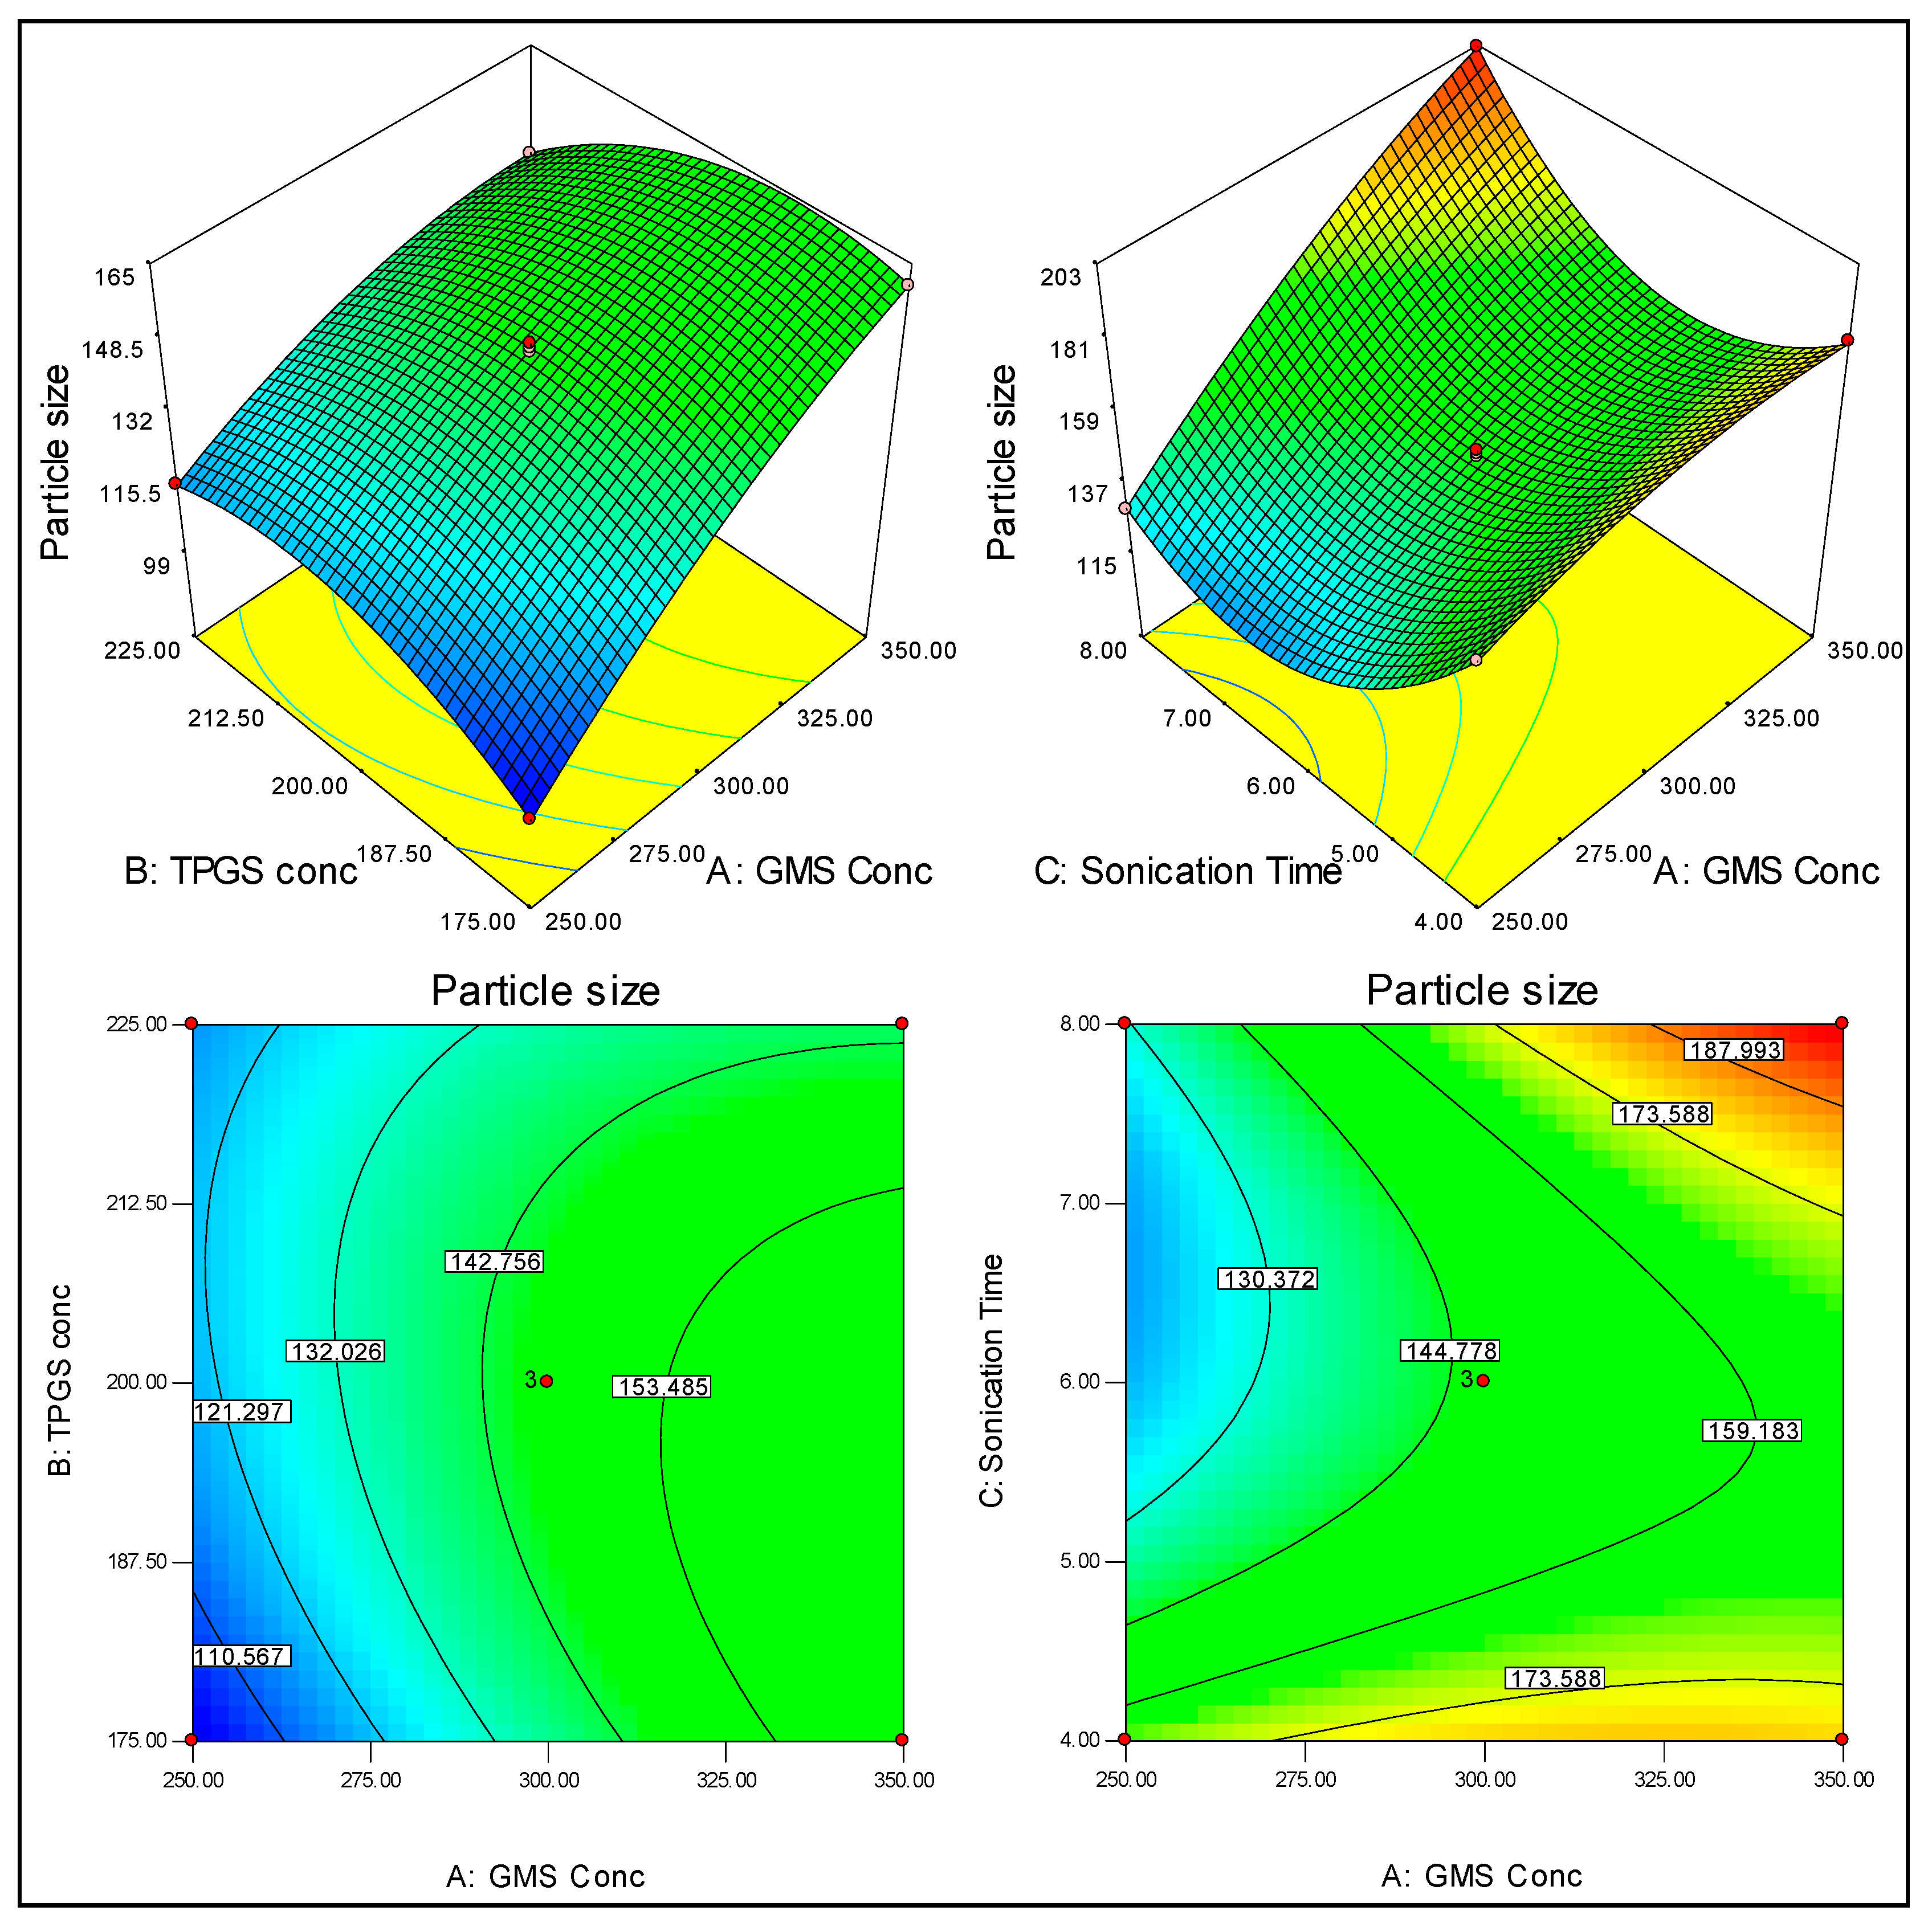
3.2. Effect of GMS, TPGS and ST on Particle Size (PS)

PS of the prepared APG-SLNs was found in the range of 100.13–202.41 nm. There was a significant (p < 0.05) difference in PS that was observed between the formulation (F1) and formulation (F8). The difference in the independent variable from low range to high range showed a significant effect on PS. Response surface plot (Figure 1) and polynomial equation Equation (1) were used to evaluate the effect of variables on the PS. GMS (A) has shown a positive effect on the size. As the concentration of lipid increases the PS also increases. At high lipid content, the viscosity increases and a resistance in the flow of oil drop takes place. Due to high viscosity, the oil droplet does not break into smaller size and gives a larger PS [13,34]. At a high concentration of the lipid, the available surfactant is not sufficient to coat the surface of NPs and the collision of particles takes place faster than the adsorption of surfactant on the surface of NPs. There was a formation of larger particles due to aggregation and agglomeration of NPs due to hydrophobic interaction [35]. The presence of an optimum concentration of TPGS (B) reduces the PS. The available TPGS can adsorb the surface of NPs and prevents agglomeration and aggregation of particles. The third factor ST (C) has also shown a negative effect on the PS. As the ST increases, the PS decreases due to the breakdown of particles from sonication waves. However, as the ST increases from 6 min to 8 min, the PS decreases [36]. At high ST, there may be a chance of formation of aggregation of particles. From the polynomial equation, the negative effects were observed from the combination of GMS (A) and TPGS (B). The combined effect of GMS (A) and ST (C) showed a positive effect on the PS. Whereas, TPGS (B) and ST (C) had a negative effect on the size.

3.3. Effect of GMS, TPGS and ST on the Encapsulation Efficiency (EE)

EE of the prepared APG-SLNs was found in the range of 48.27–85.02%. There was a significant (p < 0.05) difference in EE that was observed between the formulation (F1) and formulation (F10). The difference in the lower range and higher range of each independent variable showed a significant effect on the formulation. Response surface plot (Figure 2) and polynomial Equation (2) obtained from optimization showed the effect of independent variables on the EE. The increase in GMS (A) gave a positive effect on EE. As the concentration of the GMS increased, there was a gradual increase in EE observed. At a higher concentration of GMS, there was a greater space available to accommodate the highly lipophilic drug APG in the lipid. The concentration of TPGS (B) also showed a positive effect on EE. The increase in TPGS concentration gave a gradual increase in EE. At a high concentration of surfactant, the greater amount of emulsifier available in the surface and prevented the leakage of the drug by forming a layer on the aqueous phase [27]. TPGS helps to solubilize the lipophilic drug (APG) by reducing interfacial tension. The third factor ST (C) showed a negative effect on the EE. As the ST (C) increased a reduction in EE was found. The increase in ST (C) gave a reduction in EE due to the leaching of the drug.

3.4. Point Prediction

The design showed optimized formulation (APG-CH-SLNs) composition of GMS (320 mg), TPGS (220 mg), and ST (5 min). This selected composition showed a PS of 161.7 ± 3.8 nm with an EE of 80.44 ± 4.11%. The practical value of the study was found to be very close to the predicted value. The overall desirability was found to be closer to one.
There was no significant (p > 0.05) difference was observed for PS and EE between the actual and predicted value (Figure 3). From the study, it was concluded that the response surface model proved to have good agreement between the actual and predicted values (Table 3).

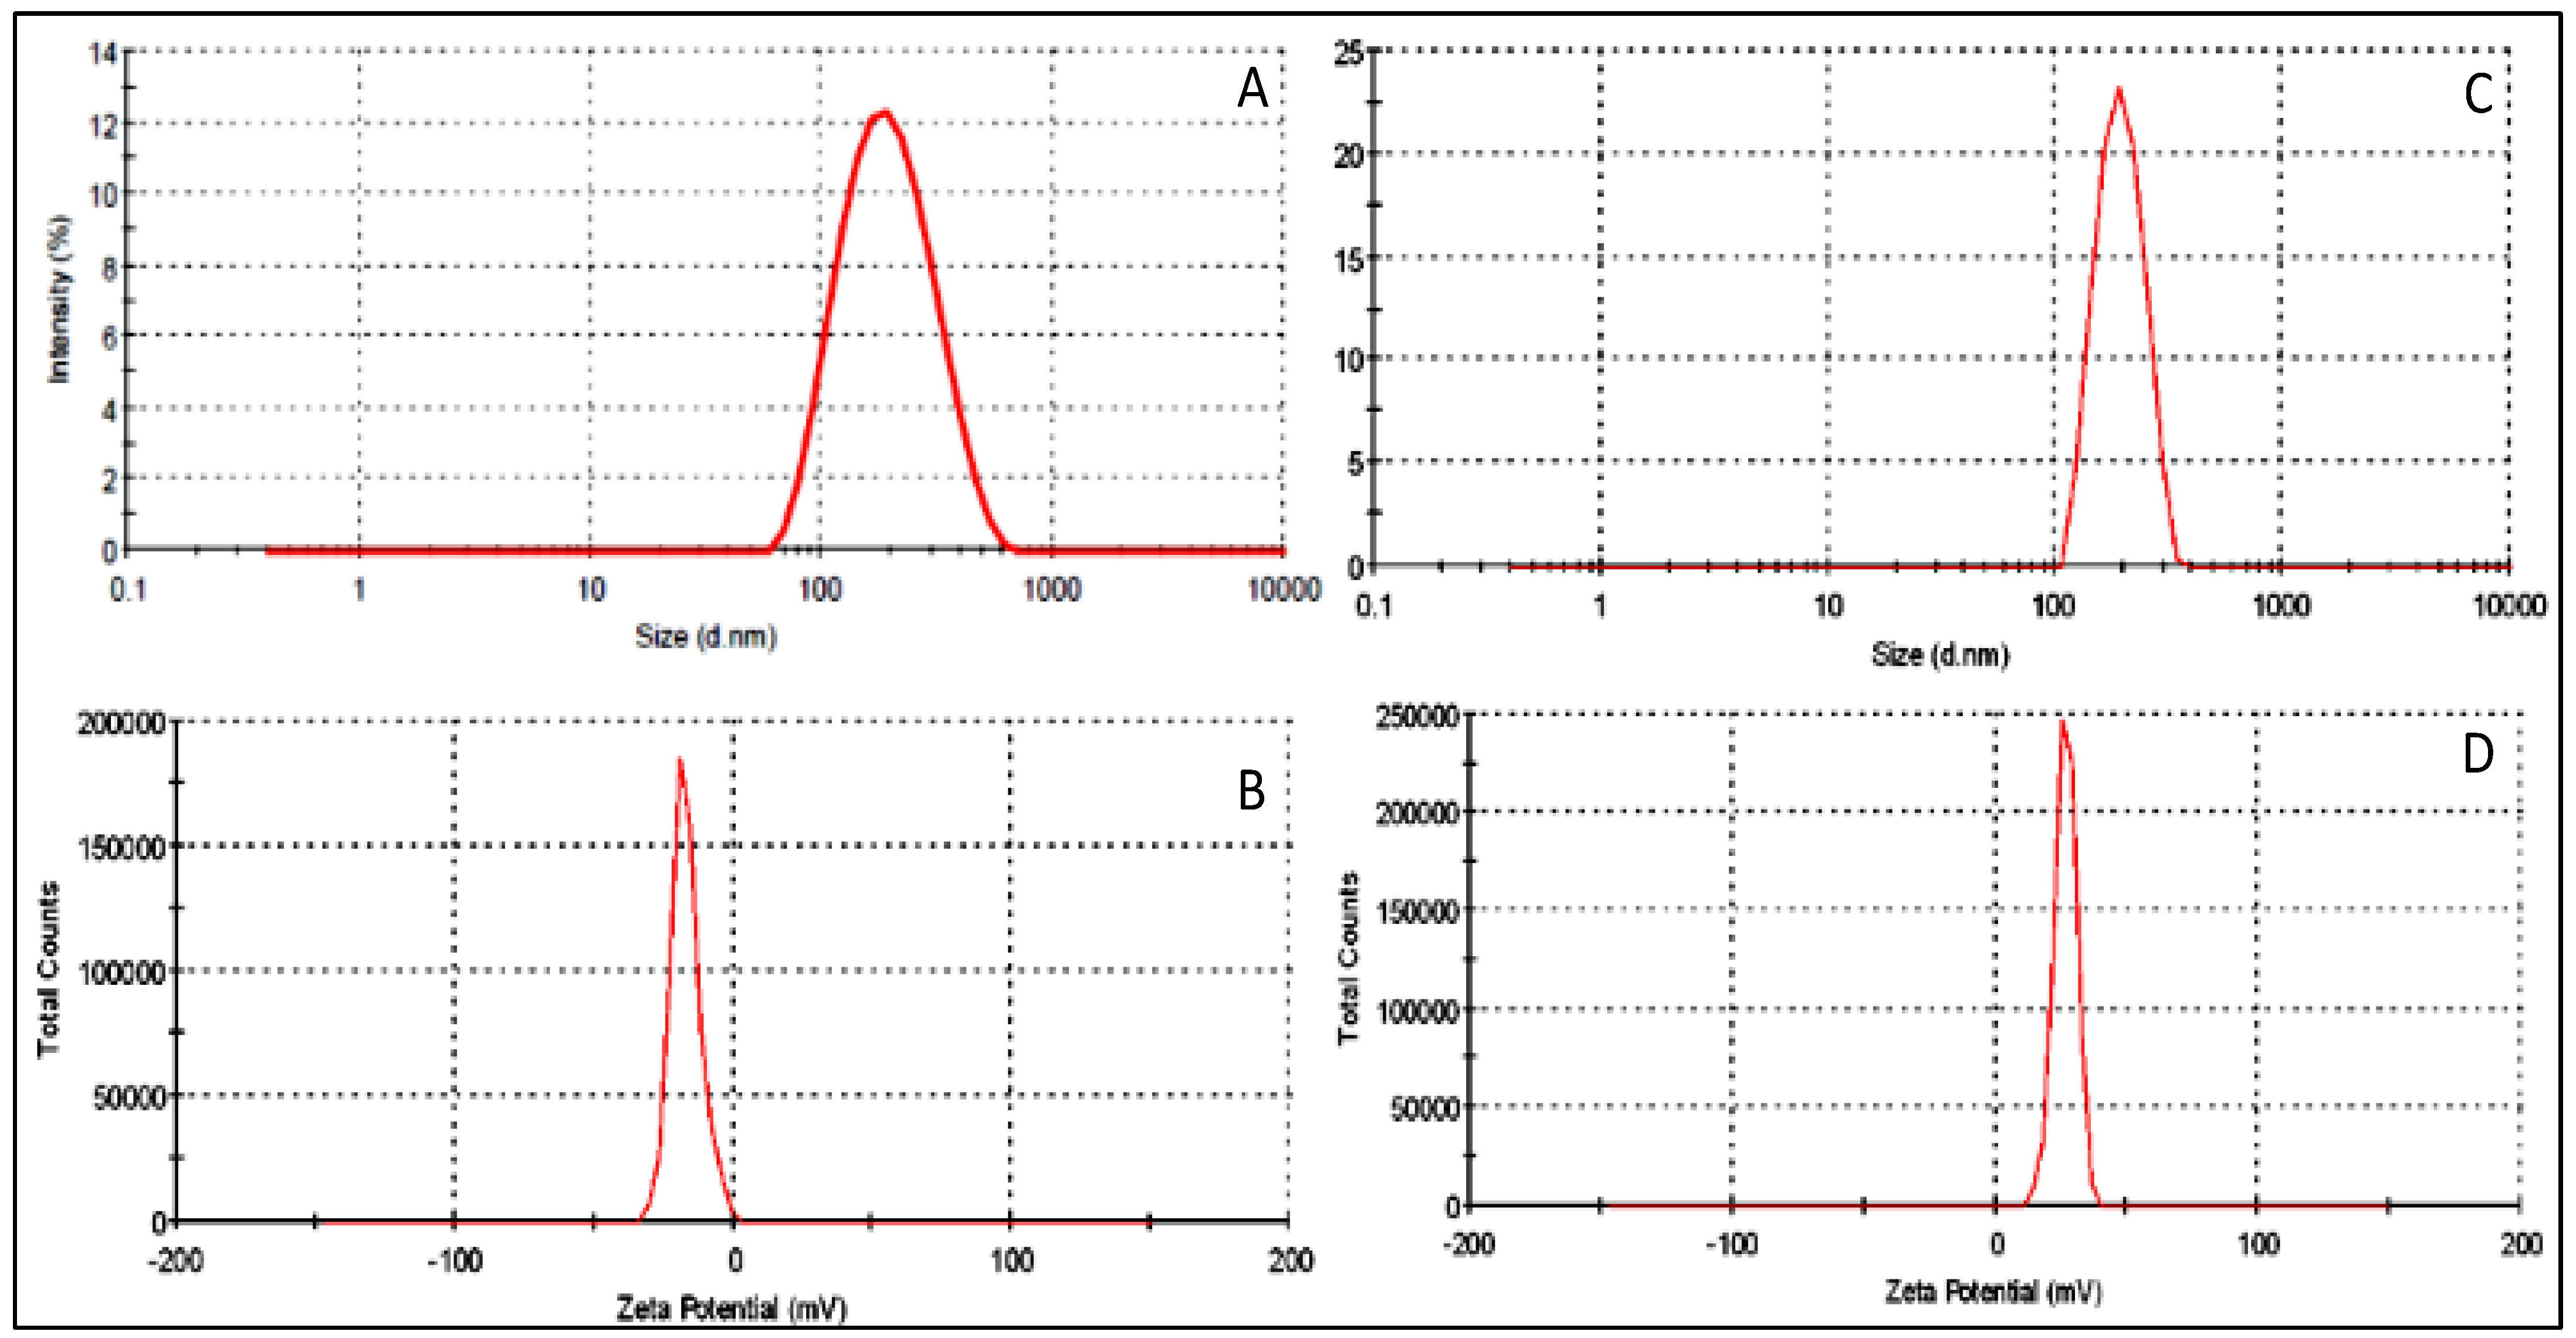
3.5. Particle Characterization

The particle characterization (PS, PDI, ZP) of APG-SLNs were evaluated and showed the PS range from 100.1 nm (F1) to 204.2 nm (F8). The optimized APG-SLNs showed a PS of 161.7 ± 3.8 nm (Figure 4A), PDI value of 0.34 and ZP of −16.9 mV (Figure 4B). APG-CH-SLNs showed increased PS and positive ZP. These changes were observed due to the coating of chitosan (0.1% w/v). APG-CH-SLNs depicted a PS of 185.4 nm (Figure 4C) with a ZP value + 26.7 mV (Figure 4D). From the particle characterization results, the prepared APG-SLNs and APG-CH-SLNs were in the target range for oral delivery. TEM study result revealed the spherical size particles with a smooth and uniform surface (Figure 5).

3.6. Release Study

The studies of APG-SLNs, APG-CH-SLNs, and APG dispersion were performed to compare the release behaviour (Figure 6). APG dispersion showed poor release of 20.98 ± 2.1% in 12 h. APG-SLNs and APG-CH-SLNs showed a highly significant (**p < 0.001) enhancement in APG release of 73.32 ± 2.6% and 61.81 ± 3.4%, respectively. There was a significant (* p ˂ 0.01) difference in drug release that was also observed between APG-SLNs and APG-CH-SLNs. The difference in release rate can be attributed to the increased solubility and wettability of APG in the presence of surfactant. The formulations showed biphasic release behaviour with an initial fast release in the first 2 h. After that, the release was found slower up to 12 h. The sustained pattern was found due to the release of APG from the inner core of the lipid matrix, which releases slowly by diffusion. The presence of chitosan coating on the SLNs further slows APG release. The other possible reason for the slow release is that CH hinders the diffusion and desorption of APG. It also interacts with the stomach lipids which gives limited release.

3.7. Permeation Study

The comparative studies of APG dispersion, APG-SLNs, and APG-CH-SLNs were performed. APG dispersion showed poor permeation flux (11.24 ± 1.1 µg/cm2/h) due to its poor solubility. The very low amount of APG crossed the intestinal membrane. In the case of APG-SLNs, a significantly (p < 0.05) higher amount of APG permeated and showed a higher flux value (20.34 ± 2.3 µg/cm2/h). The enhancement in the permeation flux (1.9 -fold) is due to the enhanced solubility of APG in used lipid in the presence of surfactant. The entrapped drug can be supported for uptake by the M cells in the intestinal epithelium. The nano-sized particles also may be the reason for the enhanced permeation. It can easily penetrate deeper and crosses the mucosal site of the intestine. APG-CH-SLNs showed significantly higher permeation flux (29.36 ± 1.9 µg/cm2/h) than APG-SLNs and APG dispersion. The enhancement was found to be 1.4-fold and 2.6-fold higher than APG-SLNs and APG dispersion. The significant enhancement in the permeation may be due to the presence of chitosan on the outer surface, which helps to open the tight junction and also facilitates the paracellular transport of APG from the intestinal membrane.

3.8. Antioxidant Study

The flavonoid (APG) has been reported for excellent antioxidant activity [37]. The prepared formulations (APG-SLNs and APG-CH-SLNs) were also evaluated to check the antioxidant potential of APG after encapsulation into SLNs. The activity of APG-SLNs and APG-CH-SLNs was compared with the pure APG (Figure 7). The presence of antioxidant molecules accepted the electron and paired with hydrogen molecules. The activity has been evaluated at different concentration (10 µg/mL to 100 µg/mL) for all the samples. As the concentration of APG increases the antioxidant activity also gradually increases. The maximum activity was achieved at the highest concentration (100 µg/mL of APG) in all the samples. The pure APG showed the antioxidant activity of 78.4 ± 3.54%, whereas APG-SLNs and APG-CH-SLNs depicted 84.11 ± 3.6 and 89.43 ± 3.22%. There was non-significant enhancement in the activity was observed for APG-SLNs compared to pure APG, whereas APG-CH-SLNs showed significant (p < 0.05) enhancement.
The presence of chitosan on the outer surface also enhances the antioxidant property. The enhancement in the activity was achieved due to nano-particle size and greater solubility. The nano-meter size particles showed greater activity than coarse suspension due to greater surface area available for the DPPH reaction [38]. From the results, it can be concluded that the prepared coated and uncoated NPs do not interfere with APG antioxidant property.

3.9. Mucoadhesive Efficiency

The mucoadhesive activity was evaluated to check the mucoadhesion of the mucin on prepared delivery systems [APG-SLNs (56.22 ± 1.3%), APG-CH-SLNs (79.84 ± 2.6%) and APG dispersion (34.2 ± 1.9%)]. It is expressed as the amount of mucin deposited on the surface of the NPs. APG-SLNs and APG dispersion showed lesser mucoadhesive property due to negative charge on the lipid particles and poor solubility. There was significant (p ˂ 0.05) enhancement in the mucoadhesive activity that was achieved with the formulation APG-CH-SLNs. The presence of chitosan on the outer surface gives a positive charge which helps to exhibit enhanced mucoadhesive properties over negatively charged particles [39]. The coated particles showed higher binding efficiency to mucin due to the electrostatic interaction between mucin and chitosan. It gives higher mucoadhesive properties but also promotes the internalization rate, cellular uptake, prolonged residence time and therapeutic efficacy than negatively and neutrally charged NPs [40].

3.10. Anti-Arthritic Activity

Biochemical Estimation

In the arthritis model TNF-α and IL-1β have an important role in the inflammatory cells. TNF-α is a key to the cytokine cascade in rheumatoid arthritis. It can promote the formation of many other inflammatory cytokines [41]. The therapeutic effects of the different treated groups were evaluated on the important cytokines’ TNF-α and IL-1β (Table 4). The arthritic group showed significant (p < 0.001) enhancement in the levels of TNF-α and IL-1β (138.19 ± 12.19 and 193.2 ± 16.27) compared to the normal control rats (55.16 ± 4.27 and 121.72 ± 10.26). These two cytokines promote the formation of osteoclasts, synthesis of collagenase and prostaglandins. These are the important mediators of inflammatory pain in synovial as well as cartilage cells [42]. In case of standard indomethacin group, the value was significantly (p ˂ 0.001) reduced near normal value (65.29 ± 5.37 and 127.41 ± 10.05). The prepared APG-CH-SLNs also showed significant (p < 0.001) effect on the TNF-α and IL-1β (61.73 ± 6.83 and 130.04 ± 10.51) than arthritic group. TNF-α value was found be slightly greater for the indomethacin treated group than APG-CH-SLNs group. The enhancement in TNF-α value due to gastrointestinal disturbance and lead to gastrointestinal ulcer [43]. The pure APG dispersion also reduces the TNF-α level (p < 0.01) and IL-1β level (p < 0.05) (102.83 ± 8.04 and 157.26 ± 12.66) than the arthritic control group. The lesser reduction in the cytokines level was observed for the pure APG may be due poor solubility which may lead to poor absorption. APG-CH-SLNs showed higher therapeutic efficacy is due to the nano-sized particles, enhanced solubility in presence of TPGS and presence of chitosan coating. The chitosan promotes the mucoadhesion, tissue permeation and therapeutic efficacy [44].
Further, the prepared formulations were evaluated for antioxidant parameters MDA, SOD, and CAT on experimental rats (Table 4). The normal control animals showed the MDA (8.36 ± 0.89 U/mg protein), SOD value (38.17 ± 2.17 U/mg protein) and CAT (19.05 ± 1.04 U/mg protein). The arthritic control group showed a significant (p < 0.001) changes in the MDA level (15.27 ± 1.21 nmol/mg protein), SOD level (12.94 ± 1.82 U/mg protein) as well as CAT level (7.16 ± 0.21 U/mg). These are important confirmatory biochemical changes observed in the arthritis. The animal groups treated with APG-CH-SLNs showed the MDA level 9.26 ± 1.04, SOD level 33.2 ± 2.04 and CAT level 16.2 ± 1.21 U/mg). The standard indomethacin treated group showed the MDA level 9.04 ± 0.43, SOD level 36.26 ± 2.71 and CAT level of 18.31 ± 1.61 U/mg. There were highly significant (p < 0.001) changes observed in both the treatment groups. The treated groups showed the values closer to the normal group animals. APG dispersion treated group also showed significant (p < 0.01) changes in the tested parameters of MDA level 12.21 ± 1.2, SOD level 27.79 ± 1.6, CAT 12.05 ±1.05 U/mg. APG-CH-SLNs and indomethacin treated group showed a significant difference in the result than pure APG treated groups. The difference in the results were observed due to nano-size particles lead to enhanced solubility of APG in the SLNs. Thus, APG-CH- SLNs were available in systemic circulation for a prolonged period due to enhanced drug permeation to the systemic circulation. The maximum drug reached blood level and gets greater drug distribution into different tissues and bones [15].

3.11. Paw Volume

CFA model is the most common and widely used model to evaluate the arthritis. It shows the number of clinical, immunological and chronic parameters similar to the human arthritis. The local inflammation in the joints starts in the first 2–4 days and that leads to few weeks (28 days) [45,46]. The paw volume of the tested groups from 0 day to 28th day was evaluated and results were shown in Figure 8. The results showed a significant (p ˂ 0.001) increase in the paw volume up-to 28th days in the arthritic control group than the normal control group. The animals treated groups with standard indomethacin and APG-CH-SLNs showed highly significant (p ˂ 0.01, p ˂ 0.001) control over the increase in paw volume on the 7th, 14th, 21st and 28th day. The results of indomethacin and APG-CH-SLNs treated groups are very closer to each other and the difference was found to be non-significant. The standard indomethacin has been used as first choice drug due to its action on COX and PGE2. The use of this drug is limited due to the GIT irritation, diarrhoea, skin and rectal rashes [47]. The paw swelling mainly caused by the inflammatory cytokines. There is overproduction of cytokines takes place in the synovial cells, monocytes and lymphocytes. The prepared APG CH-SLNs blocks the excess production of cytokines after administration and lead to better therapeutic efficacy [48,49]. In case of animal group treated with pure APG dispersion depicted non-significant effect in initial 7th and 14th days after that it showed the slight significant (p ˂ 0.001) effect. The animals treated with APG-CH-SLNs showed prolonged control over the paw volume than APG dispersion treated group animals. The nano-sized particles also support the enhanced therapeutic efficacy of the APG due to the greater surface area available for drug absorption.

3.12. Paw Edema Study

The animals were also tested for the paw edema test for 24 h and results are depicted in Figure 9. The carrageenan induced rats showed enhanced paw edema in compare to the normal control group. The animals treated with pure APG, APG-CH-SLNs, and indomethacin showed marked control over the paw volume in the 24 h study. The result of APG-CH-SLNs and indomethacin treated group showed a closer result. There was a highly significant (p < 0.001) control of paw edema observed at different time point (1 h and 3 h) and significant (p < 0.01) effect at 6h as well as 12 h from APG-CH-SLNs treated formulations. APG has shown suppressive effect on carrageenan induced paw edema correlated well with the inhibition of NF-κB activations as reported by Tago et al., 2011 [31]. The pure APG treated group showed lesser effect in controlling the paw volume than APG-CH-SLNs.

3.13. Writhing Study

The acetic acid-induced writhing test is responsive to the drugs having a mechanism due to the nonspecific nociceptive stimulus induced by the acetic acid [50]. The study results revealed a significant difference in the number of writhing counts from the different treated groups. The control animals group showed that the number of writhing is 49 ± 2.74. The treated group with pure APG showed the number writhing is 21 ± 1.20, which is significantly (p ˂ 0.01) lower than the control group. The treated group with APG-CH-SLNs and indomethacin reduces the writhing count to a more highly significant (p < 0.001) level than control. In this test, the acetic acid stimulates the nociceptive neurons and enhance the release of histamine and cytokines in the peritoneum fluid [51].

4. Conclusions

APG -loaded solid lipid nanoparticles (APG-SLNs) were prepared and optimized by using GMS, TPGS and ST. The optimized SLNs (APG-SLNs) showed the nano-metric particle size and high encapsulation efficiency. The selected APG-SLNs was further coated with chitosan (APG-CH-SLNs) to enhance the mucoadhesion and permeation. APG-CH-SLNs showed a higher permeation and mucoadhesive property than uncoated SLNs (APG-SLNs). The surface morphology showed spherical particle size with a uniform surface. The comparative antioxidant activity results revealed higher activity with APG-CH-SLNs than APG-SLNs and pure APG. Finally, the anti-arthritic study was performed and the result showed a marked enhancement in the anti-arthritic as well as biochemical parameters in rat model.

Author Contributions

Supervision, project administration, funding acquisition, Resources, S.J.G.; Data curation, M.N.B.-J.; Formal analysis, writing—original draft preparation, S.S.I.; Writing—review and editing, S.A.; Visualization, Resources, M.A.J.; Formal analysis, Writing—review and editing, A.Z. All authors have read and agreed to the published version of the manuscript.

Funding

This research received no external funding.

Institutional Review Board Statement

The study was conducted according to the guidelines of the Declaration of Helsinki and approved by the Institutional Review Board (or Ethics Committee) of HSK college of Pharmacy (HSKCP/IAEC-2B) dated 07/09/20.

Informed Consent Statement

Not applicable.

Data Availability Statement

Data sharing is not applicable to this article.

Acknowledgments

The authors extend their appreciation to the Deputyship for Research & Innovation, Ministry of Education in Saudi Arabia for funding research work through the project number PNU-DRI-RI-20-025.

Conflicts of Interest

The authors declare no conflict of interest.

References

  1. Cui, P.; Qu, F.; Sreeharsha, N.; Sharma, S.; Mishra, A.; Gubbiyappa, S.K. Antiarthritic effect of chitosan nanoparticle loaded with embelin against adjuvant-induced arthritis in Wistar rats. IUBMB Life 2020, 72, 1054–1064. [Google Scholar] [CrossRef]
  2. Dolati, S.; Sadreddini, S.; Rostamzadeh, D.; Ahmadi, M.; Jadidi-Niaragh, F.; Yousefi, M. Utilization of nanoparticle technology in rheumatoid arthritis treatment. Biomed. Pharmacother. 2016, 80, 30–41. [Google Scholar] [CrossRef]
  3. Mitragotri, S.; Yoo, J.-W. Designing micro- and nano-particles for treating rheumatoid arthritis. Arch. Pharmacal Res. 2011, 34, 1887–1897. [Google Scholar] [CrossRef]
  4. Marzo, N.S.; Perez-Sanchez, A.; Ruiz-Torres, V.; Tebar, A.M.; Castillo, J.; López, M.H.; Catalán, E.B. Antioxidant and Photoprotective Activity of Apigenin and Its Potassium Salt Derivative in Human Keratinocytes and Absorption in Caco-2 Cell Monolayers. Int. J. Mol. Sci. 2019, 20, 2148. [Google Scholar] [CrossRef] [Green Version]
  5. Zhou, X.; Wang, F.; Zhou, R.; Song, X.; Xie, M. Apigenin: A current review on its beneficial biological activities. J. Food Biochem. 2017, 41, e12376. [Google Scholar] [CrossRef]
  6. Park, J.S.; Kim, D.K.; Shin, H.D.; Lee, H.J.; Jo, H.S.; Jeong, J.S.; Choi, Y.L.; Lee, C.J.; Hwang, S.C. Apigenin Regulates Inter-leukin-1β-Induced Production of Matrix Metalloproteinase Both in the Knee Joint of Rat and in Primary Cultured Articular Chondrocytes. Biomol Ther 2016, 24, 163–170. [Google Scholar] [CrossRef] [Green Version]
  7. Bandyopadhyay, S.; Lion, J.M. Attenuation of osteoclastogenesis and osteoclast function by apigenin. Biochem. Pharmacol. 2006, 330, 184–197. [Google Scholar] [CrossRef]
  8. Karim, R.; Palazzo, C.; Laloy, J.; Delvigne, A.-S.; Vanslambrouck, S.; Jerome, C.; Lepeltier, E.; Orange, F.; Dogne, J.-M.; Evrard, B.; et al. Development and evaluation of injectable nanosized drug delivery systems for apigenin. Int. J. Pharm. 2017, 532, 757–768. [Google Scholar] [CrossRef] [Green Version]
  9. Ali, H.; Singh, S.K. Biological voyage of solid lipid nanoparticles: A proficient carrier in nanomedicine. Ther. Deliv. 2016, 7, 691–709. [Google Scholar] [CrossRef]
  10. Singh, A.; Yadagiri, G.; Parvez, S.; Singh, O.P.; Verma, A.; Sundar, S.; Mudavath, S.L. Formulation, characterization and in vitro anti-leishmanial evaluation of amphotericin B loaded solid lipid nanoparticles coated with vitamin B12-stearic acid conjugate. Mater. Sci. Eng. C 2020, 117, 111279. [Google Scholar] [CrossRef]
  11. Hsu, C.-Y.; Wang, P.-W.; Alalaiwe, A.; Lin, Z.-C.; Fang, J.-Y. Use of Lipid Nanocarriers to Improve Oral Delivery of Vitamins. Nutrients 2019, 11, 68. [Google Scholar] [CrossRef] [Green Version]
  12. Ganesan, P.; Ramalingam, P.; Karthivashan, G.; Ko, Y.T.; Choi, D.-K. Recent developments in solid lipid nanoparticle and surface-modified solid lipid nanoparticle delivery systems for oral delivery of phyto-bioactive compounds in various chronic diseases. Int. J. Nanomed. 2018, 13, 1569–1583. [Google Scholar] [CrossRef] [Green Version]
  13. Hassan, H.; Bello, R.O.; Adam, S.K.; Alias, E.; Affandi, M.M.R.M.M.; Shamsuddin, A.F.; Basir, R. Acyclovir-Loaded solid lipid nanoparticles: Optimization, characterization and evaluation of its pharmacokinetic profile. Nanomaterials 2020, 10, 1785. [Google Scholar] [CrossRef]
  14. Arora, R.; Kuhad, A.; Kaur, I.; Chopra, K. Curcumin loaded solid lipid nanoparticles ameliorate adjuvant-induced arthritis in rats. Eur. J. Pain 2015, 19, 940–952. [Google Scholar] [CrossRef]
  15. Thakkar, H.; Sharma, R.K.; Murthy, R.S.R. Enhanced Retention of Celecoxib-Loaded Solid Lipid??Nanoparticles after Intra-Articular Administration. Drugs R&D 2007, 8, 275–285. [Google Scholar] [CrossRef]
  16. Zhang, F.; Liu, Z.; He, X.; Li, Z.; Shi, B.; Cai, F. β-Sitosterol-loaded solid lipid nanoparticles ameliorate complete Freund’s adjuvant-induced arthritis in rats: Involvement of NF-κB and HO-1/Nrf-2 pathway. Drug Deliv. 2020, 27, 1329–1341. [Google Scholar] [CrossRef] [PubMed]
  17. Wang, F.; Chen, L.; Zhang, D.; Jiang, S.; Shi, K.; Huang, Y.; Li, R.; Xu, Q. Methazolamide-loaded solid lipid nanoparticles modified with low-molecular weight chitosan for the treatment of glaucoma: Vitro and vivo study. J. Drug Target. 2014, 22, 849–858. [Google Scholar] [CrossRef]
  18. Ahmadifard, Z.; Ahmed, A.; Rasekhian, M.; Moradi, S.; Arkan, E. Chitosan-coated magnetic solid lipid nanoparticles for controlled release of letrozole. J. Drug Deliv. Sci. Tech. 2020, 57, 101621. [Google Scholar] [CrossRef]
  19. Thanou, M.; Verhoef, J.; Junginger, H. Chitosan and its derivatives as intestinal absorption enhancers. Adv. Drug Deliv. Rev. 2001, 50, S91–S101. [Google Scholar] [CrossRef]
  20. Alalaiwe, A.; Carpinone, P.; Alshahrani, S.; Alsulays, B.; Ansari, M.; Anwer, M.; Alshehri, S.; Alshetaili, A. Influence of chi-tosan coating on the oral bioavailability of gold nanoparticles in rats. Saudi Pharm. J. 2019, 27, 171–175. [Google Scholar] [CrossRef]
  21. Kockisch, S.; Rees, G.D.; Young, S.A.; Tsibouklis, J.; Smart, J.D. Polymeric Microspheres for Drug Delivery to the Oral Cavity: An In Vitro Evaluation of Mucoadhesive Potential. J. Pharm. Sci. 2003, 92, 1614–1623. [Google Scholar] [CrossRef] [PubMed]
  22. Imam, S.S.; Ahad, A.; Aqil, M.; Akhtar, M.; Sultana, Y.; Ali, A. Formulation by design based risperidone nano soft lipid vesicle as a new strategy for enhanced transdermal drug delivery: In-vitro characterization, and in-vivo appraisal. Mater. Sci. Eng. C 2017, 75, 1198–1205. [Google Scholar] [CrossRef] [PubMed]
  23. Siddiqui, A.; Alayoubi, A.; El-Malah, Y.; Nazzal, S. Modeling the effect of sonication parameters on size and dispersion temperature of solid lipid nanoparticles (SLNs) by response surface methodology (RSM). Pharm. Dev. Technol. 2013, 19, 342–346. [Google Scholar] [CrossRef] [PubMed]
  24. Shahab, M.S.; Rizwanullah; Alshehri, S.; Imam, S.S. Optimization to development of chitosan decorated polycaprolactone nanoparticles for improved ocular delivery of dorzolamide: In vitro, ex vivo and toxicity assessments. Int. J. Biol. Macromol. 2020, 163, 2392–2404. [Google Scholar] [CrossRef]
  25. Imam, S.S.; Aqil, M.; Akhtar, M.; Sultana, Y.; Ali, A. Formulation by design-based proniosome for accentuated transdermal delivery of risperidone: In vitro characterization and in vivo pharmacokinetic study. Drug Deliv. 2015, 22, 1059–1070. [Google Scholar] [CrossRef]
  26. Dhiman, S.; Mishra, N.; Sharma, S. Development of PEGylated solid lipid nanoparticles of pentoxifylline for their beneficial pharmacological potential in pathological cardiac hypertrophy. Artif. Cells Nanomedicine, Biotechnol. 2015, 44, 1901–1908. [Google Scholar] [CrossRef] [Green Version]
  27. Campos, J.; Varas-Godoy, M.; Haidar, Z.S. Physicochemical characterization of chitosan-hyaluronan-coated solid lipid nanoparticles for the targeted delivery of paclitaxel: A proof-of-concept study in breast cancer cells. Nanomedicine 2017, 12, 473–490. [Google Scholar] [CrossRef]
  28. Zhai, Y.; Guo, S.; Liu, C.; Yang, C.; Dou, J.; Li, L.; Zhai, G. Preparation and in vitro evaluation of apigenin-loaded polymeric micelles. Colloids Surf. A Physicochem. Eng. Asp. 2013, 429, 24–30. [Google Scholar] [CrossRef]
  29. Gilani, S.; Bin-Jumah, M.; Rizwanullah; Imam, S.; Imtiyaz, K.; AlShehri, S.; Rizvi, M. Chitosan Coated Luteolin Nanostructured Lipid Carriers: Optimization, In Vitro-Ex Vivo Assessments and Cytotoxicity Study in Breast Cancer Cells. Coatings 2021, 11, 158. [Google Scholar] [CrossRef]
  30. Roy, S.; Mallick, S.; Chakraborty, T.; Ghosh, N.; Singh, A.K.; Manna, S.; Majumdar, S. Synthesis, characterisation and antioxidant activity of luteolin–vanadium(II) complex. Food Chem. 2015, 173, 1172–1178. [Google Scholar] [CrossRef]
  31. Funakoshi-Tago, M.; Nakamura, K.; Tago, K.; Mashino, T.; Kasahara, T. Anti-inflammatory activity of structurally related flavonoids, Apigenin, Luteolin and Fisetin. Int. Immunopharmacol. 2011, 11, 1150–1159. [Google Scholar] [CrossRef] [PubMed]
  32. Funakoshi-Tago, M.; Nakamura, K.; Tsuruya, R.; Hatanaka, M.; Mashino, T.; Sonoda, Y.; Kasahara, T. The fixed structure of Licochalcone A by alpha, beta-unsaturated ketone is necessary for anti-inflammatory activity through the inhibition of NF-kappa B activation. Int. Immunopharmacol. 2010, 10, 562–571. [Google Scholar] [CrossRef] [PubMed]
  33. Vendramini-Costa, D.B.; Spindola, H.M.; de Mello, G.C.; Antunes, E.; Pilli, R.A.; de Carvalho, J.E. Anti-inflammatory and antinociceptive effects of racemic goniothalamin, a styryl lactone. Life Sci. 2015, 139, 83–90. [Google Scholar] [CrossRef]
  34. Padhye, S.G.; Nagarsenker, M.S. Simvastatin Solid Lipid Nanoparticles for Oral Delivery: Formulation Development and In vivo Evaluation. Indian J. Pharm. Sci. 2013, 75, 591–598. [Google Scholar] [PubMed]
  35. Zirak, M.B.; Pezeshki, A. Effect of Surfactant Concentration on the Particle Size, Stability and Potential Zeta of Beta carotene Nano Lipid Carrier. Int. J. Curr. Microbiol. Appl. Sci. 2015, 4, 924–932. [Google Scholar]
  36. Pradhan, S.; Hedberg, J.; Blomberg, E.; Wold, S.; Wallinder, I.O. Effect of sonication on particle dispersion, administered dose and metal release of non-functionalized, non-inert metal nanoparticles. J. Nanoparticle Res. 2016, 18, 1–14. [Google Scholar] [CrossRef] [PubMed] [Green Version]
  37. Telange, D.R.; Patil, A.T.; Pethe, A.M.; Fegade, H.; Anand, S.; Dave, V.S. Formulation and characterization of an apigenin-phospholipid phytosome (APLC) for improved solubility, in vivo bioavailability, and antioxidant potential. Eur. J. Pharm. Sci. 2017, 108, 36–49. [Google Scholar] [CrossRef] [Green Version]
  38. Al Shaal, L.; Shegokar, R.; Müller, R.H. Production and characterization of antioxidant apigenin nanocrystals as a novel UV skin protective formulation. Int. J. Pharm. 2011, 420, 133–140. [Google Scholar] [CrossRef]
  39. Mohammed, M.A.; Syeda, J.T.M.; Wasan, K.M.; Wasan, E.K. An Overview of Chitosan Nanoparticles and Its Application in Non-Parenteral Drug Delivery. Pharm 2017, 9, 53. [Google Scholar] [CrossRef] [PubMed] [Green Version]
  40. Shim, S.; Yoo, H.S. The Application of Mucoadhesive Chitosan Nanoparticles in Nasal Drug Delivery. Mar. Drugs 2020, 18, 605. [Google Scholar] [CrossRef] [PubMed]
  41. Cai, H.; Zheng, Z.; Sun, Y.; Liu, Z.; Zhang, M.; Li, C. The effect of curcumin and its nanoformulation on adjuvant-induced arthritis in rats. Drug Des. Dev. Ther. 2015, 9, 4931–4942. [Google Scholar] [CrossRef] [PubMed] [Green Version]
  42. Yeom, M.; Hahm, D.H.; Sur, B.J.; Han, J.J.; Lee, H.J.; Yang, H.I.; Kim, K.S. Phosphatidylserine inhibits inflammatory responses in interleukin-1b-stimulated fibroblast-like synoviocytes and alleviates carrageenan-induced arthritis in rat. Nutr. Res. 2013, 33, 242–250. [Google Scholar] [CrossRef]
  43. Gautam, R.; Singh, M.; Gautam, S.; Rawat, J.K.; Saraf, S.A.; Kaithwas, G. Rutin attenuates intestinal toxicity induced by Methotrexate linked with anti-oxidative and anti-inflammatory effects. BMC Complement. Altern. Med. 2016, 16, 99. [Google Scholar] [CrossRef] [Green Version]
  44. Frank, L.A.; Onzi, G.R.; Morawski, A.S.; Pohlmann, A.R.; Guterres, S.S.; Contri, R.V. Chitosan as a coating material for nanoparticles intended for biomedical Applications. React. Funct. Polym. 2020, 147, 104459. [Google Scholar] [CrossRef]
  45. Li, Y.; Kakkar, R.; Wang, J. In vivo and in vitro Approach to Anti-arthritic and Anti-inflammatory Effect of Crocetin by Al-teration of Nuclear Factor-E2-Related Factor 2/hem Oxygenase (HO)-1 and NF-κB Expression. Front. Pharmacol. 2018, 9, 1341. [Google Scholar] [CrossRef] [PubMed] [Green Version]
  46. Rayhana, B.; Sheliya, M.A.; Pillai, K.K.; Aeri, V.; Sharma, M. Evaluation of anti-inflammatory effect of Careya arborea in CFA induced chronic inflammation. Int. J. Pharm. Sci. Rev. Res. 2014, 26, 292–298. [Google Scholar]
  47. Kaithwas, G.; Gautam, R.; Jachak, S.M.; Saklani, A. Antiarthritic effects of Ajuga bracteosa Wall ex Benth. in acute and chronic models of arthritis in albino rats. Asian Pac. J. Trop. Biomed. 2012, 2, 185–188. [Google Scholar] [CrossRef] [Green Version]
  48. Guo, Y.-J.; Chen, J.; Xiong, X.-G.; Wu, D.; Zhu, H.; Liang, Q.-H. Effect of Bizhongxiao decoction and its dismantled formulae on IL-1 and TNF levels in collagen-induced arthritis in rat synovial joints. Theor. Biol. Med. Model. 2012, 9, 47. [Google Scholar] [CrossRef] [Green Version]
  49. Chang, X.; He, H.; Zhu, L.; Gao, J.; Wei, T.; Ma, Z.; Yan, T. Protective effect of apigenin on Freund’s complete adjuvant-induced arthritis in rats via inhibiting P2X7/NF-κB pathway. Chem. Biol. Interact. 2015, 236, 41–46. [Google Scholar] [CrossRef]
  50. Spindola, H.M.; Vendramini-Costa, D.B.; Rodrigues, M.T., Jr.; Foglio, M.A.; Pilli, R.A.; Carvalho, J.E. The antinociceptive activity of harmicine on chemical-induced neurogenic and inflammatory pain models in mice. Pharmacol. Biochem. Behav. 2012, 102, 133–138. [Google Scholar] [CrossRef] [Green Version]
  51. Boonyarikpunchai, W.; Sukrong, S.; Towiwat, P. Antinociceptive and anti-inflammatory effects of rosmarinic acid isolated from Thunbergia laurifolia Lindl. Pharmacol. Biochem. Behav. 2014, 124, 67–73. [Google Scholar] [CrossRef] [PubMed]
Figure 1. Effect of independent variables on the particle size optimization.
Coatings 11 00548 g001
Figure 2. Effect of independent variables on the encapsulation efficiency optimization.
Coatings 11 00548 g002
Figure 3. Actual and predicted response of the independent variables.
Coatings 11 00548 g003
Figure 4. Particle size and zeta potential image of APG-SLNs (A,B) and APG-CH-SLNs (C,D).
Coatings 11 00548 g004
Figure 5. TEM image of APG-CH-SLNs.
Coatings 11 00548 g005
Figure 6. Drug release study profile of APG dispersion, APG CS-SLNs, and APG-SLNs. Data showed as mean ± SD, (n = 3). All the treatment groups compared using one-way ANOVA followed by Tukey- Kramer test, compared with pure APG p < 0.001, compared with APG-SLNs p < 0.01.
Coatings 11 00548 g006
Figure 7. Comparative antioxidant potential of different groups. Data showed as mean ± SD, (n = 3). All the treatment groups compared with control group using one way ANOVA followed by Tukey- Kramer test, * compared with pure APG group (* p < 0.05).
Coatings 11 00548 g007
Figure 8. Comparative paw volume study of different treatment groups. Data showed as mean ± SEM, (n = 6). All the treatment groups compared with control group using one way ANOVA followed by Tukey- Kramer test, x compared with normal control group, a, b and c compared with arthritic control group, x p < 0.001; a p < 0.05; b p < 0.01, c p < 0.001 and ns = non-significant.
Coatings 11 00548 g008
Figure 9. Paw edema results of animals treated with different formulations. Data showed as mean ± SEM, (n = 6). All the treatment groups compared with control group using one way ANOVA followed by Tukey- Kramer test, a, b and c compared with arthritic control group, x p < 0.001; a p < 0.05; b p < 0.01, c p < 0.001 and ns = non-significant.
Coatings 11 00548 g009
Table 1. Experimental variables used to prepare Apigenin solid lipid nanoparticles (APG-SLNs).
Independent
Variables
LevelDependent
Variables
Target
LowMediumHigh
GMS
(mg)
250300350Particle size (nm)100–250 nm
TPGS
(mg)
175200225Encapsulation efficiency (%)50–80%
Sonication time (min)468--
Table 2. Formulation design of Apigenin solid lipid nanoparticles with their results.
FormulationsGMSTPGSSonication TimeParticle Size (nm)Encapsulation Efficiency (%)
mgmgminActualPredictedActualPredicted
12501756100.13103.8448.2752.28
23501756160.31164.5867.3269.26
32502256115.69111.4271.1875.24
43502256140.88137.1666.8368.82
52502004166.59160.6076.4972.54
63502004180.90187.3580.6683.77
72502008129.10122.6566.9461.83
83502008202.41211.4077.2175.16
93001754156.91164.1969.3166.25
103002254180.08171.2685.0281.91
113001758175.20179.7466.8769.98
123002258148.09147.8173.7970.85
133002006146.12152.1268.1065.43
143002006147.21151.1268.8065.43
153002006148.32145.1268.3864.43
Table 3. Statistical parameters of Apigenin solid lipid nanoparticles.
StatisticsPSEECoefficient of DeterminationPSEE
Std. Dev.0.80.25R-Squared0.99970.9997
Mean153.1370.34Adj R-Squared0.99910.9991
CV %0.521.68Pred R-Squared0.99750.9983
PS = + 147.00 + 21.62 × A − 0.96 × B − 3.72 × C − 8.75 × A × B + 14.75 × A × C − 12.50 × B × C −6.50 × A2 − 11.25 × B2 + 29.25 × C2
EE = + 68.43 + 3.64 × A + 5.63 × B − 3.33 × C − 5.85 × A × B + 1.53 × A × C − 2.20 × B × C − 1.72 × A2 − 3.30 × B2 + 8.62 × C2
Table 4. Comparative biochemical estimation results of different treatment groups. Data showed as mean ± SEM, (n = 6). All the treatment groups compared using one way ANOVA followed by Tukey- Kramer test, x compared with normal control group, a, b and c compared with arthritic control group, x p < 0.001; a p < 0.05; b p < 0.01, c p < 0.001 and ns = non-significant.
GroupsTNF-α (pg/mL)IL-1β
(pg/mL)
MDA
(nmol/mg Protein)
SOD
(U/mg Protein)
CAT
(U/mg Protein)
Normal Control55.16 ± 4.27121.72 ± 10.268.36 ± 0.8938.17 ± 2.1719.05 ± 1.04
Arthritic Control138.19 ± 12.19 x193.20 ± 16.27 x15.27 ± 1.21 x12.94 ± 1.82 x7.16 ± 0.21 x
APG-CH-SLNs61.73 ± 6.83 c130.04 ± 10.51 c10.26 ± 1.04 c33.20 ± 2.04 c16.20 ± 1.21 b
APG102.83 ± 8.04 b157.26 ± 12.66 a12.21 ± 1.20 a27.79 ± 1.60 b12.05 ± 1.05 a
Indomethacin65.29 ± 5.37 c127.41± 10.05 c9.04 ± 0.43 c36.26 ± 2.71 c18.31 ± 1.61 c
Publisher’s Note: MDPI stays neutral with regard to jurisdictional claims in published maps and institutional affiliations.

