Article

Preparation and Characterization of a Silane Sealed PEO Coating on Aluminum Alloy

1
Department of Mechanical and Energy Engineering, Shaoyang University, Shaoyang 422000, China
2
School of Materials Science and Engineering, Central South University, Changsha 410083, China
3
Key Laboratory of Hunan Province for Efficient Power System and Intelligent Manufacturing, Shaoyang University, Shaoyang 422000, China
*
Authors to whom correspondence should be addressed.
Coatings 2021, 11(5), 549; https://doi.org/10.3390/coatings11050549
Submission received: 12 April 2021 / Revised: 28 April 2021 / Accepted: 29 April 2021 / Published: 6 May 2021

Abstract

:
A dense alumina ceramic coating was formed on UNS A97075 Al alloy by plasma electrolytic oxidation (PEO). An efficient and environmentally friendly silane layer was prepared to seal the PEO coating. The scanning electron microscopy (SEM) results showed that the PEO coating was completely sealed by the silane layer. The electrochemical corrosion evolution of the silane sealed PEO composite coating was studied by electrochemical impedance spectroscopy (EIS). Based on the EIS data, the corrosion evolution of the silane sealed composite coating could be divided to three stages during 576 h of immersion test, and the silane coating acted as a good physical barrier in the immersion test, effectively delayed the corrosion process and improved the corrosion resistance.

1. Introduction

A naturally occurring passive oxide can be formed on an aluminium alloy exposed to the atmosphere and this can impart corrosion resistance [1]. However, this oxide has a nano-scale thickness and greatly restricts its wear and corrosion performance [2]. To improve properties, several surface modification techniques have been developed, such as anodization, plasma electrolytic oxidation (PEO), chemical vapor deposition, electroplating, and thermal spraying, and so on. Among these technologies, PEO coating has superior wear [3,4,5] and corrosion resistance [6,7,8]. Due to the gas bubbling and intense spark discharge during PEO treatment, such a coating layer is a multi-layer consisting of a relatively dense inner layer, and a more porous outer layer on top [9,10,11]. As there are many micro-defects (such as pores, voids, and cracks) in the outer layer of the PEO coating, resulting in the fact that the PEO coating inevitably requires a sealing treatment is necessary to prevent penetration of corrosive media and enhance its corrosion resistance [12,13,14,15,16,17,18,19,20,21,22].
Recently, many green sealing methods have been proposed, such as sol–gel sealing [13,14,15], phosphate and alkaline silicate-based sealing [16], and rare earth sealing [17,18]. Silane coatings have good corrosion properties and good adhesion to aluminium substrates, so silane-based sol–gel sealing on an anodized aluminium coating was studied to enhance the corrosion resistance [19,20,21,22]. Wojciechowski [21] and Whelan [22] formed a silane layer on anodized aluminium, demonstrating that the silane–alumina composite coating has excellent corrosion resistance. In our previous work [23], we formed a continuous silane layer on a PEO coating synthesized from tetraethoxy silane (TEOS) and methacryloxy propyl trimethoxyl silane (MPTES). The results showed that the corrosion resistance of the PEO/silane composite coating was significantly improved in acidic, neutral, and alkaline environments. However, there is little work on the electrochemical corrosion evolution of silane-based sol–gel-sealed PEO coatings on UNS A97075 Al alloys for long immersion times.
EIS has been widely used to investigate transport and charge transfer characteristics of reactants (such as H2O, O2, and Cl) [24,25,26,27,28] in coatings. Lei Wen [26] proposed different electrical circuit analogs to simulate the electrochemical corrosion behaviors, and concluded that the corrosion evolution of PEO coated alloy could be divided into three stages during long term immersion tests [26]: (i) an induction period where the PEO coating inhibited inhibits the penetration of corrosion medium; (ii) penetration of the corrosion medium through defects in the coating, reaching the coating/alloy interface; and (iii) corrosion process controlled by corrosion products diffusing into/through the coating. Gnedenkov [27] investigated electrochemical properties of the highly hydrophobic coatings on PEO-pretreated aluminum alloy, revealing that the evolution of coating degradation could be provided effectively by Nyquist and Bode diagrams obtained with EIS. Barik [28] studied the corrosion performance of PEO coatings by EIS, and demonstrated that unsealed PEO coating allows permeation of solution through the pores in the coating. But, the corrosion evolution of PEO coating sealed with a silane polymer is still not well understood.
In the present work, using several typical equivalent circuits analogs are used to modelsimulate the EIS responseplots, and are used to discuss the electrochemical corrosion evolution of silane coatings on PEO coatings in a 3.5 wt.% NaCl solution. The aim of this work is not only to evaluate the corrosion resistance of PEO coatings with and without a silane sealing layer in a 3.5 wt.% NaCl solution but also to reveal the electrochemical corrosion evolution of silane-sealed PEO coatings on UNS A97075 aluminium alloy.

2. Experimental

2.1. Preparation of PEO/Silane Composite Coating

The preparation of PEO coating and sol silane solutions are consistent with our previous work [23]. UNS A97075 Al alloy was used as the electrode in this study. The samples were shaped as a plate with dimensions of 50 × 50 × 2 mm3. The surface of the samples was ground with up to 1200 grit SiC abrasive papers prior to PEO treatment. 240H-IV micro-arc oxidation equipment (Harbin, China) was used to prepare PEO coatings, the treatment time was 15 min.
The PEO/silane composite coating preparation process is as follows: the PEO samples were put into the sol silane solutions for 1 min and allowed to dry naturally for 30 min, and this process was performed once or twice. The sample that was sealed twice was named PEO-S2, and the sample sealed once was named PEO-S1 in this text. Finally, the samples were cured in an oven at 80 °C for 40 minutes to obtain PEO/silane composite coating.

2.2. Characterization Analysis

The surface and cross-section morphologies of the specimens were observed by SEM (Serion 200 and Quanta-200, Thermo Fisher Scientific, Waltham, MA, USA) with an accelerating voltage of 20 kV. The cross-section morphologies were observed by backscattered scanning electron (BSE) (FEI company, Eindhoven, Netherlands), and the surface morphologies were characterized by secondary electron (SE). The surfaces of the MAO coated specimens were sputtered with a very thin layer (less than 20 nm) of gold to make it electrically conductive prior to being observed by SEM.
The chemical structure of the silane coating was analyzed by Fourier transform infrared spectroscopy (FT-IR). FT-IR spectra were collected on a Nicolet 6700 spectrometer. For this test, cured silane coating were ground and amalgamated with dry IR-grade KBr in a mortar to form pellets.

2.3. Electrochemical Measurements

Electrochemical experiments were performed using a MULTI AUTO M204 electrochemical workstation (Shanghai, China), in a 3.5 wt.% NaCl solution at room temperature. A platinum electrode was used as counter electrode and a saturated calomel electrode (SCE) as a reference electrode during the electrochemical test. Potentiodynamic polarization and EIS measurements were carried out after a stable open circuit potential (OCP) was reached (about 600 s before polarization and EIS test) in the electrolyte. The working electrode of the potentiodynamic polarisation measurements were performed from a starting potential of −500 mV vs. OCP, and then anodically to +500 mV vs. OCP, similar to the procedure used by Wojciechowski [21]. The scan rate was 0.2 mV/s. The EIS measurements were carried out at the value of OCP, and the applied sinusoidal signal RMS amplitude was 10 mV over the frequency range from 105 to 10−2 Hz. Three similar samples were measured for each coating to check reproducibility of the results. The electrochemical impedance spectra Data analysis was conducted by the software Zview 3.1.

3. Results and Discussion

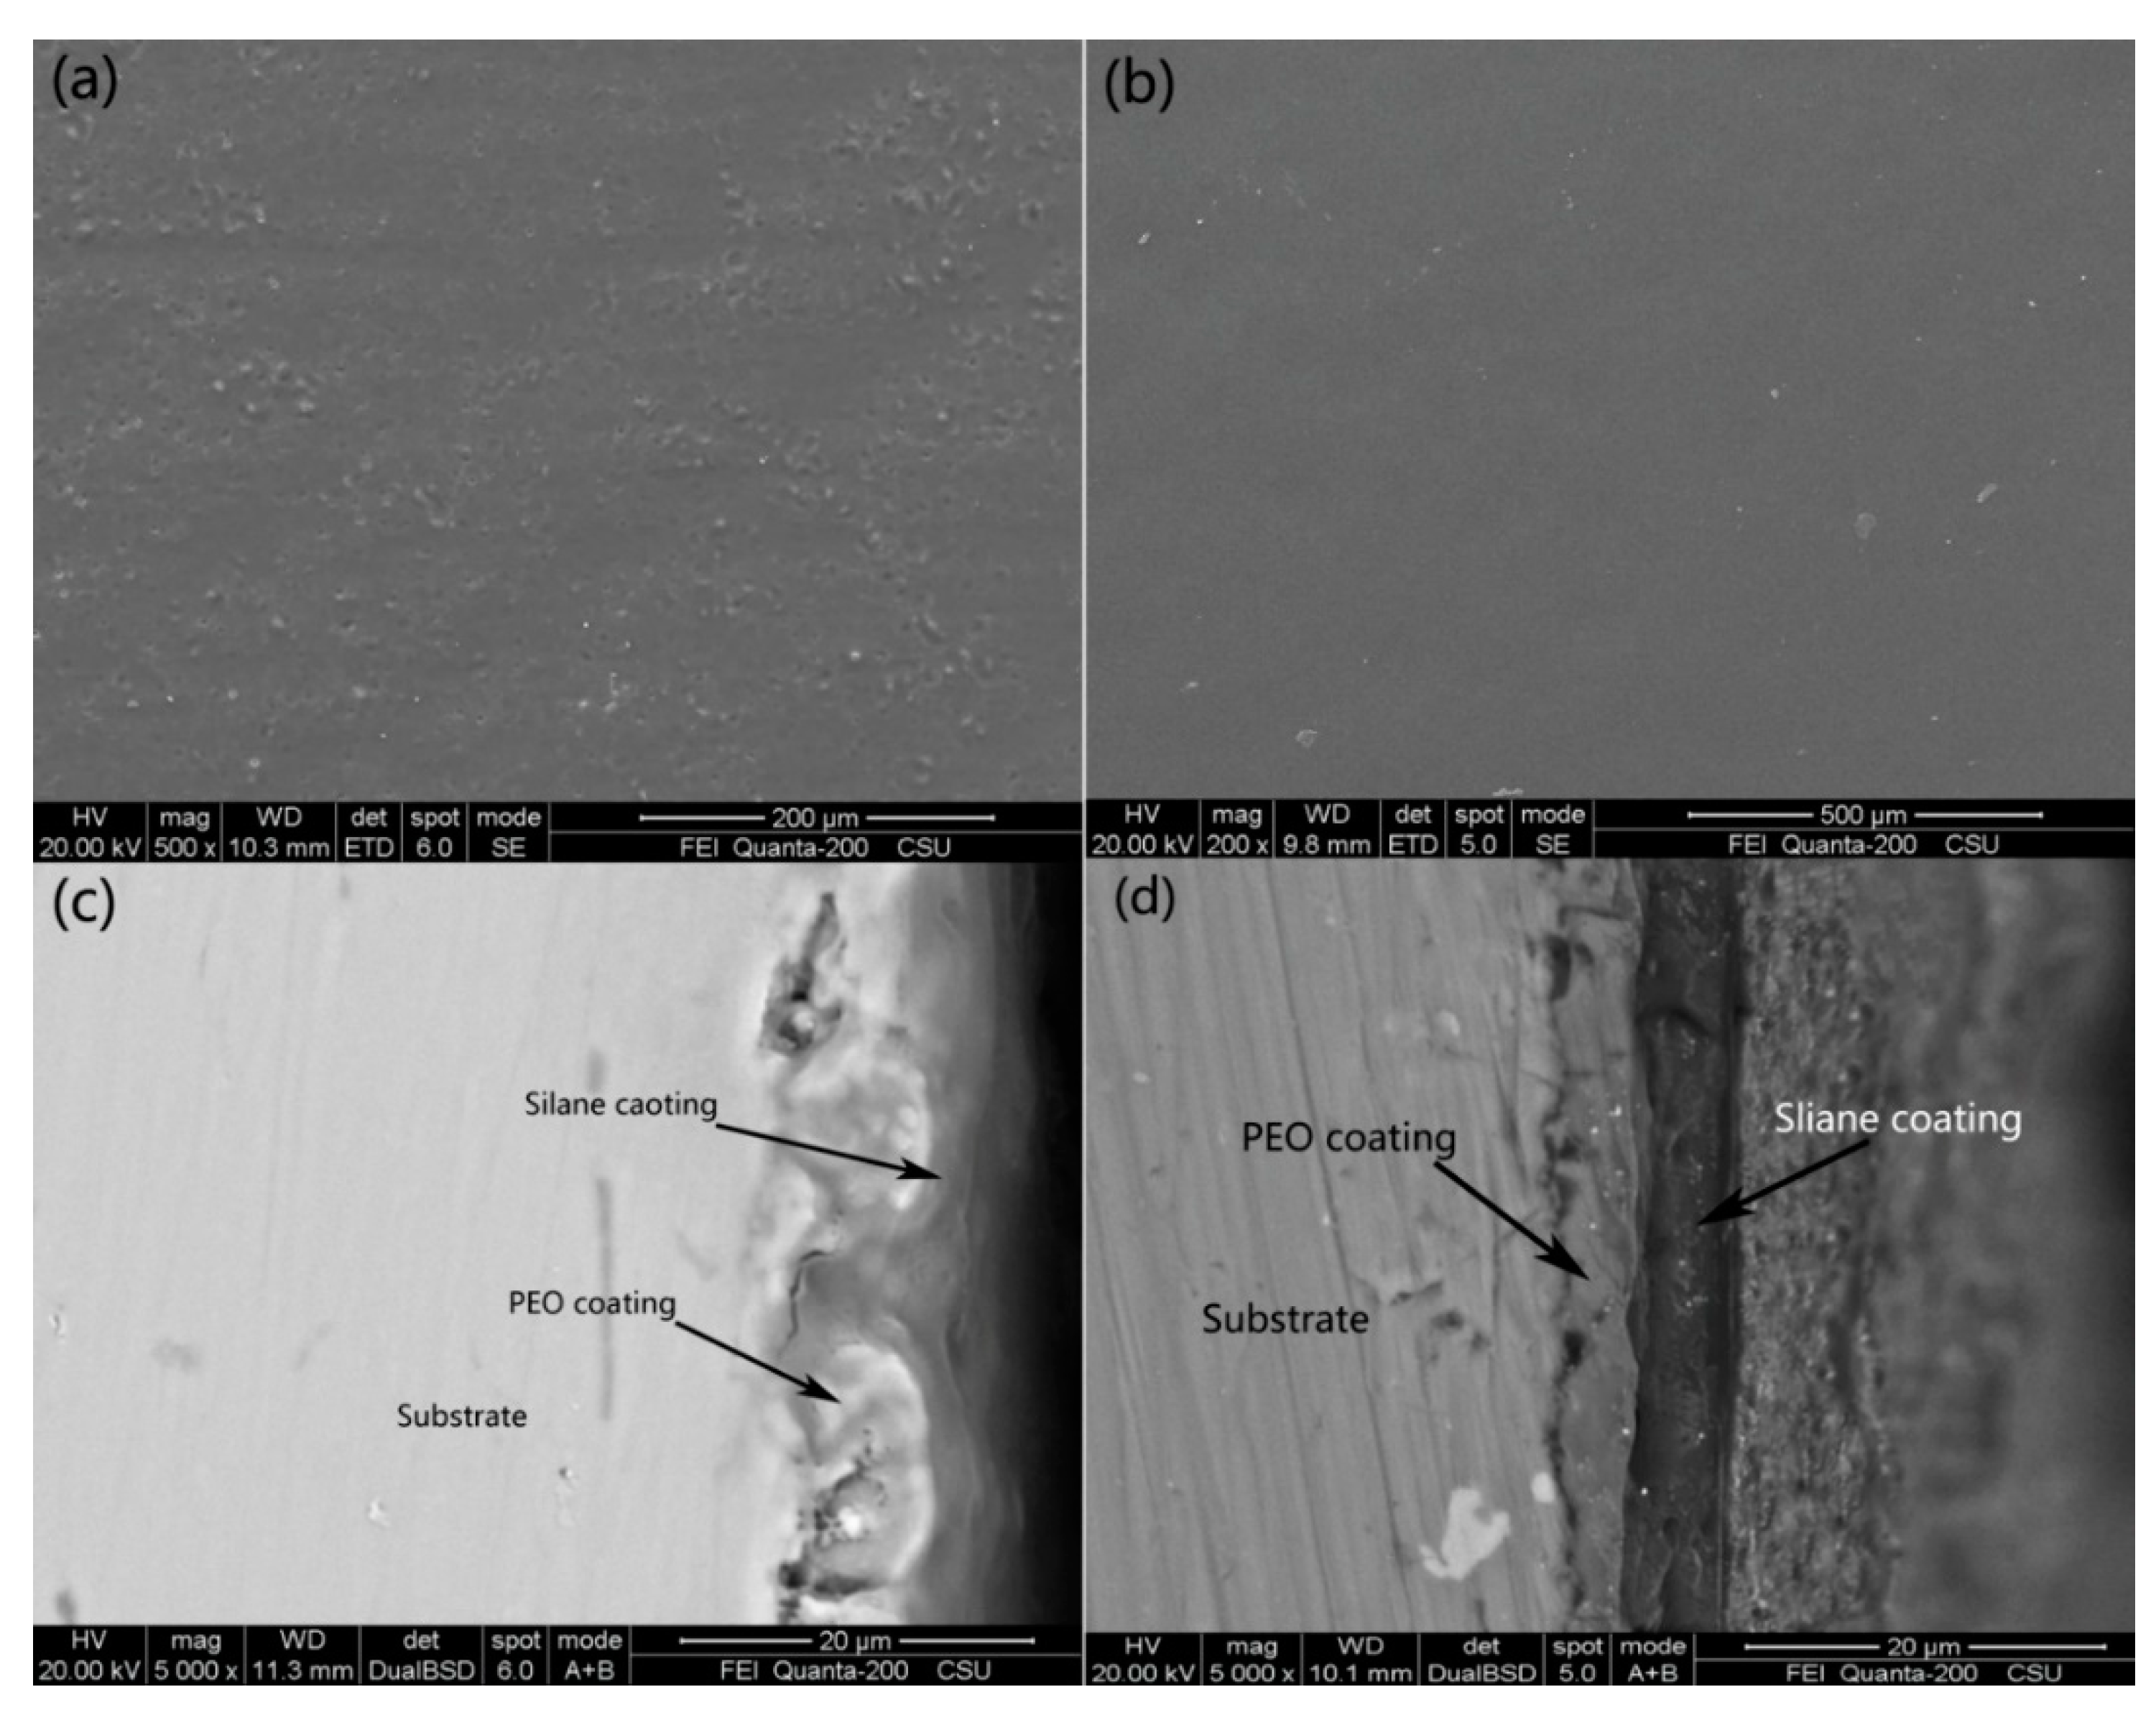
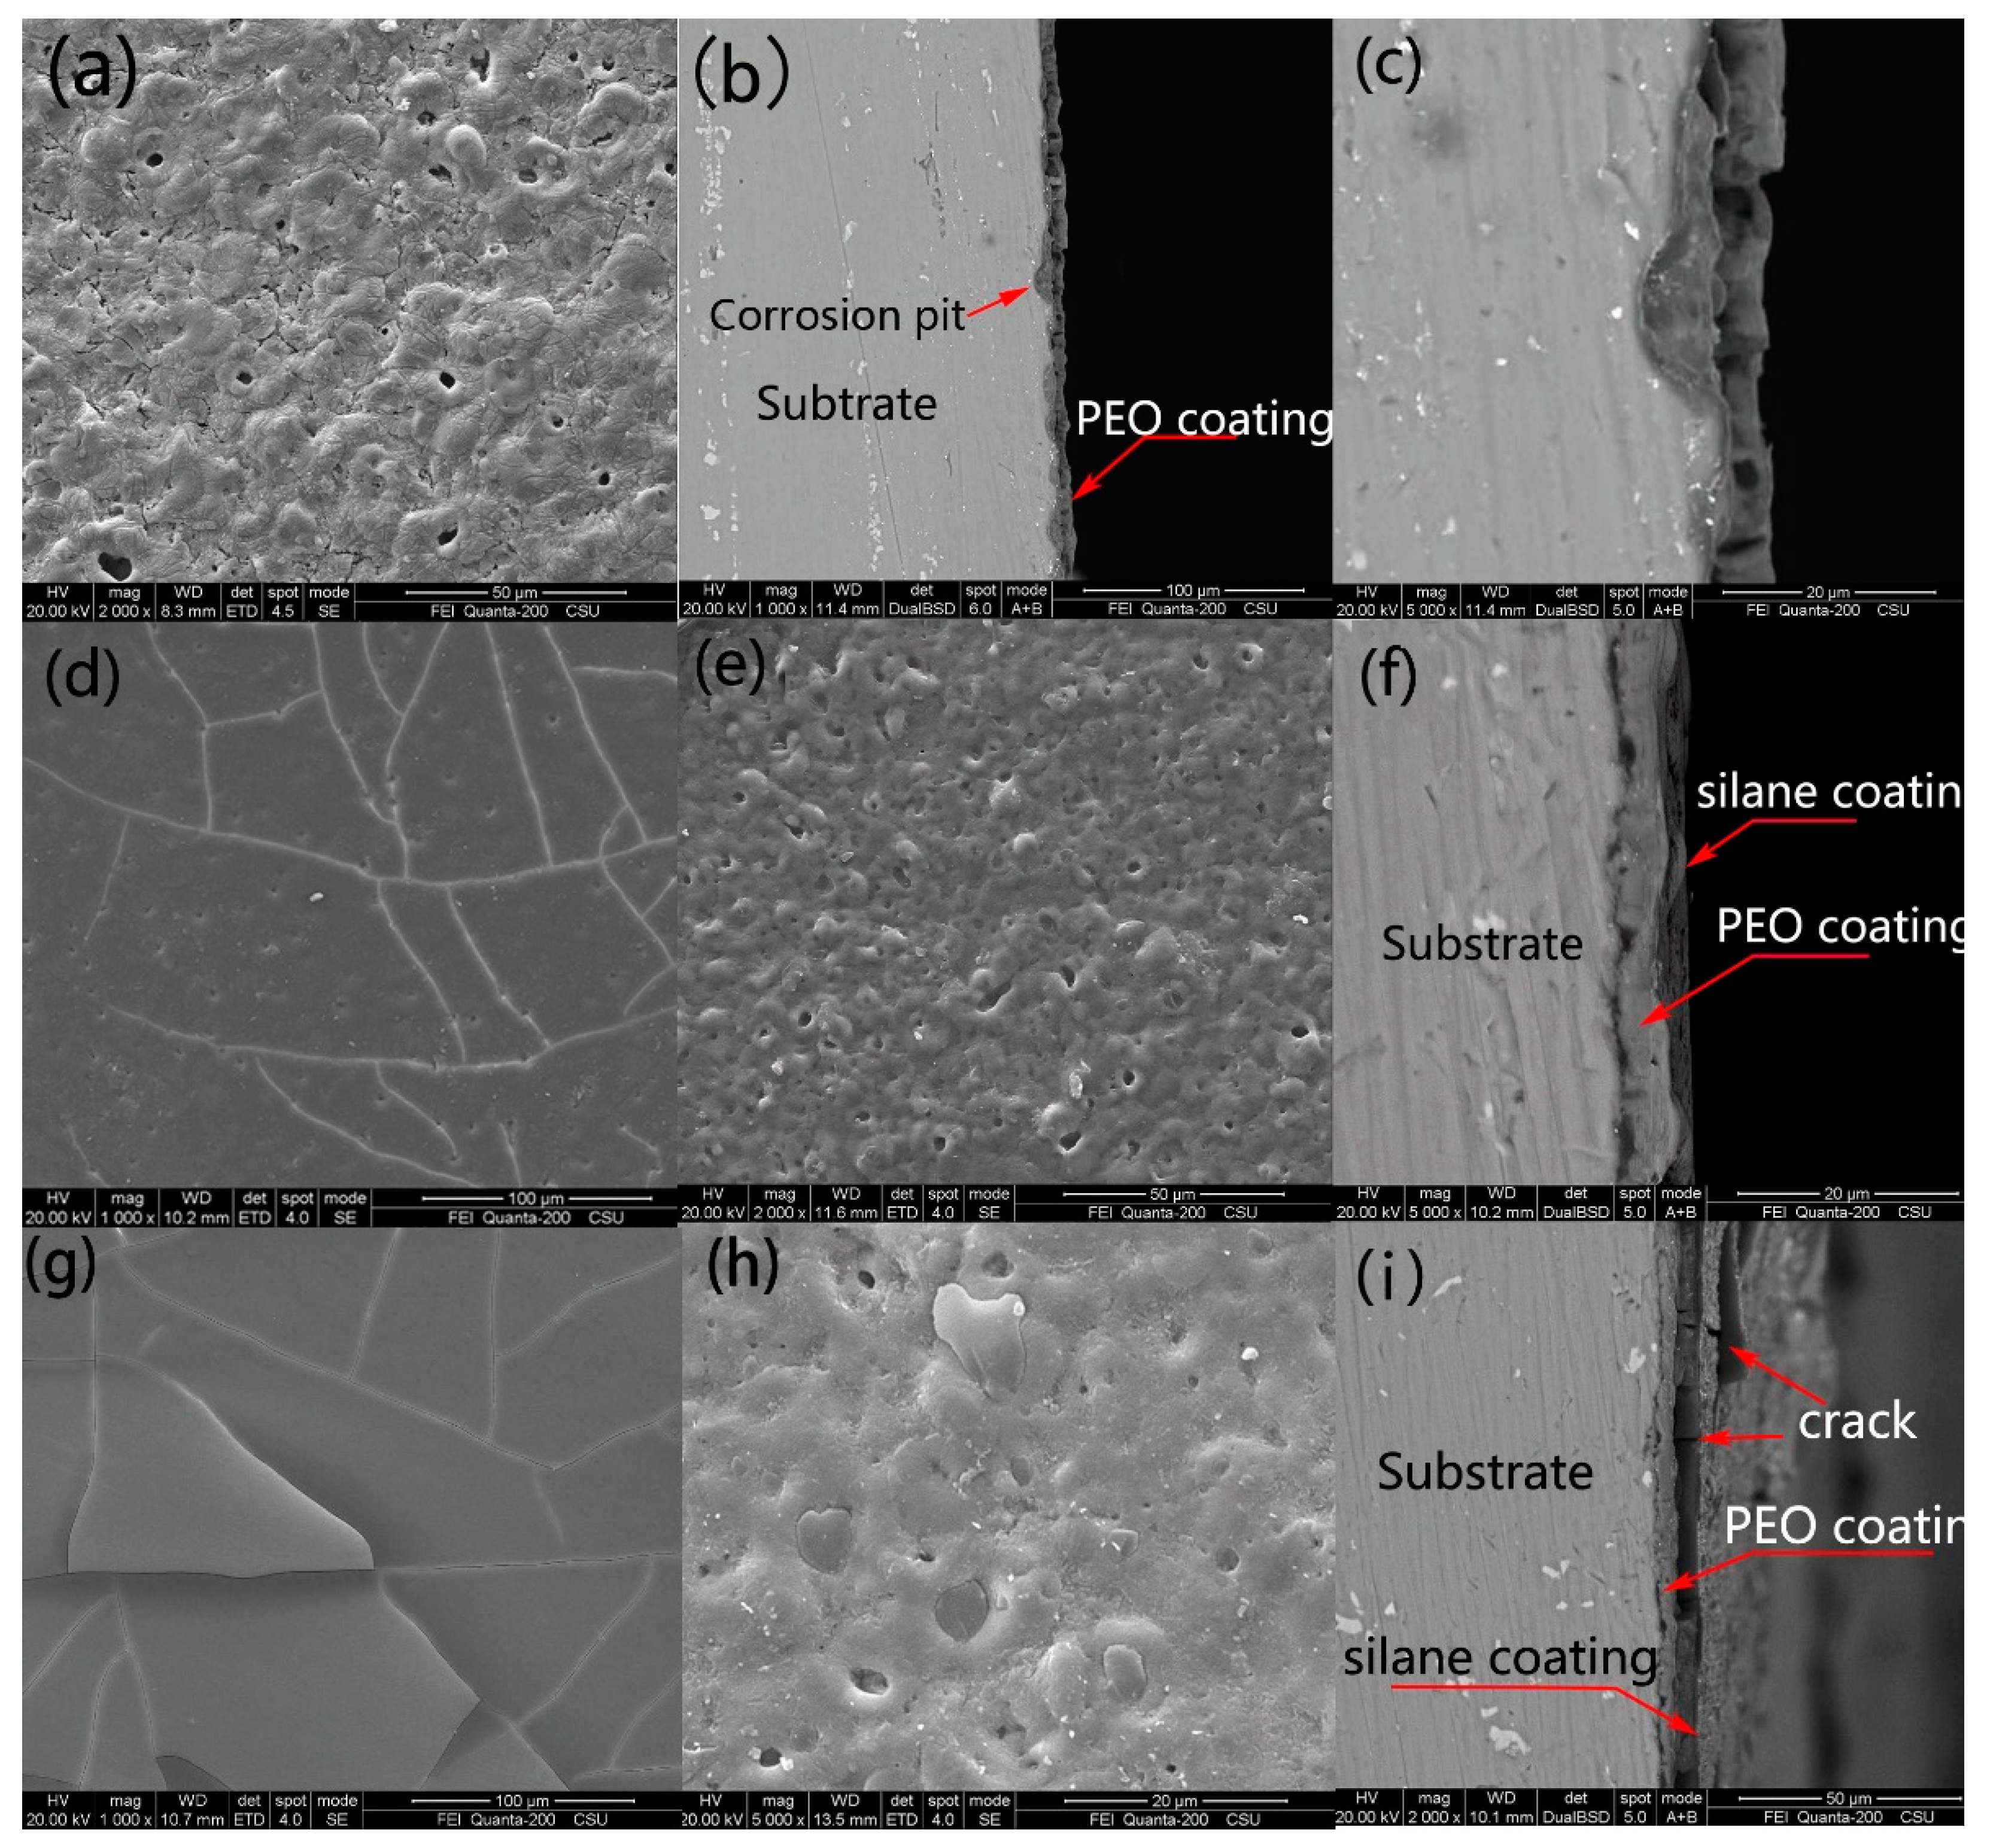
3.1. Morphologies of the Coatings

Figure 1 shows the recorded voltage–time response of the PEO process. According to previous results reported in the literatures [9,10,11], four distinguished discharge stages are usually identified during PEO process. First stage: the anodic oxidation stage before breakdown voltage, a uniform Al2O3 passive film was formed on the surface of the substrate; Second stage: the voltage continued to rise beyond the breakdown voltage of the passive film, numerous tiny bright sparks appeared and moved quickly across the surface. Third stage: the voltage grew or increased slowly; the sparks were larger but slower moving across the surface. Fourth stage: in this stage the variation of voltage was slower than that in the third stage, and the sparks generated by concentrated discharges appear as relatively larger and last longer.
Figure 2 shows the backscattered SEM morphologies of the PEO coating. After 4 min of PEO treatment, a coating with pores of tens to hundreds of nanometers had been formed on substrate, and the thickness of the coating was about 2 microns as shown in Figure 2a,b. The dense coating formed at this time was defined as the inner layer [6,9]. It is a layer formed by oxygen—permeating to, and subsequently oxidizing to, the Al substrate. The passive film was destroyed and fused by the high temperature and pressure from the plasma discharge, meanwhile, the transfer of oxygen anions towards the substrate through discharge channels can be enhanced by instantaneous high electric field intensity during PEO process. After 15 min of PEO treatment, an outer layer of PEO having many micro pores (as shown in Figure 2c) was formed, and there is a porous region at the substrate/coating interface (as shown in Figure 2d), Due to the porous nature of the as-formed coating, corrosive media can easily penetrate into the substrate/coating interface.
The surface of the PEO samples with a silane coating (outer) and a PEO coating (inner) is shown in Figure 3. It could be clearly seen that the porous PEO coating had been sealed by the silane layer completely (Figure 3a,b), and the silane coating was closely combined with the PEO coating (Figure 3c,d).

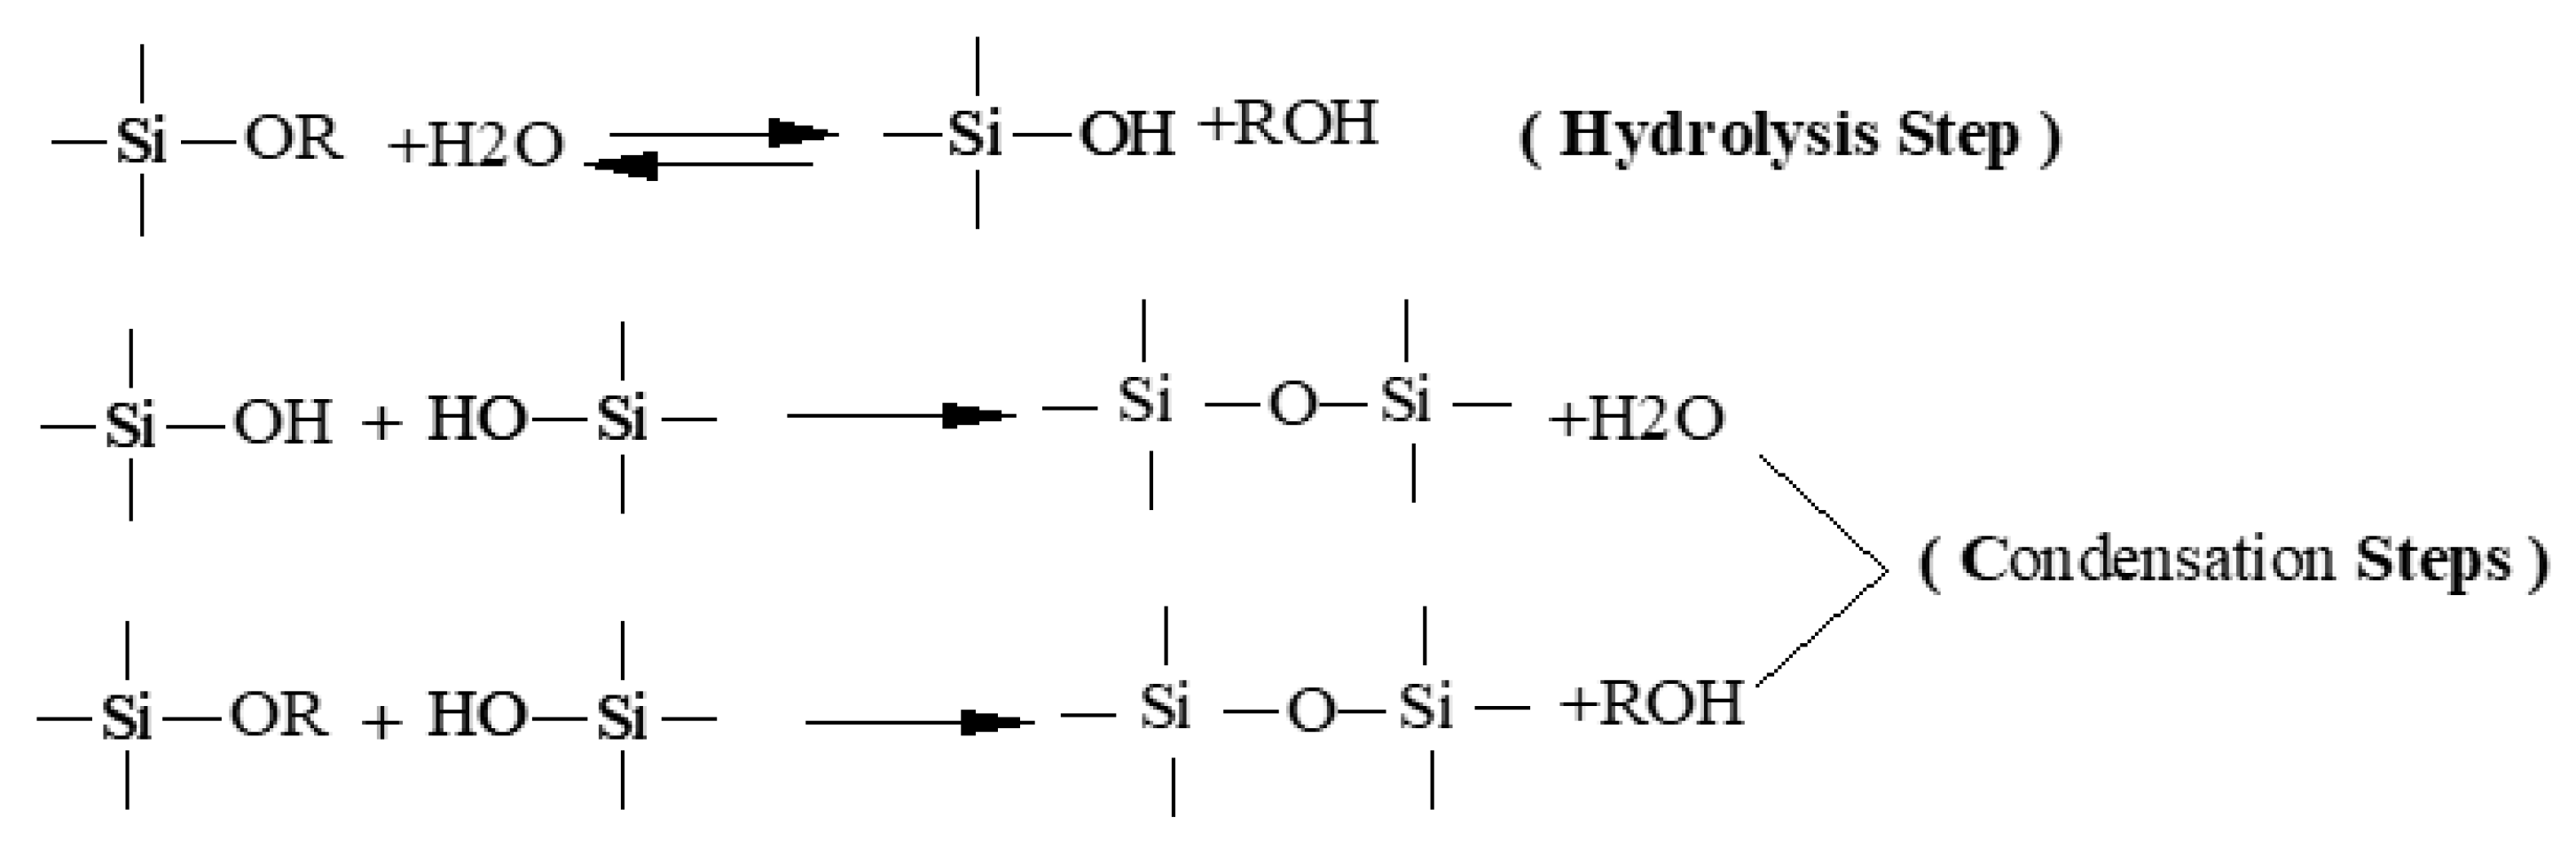
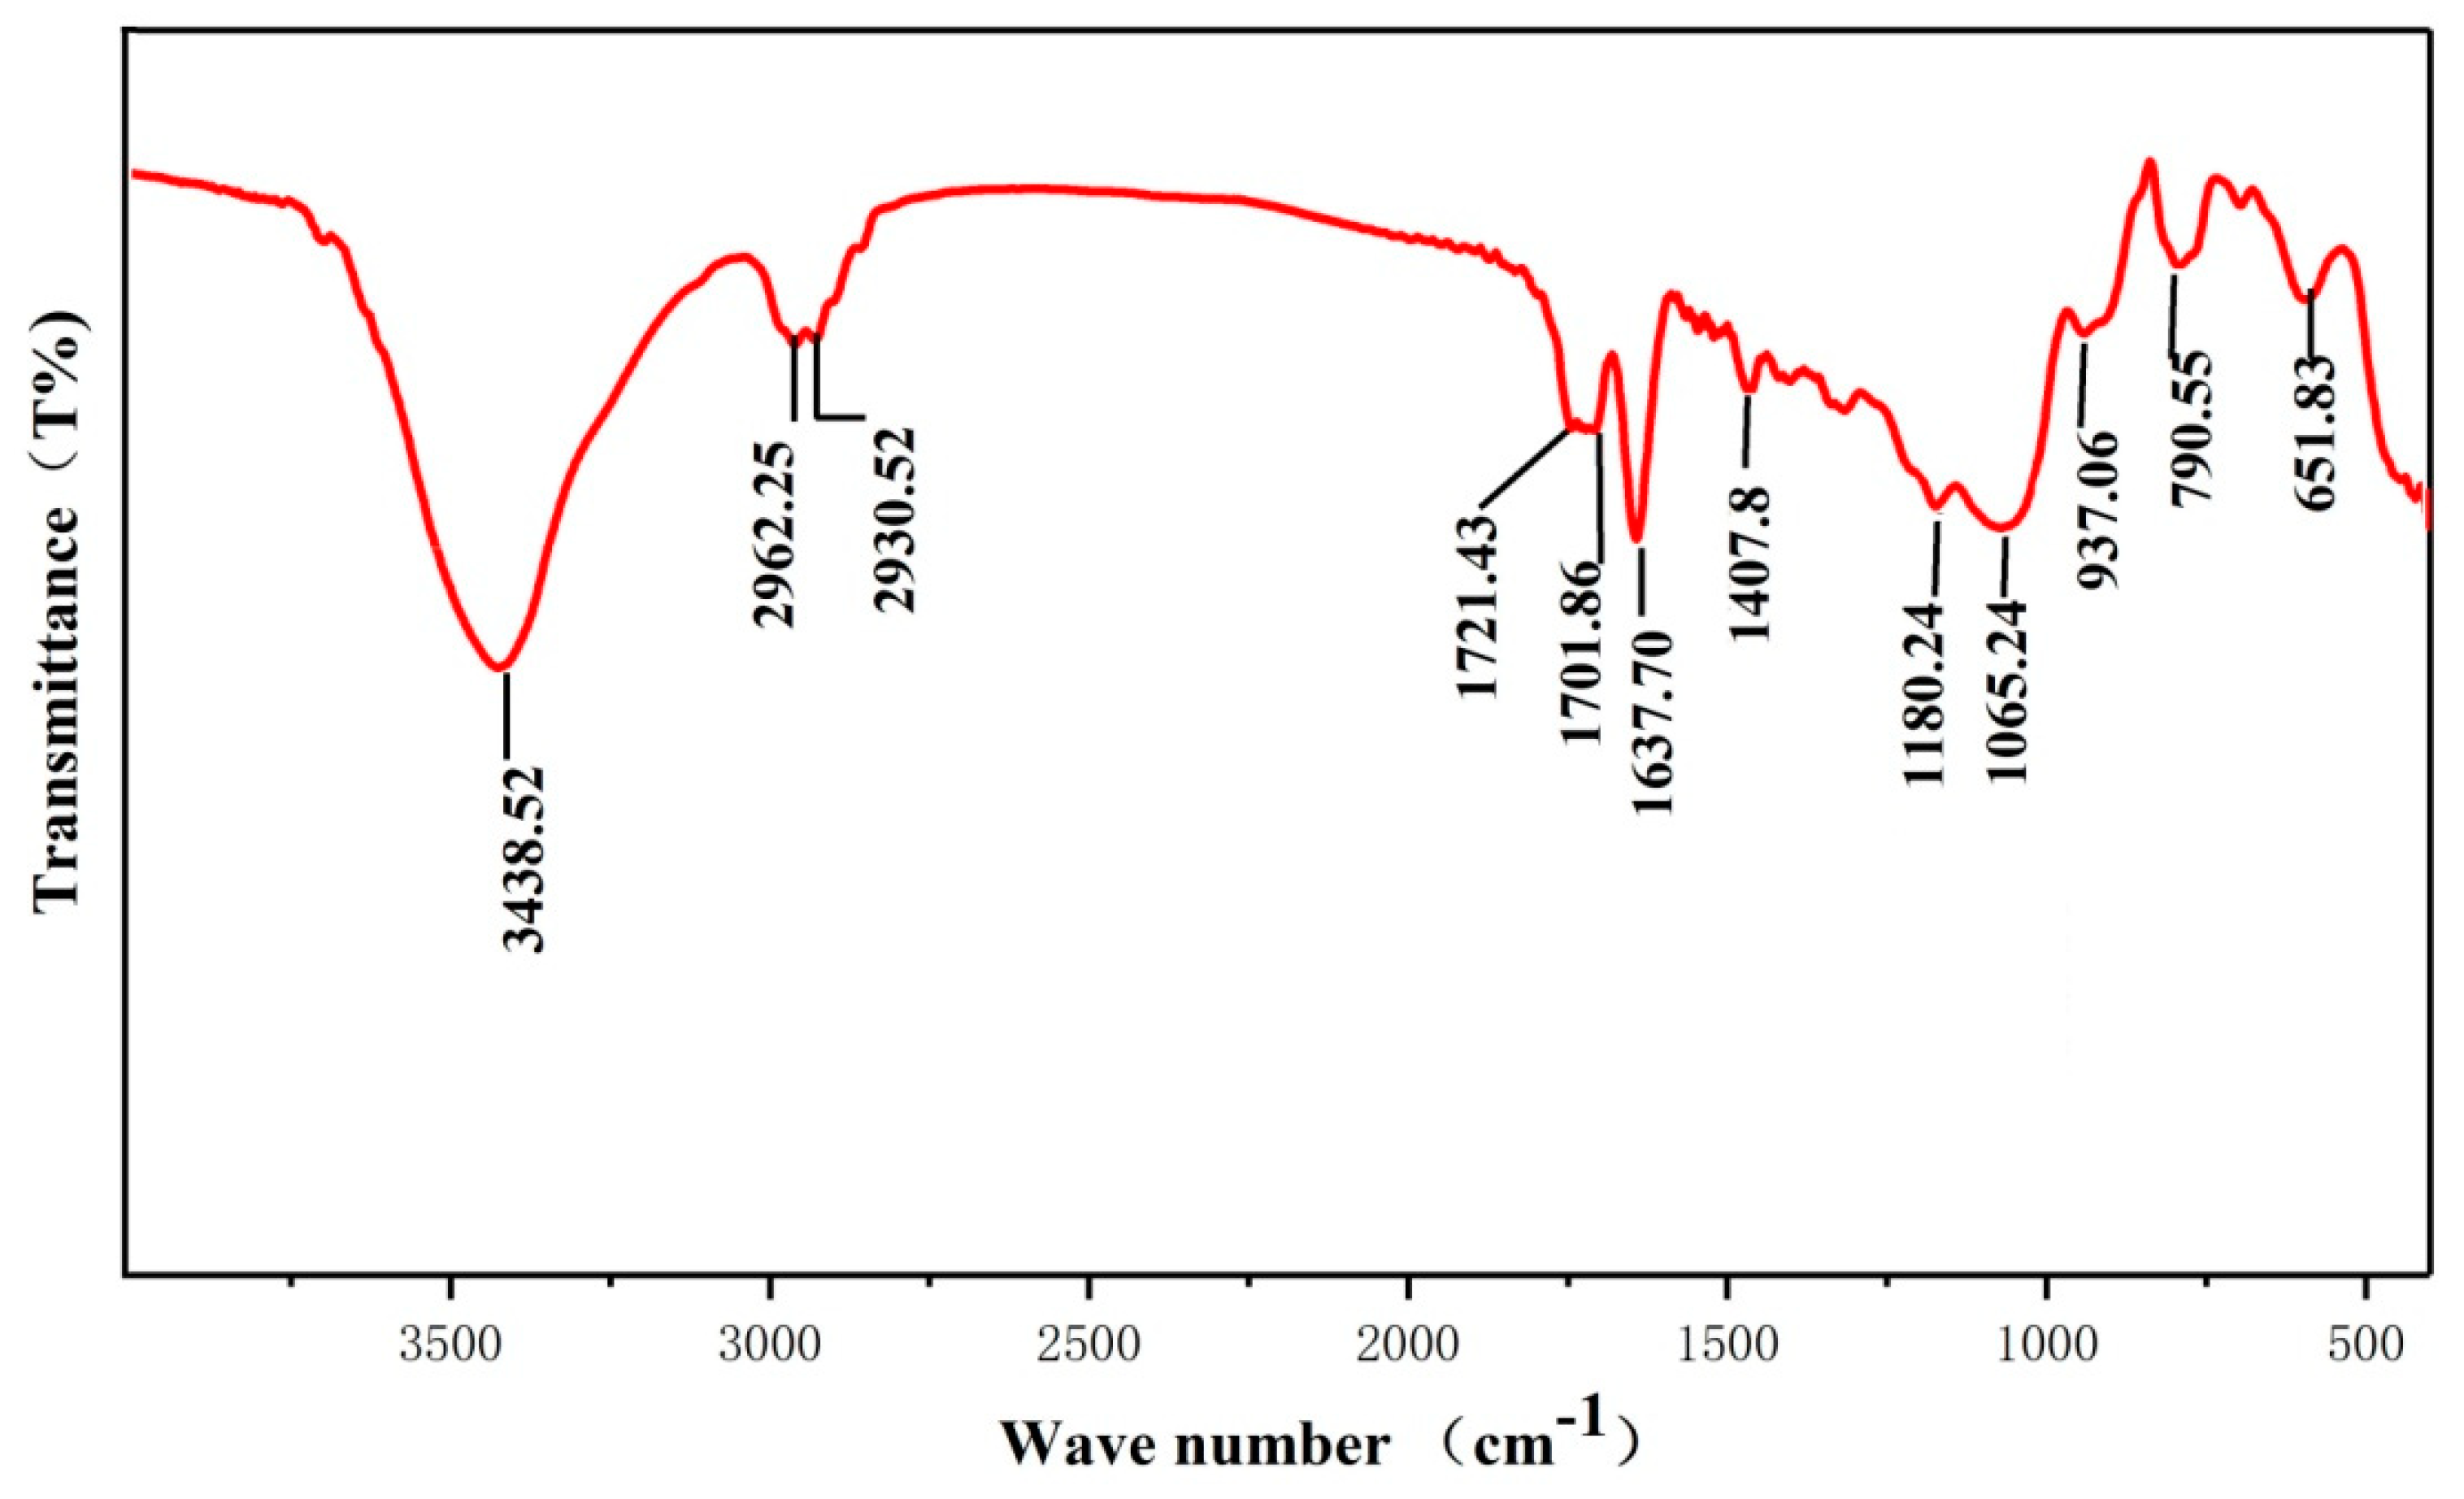
3.2. Formation Mechanism of Silane Coating

MPTES and TEOS formed a silane coating on PEO coating under acidic conditions by hydrolysis and condensation reactions in the sol–gel process. The hydrolysis and condensation processes are shown in Scheme 1 [29,30]. Initially, Si–OH bonds are formed via a hydrolysis reaction between alkoxy groups (Si–O–R) and water molecules. Subsequently, Si–O–Si covalent bonds are then formed via a condensation reaction between Si–OH and Si–OH with Si–O–R moieties. During the curing process of the coating, Al–O–Si covalent bonds are formed by condensation of hydroxyl groups between (Al–OH) and Si–OH [21,31,32].
Figure 4 depicts the FT-IR spectra of the PEO-S2 coating covered by the silane film. The broad peak at 3438 cm−1 was assigned to the OH vibrations [33,34,35,36]. The subsequent peaks at 2962 and 2930 cm−1 could be assigned as asymmetric stretching of –CH3 and CH2– [21,31,32,33,34,35]. The peaks at 1701 cm−1 and 1637 cm−1 could be assigned to –COO stretching vibration and C=C-stretching vibration [36,37,38], respectively. Additionally, the characteristic absorption bands for Si–O–Si appeared at 1180, 1065, and 937 cm−1, indicating that the hydrolysis and subsequent condensation reaction occurred between MPTES and TEOS at pH 3.5, resulting a well-developed and cross-linked polymeric chain with Si–O–Si bonds [21,34,35,36,37,38,39,40]. Additionally, due to the incomplete condensation of the Si–OH group, an absorption peak appeared at 790 cm−1 (Si–O–C vibrations) [21,32,36].

3.3. Electrochemical Corrosion Behaviour

The electrochemical corrosion evolution of PEO coatings with and without silane sealing in a 3.5 wt.% NaCl solution was examined by potentiodynamic polarization and EIS plots.

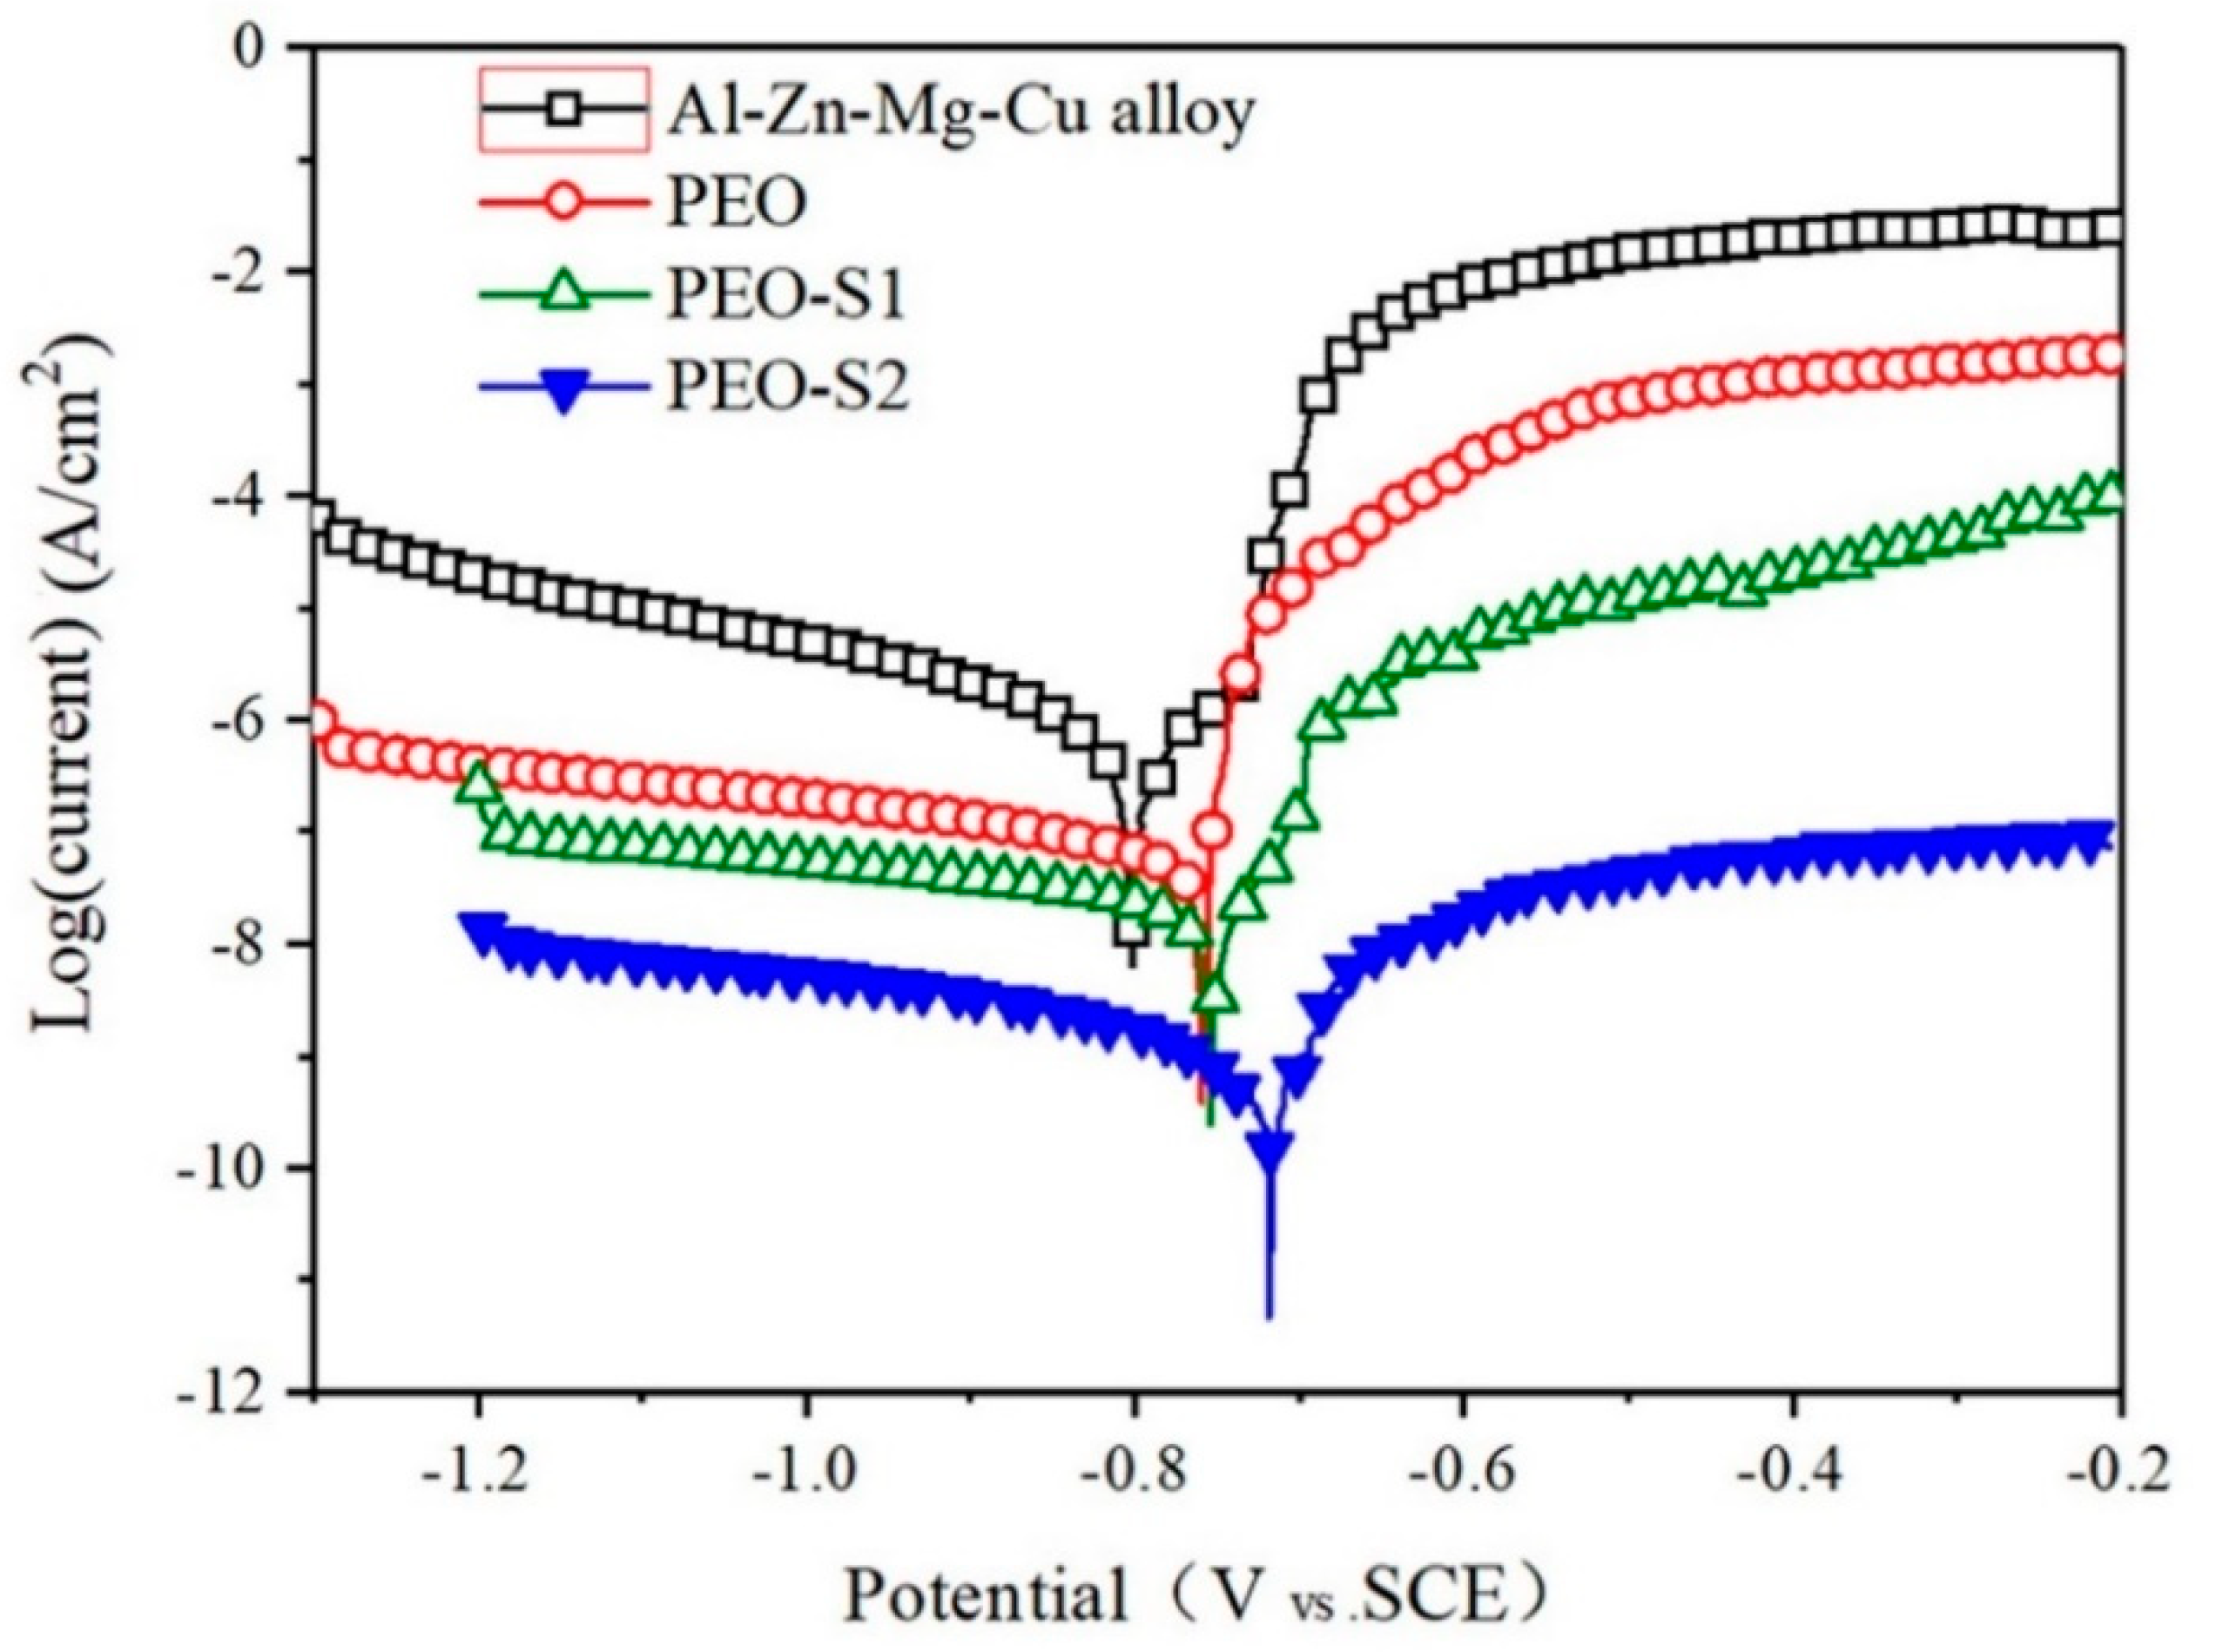
3.3.1. Potentiodynamic Polarization Analysis
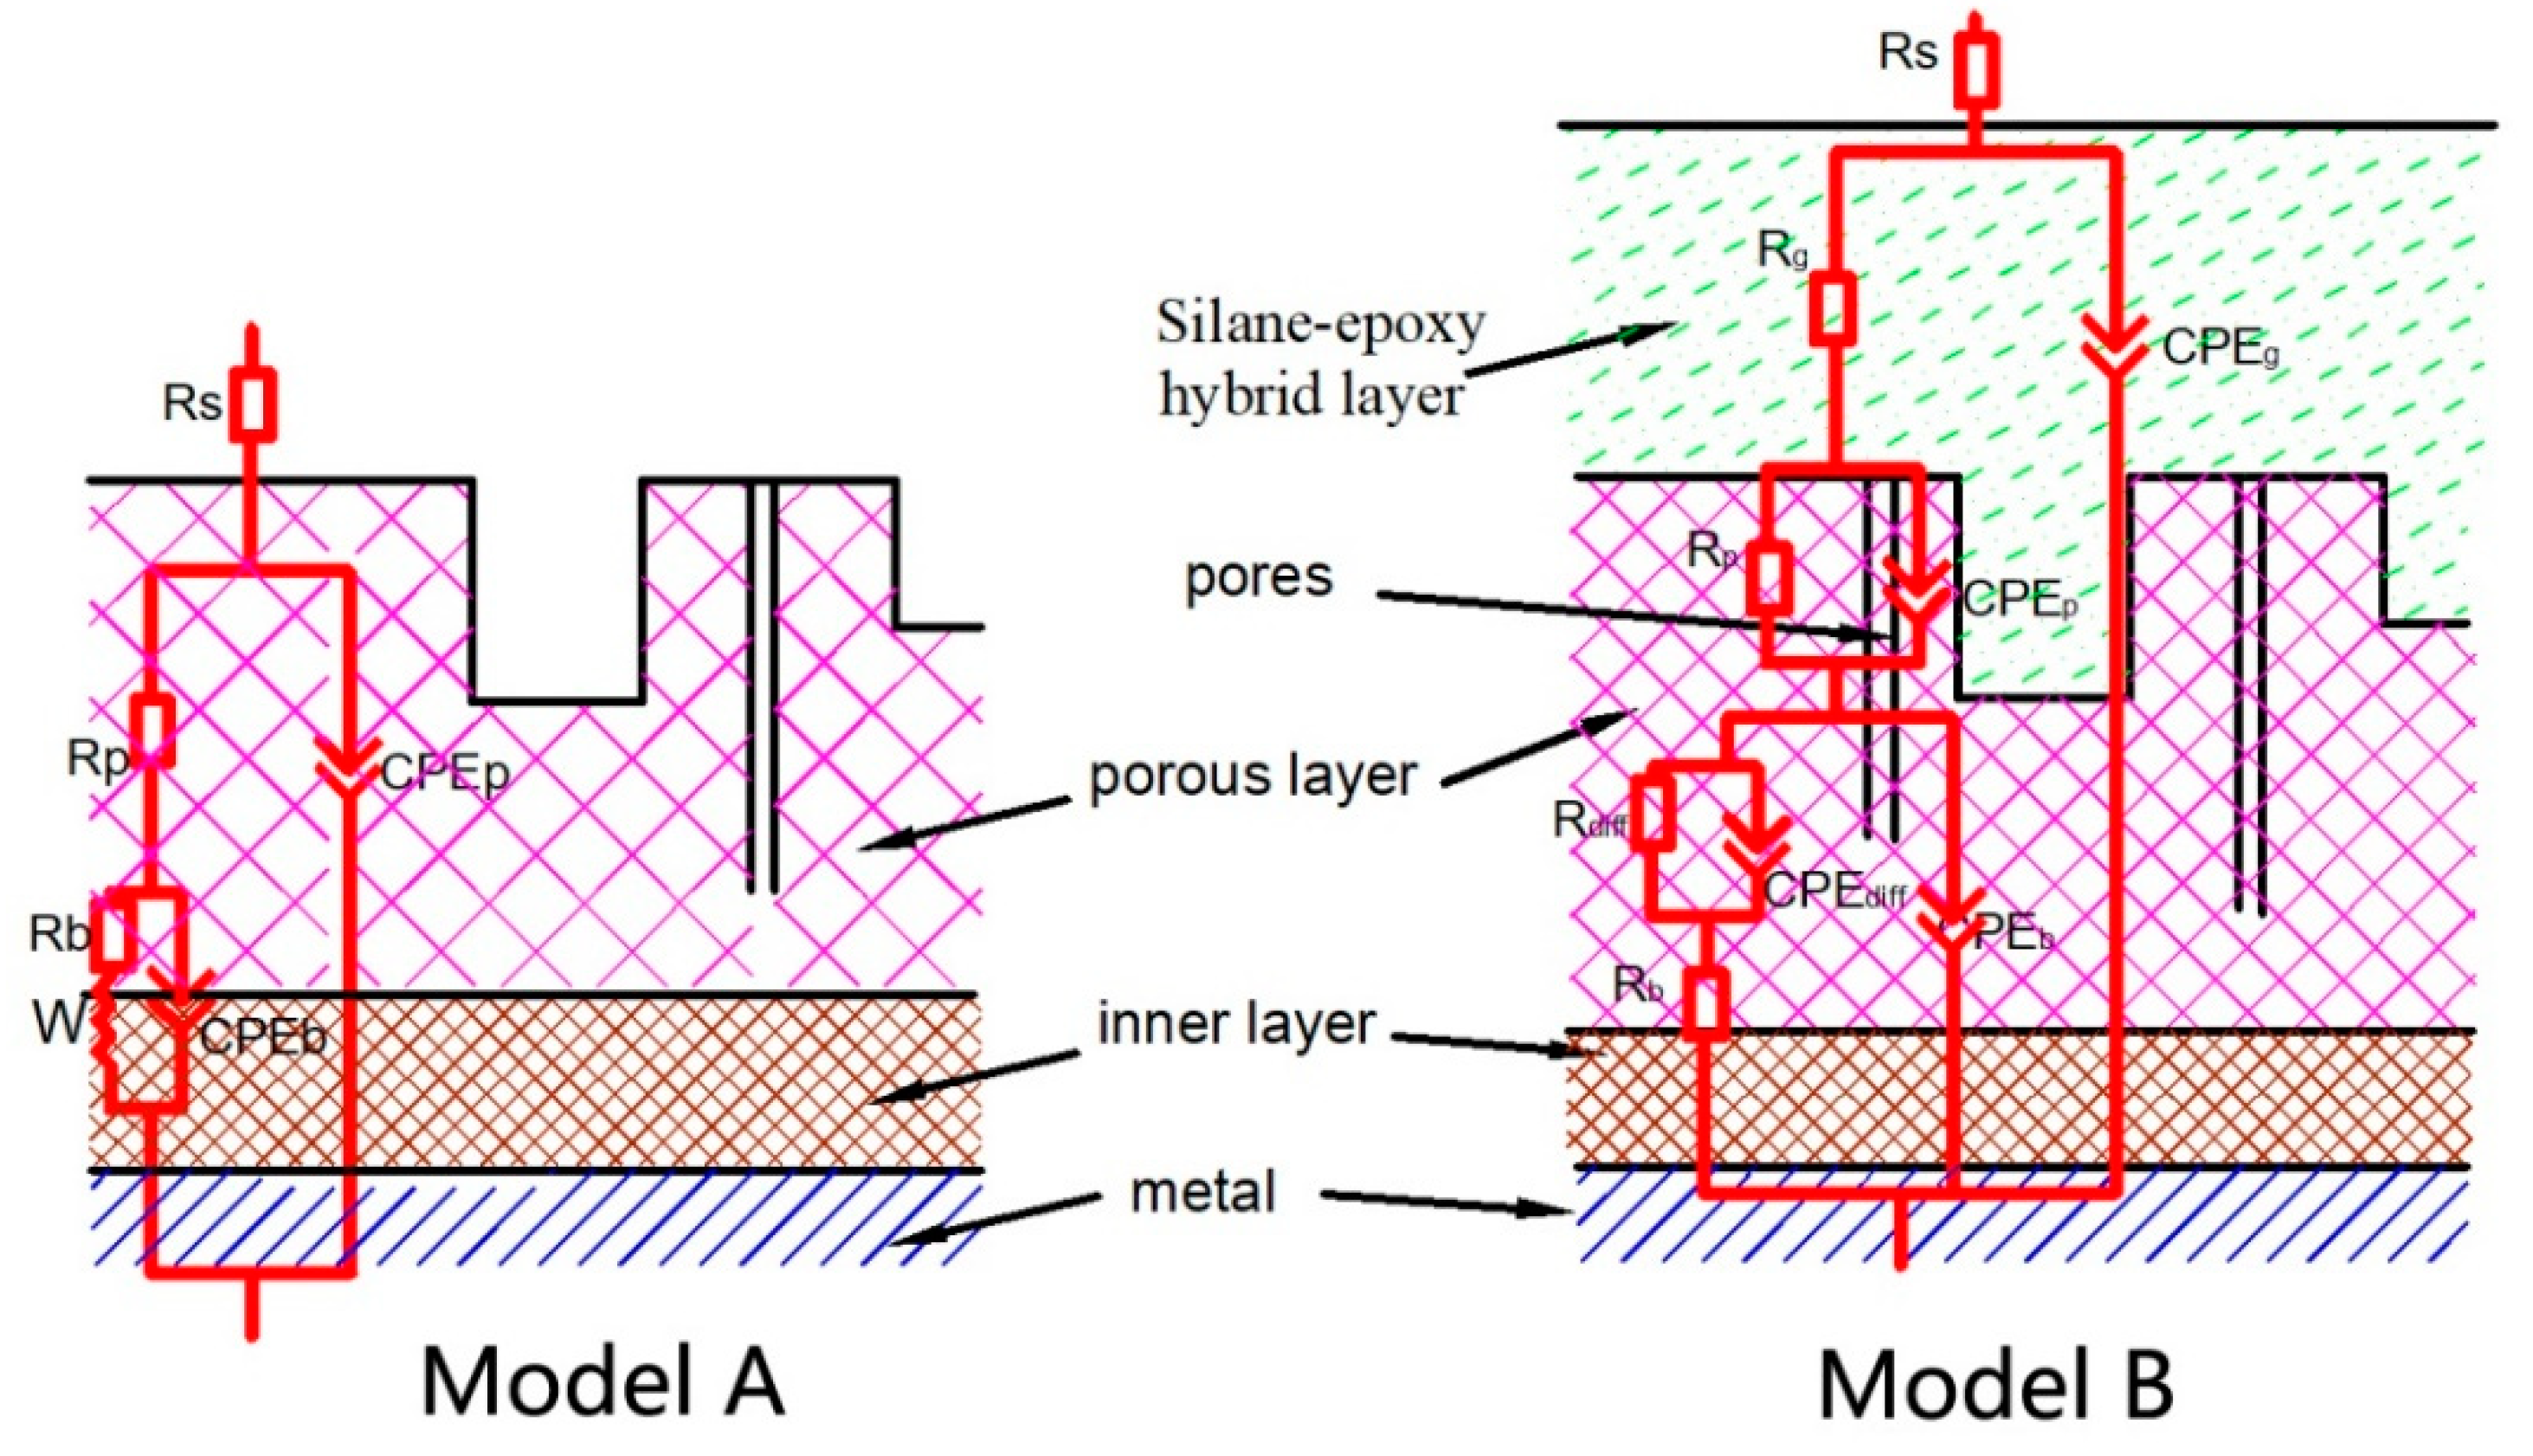
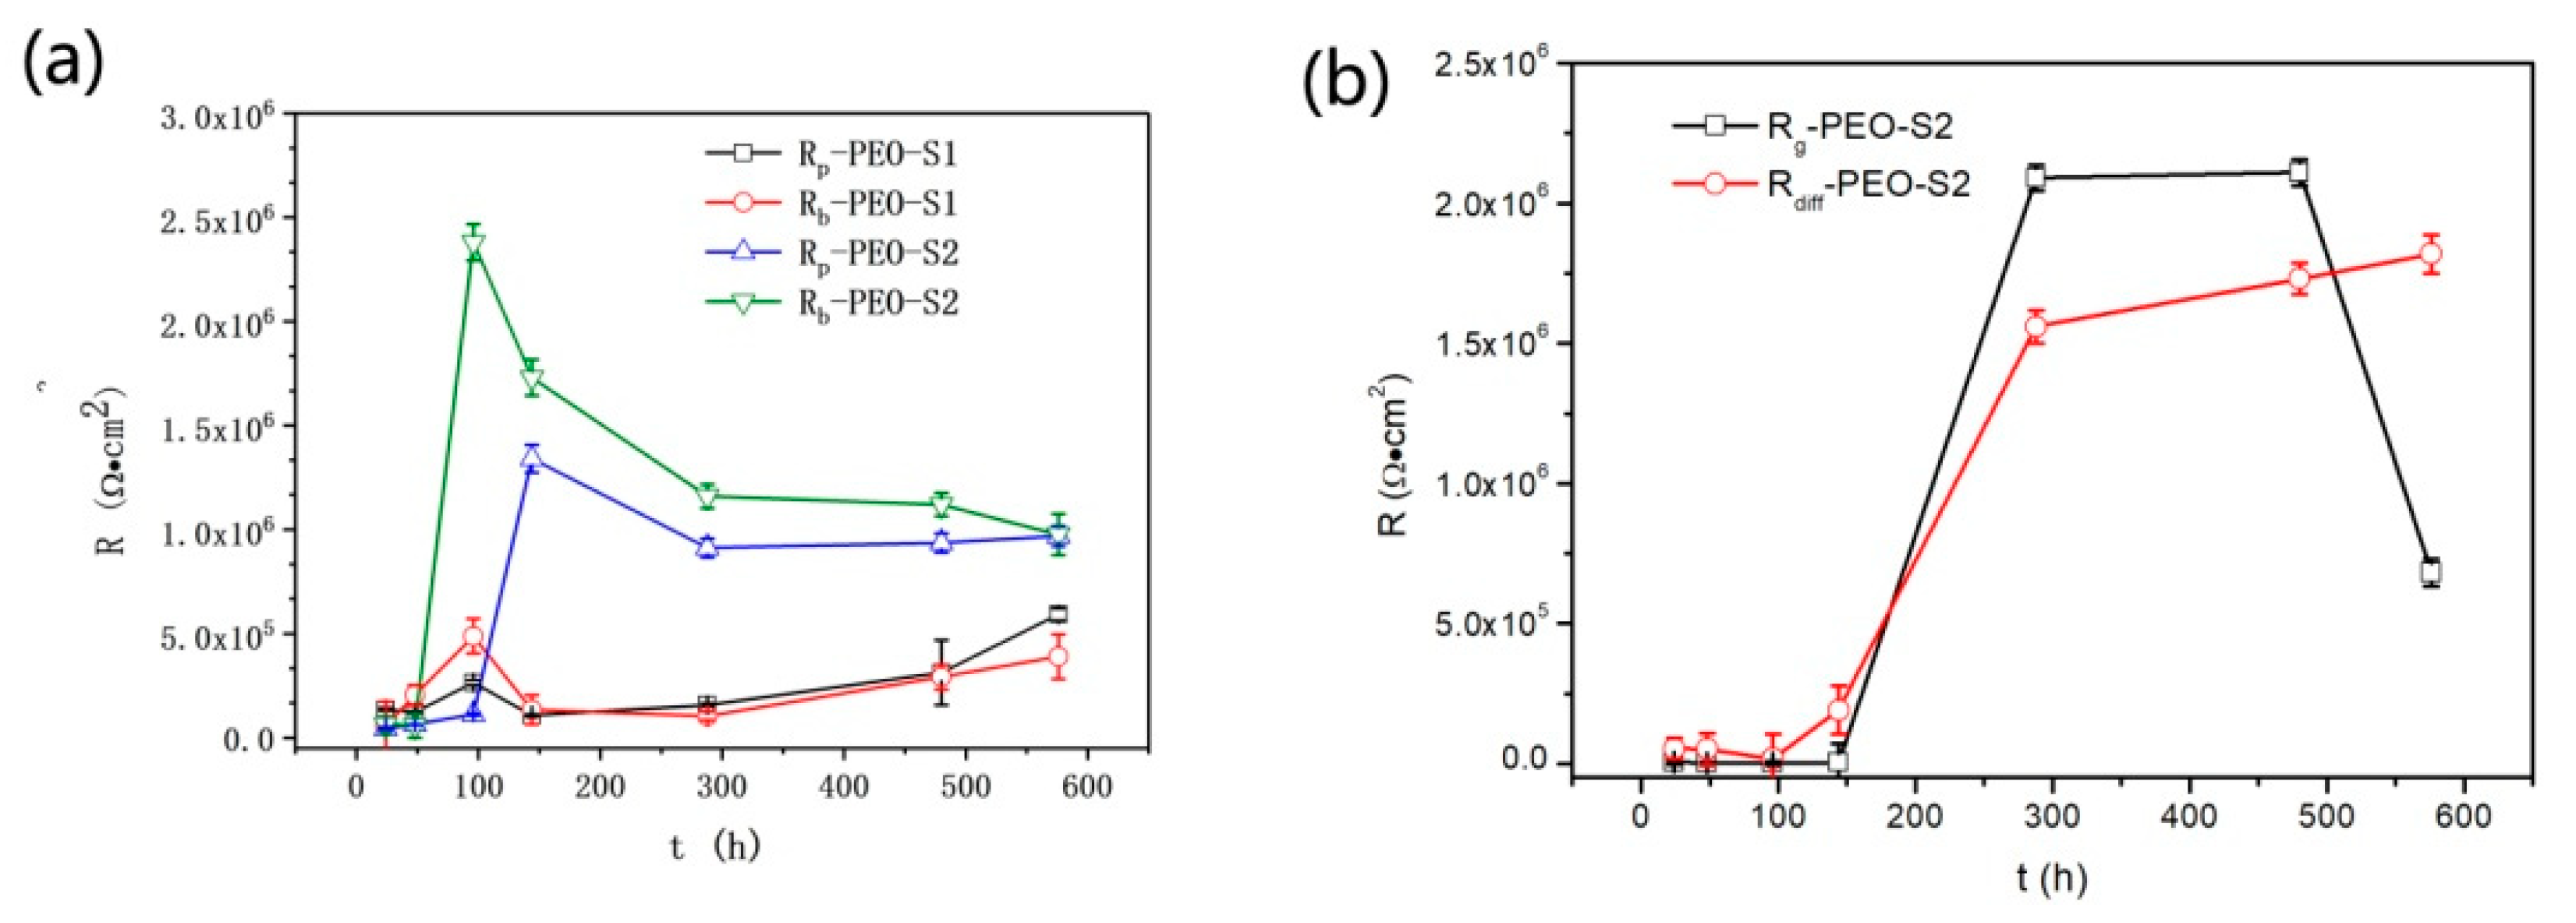
Figure 5 shows the potentiodynamic polarization curves of the UNS A97075 alloy and PEO with and without a silane sealing coating on the UNS A97075 alloy in a 3.5 wt.% NaCl solution. Considering the PEO coatings were thick ceramic insulating coatings and the pores were sealed by silane coating, corrosion currents cannot be calculated with the Tafel law. So, the potentiodynamic polarization was used only as qualitative analysis among the different samples. Otherwise, as the polarization curves do not display well-defined anodic Tafel region, the corrosion current density (icorr) was derived from the extrapolation of the approximately cathodic Tafel region (ranging from −120 mV to −60 mV versus the corrosion potential [6]) back to the corrosion potential using the special analysis of MULTI AUTO M204 electrochemical work station.
Bare aluminium showed the highest current densities. It was clear that in this case the corrosion rate was highest. Corrosion potentials of PEO coating with and without silane sealing were more positive than the potential of bare aluminium and the corrosion current density also much smaller. The corrosion potentials and current densities are listed in Table 1. The value of icorr for PEO-S2 was approximately two orders lower than that of PEO-S1, and about three orders lower than that of the unsealed PEO coating, indicating that silane coating could effectively block the penetration of water, oxygen, and corrosive ions, and the thicker the silane coating, the stronger the barrier ability.

3.3.2. EIS Analysis

The EIS plots of samples immersed in a 3.5 wt.% NaCl solution for different times are shown in Figure 6.
From the EIS plots of PEO coating in Figure 6a–c, two time constants could be seen in the Bode plots, suggesting that the corrosive had penetrated the coating via the micro defects of outer porous layer during the immersion test time [26]. Moreover, a diffusion tail can be identified at low frequencies (10−1–10−2 Hz), suggesting that the corrosion media had diffused in the PEO coating and penetrated the open channels of the oxide film. The Cl ions participated in chemical reactions with aluminium ions during long-term immersion, and these reactions might be expressed as follows [41,42]:
Al ( OH ) 3 + Cl Al ( OH ) 2 Cl + OH
Al ( OH ) 2 Cl + Cl Al ( OH ) Cl 2 + OH
Al ( OH ) Cl 2 + Cl AlCl 3 + OH
The EIS results for the silane sealed PEO-coated alloy are displayed in Figure 6d through (i). Compared to PEO coating, the low frequencies impedance of silane sealed PEO coating increased approximately 10 times. Meanwhile, the impedance at medium frequencies of silane sealed PEO coating decreased much less from 24 to 576 h, indicating that silane layer effectively blocked the damage of the substrate by corrosive media.
In order to reveal the electrochemical corrosion evolution of the coating, the EIS plots were analyzed by fitting the data to equivalent circuit analogs. Two typical equivalent circuits (EECs) were proposed as shown in Figure 7 [6,7,26,27]. The proper selection of EEC was validated by goodness of fit (the relative standard error within 10%, or the sum of the squares of the residuals is in the order of 10−3).
Model A was used to analyse the impedance behaviour of unsealed PEO coating. Here, Rs is the solution resistance, CPEp is the outer layer capacitance, Rp is the outer layer resistance, Rb and CPEb are the charge-transfer resistance and the double-layer capacitance of the oxide inner layer, respectively. The Warburg element (Wo) was an appropriate diffusion element to describe the diffusion tail at low frequencies. The fitted curves are illustrated in Figure 6. The fitted parameters are shown in Table 2. According to the fitting results, Rb remained on the order of 104 Ω·cm2 and the changes were small during the immersion test time, demonstrating that the continuous inner layer was the main factor affecting the corrosion resistance of the PEO coating.
Model B was used to analyse the silane sealed PEO coatings. Here, Rg is the silane layer resistance, CPEg represents the silane layer capacitance, CPEdiff is diffusion capacitance, and Rdiff is diffusion resistance. The PEO-S2 coating system was used as an example to demonstrate the electrochemical corrosion behaviour for different immersion times. The fitted curves are illustrated in Figure 6, and all the fitted impedance parameters are listed in Table 3. According to the fitting results, the corrosion process of the PEO-S2 coating system could be divided into three stages during immersion times.
At the initial stage of immersion (less than 48 h), cracks appeared in the silane layer as shown in Figure 8. The corrosive media (i.e., water, oxygen, and Cl) could penetrate through these defects to the PEO coating, resulting in the fact that the impedance decreased significantly at low frequencies as shown in Figure 6h. Considering that the silane layer and the PEO outer layer had a barrier performance against the diffusion of charged species, the electrochemical reaction area at the Al-alloy/PEO inner layer interface was still small in this immersion period. This made it difficult to distinguish the relaxation time of the coatings’ physical impedance from that of the electrochemical reaction impedance at the Al-alloy/coating interface [24,25], so two capacitive loops with a diffusion tail appeared in the Nyquist plots as shown in Figure 6g. Thus, Model B, which contains three time constants and a diffusion combination, was introduced to fit the impedance spectra of PEO-S2 coating. The diffusion of corrosion products from the Al-alloy surface to the coating was hindered by the coating, the diffusion process might become a control procedure in Faradaic processes [40,43]. The silane layer formed a capacitive equivalent circuit. The corrosion resistance was controlled by the CPEg-T value, and the lower the value was, the better the barrier property.
At the second stage of immersion (after immersion for 96 h), the impedance response of the sample changed, the capacitive arc radius and hence impedance increased at low frequencies, and three capacitive loops, along with a diffusion tail appeared in the Nyquist plots. At this stage, the charge-transfer resistance of the PEO inner layer Rb increased significantly, as shown in Figure 9a. Rb of PEO-S2 increased from ~104 to ~106 Ω·cm2 (as shown in Table 3), suggesting that the total number of active sites for electrochemical corrosion reactions at the Al-alloy/PEO inner layer interface decreased, and the charge transfer in the PEO inner layer became the main factor controlling the corrosion rate.
At the third stage of immersion (after immersion for 288 h), Model B was continually applied to fit the impedance spectrum of PEO-S2 coating. The fitted results (as shown in Figure 9b, Rg increased rapidly, indicating that the silane coating formed a resistor equivalent circuit. At the same time, the increase of Rdiff suggested that the diffusion of corrosion products (e.g., Al(OH)2Cl, Al(OH)Cl2, AlCl3, etc.) to the solution was prevented by the coatings, which limited mass transfer. Therefore, the corrosion products diffused in the coating and controlled the corrosion process.
The EIS results for PEO-S1 coating are displayed in Figure 6d–f. The low frequency impedance of PEO-S1 remained at 106 Ω·cm2 and with small changes compared to that of PEO-S2. The fitting results of PEO-S1 are shown in Figure 6d–f. The fitted parameters are shown in Table 3. According to Table 3 and Figure 9a, the resistance of the PEO-S1 coating was close to that of PEO-S2 after immersion for 576 h, suggesting that the thickness of the silane layer has less effect on the corrosion resistance of the coating.

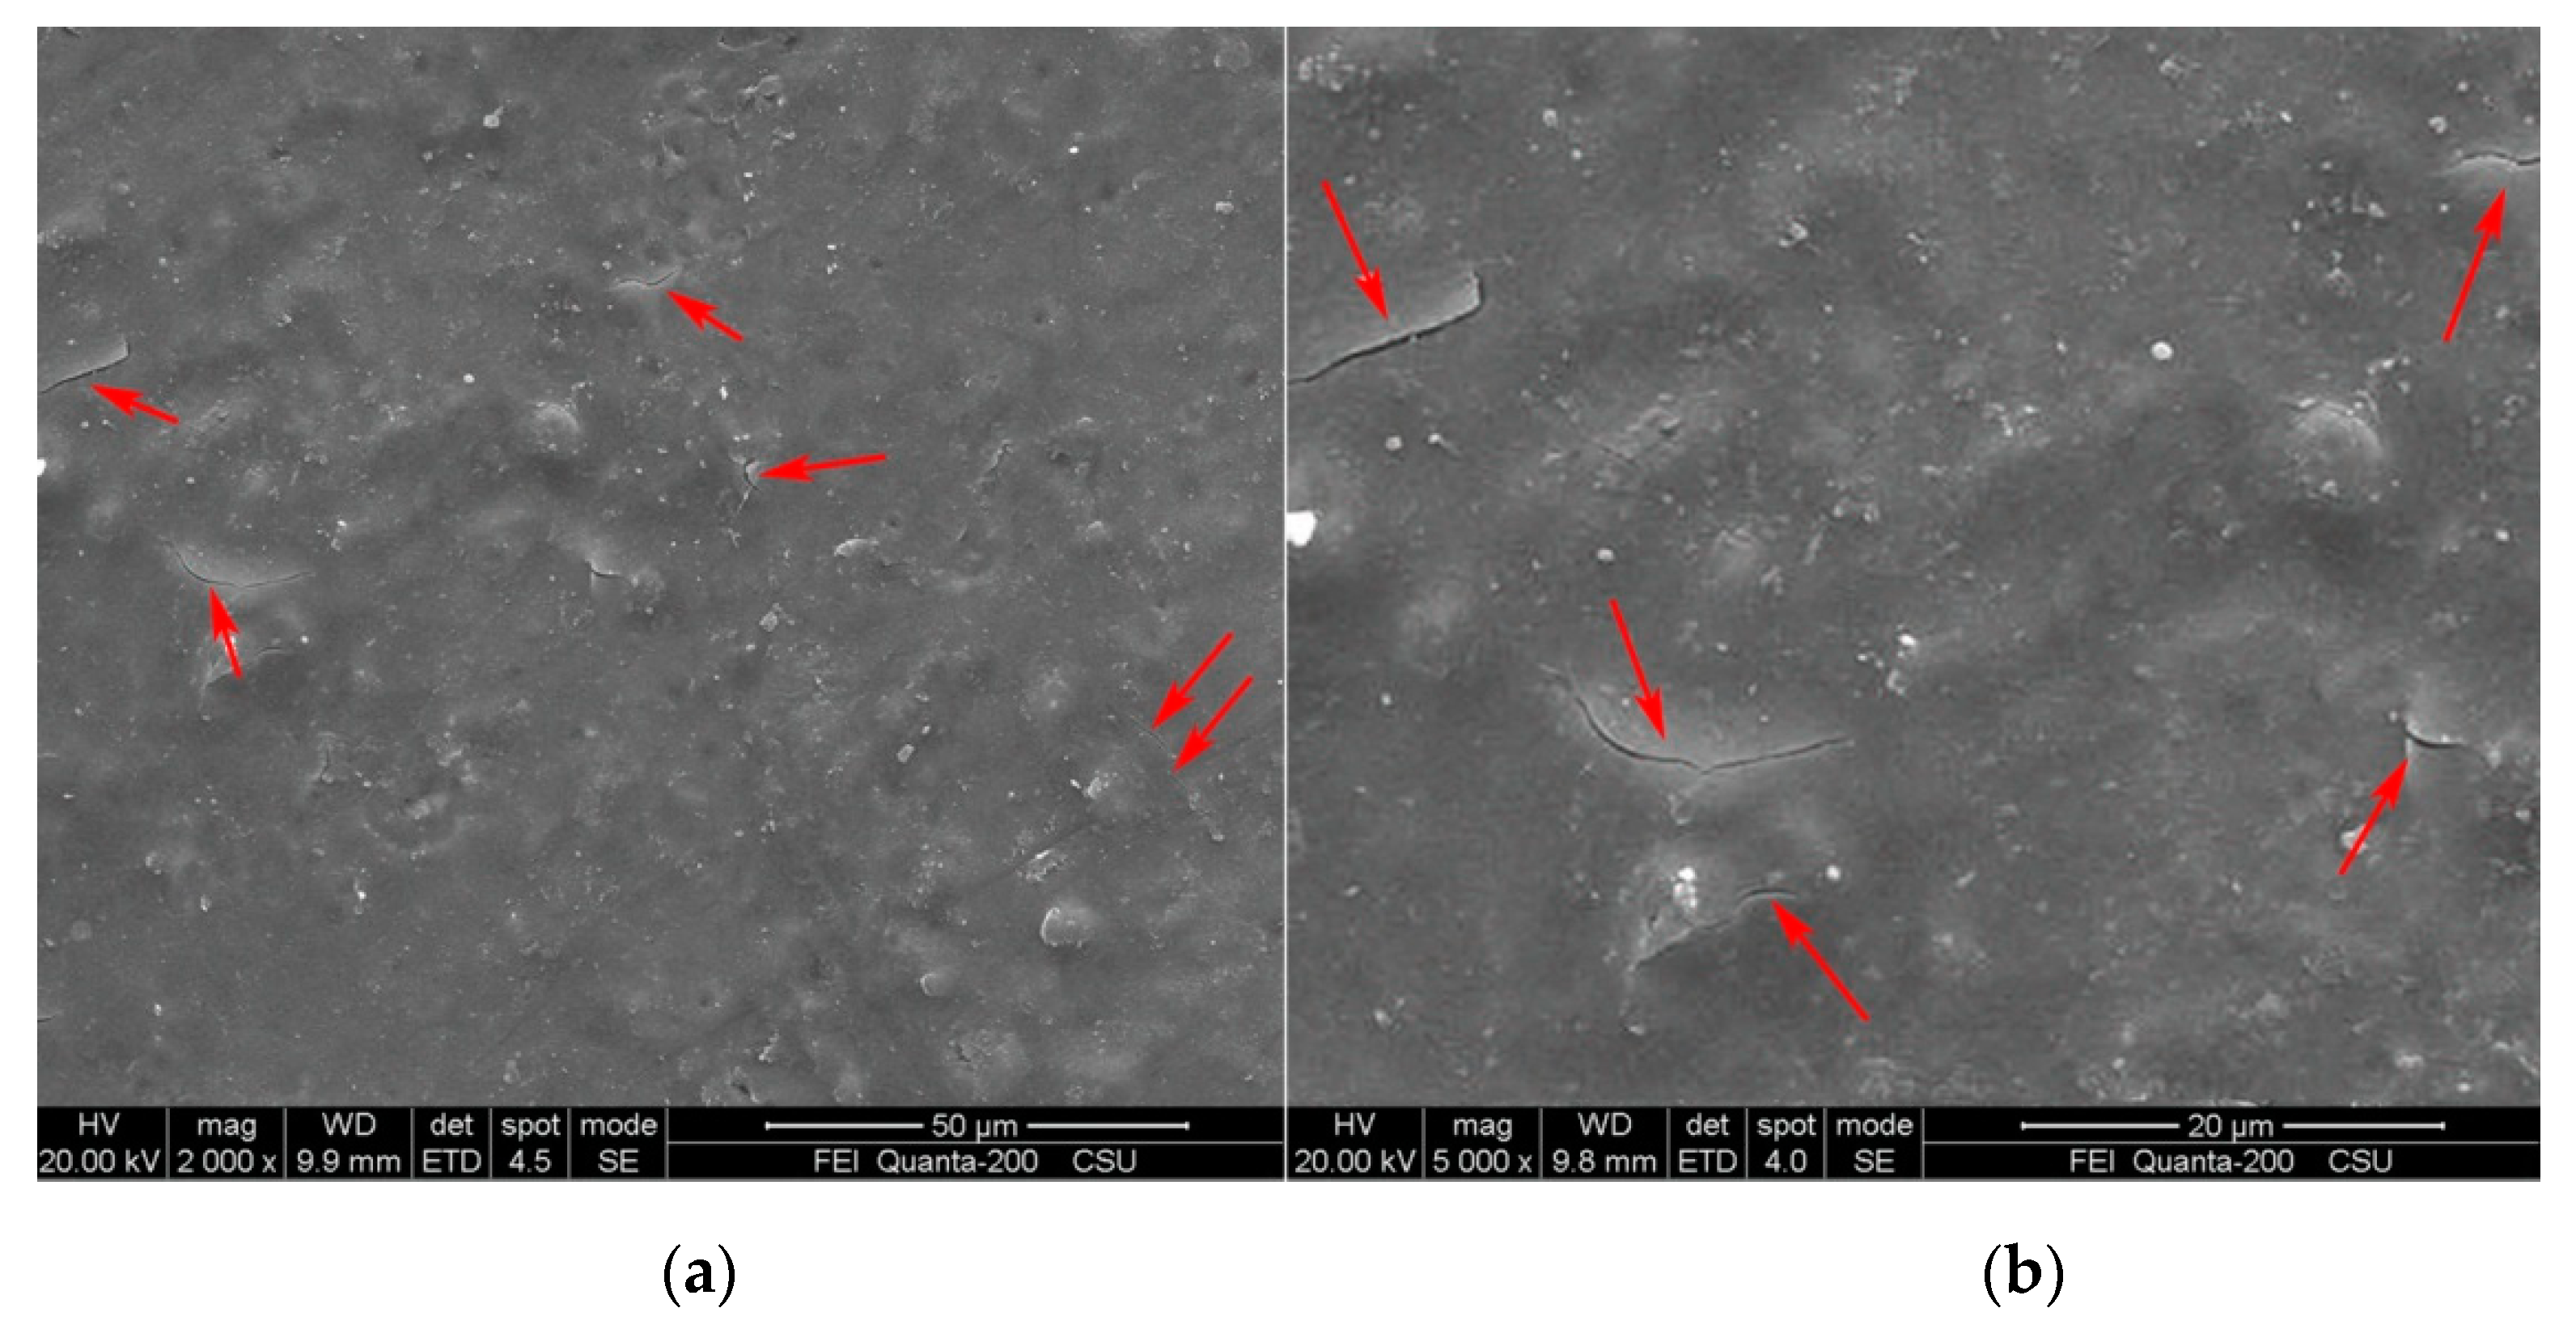
3.4. Corrosion Morphology

Figure 10 shows the morphologies of samples after immersion in a 3.5 wt.% NaCl solution for 576 h. For the PEO-coated sample, significant corrosion regions appeared on the surface and separation of the coating from the substrate occurred on the cross-sectional morphology as shown in Figure 10a,b. The reason was that the corrosive media entered the porous region at the substrate/coating interface through the defects of the outer layer during the immersion test, causing the porous outer layer of the PEO coating to become loose, and even separate from the substrate. However, for the PEO-S1- and PEO-S2-coated samples, almost no corrosion occurred on the PEO layer surface as shown in Figure 10c,e. In addition, Figure 10d,f clearly show that the underlying the PEO coating was still intact, indicating that the silane coating acted as a good physical barrier and delayed the corrosion process and greatly improved the corrosion resistance of the coating system.

4. Conclusions

Using the sol–gel technique, a PEO/silane composite coating was successfully prepared on UNS A97075 alloy. The electrochemical corrosion evolution of samples was studied using EIS. The following points were observed:
  • In the long-term immersion test, the corrosion evolution of the PEO/silane samples could be divided into three stages: (i) in the initial stage of immersion, the value of ng was close to one, the silane coating formed a capacitive equivalent circuit, and the corrosion rate was controlled by CPEg-T; (ii) in the second stage of immersion, the corrosive media penetrated to the PEO coating through the defects of the outer layer, and the charge transfer in the PEO coating became the main factor controlling the corrosion rate; and (iii) in the third stage of immersion, the value of ng was decreased to close 0, Rg and Rdiff increased rapidly, suggesting that the silane coating formed a resistor equivalent circuit and the corrosion products (e.g., Al(OH)2Cl, Al(OH)Cl2, AlCl3 et al.) diffused in the coating and controlled the corrosion process.
  • EIS was used to analyse the corrosion evolution of the PEO/silane composite coating on UNS A97075 alloy. The resistance of PEO-S1 remained at 106 Ω·cm2 and with small changes compared to that of PEO-S2, and the PEO film under the silane layer remained dense and continuous. It could be concluded that the thickness of the silane layer delayed the corrosion process, but the corrosion resistance mainly depended on the densification of the silane coating.

Author Contributions

Data curation, D.Z.; Formal analysis, D.Z.; Funding acquisition, Z.L.; Methodology, D.Z. and S.B.; Project administration, Z.L.; Software, D.Z., S.B., and J.Z.; Writing—original draft, D.Z.; Writing—review and editing, J.Z. All authors have read and agreed to the published version of the manuscript.

Funding

The authors are grateful for financial support from the National Key Research and Development Program of China (2016YFB0300900), the National Key Fundamental Research Project of China (2012CB619506–3), Project 18B421 supported by the Scientific Research Fund Education Department of Hunan Province, China.

Institutional Review Board Statement

Not applicable.

Informed Consent Statement

Not applicable.

Data Availability Statement

All date in this work are available on request by contact with the corresponding author.

Conflicts of Interest

The authors declare no conflict of interest.

References

  1. Wernick, S.; Pinner, R.; Sheasby, P.G. The Surface Treatment and Finishing of Aluminum and Its Adlloys, 5th ed.; Finishing Publications Ltd: Warrington, UK, 1987. [Google Scholar]
  2. Henley, V.F. Anodic Oxidation of Aluminium & Its Alloys; Pergamon Press: Oxford, UK, 1982. [Google Scholar]
  3. Yerokhin, A.; Nie, X.; Leyland, A.; Matthews, A.; Dowey, S. Plasma electrolysis for surface engineering. Surf. Coat. Technol. 1999, 122, 73–93. [Google Scholar] [CrossRef]
  4. Javidi, M.; Fadaee, H. Plasma electrolytic oxidation of 2024-T3 aluminum alloy and investigation on microstructure and wear behavior. Appl. Surf. Sci. 2013, 286, 212–219. [Google Scholar] [CrossRef]
  5. Arrabal, R.; Mohedano, M.; Matykina, E.; Pardo, A.; Mingo, B.; Merino, M. Characterization and wear behaviour of PEO coatings on 6082-T6 aluminium alloy with incorporated α-Al2O3 particles. Surf. Coat. Technol. 2015, 269, 64–73. [Google Scholar] [CrossRef]
  6. Chen, M.-A.; Ou, Y.-C.; Fu, Y.-H.; Li, Z.-H.; Li, J.-M.; Liu, S.-D. Effect of friction stirred Al-Fe-Si particles in 6061 aluminum alloy on structure and corrosion performance of MAO coating. Surf. Coat. Technol. 2016, 304, 85–97. [Google Scholar] [CrossRef]
  7. Dehnavi, V.; Shoesmith, D.W.; Luan, B.L.; Yari, M.; Liu, X.Y.; Rohani, S. Corrosion properties of plasma electrolytic oxidation coatings on an aluminium alloy—The effect of the PEO process stage. Mater. Chem. Phys. 2015, 161, 49–58. [Google Scholar] [CrossRef]
  8. Fadaee, H.; Javidi, M. Investigation on the corrosion behaviour and microstructure of 2024-T3 Al alloy treated via plasma electrolytic oxidation. J. Alloy Compd. 2014, 604, 36–42. [Google Scholar] [CrossRef]
  9. Liu, C.; He, D.; Yan, Q.; Huang, Z.; Liu, P.; Li, D.; Jiang, G.; Ma, H.; Nash, P.; Shen, D. An investigation of the coating/substrate interface of plasma electrolytic oxidation coated aluminum. Surf. Coat. Technol. 2015, 280, 86–91. [Google Scholar] [CrossRef]
  10. Hussein, R.; Nie, X.; Northwood, D. Production of high quality coatings on light alloys using plasma electrolytic oxidation (PEO). WIT Trans. Built Environ. 2016, 166, 439–454. [Google Scholar]
  11. Zhu, L.; Guo, Z.; Zhang, Y.; Li, Z.; Sui, M. A mechanism for the growth of a plasma electrolytic oxide coating on Al. Electrochim. Acta 2016, 208, 296–303. [Google Scholar] [CrossRef]
  12. Hu, N.; Dong, X.; He, X. Effect of sealing on the morphology of anodized aluminum oxide. Corros. Sci. 2015, 97, 17–24. [Google Scholar] [CrossRef] [Green Version]
  13. Shulman, G.P.; Bauman, A.J. Organic acid sealants for anodized aluminum-a new method for corrosion protection. Met. Finish. 1995, 93, 16–19. [Google Scholar] [CrossRef]
  14. Shahzad, M.; Chaussumier, M.; Chieragatti, R.; Mabru, C.; Rezai-Aria, F. Effect of sealed anodic film on fatigue performance of 2214-T6 aluminum alloy. Surf. Coat. Technol. 2012, 206, 2733–2739. [Google Scholar] [CrossRef] [Green Version]
  15. Shang, W.; Chen, B.; Shi, X.; Chen, Y.; Xiao, X. Electrochemical corrosion behavior of composite MAO/sol–gel coatings on magnesium alloy AZ91D using combined micro-arc oxidation and sol–gel technique. J. Alloy Compd. 2009, 474, 541–545. [Google Scholar] [CrossRef]
  16. Van Phuong, N.; Fazal, B.R.; Moon, S. Cerium- and phosphate-based sealing treatments of PEO coated AZ31 Mg alloy. Surf. Coat. Technol. 2017, 309, 86–95. [Google Scholar] [CrossRef]
  17. Yu, X.W.; Yan, C.W.; Cao, C.N. Study on the rare earth sealing procedure of the porous film of anodized 2024 aluminum alloy. Mater. Sci. Technol. 2003, 19, 51–53. [Google Scholar]
  18. Wang, S.X.; Zhao, Q.; Du, N.; Shao, Z.S.; Shu, W.F.; Chen, Q.L. Sealing effect of cerium salt on boric-sulfuric acid anodic film of aluminum alloy. Chin. J. Nonferrous Met. 2012, 22, 1132–1141. [Google Scholar]
  19. Vuori, L.; Ali-Löytty, H.; Lahtonen, K.; Hannula, M.; Lehtonen, E.; Niu, Y.; Valden, M. Improved corrosion properties of hot dip galvanized steel by nanomolecular silane layers as hybrid interface between zinc and top coatings. Corrosion 2017, 73, 169–180. [Google Scholar] [CrossRef]
  20. Zaferani, S.H.; Peikari, M.; Zaarei, D.; Danaee, I.; Fakhraei, J.M.; Mohammadi, M. Using silane films to produce an alternative for chromate conversion coatings. Corrosion 2013, 69, 372–387. [Google Scholar] [CrossRef]
  21. Wojciechowski, J.; Szubert, K.; Peipmann, R. Anti-corrosive properties of silane coatings deposited on anodised aluminium. Electrochim. Acta 2016, 220, 1–10. [Google Scholar] [CrossRef]
  22. Whelan, M.; Cassidy, J.; Duffy, B. Sol–gel sealing characteristics for corrosion resistance of anodised aluminium. Surf. Coat. Technol. 2013, 235, 86–96. [Google Scholar] [CrossRef]
  23. Zeng, D.; Liu, Z.; Bai, S.; Wang, J. Influence of sealing treatment on the corrosion resistance of PEO coated Al-Zn-Mg-Cu alloy in various environments. Coatings 2019, 9, 867. [Google Scholar] [CrossRef] [Green Version]
  24. Guo, X.; Du, K.; Guo, Q.; Ge, H.; Wang, Y.; Wang, R.; Wang, F. Water uptake of as andwich-structured composite film coated on a Mg-Gd-Y alloy: Experimentsand model validation. J. Electrochem. Soc. 2014, 161, 188–194. [Google Scholar] [CrossRef]
  25. Zeng, D.; Liu, Z.; Bai, S.; Zhao, J.; Wang, J. Corrosion resistance of bis-silane-modified epoxy coatings on an Al-Zn-Mg-Cu alloy. J. Mater. Eng. Perform. 2020, 29, 5282–5290. [Google Scholar] [CrossRef]
  26. Wen, L.; Wang, Y.M.; Zhou, Y.; Ouyang, J.H.; Guo, L.; Jia, D. Corrosion evaluation of microarc oxidation coatings formed on 2024 aluminum alloy. Corros. Sci. 2010, 52, 2687–2696. [Google Scholar] [CrossRef]
  27. Gnedenkov, S.V.; Sinebryukhov, S.L.; Egorkin, V.S. Wettability and electrochemical properties of the highly hydrophobic coatings on PEO-pretreated aluminum alloy. Surf. Coat. Technol. 2016, 307, 1241–1248. [Google Scholar] [CrossRef]
  28. Barik, R.C.; Wharton, J.A.; Wood, R.J.K.; Stokes, K.R.; Jones, R.L. Corrosion, erosion and erosion–corrosion performance of plasma electrolytic oxidation (PEO) deposited Al2O3 coatings. Surf. Coat. Technol. 2005, 199, 158–167. [Google Scholar] [CrossRef]
  29. ChruscielJerzy, J.J.; Lesniak, E. Modification of epoxy resins with functional silanes, polysiloxanes, silsesquioxanes, silica and silicates. Prog. Polym. Sci. 2015, 41, 67–121. [Google Scholar] [CrossRef]
  30. Williams, K.G.; Gido, S.P.; Coughlin, E.B. Polymers and Copolymers Containing Covalently Bonded Polyhedral Oligomeric Silsesquioxanes Moieties. In Applications of Polyhedral Oligomeric Silsesquioxanes; Springer Netherlands: Dordrecht, The Netherlands, 2011. [Google Scholar]
  31. Vejar, N.D.; Azocar, M.I.; Tamayo, L.A.; Gonzalez, E.; Pavez, J.; Gulppi, M.; Zagal, J.H.; Zhou, X.; Santibanez, F.; Thompson, G.E.; et al. Anti biofouling properties of sol-gel type polymers for aluminium alloys: Biocorrosion protection against pseudomonas aeruginosa. Int. J. Electrochem. Sci. 2013, 8, 12062–12077. [Google Scholar]
  32. Hu, J.M.; Liu, L.; Zhang, J.Q.; Cao, C.N. Electro deposition of silane films on aluminum alloys for corrosion protection. Prog. Org. Coat. 2007, 58, 265–271. [Google Scholar] [CrossRef]
  33. Jothi, K.J.; Palanivelu, K. Synergistic effect of silane modified nano-composites for active corrosion protection. Ceram. Int. 2013, 39, 7619–7625. [Google Scholar] [CrossRef]
  34. Rubio, F.; Rubio, J.; Oteo, L. A FT-IR study of the hydrolysis of tetraethylorthosilicate (TEOS). Spectrosc. Lett. 1998, 31, 199–219. [Google Scholar] [CrossRef]
  35. Pena-Alonso, R.; Rubio, F.; Rubio, J.; Oteo, J.L. Study of the hydrolysis and condensation of γ-Aminopropyltriethoxysilane by FT-IR spectroscopy. J. Mater. Sci. 2006, 42, 595–603. [Google Scholar] [CrossRef]
  36. Jiang, H.; Zheng, Z.; Wang, X. Kinetic study of methyltriethoxysilane (MTES) hydrolysis by FTIR spectroscopy under different temperatures and solvents. Vib. Spectrosc. 2008, 46, 1–7. [Google Scholar] [CrossRef]
  37. Zhang, J.-T.; Hu, J.-M.; Zhang, J.-Q.; Cao, C.-N. Studies of water transport behavior and impedance models of epoxy-coated metals in NaCl solution by EIS. Prog. Org. Coat. 2004, 51, 145–151. [Google Scholar] [CrossRef]
  38. Zhao, L.; Liu, Q.; Gao, R.; Wang, J.; Yang, W.; Liu, L. One-step method for the fabrication of superhydrophobic surface on magnesium alloy and its corrosion protection, antifouling performance. Corros. Sci. 2014, 80, 177–183. [Google Scholar] [CrossRef]
  39. Liu, Q.; Kang, Z.X. One-step electrodeposition process to fabricate superhydrophobic surface with improved anticorrosion property on magnesium alloy. Mater. Lett. 2014, 137, 210–213. [Google Scholar] [CrossRef]
  40. Han, M.; Go, S.; Ahn, Y. Fabrication of super-hydrophobic surface on magnesium substrate by chemical etching. Bull. Korean Chem. Soc. 2012, 33, 1363–1366. [Google Scholar] [CrossRef] [Green Version]
  41. Hu, J.M.; Zhang, J.Q.; Cao, C.N. Determination of water uptake and diffusion of Cl− ion in epoxy primer on aluminum alloys in NaCl solution by electrochemical impedance spectroscopy. Prog. Org. Coat. 2003, 46, 273–279. [Google Scholar] [CrossRef]
  42. Zhang, J.T.; Hu, J.M.; Zhang, J.Q.; Cao, C.N. Studies of impedance models and water transport behaviors of polypropylene coated metals in NaCl solution. Prog. Org. Coat. 2004, 49, 293–301. [Google Scholar] [CrossRef]
  43. Shen, D.; He, D.; Liu, F.; Guo, C.; Cai, J.; Li, G.; Ma, H. Effects of ultrasound on the evolution of plasma electrolytic oxidation process on 6061Al alloy. Ultrasonics 2014, 54, 1065–1070. [Google Scholar] [CrossRef]
Figure 1. Voltage–time response of the PEO process.
Coatings 11 00549 g001
Figure 2. SEM morphology of PEO coating: Surface morphology (a) at 4 min PEO time; (c) at 15 min PEO time; cross section morphology (b) at 4 min PEO time; (d) at 15 min PEO time.
Coatings 11 00549 g002
Figure 3. SEM morphology of silane sealed PEO coating: Surface (a) and cross-section (c) morphology of PEO-S1; Surface (b) and cross-section (d) of PEO-S2.
Coatings 11 00549 g003
Scheme 1. Hydrolysis-polycondensation reactions.
Coatings 11 00549 sch001
Figure 4. FT-IR spectra of the PEO-S2 sample.
Coatings 11 00549 g004
Figure 5. Potentiodynamic polarization curves in a 3.5 wt.% NaCl solution.
Coatings 11 00549 g005
Figure 6. Nyquist and Bode plots for the coatings on UNS A97075 alloy immersed in a 3.5 wt.% NaCl solution: (ac) PEO coating; (df) PEO-S1 coating; and (gi) PEO-S2.
Coatings 11 00549 g006
Figure 7. Proposed equivalent circuits.
Coatings 11 00549 g007
Figure 8. Surface morphology of PEO-S2 after immersion time of 24 h in a 3.5 wt.% NaCl solution. (a) magnification with 50 µm; (b) magnification with 20 µm;
Coatings 11 00549 g008
Figure 9. The fitted results of EIS data simulations for multiple PEO/Silane coated samples. (a) Rp and Rb (b). Rg and Rdiff.
Coatings 11 00549 g009
Figure 10. Surface and cross section morphology of samples after immersion in 3.5 wt.% NaCl solution for 576 h: (ac) PEO coating; (df) PEO-S1 coating; (gi) PEO-S2 coating; (e,h) removed the silane coating.
Coatings 11 00549 g010
Table 1. The fitted results of the Tafel curves.
SamplesEcorr, (Vvs SCE)Standard Deviationicorr (A/cm2)Standard Deviation
Bare−0.800.0181.02 × 10−60.012 × 10⁻⁶
PEO
PEO-S1
−0.75
−0.73
0.012
0.014
1.08 × 10⁻⁸
2.24 × 10⁻⁹
0.06 × 10⁻⁶
0.08 × 10⁻⁶
PEO-S2−0.710.0163.48 × 10−110.04 × 10⁻⁶
Table 2. The fitted results of EIS data simulations for PEO-coated samples in a 3.5 wt.% NaCl solution.
PEO24 h48 h96 h144 h288 h576 h
Rp(Ω·cm2)33331067441501.32×103
CPEp-T (F·cm−2)6.6 × 10−75.72 × 1081.84 × 1084.42 × 1084.21 × 1061.34 × 105
np0.850.990.980.990.920.82
Rb(Ω·cm2)8.63 × 1047.16 × 1046.62 × 1046.84 × 1046.56 × 1045.10 × 104
CPEb-T(F·cm−2)1.10 × 1068.21 × 1068.64 × 1056.11 × 1066.12 × 1051.03 × 105
nb0.460.680.730.810.950.98
χ2 (Chi-squared)0.0020.00060.0030.0020.0010.0004
Table 3. The fitted results of EIS data simulations for PEO-silane-coated sample in a 3.5 wt.% NaCl solution.
PEO-S224 h48 h96 h144 h288 h480 h576 h
Rg (Ω·cm2)42302928322139072.09 × 1062.11 × 1066.82 × 105
CPEg-T (F·cm−2)3.21 × 10−121.87 × 10−104.23 × 10−91.84 × 10−93.63 × 10−95.69 × 10−92.58 × 10⁻¹⁰
Rp (Ω·cm2)6.36 × 1044.36 × 1041.12 × 1052.84 × 1069.12 × 1051.36 × 1069.68 × 105
CPEp-T (F·cm−2)3.26 × 10−73.12 × 10−61.14 × 10−77.42 × 10−77.61 × 10−73.31 × 10−57.84 × 10⁻⁷
Rb (Ω·cm2)6.41 × 1045.86 × 1042.38 × 1061.73 × 1061.16 × 1061.12 × 1069.76 × 105
CPEb-T (F·cm−2)3.52 × 10−73.84 × 10−61.64 × 10−62.1 × 10−69.32 × 10−68.78 × 10−66.97 × 10⁻⁷
Rdiff (Ω·cm2)5.41 × 1045.16 × 1041.81 × 1041.91 × 1051.56 × 1061.73 × 1061.82 × 106
CPEdiff-T (F·cm−2)7.41 × 10−52.41 × 10−79.01 × 10−72.82 × 10−67.39 × 10−76.49 × 10−79.82 × 10⁻⁶
χ2 (Chi-squared)0.0030.0020.00040.0050.00070.00080.003
PEO-S124 h48 h96 h144 h288 h480 h576 h
Rg (Ω·cm2)6374323626574513436013172158
CPEg -T (F·cm−2)3.98 × 10−124.58 × 10−123.81 × 10−127.70 × 10−121.08 × 10−129.78 × 10−128.51 × 10⁻¹²
Rp (Ω·cm2)1.36 × 1051.22 × 1051.16 × 1051.49 × 1054.97 × 1056.41 × 1064.92 × 105
CPEp-T (F·cm−2)4.32 × 10−43.69 × 10−61.3 × 10−45.18 × 10−81.78 × 10−61.75 × 10−51.76 × 10⁻⁶
Rb (Ω·cm2)5.74 × 1042.04 × 1054.88 × 1051.35 × 1051.04 × 1054.85 × 1058.89 × 105
CPEb-T (F·cm−2)4.04 × 10−88.24 × 10−65.66 × 10−61.03 × 10−65.52 × 10−61.62 × 10−62.34 × 10⁻⁶
Rdiff (Ω·cm2)4.57 × 1053.67 × 1046.45 × 1058.26 × 1041.11 × 1054.81 × 1058.84 × 105
CPEdiff-T (F·cm−2)7.68 × 10−73.78 × 10−77.66 × 10−78.76 × 10−75.68 × 10−62.06 × 10−61.73 × 10⁻⁶
χ2 (Chi-squared)0.0010.0030.00060.0040.0020.0040.0007
Publisher’s Note: MDPI stays neutral with regard to jurisdictional claims in published maps and institutional affiliations.

