Abstract
The corrosion behaviors of TA2 titanium were investigated by in situ electrochemical measurements in a solution of 2.3 ppm Li+ and 1500 ppm B3+ at a temperature of up to 300 °C. The morphology, phase structure, and composition of the oxide film, after 800 h exposure time in a solution at 300 °C and 14 MPa, were characterized by scanning electron microscopy (SEM), Raman spectroscopy, X-ray photoelectron spectroscopy (XPS), etc. The growth mechanism of the oxide film based on the activation energy was discussed. The potentiodynamic polarization and electrochemical impedance spectroscopy analyses showed that the corrosion resistance of titanium significantly weakened when increasing the solution temperature from 30 to 300 °C, but it increased in the initial stage of holding time (0–66 h) at 300 °C, then gradually decreased (66–378 h), and reached a stable state after 378 h. The oxide film, which was about 5 μm thick, consisted of anatase phase and a small amount of B2O3. The growth mechanism is a combination of layer by layer and island growth.
1. Introduction
The corrosion behaviors of materials under high-temperature and -pressure water environments have attracted much attention in the nuclear power or petrochemical industry. At present, stainless steel, nickel alloy, zirconium alloy, and others have been applied in challenging environments for their excellent properties [1,2,3,4]. Furthermore, some localized corrosions of these alloys, such as pitting corrosion, intergranular corrosion, and stress corrosion cracking, have a significant influence on their service life and safety [5,6].
Titanium and its alloys have low density, high specific strength, and good crack resistance, which have been widely applied [7,8,9]. They have excellent corrosion resistance at ambient temperatures in sodium chloride or other mediums due to their good passivating and repassivating ability. In recent years, some papers have been published about the corrosion properties of titanium alloy in high-temperature and high-pressure aqueous solution environments, such as sulfuric acid solution with Cl−, supercritical water, or alkaline solution, by gravimetric or electrochemical tests [10,11,12,13]. Hu [14] and Gurrappa [15] found that the oxide film on titanium alloy has good resistance against hydrogen permeation and the pitting corrosion property. Titanium and its alloys show potential for the nuclear power industry.
It is generally recognized that the properties of the oxide film on the metal surface are strongly related to the corrosion resistance of the metal under high-temperature environments [16,17,18]. Thus, it is important to explore the growth of oxide film and corrosion mechanisms in high-temperature and -pressure water environments. In recent years, many researchers have investigated the electrochemical characteristics of the alloys in high- temperature water by in situ electrochemical measurement techniques, with the advantages of a non-destructive approach and high sensitivity [19,20,21,22]. However, few of them concerned the effect of immersion time on the electrochemical character of titanium, especially in the lithium borate solution. The in situ electrochemical process is an effective method to evaluate the corrosion process of alloys and the effect of oxide film in real-time.
In this work, the in situ electrochemical properties of TA2 pure titanium at different temperatures and at 800 h exposure time at 300 °C and 14 MPa in the 2.3 ppm Li+ and 1500 ppm B3+ solution were investigated. The morphology and structure of the oxide film after 800 h exposure time were analyzed. Meanwhile, the growth mechanism of the oxide film and its effect on corrosion properties were discussed.
2. Materials and Methods
The column sample dimension of TA2 pure titanium was Φ 6.35 × 37 mm. It was polished by emery paper and ultrasonically cleaned in acetone and deionized water successively. The corrosion tests were conducted in an autoclave (CORTEST AC200) (CORTEST, Willoughby, OH, USA) with 2.3 ppm Li+ as LiOH and 1500 ppm B3+ as H3BO3 solution. A Wilhelm cell device was designed as an external reference electrode. The aqueous solution was deaerated by continuously bubbling with nitrogen gas (99.99%) for 60 min before heating and electrochemical testing. The solution temperature and pressure increased gradually up to 300 °C and 14 MPa, and then this temperature and pressure were maintained until 800 h. An additional TA2 plate was hung in the autoclave for analyzing the character of the oxide film of TA2.
The potentiodynamic polarization and electrochemical impedance spectroscopy (EIS) of titanium at different temperatures and exposure times in a 2.3 ppm Li+ and 1500 ppm B3+ solution were evaluated using an electrochemical workstation (PARSTAT 2273) (Princeton Applied Research, Princeton, NJ, USA) with a three-electrode cell autoclave. A TA2 titanium column was used as a working electrode, the Ag/AgCl Wilhelm cell was used as a reference electrode (0.1 M KCl), and the platinum column of Φ 6.35 × 37 mm was used as a counter electrode. Three electrodes were inserted into a sealed Ni-based alloy autoclave as the three-electrode cell. The potentiodynamic polarization was tested with a scan rate of 1 mV/s, and electrochemical impedance spectroscopy was measured in the frequency range of 1 MHz to 0.01 Hz.
The high temperature could affect the reference electrode, causing a thermal diffusion potential [23]. However, this can be solved by converting to a standard hydrogen electrode (SHE) based on the equation of the electrode potential as follows [23]:
where ESHE is the electrode potential vs. SHE, ΔEm is the measured potential of the working electrode referred to the Ag/AgCl external reference electrode, and B is the corresponding potential referred to the standard hydrogen electrode at the experimental temperature. ΔT = T − 25 °C; T is the experimental temperature. All potentials in this work corresponded to SHE.
ESHE = ΔEm + B
B = 0.2866 − 0.001ΔT + 1.745 × 10⁻⁷ΔT2 − 3.03 × 10⁻⁹ΔT3
B = 0.2866 − 0.001ΔT + 1.745 × 10⁻⁷ΔT2 − 3.03 × 10⁻⁹ΔT3
The surface and cross-sectional morphologies of the Ti sample after 800 h exposure time in a lithium borate solution at 300 °C and 14 MPa were observed by scanning electron microscopy (SEM, Hitachi S-4800) (Tokyo, Japan). The phase structure of oxide film was analyzed by X-ray diffractometry (XRD, Philips PW-1830) (Almelo, Netherlands) using Cu Kα irradiation and Raman spectroscopy (LabRAM Aramis) (HORIBA, Paris, France) at a wavelength of 532 nm. The composition profiles of the oxide film were characterized by glow discharge optical emission spectroscopy (GDOES) (GDA750, Spectruma Analytik GmbH, Bayern, Germany). Its chemical state was evaluated by X-ray photoelectron spectroscopy (XPS, VG ESCALABMKⅡ) (South Manchester, UK), where the binding energy was referenced to the C 1s peak at 284.8 eV.
3. Results
3.1. Potentiodynamic Polarization of TA2 Titanium at Different Temperatures
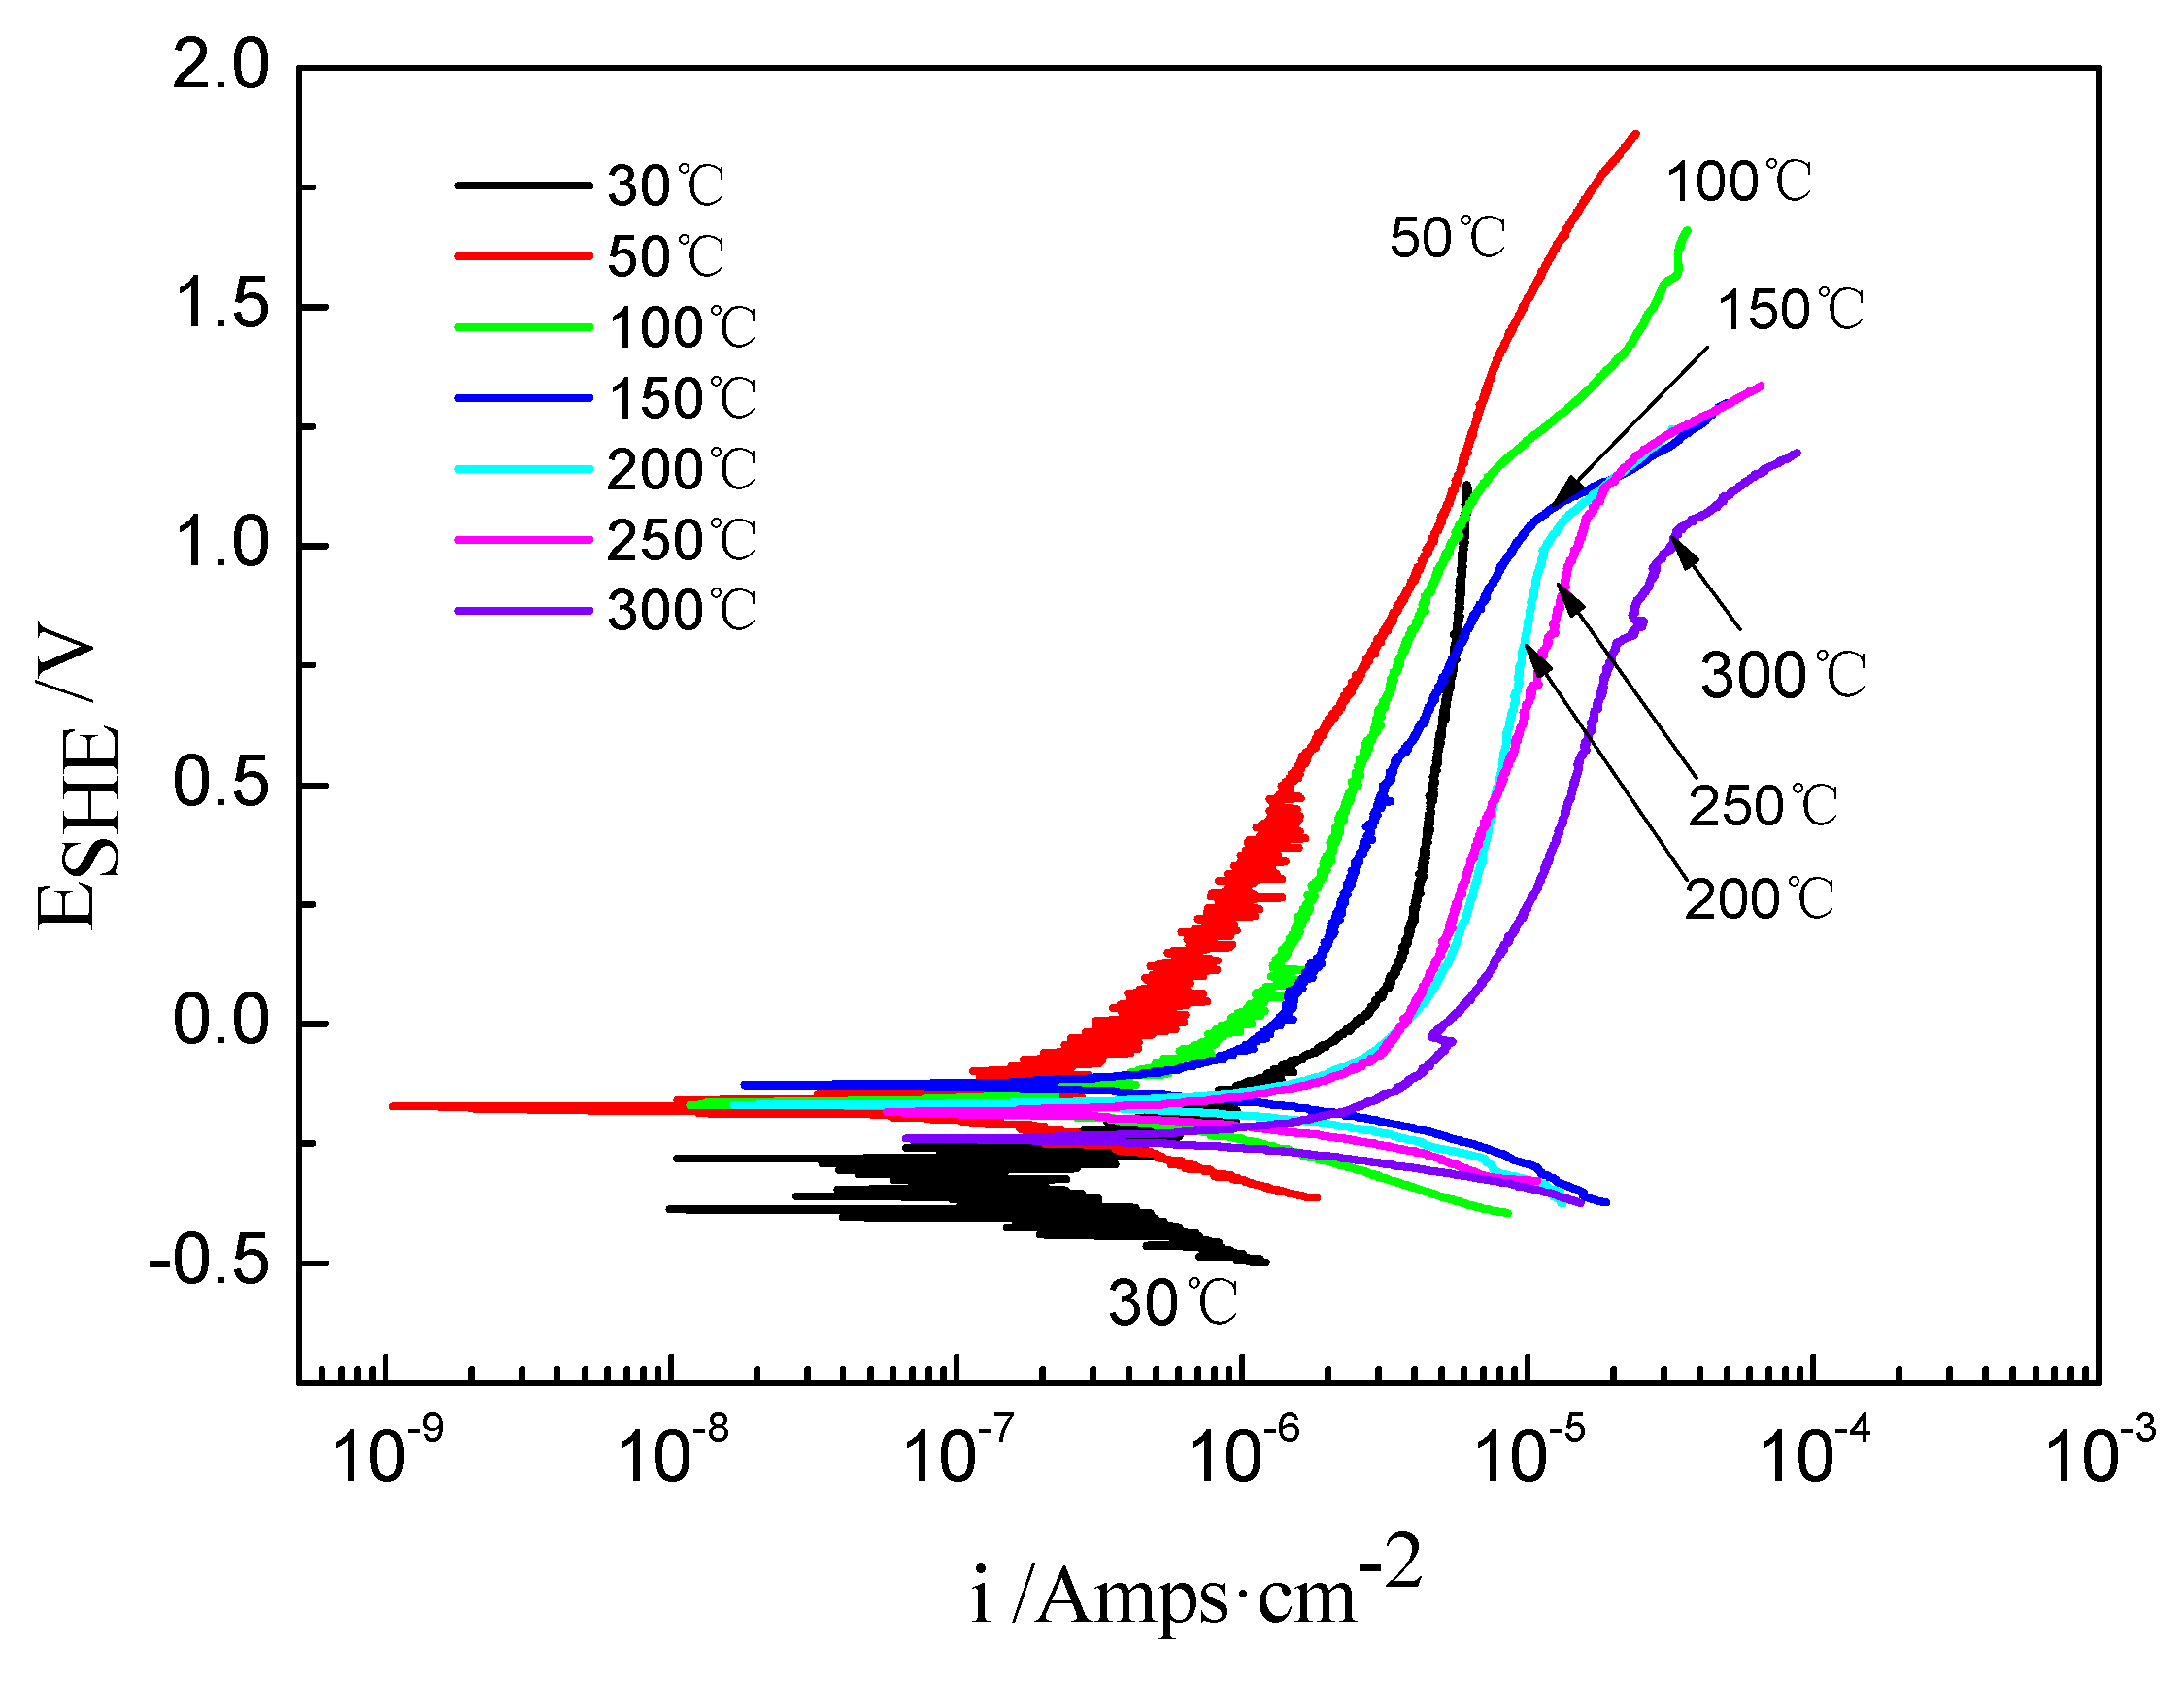
The potentiodynamic polarization curves of the TA2 sample at different temperatures in the 2.3 ppm Li+ and 1500 ppm B3+ solution are shown in Figure 1. Based on Tafel fitting, the average corrosion current density (icorr), corrosion potential (Ecorr), polarization resistance (Rp), and Tafel slopes of anodic and cathodic (Ba and Bc) are displayed in Table 1. It was found that the corrosion current density (icorr) was 1.57 × 10⁻⁷ A/cm2 at 30 °C, rapidly decreased to 3.24 × 10⁻⁶ A/cm2 at 200 °C, and then slightly increased to 3.66 × 10⁻⁶ A/cm2 at 300 °C. Meanwhile, the polarization resistance (Rp) decreased when increasing the temperature. Furthermore, the calibrated corrosion potential (Ecorr) increased when increasing the temperature from 30 to 150 °C, which is consistent with the change in the icorr. However, Ecorr gradually decreased when the solution temperature was above 150 °C.

Figure 1.
The potentiodynamic polarization curves of TA2 sample at different temperatures in 2.3 ppm Li+ and 1500 ppm B3+ solution.

Table 1.
Fitting results of potentiodynamic polarization curves for TA2 sample at different temperatures.
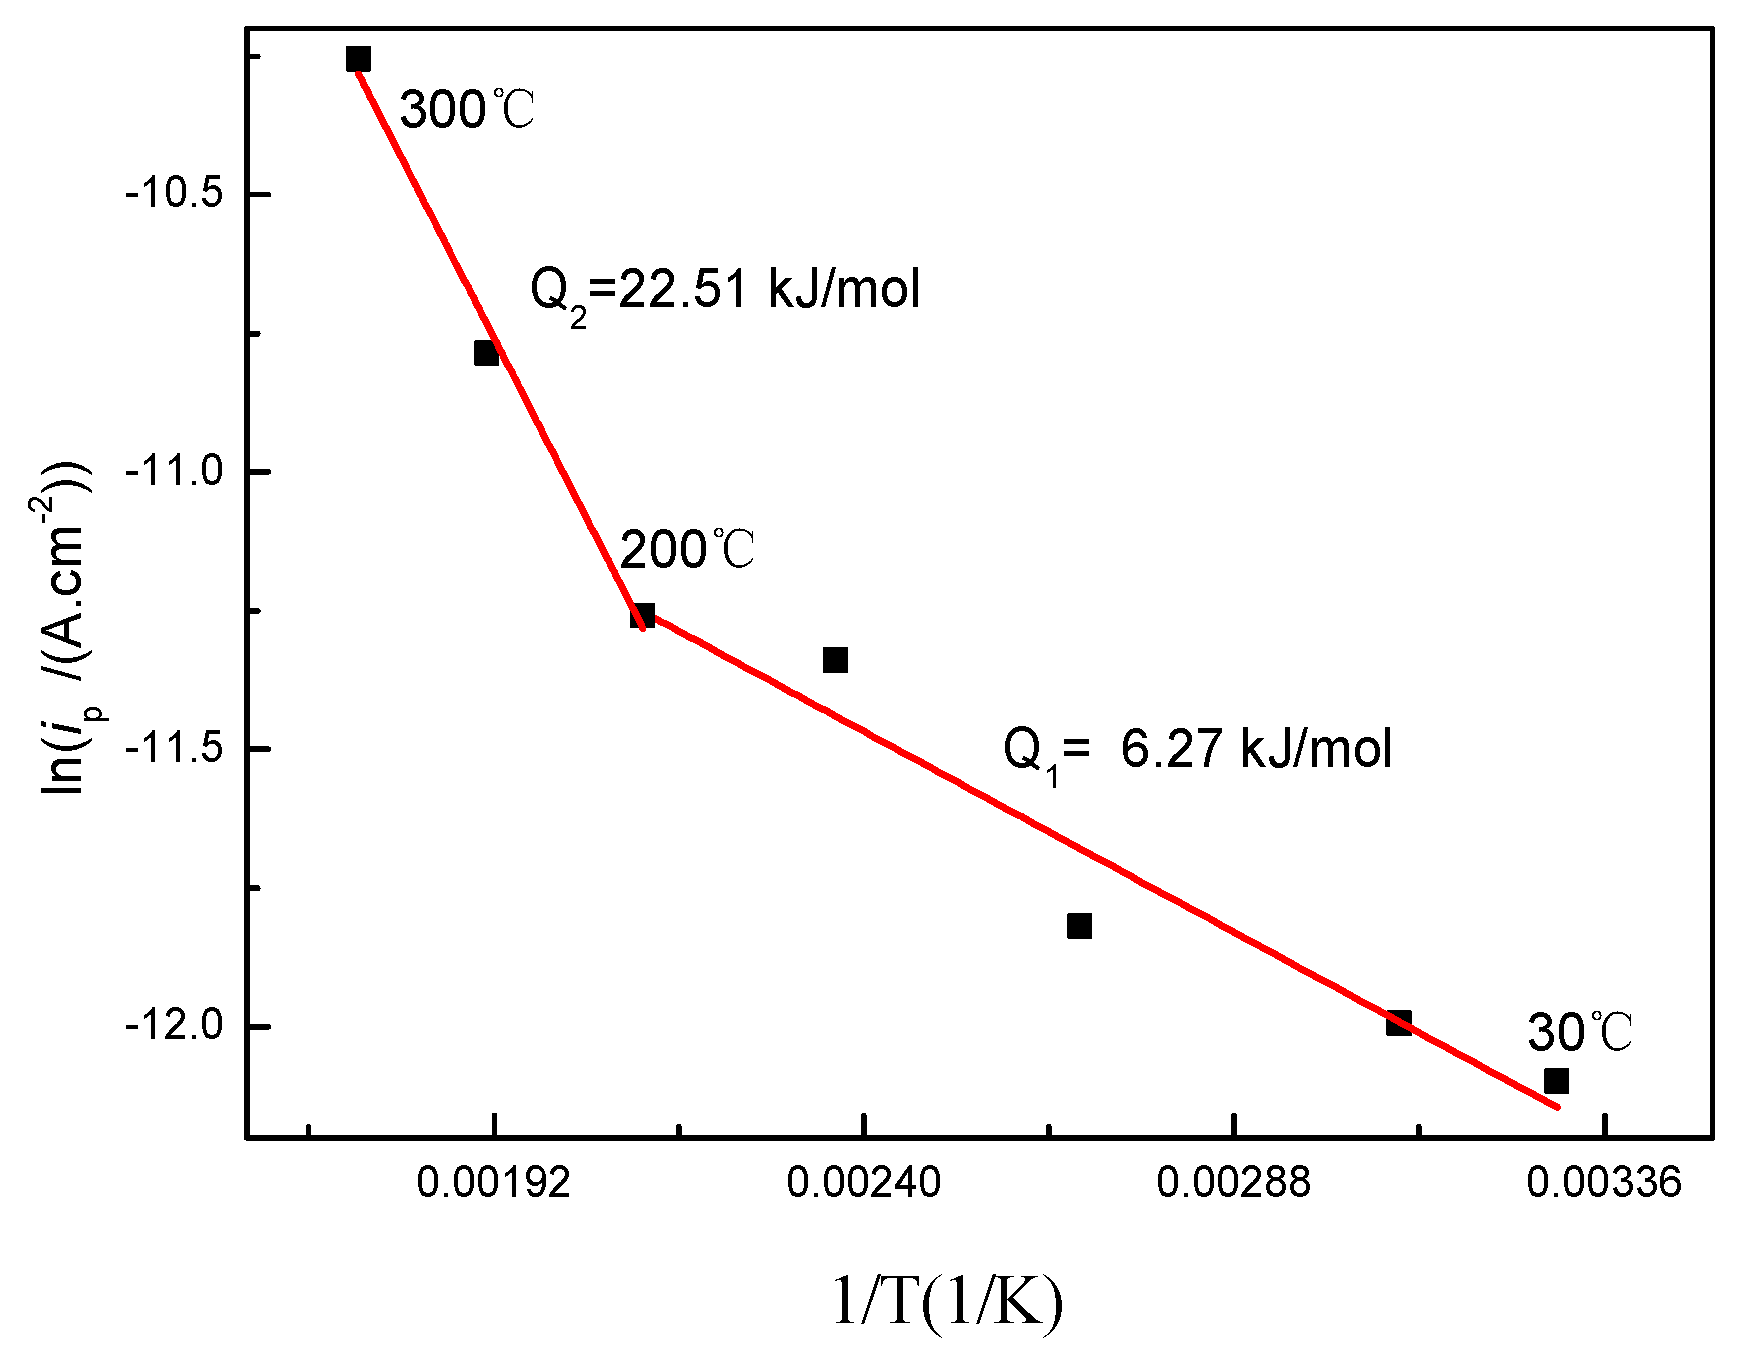
According to the Arrhenius equation of ip = Aexp(−Q/RT), the activation energy (Q) of the oxide film growth can be calculated [24], where A is the pre-exponential factor, ip is the passive current density, R is the molar gas constant (8.31 J/(mol·K)), and T is the temperature. Figure 2 shows the relation of lnip vs. 1/T on the basis of polarization curves at different solution temperatures. By fitting the data in Figure 2, the activation energy was 6.27 kJ/mol from 30 to 200 °C and 22.51 kJ/mol from 200 to 300 °C. The liquid phase diffusion of the activation energy generally was below a value of 41.84 kJ/mol [25]. Therefore, the oxidation of titanium is controlled by oxygen ion diffusion in the liquid phases rather than chemical reactions during the heating process.

Figure 2.
Arrhenius plot of the passive current density vs. temperature.
3.2. Electrochemical Impedance Spectroscopy of TA2 Titanium at Different Temperatures
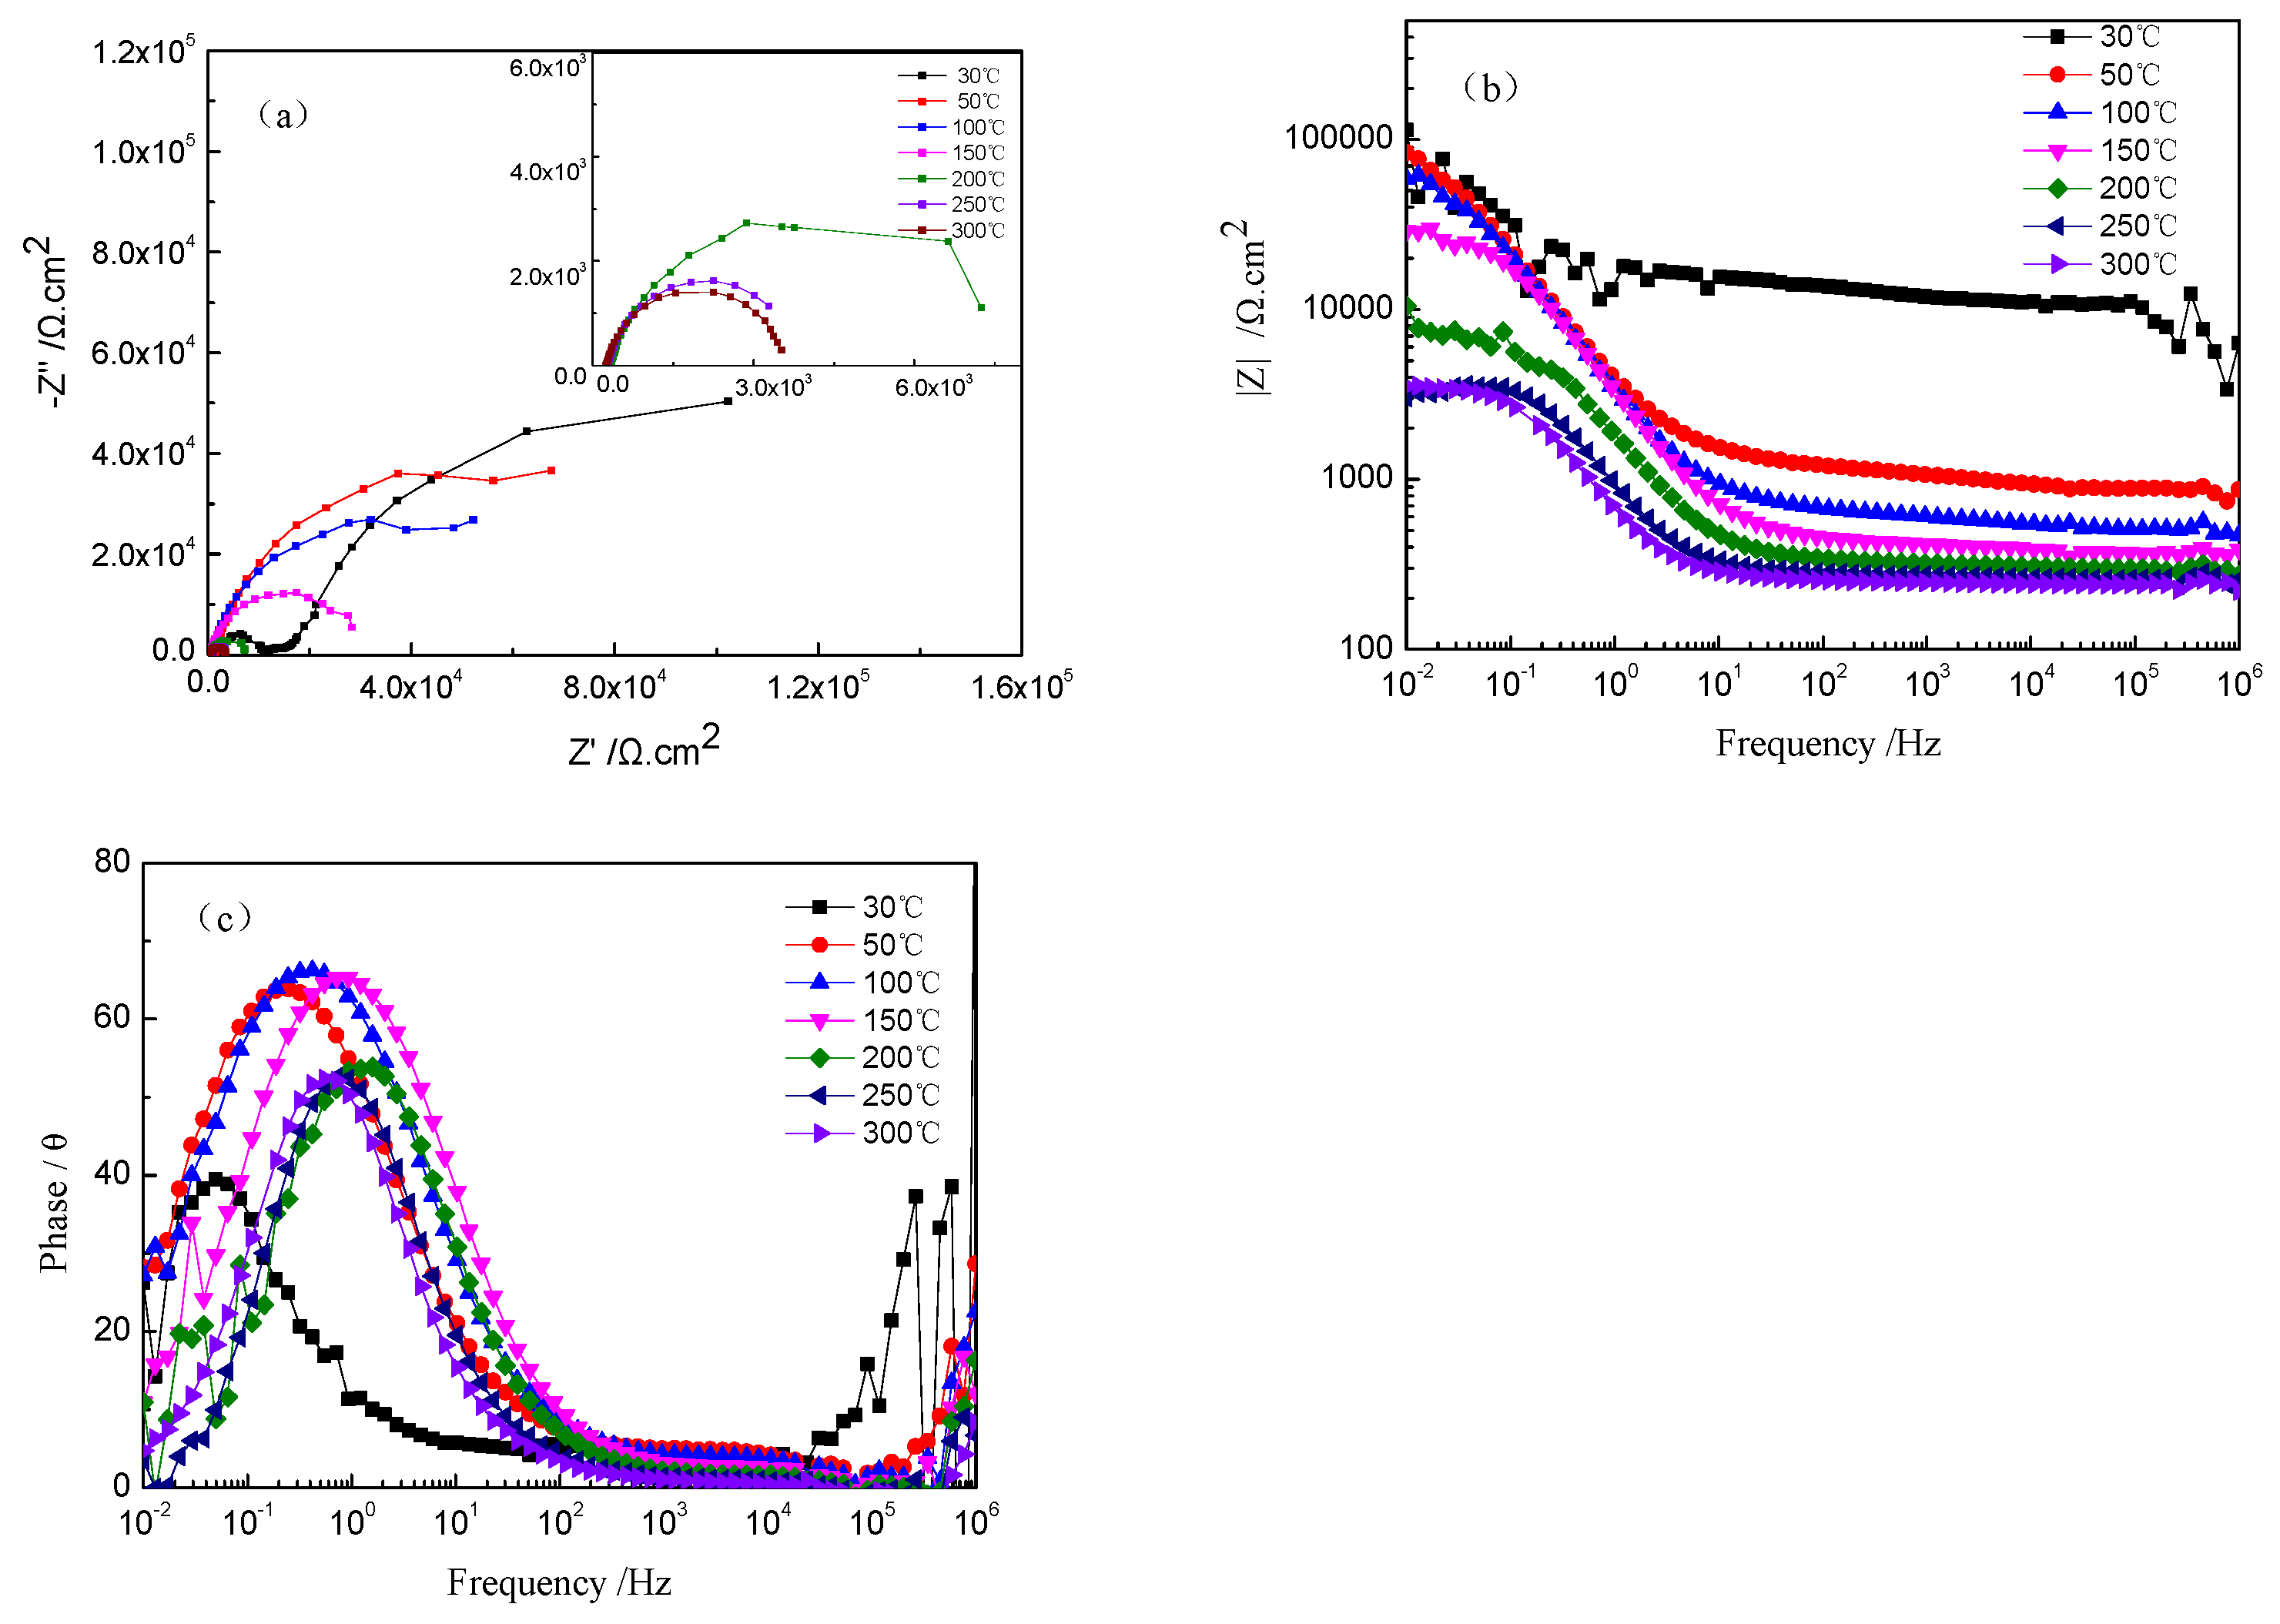
Figure 3 shows the Nyquist and Bode plots of TA2 titanium at different temperatures in a 2.3 ppm Li+ and 1500 ppm B3+ solution. An enlarged Nyquist plot at 200–300 °C is inserted into Figure 3a. The radius of the capacitive loop became smaller as the solution temperature increased. As shown in Figure 3b, the impedance value in the low-frequency region decreased with the increase in temperature. In addition, the maximum value of the phase angle increased under high temperatures. Meanwhile, its frequency at the maximum value shifted toward the high-frequency direction when increasing the temperature (see Figure 3c). The larger diameter of the capacitive loop, higher impedance, and larger maximum value of the phase angle imply a good corrosion resistance of TA2 titanium. However, the corrosion resistance of the TA2 titanium obviously decreased when increasing the solution temperature, especially in comparison to its corrosion behavior at 30 °C. The corrosion resistance decreased significantly below 200 °C, but slightly changed when the solution temperature was above 200 °C. This is consistent with the results of the polarization curves in Figure 1.
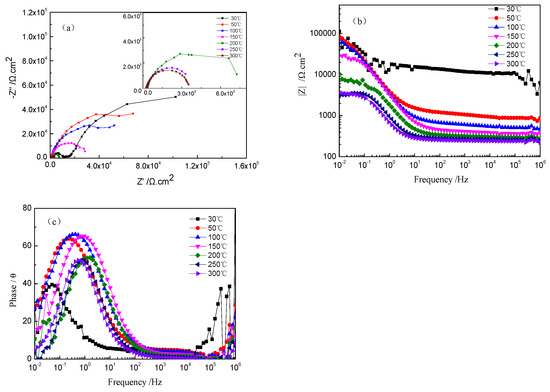
Figure 3.
EIS of TA2 titanium at different temperatures in a 2.3 ppm Li+ and 1500 ppm B3+ solution. (a) Nyquist plots, (b) Bode plots, and (c) phase angle plots.
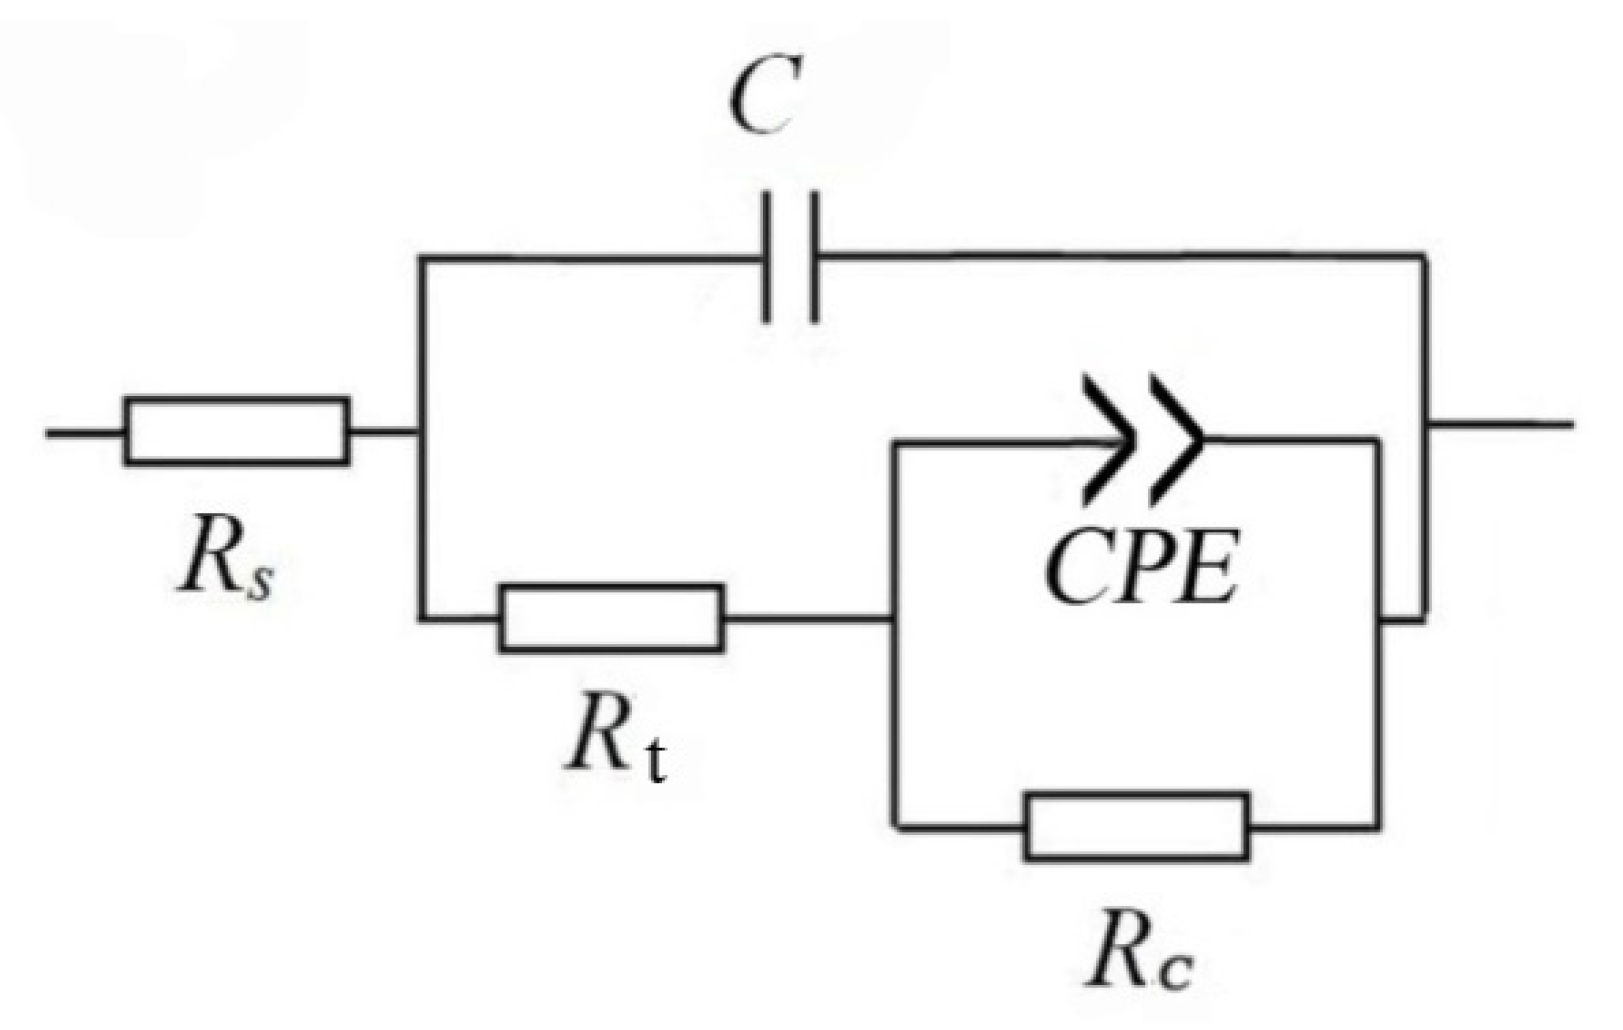
The Nyquist plots of the TA2 sample at different temperatures in Figure 3a reveal two capacitive loops. The smaller capacitive loop in the high-frequency region is related to the electric double layer between the film and the solution, and the thin oxide film on the TA2 surface corresponds to the larger capacitive loop in the low-frequency region. The equivalent circuit of EIS for the TA2 titanium in the lithium borate solution at different temperatures is shown in Figure 4, where Rs is solution resistance, Cdl is electric double layer capacitance, Rt is charge transfer resistance, and CPEc and Rc correspond to the oxide film. CPE is defined as Z = 1/[Y0(jω)n], where Z is the modulus of admittance, and n is an exponent to characterize the deviation degree of real capacitance from its ideal value (0 < n ≤ 1).
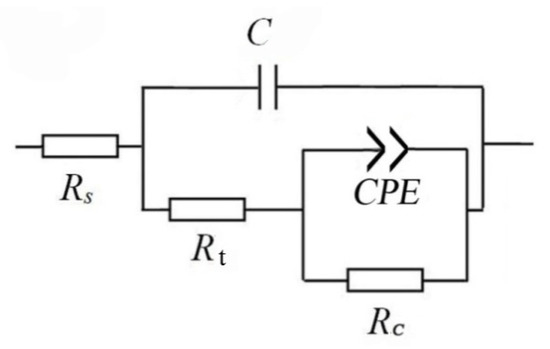
Figure 4.
Equivalent circuit of EIS for TA2 titanium at different temperatures in a 2.3 ppm Li+ and 1500 ppm B3+ solution.
Table 2 indicates that the solution resistance (Rs) at 30 °C was relatively high—up to 3225 Ω·cm2—but decreased significantly with the increase in temperature until 200 °C; then, it reduced slightly from 200 to 300 °C. This is ascribed to the increase in the diffusion rate of the ions in the solution when increasing the temperature. On the other hand, the elevated temperature led to an increase in electric density near the surface of the electrode, which caused the Rt to decrease. Moreover, the Rc of the oxide film was also reduced with the increase in temperature.
Table 2.
EIS fitting results for TA2 titanium at different high temperatures.
3.3. Electrochemical Study of TA2 Titanium during 800 h Exposure at 300 °C and 14 MPa
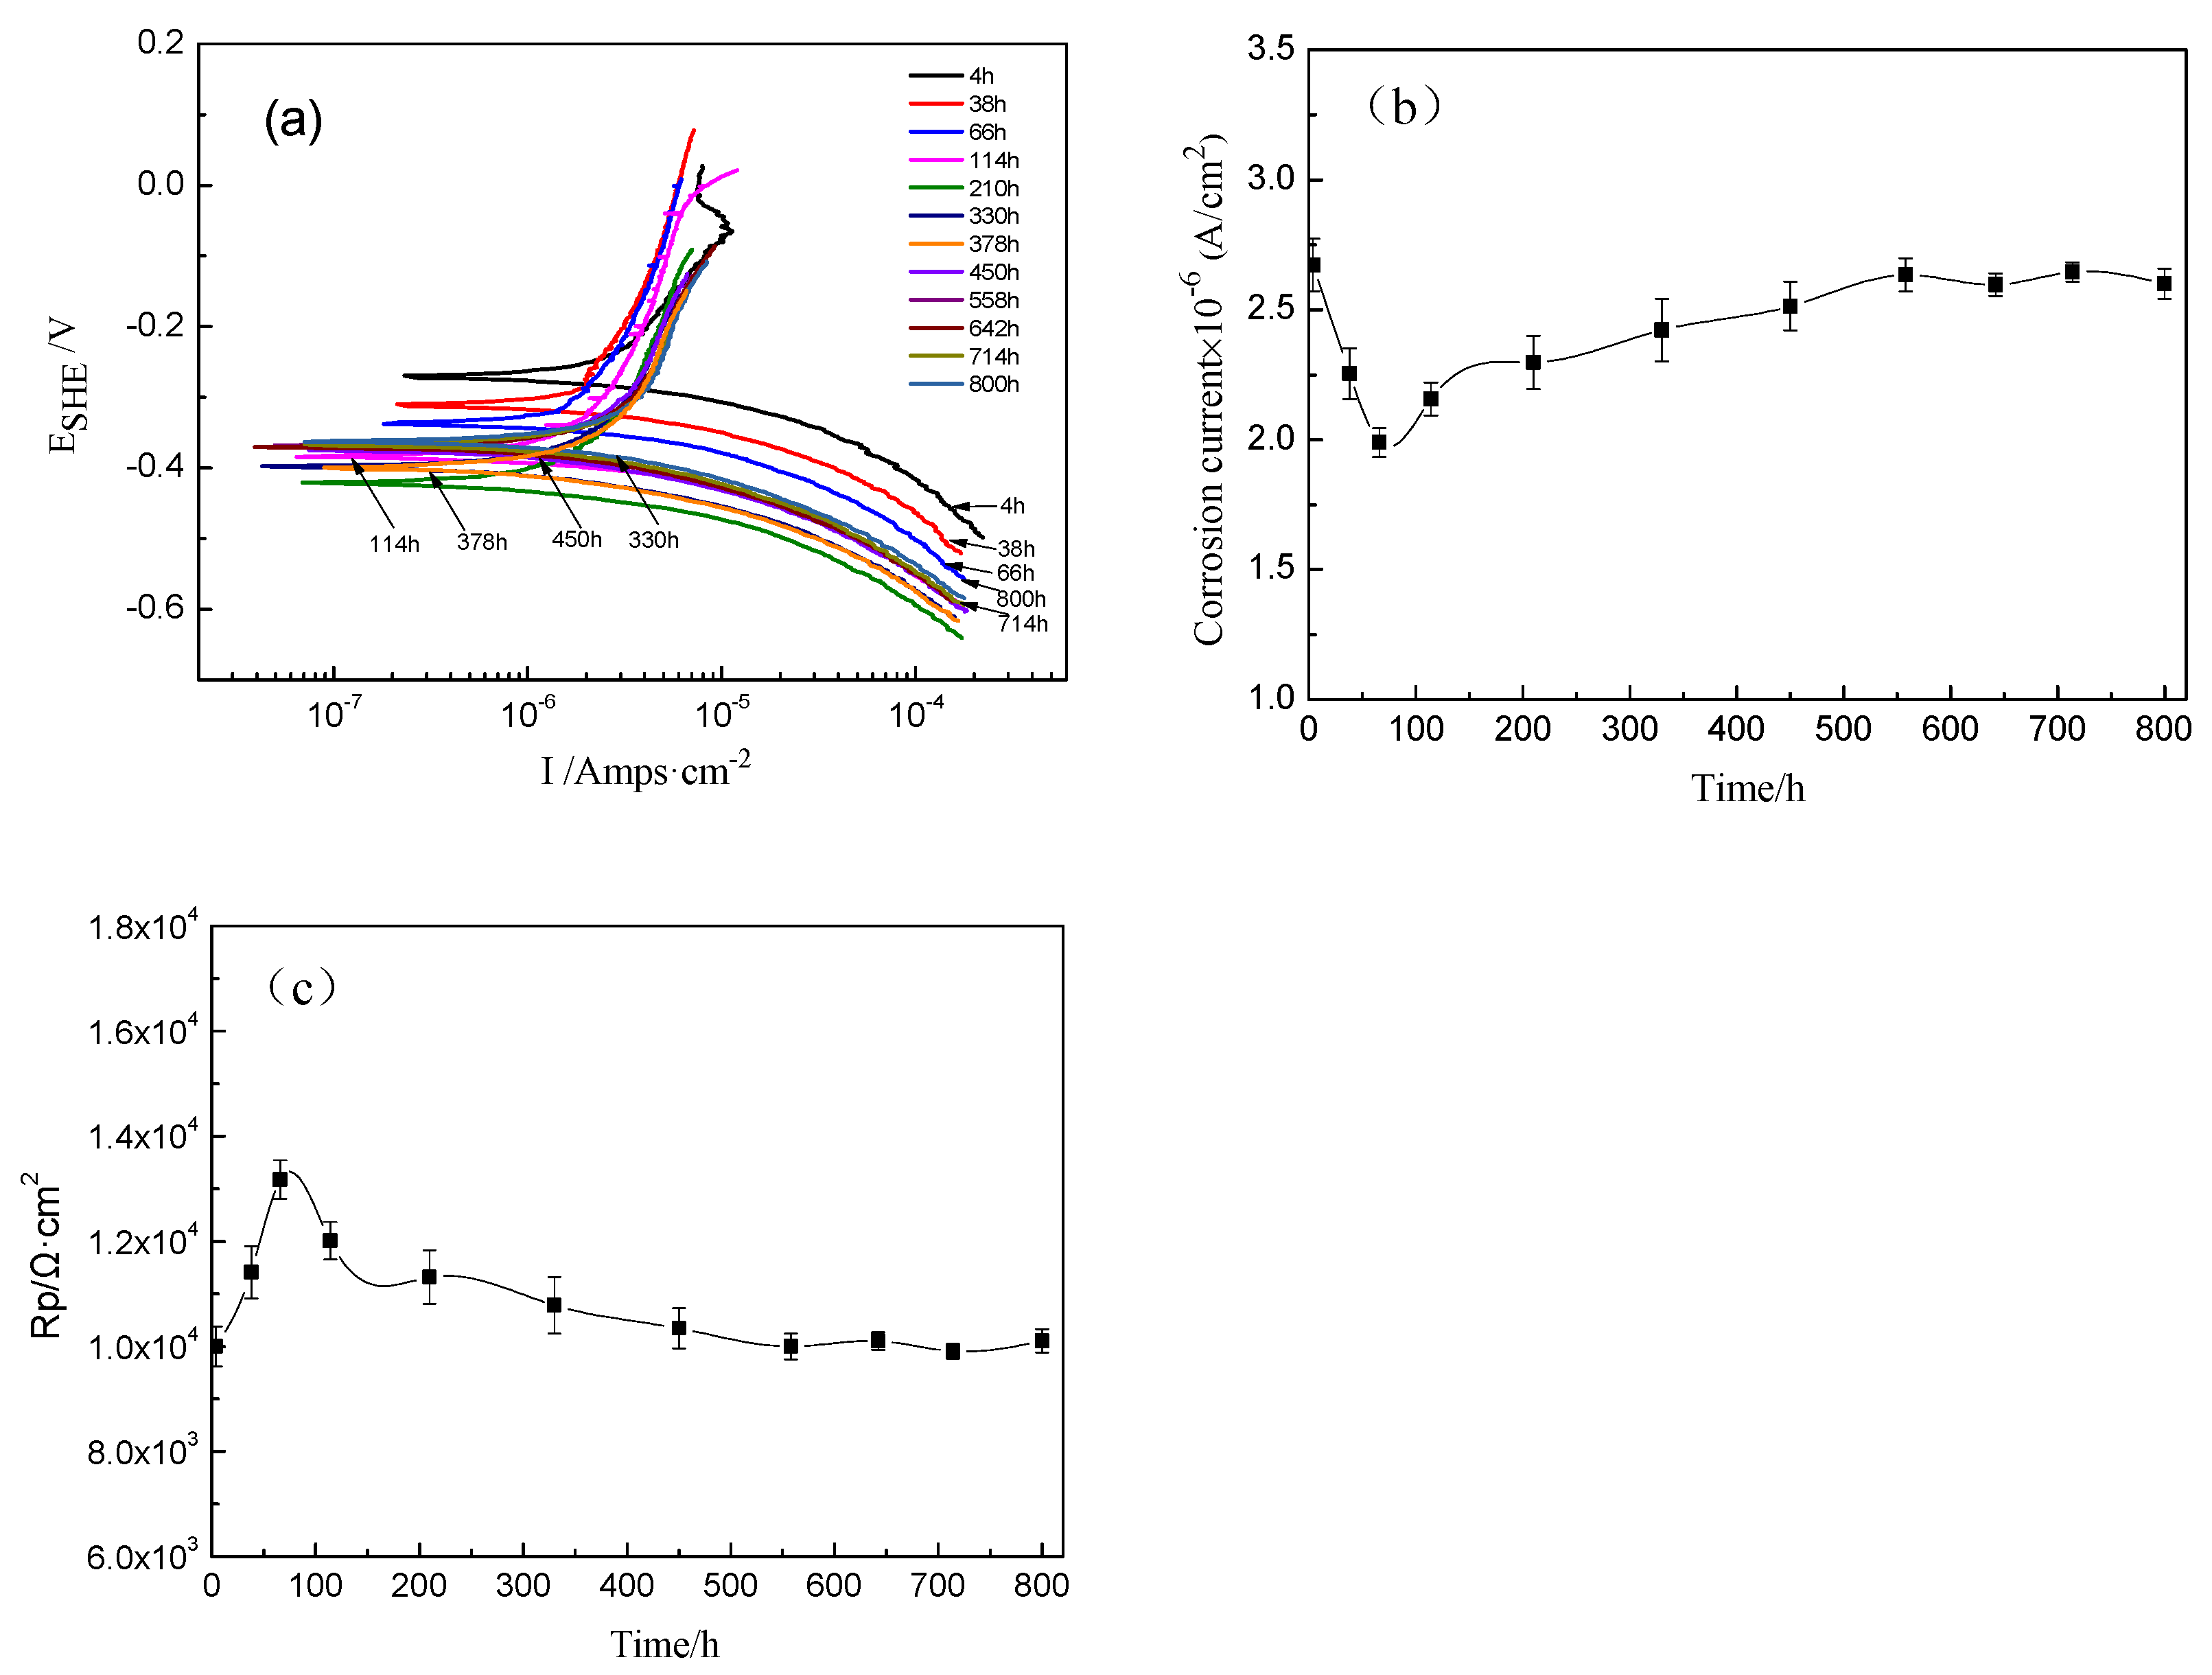
The potentiodynamic polarization curves of the TA2 titanium sample at 300 °C and 14 MPa in a lithium borate solution with different exposure times are shown in Figure 5a. Their corrosion current density (icorr) and polarization resistance (Rp) curves are given in Figure 5b,c. The icorr decreased from 2.67 × 10⁻⁶ A/cm2 to 1.99 × 10⁻⁶ A/cm2, and Rp increased from 9994 to 13,172 Ω·cm2 with the increase in exposure time increasing until 66 h. Then, the icorr slightly increased to 2.60 × 10⁻⁶ A/cm2 at 800 h. In the meantime, the Rp gradually decreased until 378 h and then remained relatively stable until 800 h.
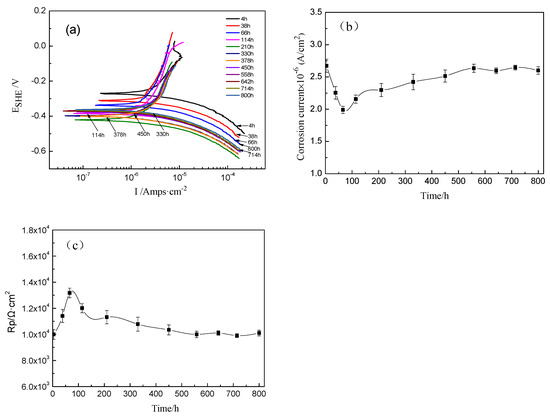
Figure 5.
Potentiodynamic polarization curves of TA2 titanium at different exposure times at 300 °C and 14 MPa. (a) Potentiodynamic polarization curves, (b) current density vs. time, and (c) polarization resistance vs. time.
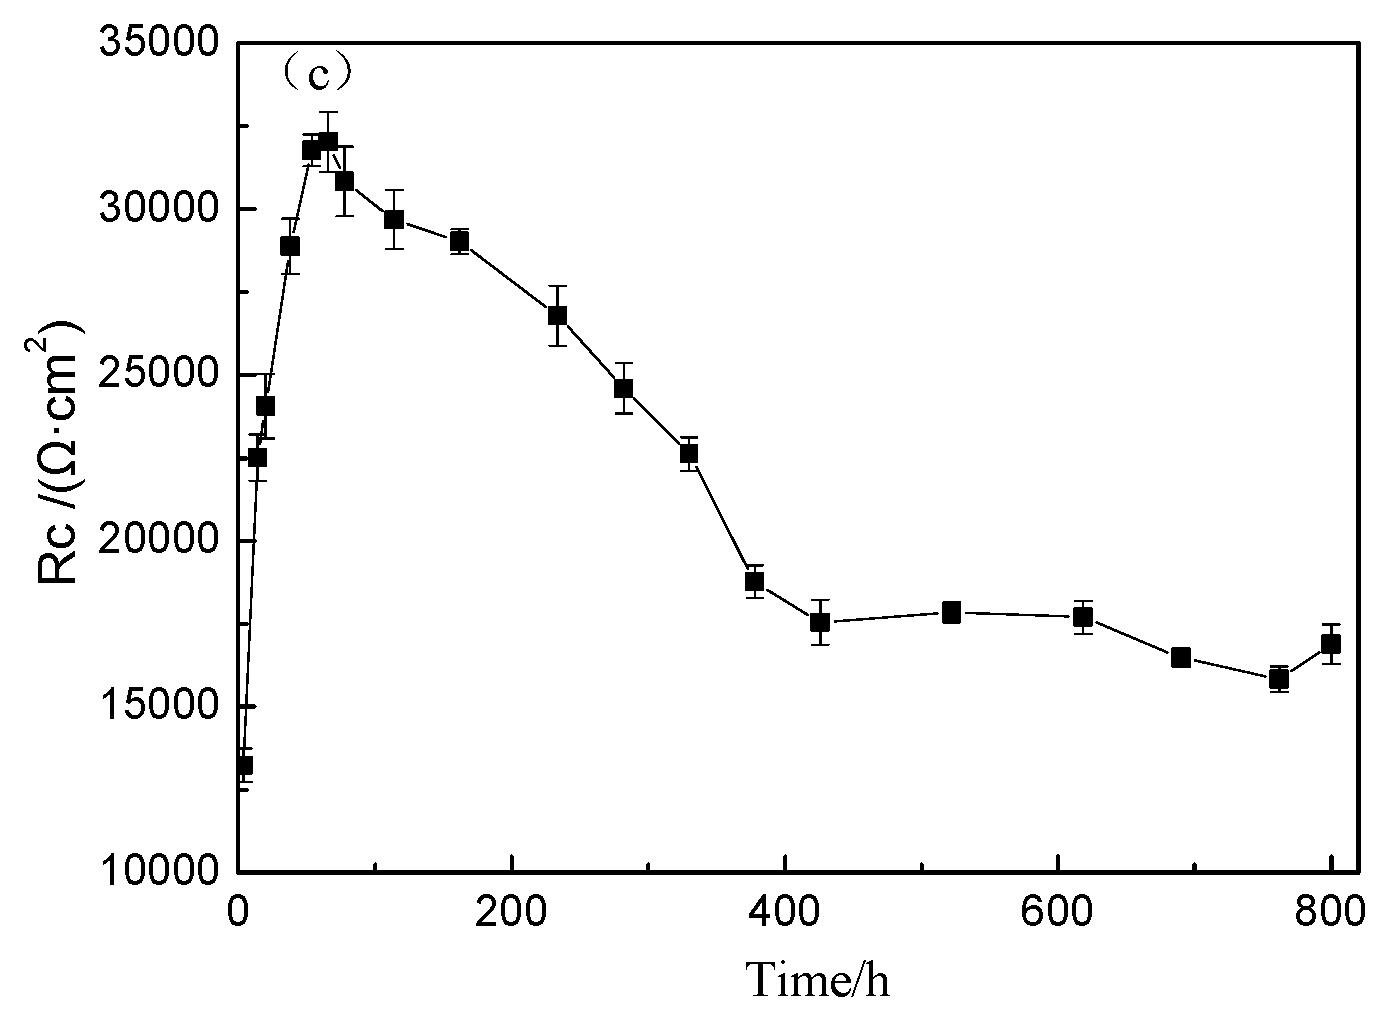
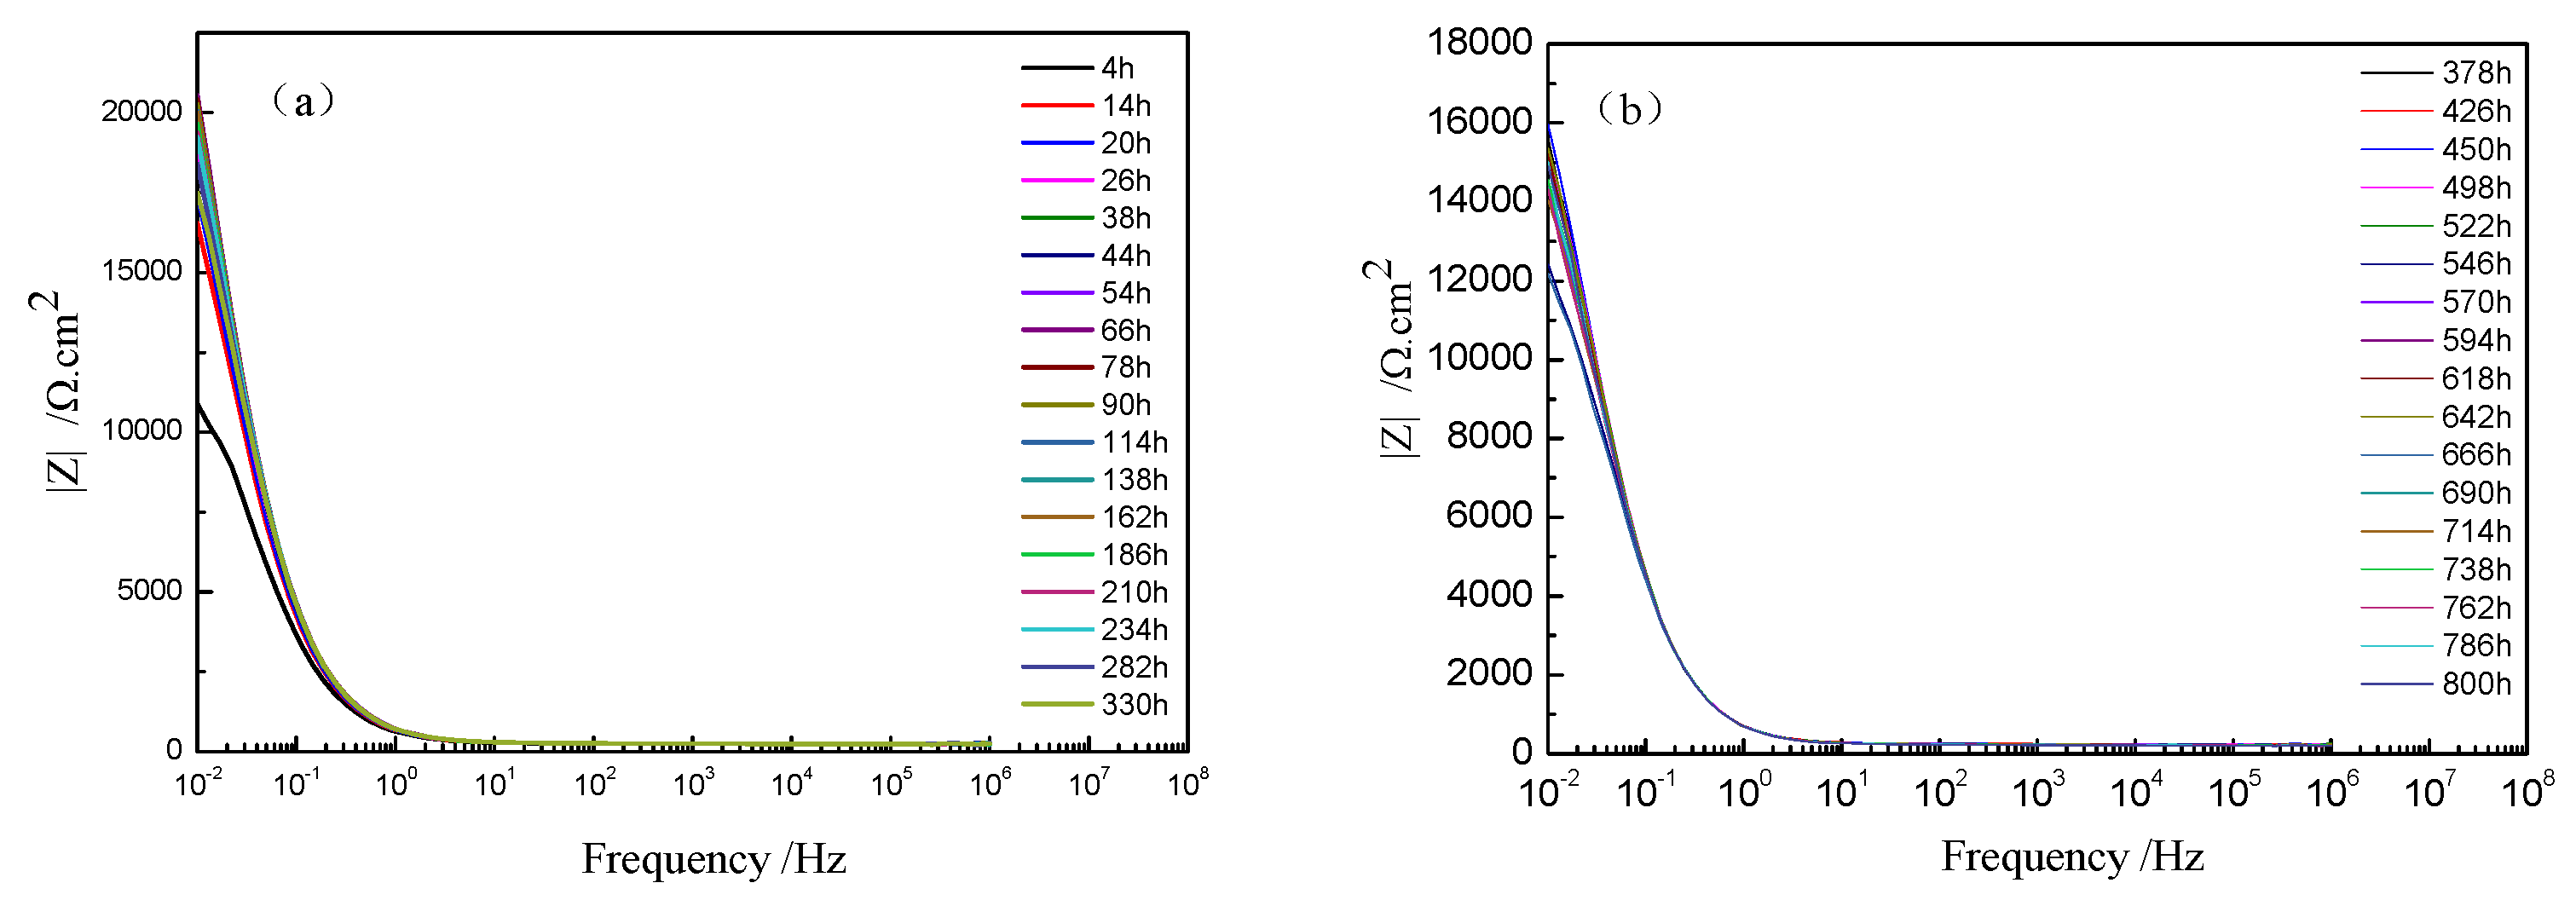
The Nyquist plots of TA2 titanium at different exposure times under 300 °C and 14 MPa in a lithium borate solution are shown in Figure 6a,b. In terms of the equivalent circuit in Figure 4, the above EIS plots were fitted. Figure 6c displays the variation of the Rc of oxide film resistance, with exposure time. The diameter of the capacitive loops in Figure 6a,b increased with the increase in exposure time until 66 h, and then gradually decreases until 378 h. Then, the capacitive loops remained stable. The Rc of the oxide film showed the same changing trend with the radius of the semi-circle of Nyquist plots.
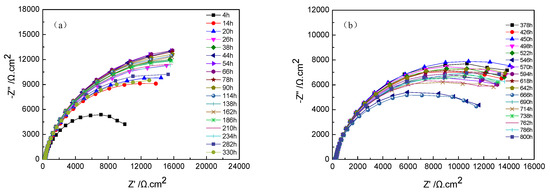

Figure 6.
Nyquist plots of TA2 titanium at different exposure times under 300 °C and 14 MPa. (a) Nyquist plots from 4 to 330 h, (b) Nyquist plots from 373 to 800 h, and (c) Rc of oxide film in equivalent circuit of EIS.
The Bode plots of TA2 at different holding times under 300 °C are shown in Figure 7. The value of impedance at 0.01 Hz rapidly increased to 20,554 Ω/cm2 until 66 h, but slightly decreased to 15,603 Ω/cm2 at 378 h and then remained stable. This implies that the corrosion resistance improved obviously at the beginning but then decreased, and it remained stable in the range of 378 to 800 h. At the beginning, the film was extremely thin, which caused poor corrosion resistance. However, the film constantly grew, and when the oxide film was thick enough, it could resist corrosion.
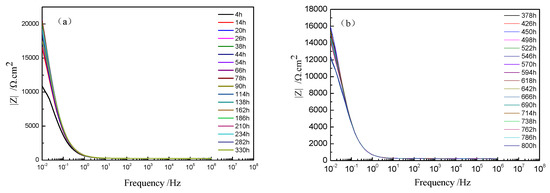
Figure 7.
Bode plots and phase angle plots of TA2 at different holding times under 300 °C: (a) Bode plots from 4 to 330 h and (b) Bode plots from 373 to 800 h.
3.4. Morphology and Structure of Oxide Film
Figure 8a shows the surface morphology of the oxide film formed on TA2 titanium after 800 h exposure in a lithium borate solution at 300 °C and 14 MPa. An enlarged image is also inserted into the top right corner. It was found that the film surface was coved by a large amount of TiO2 nanoplates, which were synthesized under a high-temperature, high-pressure solution environment. In addition, the cross-sectional microstructure of the oxide film is shown in Figure 8b. The film was compact at about 5 μm thick; meanwhile, it had good adhesion with titanium substrate. It is obvious that the interface between the titanium metal and film has a protrusion into the titanium substrate, as shown by the arrows. This means that a prior growth takes place in these regions of oxide film while in a high-temperature solution.
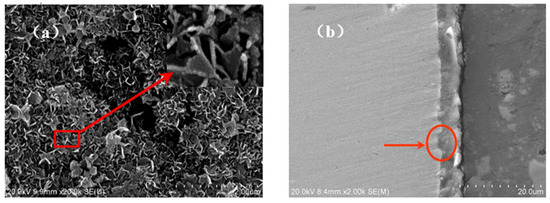
Figure 8.
The surface and cross-section morphologies of oxide film on TA2 titanium after 800 h exposure in a 2.3 ppm Li+ and 1500 ppm B3+ solution at 300 °C and 14 MPa. (a) The surface morphology and (b) the cross-section morphology.
Figure 9 indicates that the Raman spectrum of the oxide film displayed five main peaks at 142, 195, 395, 514, and 637 cm−1, which correspond to the TiO2 anatase phase. The strongest peak at 142 cm−1 is ascribed to the δ (O–Ti–O) vibrational mode with Eg symmetry. The vibrational modes at 195, 395, 514, and 637 cm−1 were Eg, B1g, A1g + B1g, and Eg, respectively [26].
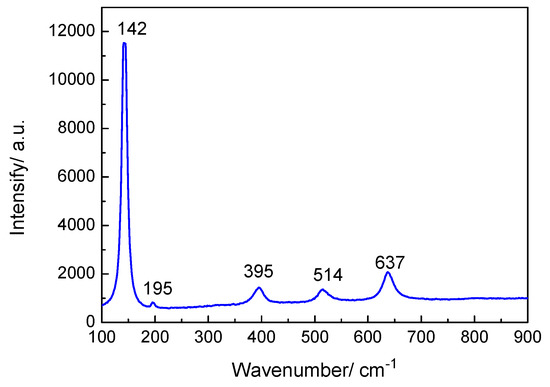
Figure 9.
Raman spectrum of oxide film on TA2 titanium after 800 h exposure in a 2.3 ppm Li+ and 1500 ppm B3+ solution at 300 °C and 14 MPa.
Figure 10 indicates the XRD patterns of oxide film on TA2 titanium after 800 h exposure in a lithium borate solution at 300 °C and 14 MPa. The XRD spectrum showed that the oxide film consists of anatase (TiO2), which is consistent with the Raman result in Figure 9. The strongest peak of anatase was at 25.28° the with preferred orientation (101) plane.
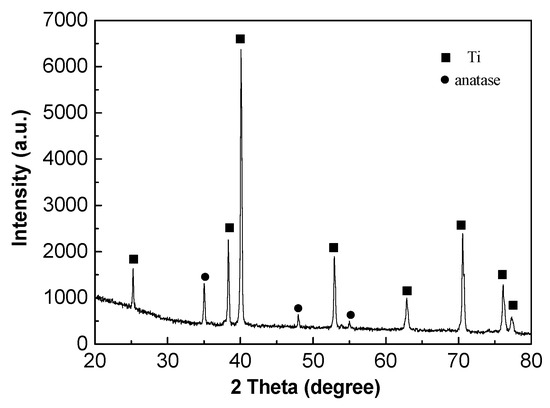
Figure 10.
XRD spectrum of the oxide film on TA2 titanium after exposure for 800 h in a 2.3 ppm Li+ and 1500 ppm B3+ solution at 300 °C and 14 MPa.
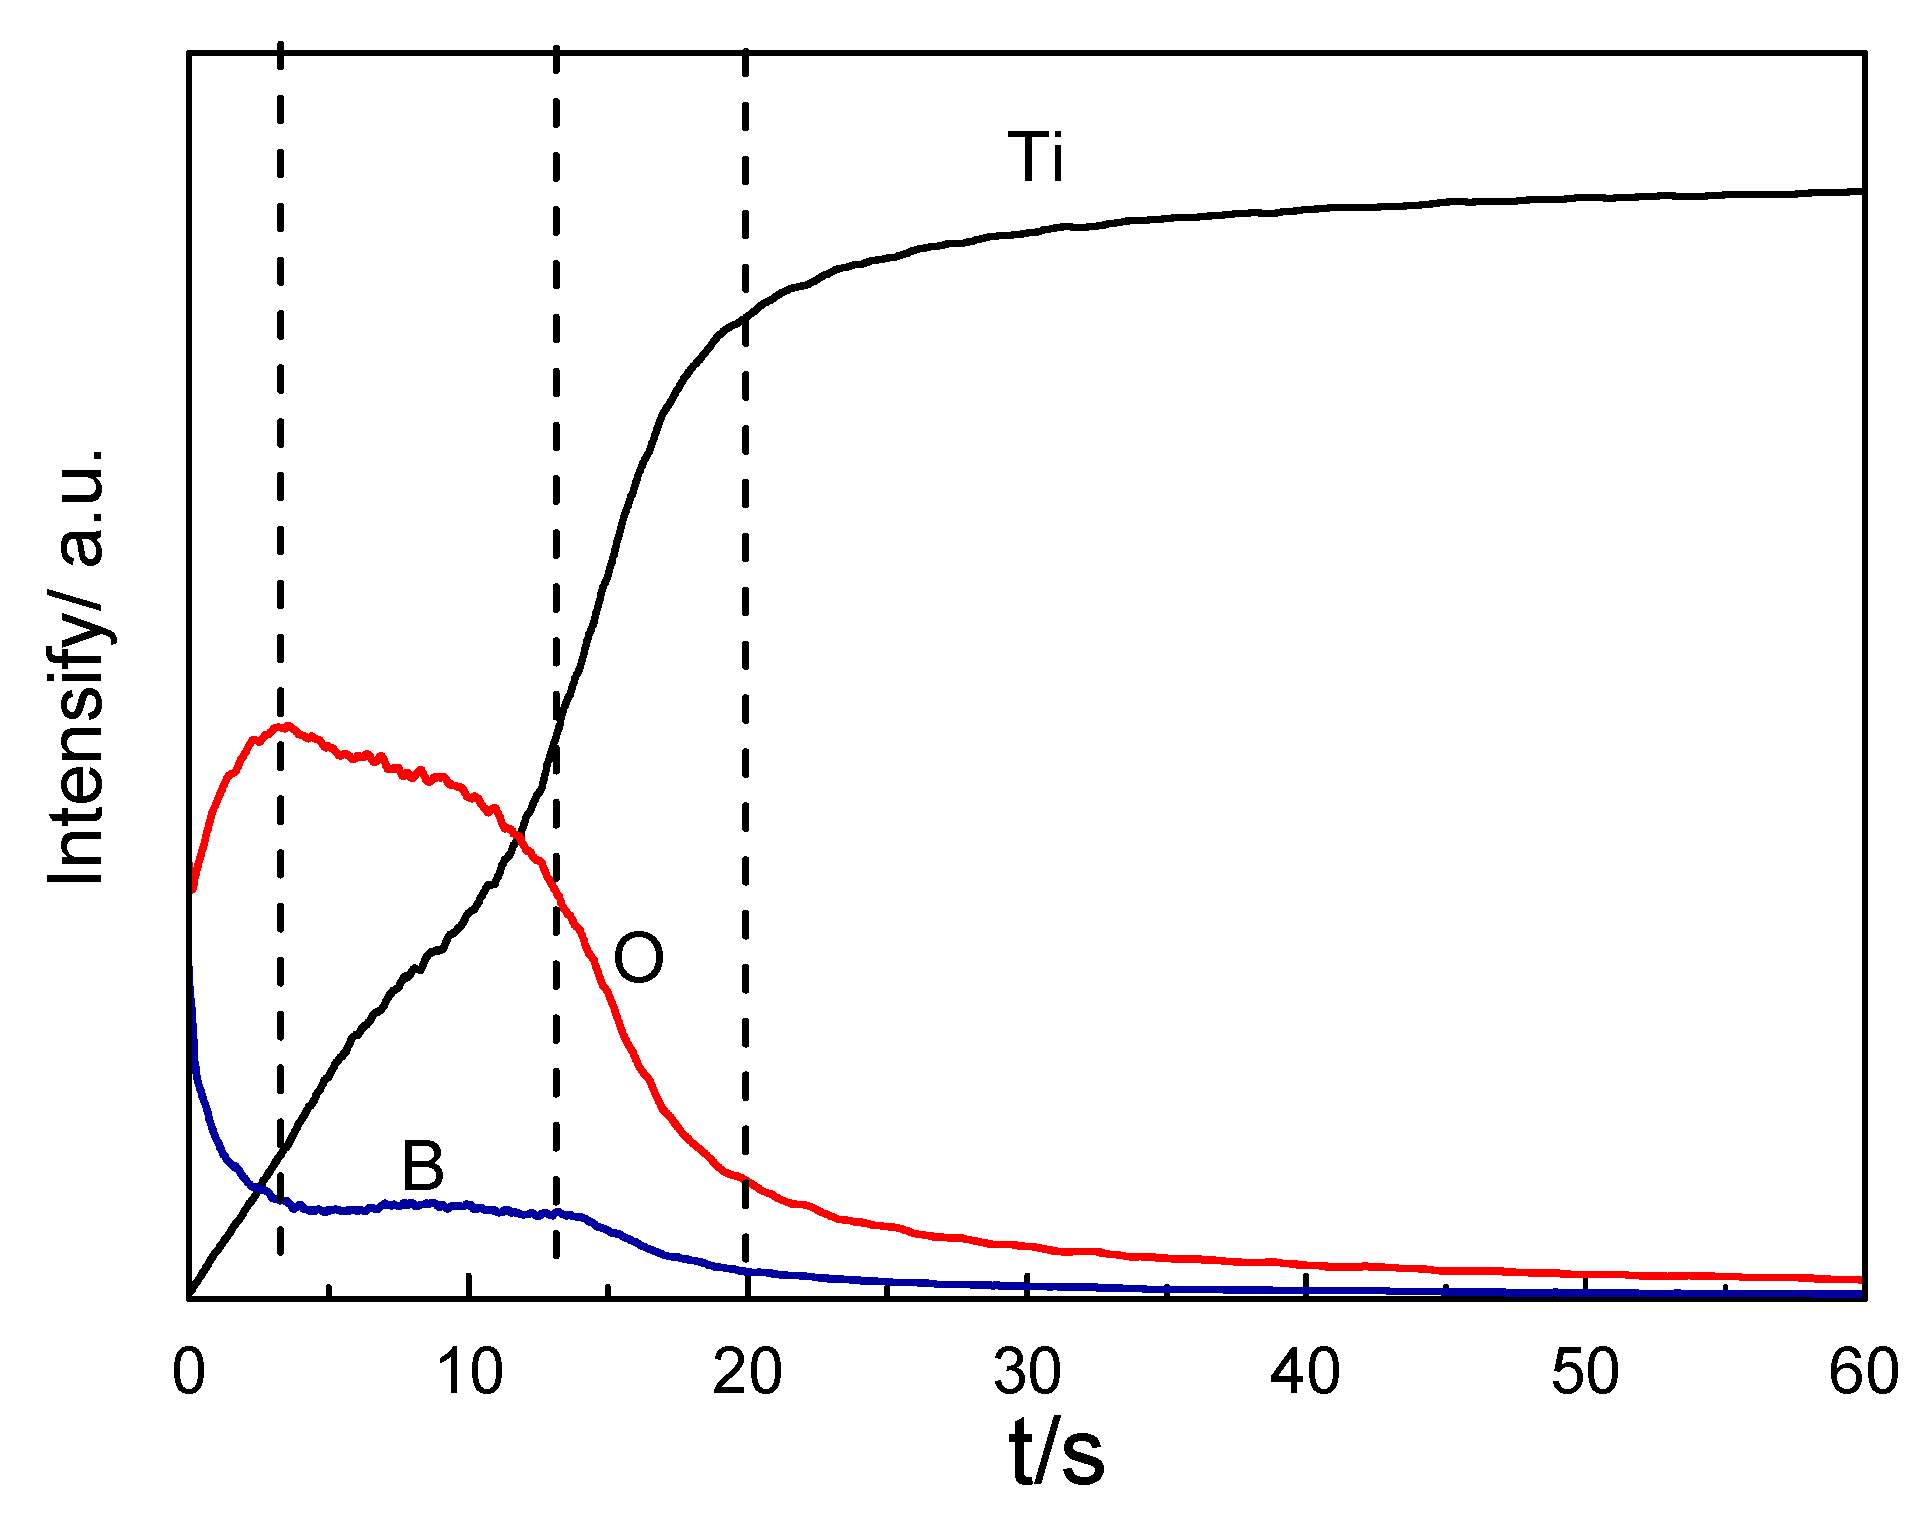
Figure 11 indicates the intensity–time profiles of the oxide layer for Ti, O, and B emissions by GDOES measurement. This revealed the Ti, O, and B composition profiles from the surface to the interior of the samples. The depth was proportional to the sputtering time. The content of B and O on the surface of the oxide layer was high, but the content of Ti was relatively low. With the increase in sputtering time, the content of Ti and O increased gradually, while the content of B gradually decreased. Then, the content of B and O began to stabilize. At the interface between the oxide layer and the matrix, the content of O and B gradually decreased. This indicates that the boron ions in the autoclave solution were adsorbed on the surface.
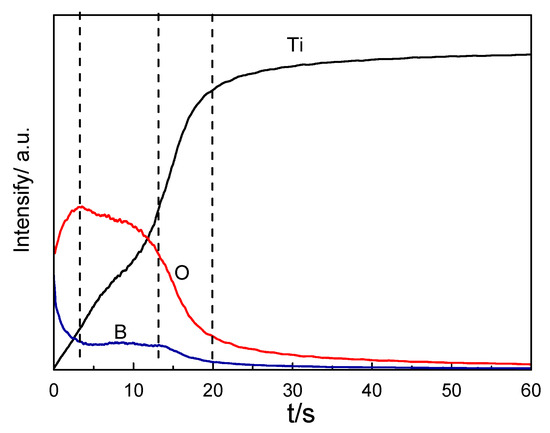
Figure 11.
GDOES spectrum of the oxide film on TA2 titanium after 800 h exposure in a 2.3 ppm Li+ and 1500 ppm B3+ solution at 300 °C and 14 MPa.
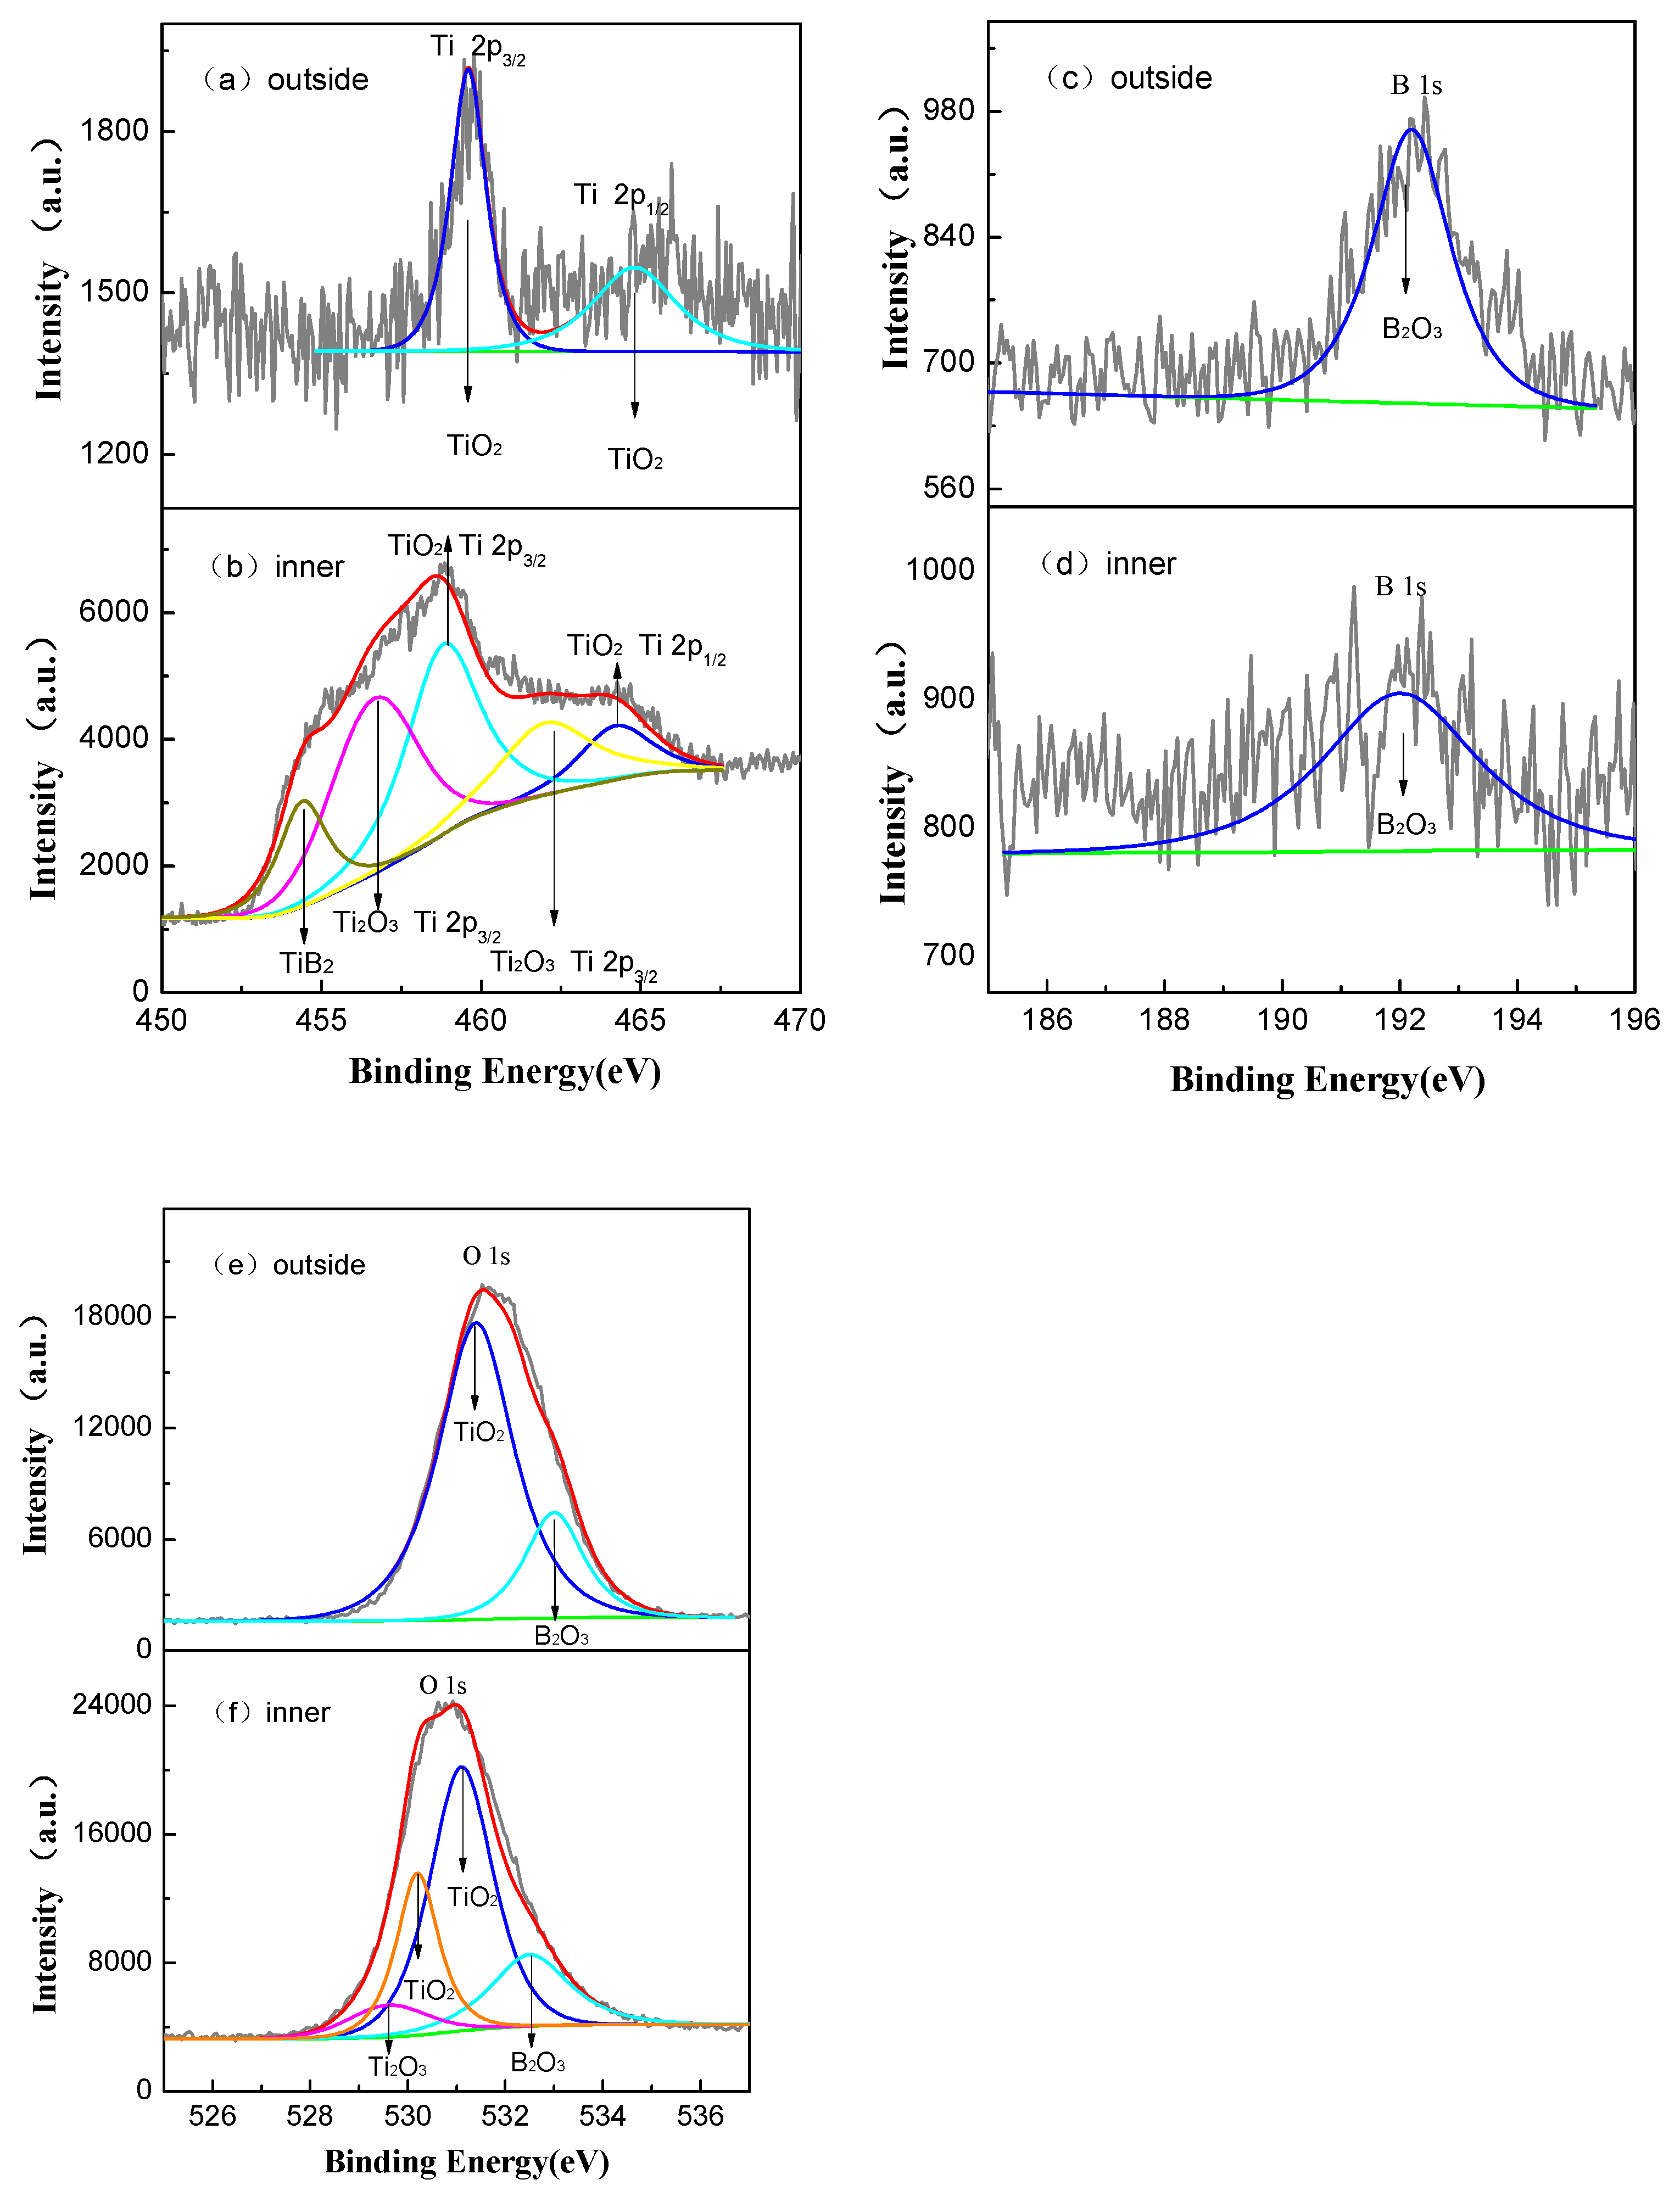
The oxide film of 5 μm thick after 800 h exposure in a lithium borate solution was polished with empery paper, and a 2 μm inner layer was left. Figure 12 shows the XPS spectra for the unpolished and polished films. As depicted in Figure 12a,b, the binding energy peaks at 458.8 and 464.19 eV belong to Ti 2p3/2 and 2p1/2, respectively, donated by TiO2. The peaks at 456.8 and 462.2 eV correspond to Ti2O3. In addition, another peak at 454.4 eV identified the existence of TiB2. The binding energy of B6+ was 192 eV. The O 1s spectra of the film surface in Figure 12e,f can be divided into three peaks, which are assigned to TiO2, B2O3, and the oxygen in O–H groups from adsorbed water, respectively. However, the O 1s spectrum of the interior film is related to TiO2, Ti2O3, and B2O3 (see Figure 12e). Hence, the top surface of film mainly consists of anatase TiO2 and B2O3, but the interior film also contains Ti2O3 and TiB2 in addition to anatase TiO2. This indicates a slight B6+ diffusion to the interior of the film from the lithium borate solution after 800 h exposure.
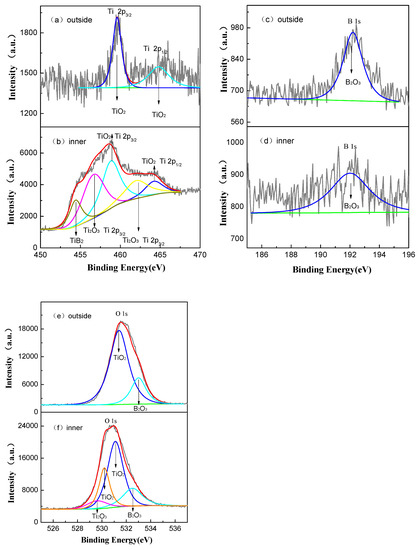
Figure 12.
The XPS spectra of the top surface and inner layer of oxide film formed in a 2.3 ppm Li+ and 1500 ppm B3+ solution at 300 °C and 14 MPa after 800 h exposure time. (a,b) are Ti spectra, (c,d) are B spectra, and (e,f) are O spectra.
4. Discussion
According to the potentiodynamic polarization curves and Nyquist plots against different temperatures and exposure times, the corrosion resistance of TA2 titanium in a 2.3 ppm Li+ and 1500 ppm B3+ solution was weakened with the temperature increase, but improved as the exposure time increased until 66 h at 300 °C. However, it decreased obviously between 66 and 378 h. Then, the oxide film showed a stable corrosion resistance until 800 h.
The corrosion resistance of TA2 titanium in a high-temperature lithium borate solution is related to the growth of oxide film. The oxygen reacted with the titanium to form the passive film at a low temperature in the solution. However, the thin passive film had a weak corrosion resistance during the quick heating process. Furthermore, the oxygen, boron, lithium, and other ions in the solution constantly diffused into titanium. The titanium was quickly and easily oxidized for the oxygen diffusion between30 and 300 °C with low activation energy. When the temperature was maintained at 300 °C, the corrosion resistance gradually increased until 66 h, which indicates that the new oxide film can protect titanium from reacting with oxygen or other ions. Then, the corrosion resistance gradually decreased between 66 and 378 h due to the diffuse ions forming defects that damaged the resistance to corrosion of the oxide film. The defects mainly manifested as the small B ion radius doping into the TiO2 lattice forming B2O3, TiB2, etc. However, the corrosion resistance became stable after 378 h for the protection of the oxide film, and the damage of defects reached an equilibrium state. The XPS and GDOES demonstrated that the content of B is higher in the outside of the oxide film than on the inside.
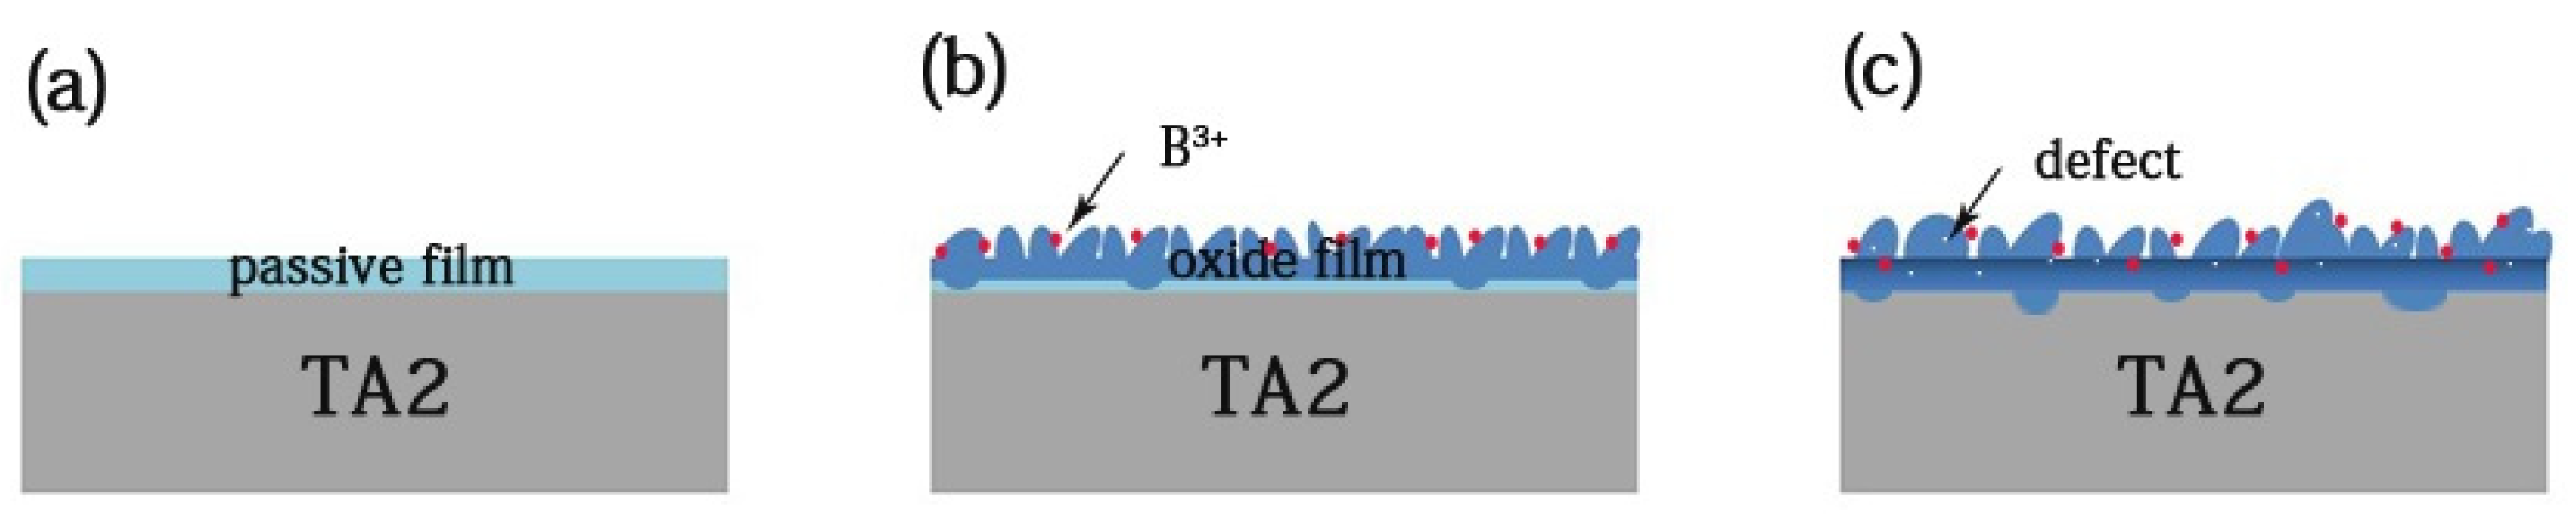
Initially, the titanium placed into the solution formed a passive film immediately, of which the growth mode is layer by layer. With the temperature increase, the oxide film continued to grow. Meanwhile, based on XPS analysis, the inner oxide film consisted of Ti2O3, TiO2, and a small amount of of TiB2 and B3O2, and the outside of the film mainly consisted of TiO2 and B2O3. The layer growth resulted in the generation of mismatch stress on the inside and outside of the film, which have different oxide structures. As the stress accumulated, the surface underwent island growth, which acted to relax the stress [27]. As a result, the mismatch stress was the main nuclear driving force, and the nanoplate nucleus formed to release the interstress [28]. The thermal interstress and the volume stress promoted nanoplate growth. Figure 13 shows the TA2 titanium corrosion process in a lithium borate solution at 300 °C and 14 MPa. The red balls are B ions and white spots are defects.

Figure 13.
The corrosion process of TA2 titanium in a 2.3 ppm Li+ and 1500 ppm B3+ solution at 300 °C and 14 MPa. (a) The titanium placed into the solution formed a passive film, (b) the nanoplate formed, and (c) the defects doping into oxide.
5. Conclusions
- (1).
- After 800 h exposure in a lithium borate solution at 300 °C and 14 MPa, the oxide film on TA2 titanium mainly consists of anatase TiO2 phases and a small amount of B2O3. The surface of the film is covered by many nanoplates, and its thickness is about 5 μm.
- (2).
- The activation energy is 6.27 kJ/mol from 30 to 200 °C and 22.51 kJ/mol from 200 to 300 °C. The oxidation of titanium is controlled by oxygen ion diffusion in the liquid phases.
- (3).
- The oxide film shows rapid growth and good corrosion resistance until 66 h. The increasing of defects weakens with the corrosion resistance, which is stabilizes after 378 h.
- (4).
- The oxide film growth mode is a combination of layer by layer and island growth. The mismatch stress is the main nuclear driving force, and the thermal interstress and the volume stress promote nanoplate growth.
Author Contributions
Conceptualization, L.C. and W.X.; methodology, L.C. and B.L; software, L.C.; validation, L.C., X.J., and P.P.; formal analysis, L.C.; investigation, L.C., X.J., and P.P.; resources, L.C. and W.X.; data curation, L.C.; writing—original draft preparation, L.C.; writing—review and editing, L.C. and W.X; visualization, L.C. and B.L.; supervision, W.X. and J.L.; project administration, L.C. and J.L.; funding acquisition, L.C. and J.L. All authors have read and agreed to the published version of the manuscript.
Funding
This research was sponsored by the National Natural Science Foundation of China (grant no. 12005018), Beijing Academy of Science and Technology-Bud Plan (grant no. BGS201903) and the Beijing Academy of Science and Technology-Reform and Development (grant no.13001-2107).
Institutional Review Board Statement
Not applicable.
Informed Consent Statement
Not applicable.
Data Availability Statement
All the data used in this study are contained within the article.
Conflicts of Interest
The authors declare no conflict of interest.
References
- Sun, H.; Wu, X.; Han, E.H. Effects of temperature on the oxide film properties of 304 stainless steel in high temperature lithium borate buffer solution. Corros. Sci. 2009, 51, 2840–2847. [Google Scholar] [CrossRef]
- Bojinov, M.; Karastoyanov, V.; Kinnunen, P.; Saario, T. Influence of water chemistry on the corrosion mechanism of a zirconium–niobium alloy in simulated light water reactor coolant conditions. Corros. Sci. 2010, 52, 54–67. [Google Scholar] [CrossRef]
- Li, X.; Wang, J.; Han, E.H.; Ke, W. Corrosion behavior for Alloy 690 and Alloy 800 tubes in simulated primary water. Corros. Sci. 2013, 67, 169–178. [Google Scholar] [CrossRef]
- Grégoire, B.; Oskay, C.; Meiner, T.M.; Galetz, M.C. Corrosion mechanisms of ferritic-martensitic P91 steel and Inconel 600 nickel-based alloy in molten chlorides. Part I: NaCl–KCl binary system. Sol. Energy Mater. Sol. Cells 2020, 215, 110659. [Google Scholar] [CrossRef]
- Lu, Z.P.; Shoji, T.; Dan, T.C.; Qiu, Y.B.; Yonezawa, T. The effect of roll-processing orientation on stress corrosion cracking of warm-rolled 304L stainless steel in oxygenated and deoxygenated high temperature pure water. Corros. Sci. 2010, 52, 2547–2555. [Google Scholar] [CrossRef]
- Kritzer, P.; Boukis, N.; Dinjus, E. Review of the corrosion of nickel-based alloys and stainless steels in strongly oxidizing pressurized high-temperature solutions at subcritical and supercritical temperatures. Corrosion 2000, 56, 1093–1104. [Google Scholar] [CrossRef]
- Boyer, R.R. An overview on the use of titanium in the aerospace industry. Mater. Sci. Eng. A 1996, 213, 103–114. [Google Scholar] [CrossRef]
- Liu, Y.; Alfantazi, A.; Schaller, R.F.; Asselin, E. Localised instability of titanium during its erosion-corrosion in simulated acidic hydrometallurgical slurries. Corros. Sci. 2020, 174, 108816. [Google Scholar] [CrossRef]
- Fang, X.; Wang, S.; Li, D.; Guo, Y.; Hu, N. Effect of synovial fluid temperature on the corrosion resistance of Ti6Al4V, Ti6Al7Nb, and CoCrMo alloys. Mater. Corros. 2020, 71, 1346–1360. [Google Scholar] [CrossRef]
- Liu, J.; Alfantazi, A.; Asselin, E. High Temperature Corrosion of Titanium Under Conditions Relevant to Pressure Leaching: Mass Loss and Electrochemistry. Corrosion 2014, 71, 352–366. [Google Scholar] [CrossRef]
- Delville, M.H.; Botella, P.; Jaszay, T.; Frayret, J.P. Electrochemical study of corrosion in aqueous high pressure, high temperature media and measurements of materials corrosion rates: Applications to the hydrothermal treatments of organic wastes by SCWO. J. Supercrit. Fluid. 2003, 26, 169–179. [Google Scholar] [CrossRef]
- Saito, N.; Tsuchiya, Y.; Akai, Y.; Omura, H.; Takada, T.; Hara, N. Corrosion performance of metals for supercritical water, oxidation-utilized organic waste-processing reactors. Corrosion 2006, 62, 383–394. [Google Scholar] [CrossRef]
- Liu, J.; Alfantazi, A.; Asselin, E. A new method to improve the corrosion resistance of titanium for hydrometallurgical applications. Appl. Surf. Sci. 2015, 332, 480–487. [Google Scholar] [CrossRef]
- Hu, Y.; Liu, G. Properties and application of high-temperature corrosion-resisting alloy Ti-31. Rare Met. Mater. Eng. 1995, 25, 39–44. [Google Scholar]
- Gurrappa, I. Characterization of titanium alloy Ti-6Al-4V for chemical, marine and industrial applications. Mater. Charact. 2003, 51, 131–139. [Google Scholar] [CrossRef]
- Lu, B.T.; Luo, J.L.; Lu, Y.C. Correlation between film rupture ductility and PbSCC of Alloy 800. Electrochim. Acta 2008, 53, 4122–4136. [Google Scholar] [CrossRef]
- Wang, Q.R.; Huang, F.F.; Cui, Y.T.; Yoshida, H.; Wen, L.; Jin, Y. Influences of formation potential on oxide film of TC4 in 0.5M sulfuric acid. Appl. Surf. Sci. 2020, 544, 148888. [Google Scholar] [CrossRef]
- Zheng, S.; Cai, Z.; Pu, J.; Zeng, C.; Wang, L. Passivation behavior of valticrsi amorphous high-entropy alloy film with a high corrosion-resistance in artificial sea water. Appl. Surf. Sci. 2021, 542, 148520. [Google Scholar] [CrossRef]
- Cai, Y.Q.; Liu, H.X.; Xu, Q.; Song, Q.S.; Liu, H.J.; Xu, L. Electrochemical behavior of zirconium in an in-situ preparing licl-kcl-zrcl4 molten slat. Int. J. Electrochem. Sci. 2015, 10, 4324–4334. [Google Scholar]
- Gabor, N.; Zsolt, K.; Tamas, P. In situ electrochemical impedance spectroscopy of Zr–1%Nb under VVER primary circuit conditions. J. Nucl. Mater. 2002, 300, 230–236. [Google Scholar]
- Xu, J.; Wu, X.Q.; Han, E.H. The evolution of electrochemical behaviour and oxide film properties of 304 stainless steel in high temperature aqueous environment. Electrochim. Acta. 2012, 71, 219–226. [Google Scholar] [CrossRef]
- Wei, K.J.; Wang, X.P.; Zhu, M.H.; Wan, X.M.; Du, J.C.; Xue, W.B.; Zhang, J.L. Effects of Li, B and H elements on corrosion property of oxide films on ZIRLO alloy in 300 °C/14 MPa lithium borate buffer solutions. Corros. Sci. 2021, 181, 109216. [Google Scholar] [CrossRef]
- Macdonald, D.D.; Scott, A.C.; Wentrcek, P. External reference electrodes for use in high temperature aqueous systems. J. Electrochem. Soc. 1979, 126, 908–911. [Google Scholar] [CrossRef]
- Xiao, Q.; Si, Z.; Yu, Z. Sol–gel auto-combustion synthesis of samarium-doped TiO2 nanoparticles and their photocatalytic activity under visible light irradiation. Mater. Sci. Eng. B 2007, 137, 189–194. [Google Scholar] [CrossRef]
- Huang, J.; Wu, X.; Han, E.H. Electrochemical properties and growth mechanism of passive films on Alloy 690 in high-temperature alkaline environments. Corros. Sci. 2010, 52, 3444–3452. [Google Scholar] [CrossRef]
- Sapeli, M.; Maarof, S.; Nor, A.M.; Mahmood, M.R. Hydrothermal synthesis of TiO2 nanostructures on pre-treated substrate. In Proceedings of the Micro and Nanoelectronics (RSM), Daerah Langkawi, Malaysia, 25–27 September 2013; pp. 344–347. [Google Scholar]
- Chen, L.; Liao, B.; Wu, J.; Yu, J.J.; Xue, W.B.; Zhang, X.; He, G.Y. Influence of ion implantation on growth mechanism of α-Fe2O3 nanowires/nanoblades. Mater. Chem. Phys. 2019, 231, 196–202. [Google Scholar] [CrossRef]
- Jesson, D.E.; Pennycook, S.J.; Baribeau, J.M.; Houghton, D.C. Direct imaging of surface cusp evolution during strained-Layer epitaxy. Phys. Rev. Lett. 1993, 71, 1744–1747. [Google Scholar] [CrossRef]


Publisher’s Note: MDPI stays neutral with regard to jurisdictional claims in published maps and institutional affiliations. |
© 2021 by the authors. Licensee MDPI, Basel, Switzerland. This article is an open access article distributed under the terms and conditions of the Creative Commons Attribution (CC BY) license (https://creativecommons.org/licenses/by/4.0/).