Article

Powder Diffraction Data of Aluminum-Rich FCC-Ti1−xAlxN Prepared by CVD

1
Fraunhofer Institute for Ceramic Technologies and Systems, 01277 Dresden, Germany
2
Department of Materials Physics, Montanuniversität Leoben, 8700 Leoben, Austria
3
Erich Schmid Institute for Materials Science, Austrian Academy of Science, 8700 Leoben, Austria
4
Böhlerit GmbH & Co KG, 8605 Kapfenberg, Austria
*
Author to whom correspondence should be addressed.
Coatings 2021, 11(6), 683; https://doi.org/10.3390/coatings11060683
Submission received: 13 May 2021 / Revised: 2 June 2021 / Accepted: 3 June 2021 / Published: 5 June 2021
(This article belongs to the Special Issue Chemical Vapor Deposition (CVD) Coatings)

Abstract

:
Fcc-Ti1−xAlxN-based coatings obtained by Physical Vapor Deposition (PVD) or Chemical Vapor Deposition (CVD) are widely used as wear-resistant coatings. However, there exists no JCPDF card of fcc-Ti1−xAlxN for the XRD analysis of such coatings based on experimental data. In this work, an aluminum-rich fcc-Ti1−xAlxN powder was prepared and, for the first time, a powder diffraction file of fcc-Ti1−xAlxN was determined experimentally. In the first step, a 10 µm thick Ti1−xAlxN coating was deposited on steel foil and on cemented carbide inserts by CVD. The steel foil was etched and flakes of a free-standing Ti1−xAlxN layer were obtained of which a part consisted of a pure fcc phase. A powder was produced using the major part of the flakes of the free-standing Ti1−xAlxN layer. Following the Ti1−xAlxN coating, a flake of the free-standing layer and the powder were characterized by X-ray diffraction (XRD), scanning electron microscopy (SEM), selected area electron diffraction and high-resolution transmission electron microscopy (SAED–HRTEM), wavelength dispersive X-ray spectroscopy (WDS) and energy dispersive X-ray spectroscopy (EDS). The powder consisted of 88% fcc-Ti1−xAlxN. The stoichiometric coefficient of fcc-Ti1−xAlxN was measured on a flake containing only the fcc phase. A value of x = 0.87 was obtained. Based on the powder sample, the XRD data of the pure fcc-Ti1−xAlxN phase were measured and the lattice constant of the fcc-Ti1−xAlxN phase in the powder was determined to be a = 0.407168 nm. Finally, a complete dataset comprising relative XRD intensities and lattice parameters for an fcc-Ti0.13Al0.87N phase was provided.

1. Introduction

Ti1−xAlxN coatings are very important wear-resistant coatings for tools with a wide application range due to their outstanding performance with respect to high hardness and oxidation resistance. The higher the aluminum content, the higher the oxidation resistance. Ti1−xAlxN with NaCl structure (fcc structure) is a metastable material and it can be prepared by PVD [1,2,3,4] or CVD [5,6,7], but only the newer CVD coatings developed several years ago [5] are aluminum-rich and have a stoichiometric coefficient x of up to 0.9. However, generally there is a lack of knowledge regarding the X-ray data of fcc-Ti1−xAlxN. The PDF database [8,9] contains no data for the ternary phase of fcc-Ti1−xAlxN. So far, JCPDF cards 00-025-1495 or 00-046-1200 of fcc-AlN have been used for the XRD analysis of such coatings. However, the source of JCPDF card 00-025-1495 [10] is a private communication originating from 1973 in which the synthesis method is unclear. The other JCPDF card, 00-046-1200 [11], is based on the high-pressure synthesis of fcc-AlN [12] and it offers a reliable data file for the binary phase fcc-AlN. However, it is also desirable to have one or more JCPDF cards for the ternary system fcc-Ti1−xAlxN, similar to the ternary system fcc-TiCxN1−x. Only with such a JCPDF data file is it possible to obtain a better XRD analysis and texture information of Ti1−xAlxN-based materials. Therefore, our aim is to provide reliable XRD data suited for a JCPDF card based on a fcc-Ti1−xAlxN powder prepared by CVD.

2. Materials and Methods

2.1. Coating Deposition and Powder Preparation

A thick Ti1−xAlxN coating was deposited by Low Pressure CVD (LPCVD) in a laboratory scale system using a gaseous mixture of 0.2 vol.% TiCl4; 0.9 vol.% AlCl3; 4.5 vol.% NH3; 9.1 vol.% N2; 67.1 vol.% H2 and 18.2 vol.% Ar, at a moderate temperature of 800 °C and a pressure of 1 kPa. These process conditions were chosen for preparing a single-phase fcc-Ti1−xAlxN coating with high purity. The horizontal hot wall reactor made of Inconel had an inner diameter of 79 mm. The substrate temperature was controlled by a K thermocouple. Metal chlorides and ammonia were introduced by separate gas inlets to avoid complex formation. TiCl4 vapor was fed from a bubbler controlled at 60 °C and the delivery of AlCl3 occurred through a reaction of aluminum chips with HCl at 350 °C. The mixing of both gas streams occurred near the deposition zone. The applied gases had a purity of 99.999% for Ar, N2 and HCl, 99.995% for NH3 and 99.9% for H2, which was further cleaned using an Oxisorb cartridge. The purity of TiCl4 was about 99% and that of the aluminum chips was 99.98%. A mild steel foil of 50 mm × 50 mm was used as the substrate. Additionally, two cemented carbide substrates with 6% Co (WC grain size of 1 µm, geometry SNUN120408) were coated in the same CVD process. These inserts were placed behind the steel foil. After 2 h, a Ti1−xAlxN layer of about 10 µm thickness was formed. Following this, the carrier foil of the Ti1−xAlxN coating was dissolved in diluted nitric acid, at the Montan University Leoben, and the remaining flakes of the free-standing Ti1−xAlxN layer were processed further to a powder. The powder was produced by pulverizing with an agate mortar.

2.2. Coating and Powder Analysis

The coating thickness on the WC-Co substrates was measured using a calo test. Following this, the Ti1−xAlxN coating was analyzed by means of X-ray diffraction using the glancing incidence technique (XRD-Seifert-FPM 3003TT) and a stress-free lattice constant was determined by the sin2ψ method. X-ray diffraction analyses were performed with Cu-Kα radiation. Glancing incidence XRD was carried out using a flat angle of 3°. The measurements of the detached coatings after pulverizing were carried out in a Bragg–Brentano diffractometer using a D8 Advance (Bruker AXS, Karlsruhe, Germany) with Cu-Kα radiation and a position sensitive detector. A flake of the free-standing Ti1−xAlxN layer was further characterized through field emission scanning electron microscopy (FESEM-Ultra 55 Carl Zeiss, Oberkochen, Germany), wavelength dispersive X-ray spectroscopy (WDS-Oxford Wave SDD detector, Oxford Instruments, Abingdon, UK) and energy dispersive X-ray spectroscopy (EDS-XMAX 80 Oxford Instruments). The same flake of the free-standing Ti1−xAlxN layer was further analyzed using high-resolution transmission electron microscopy combined with selected area electron diffraction (SAED–HRTEM) at the Montan University Leoben. The TEM sample was mechanically polished, dimple grinded and, finally, ion milled using a Gatan PIPS system. The microscopy analysis was performed using a JEOL JEM-2100F TEM system operated at 200 keV with a 0.7 nm spot size.

3. Results and Discussion

3.1. Analysis of the Ti1−xAlxN Coating

3.1.1. Thickness of the Ti1−xAlxN Coating

One of the Ti1−xAlxN coatings on the WC-Co substrates deposited simultaneously in the same CVD process was analyzed using a calo test. Figure 1 shows the calotte section. The Ti1−xAlxN coating on the WC-Co substrate had a thickness of 9.6 µm. Therefore, we assumed the same thickness for the mild steel foil which was used for the production of the Ti1−xAlxN powder. The calotte section shows a homogeneous gray Ti1−xAlxN coating of high quality.

3.1.2. X-ray Analysis of the Ti1−xAlxN Coating

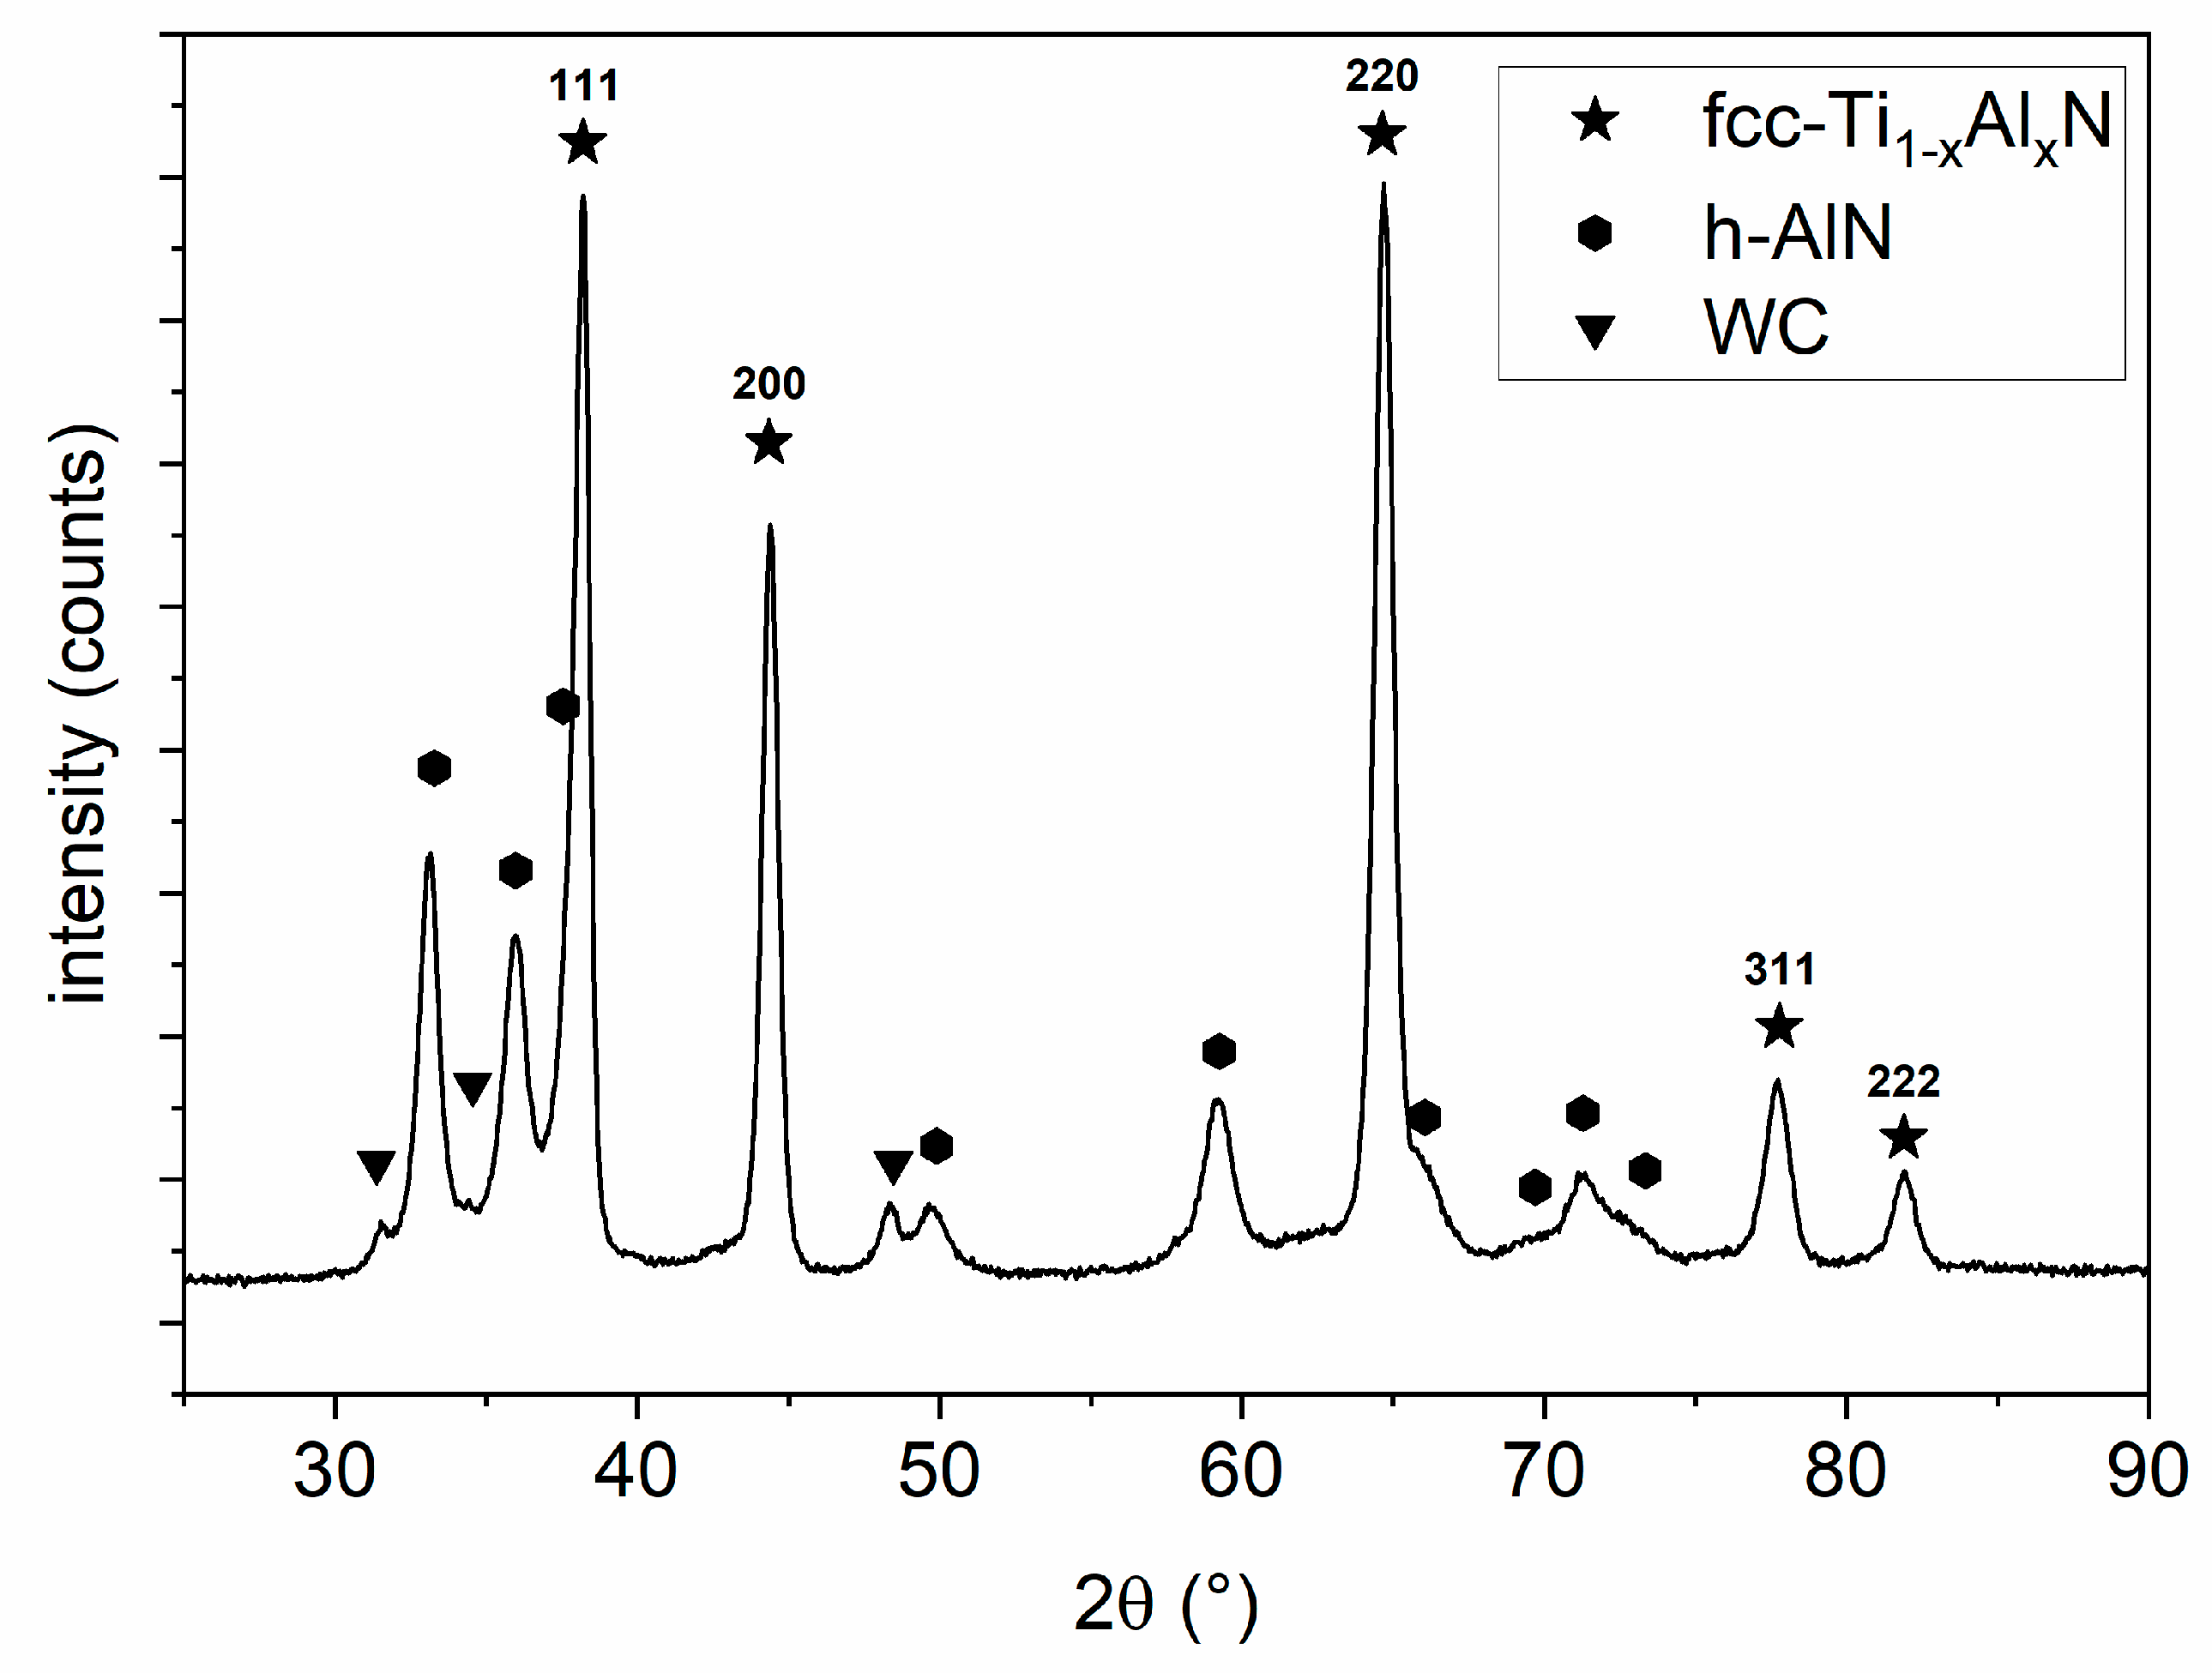
The Ti1−xAlxN coating on the WC-Co substrate was examined using X-ray analysis. Figure 2 presents the XRD diffractogram.
The XRD diffractogram of the Ti1−xAlxN coating on the WC-Co substrate shows the peaks of the fcc-Ti1−xAlxN phase, as well as a substantial fraction of about 15 wt.% hexagonal AlN. This points to an increasing phase fraction of hexagonal AlN caused by a depletion of the titanium-containing reactants in the direction of the flow of gas. This means that a pure fcc-Ti1−xAlxN phase is only obtained in the front and middle parts of the steel foil. This is shown later by the analyses under point 3.2. A stress-free lattice constant of the fcc-Ti1−xAlxN phase was determined by means of the sin2 ψ method according to Equation (1), as the lattice constant depends on intrinsic stress within the layer.
a ψ   = a 0 { σ E · [ ( 1 + ν ) sin 2 ψ 2 ν ] + 1 }
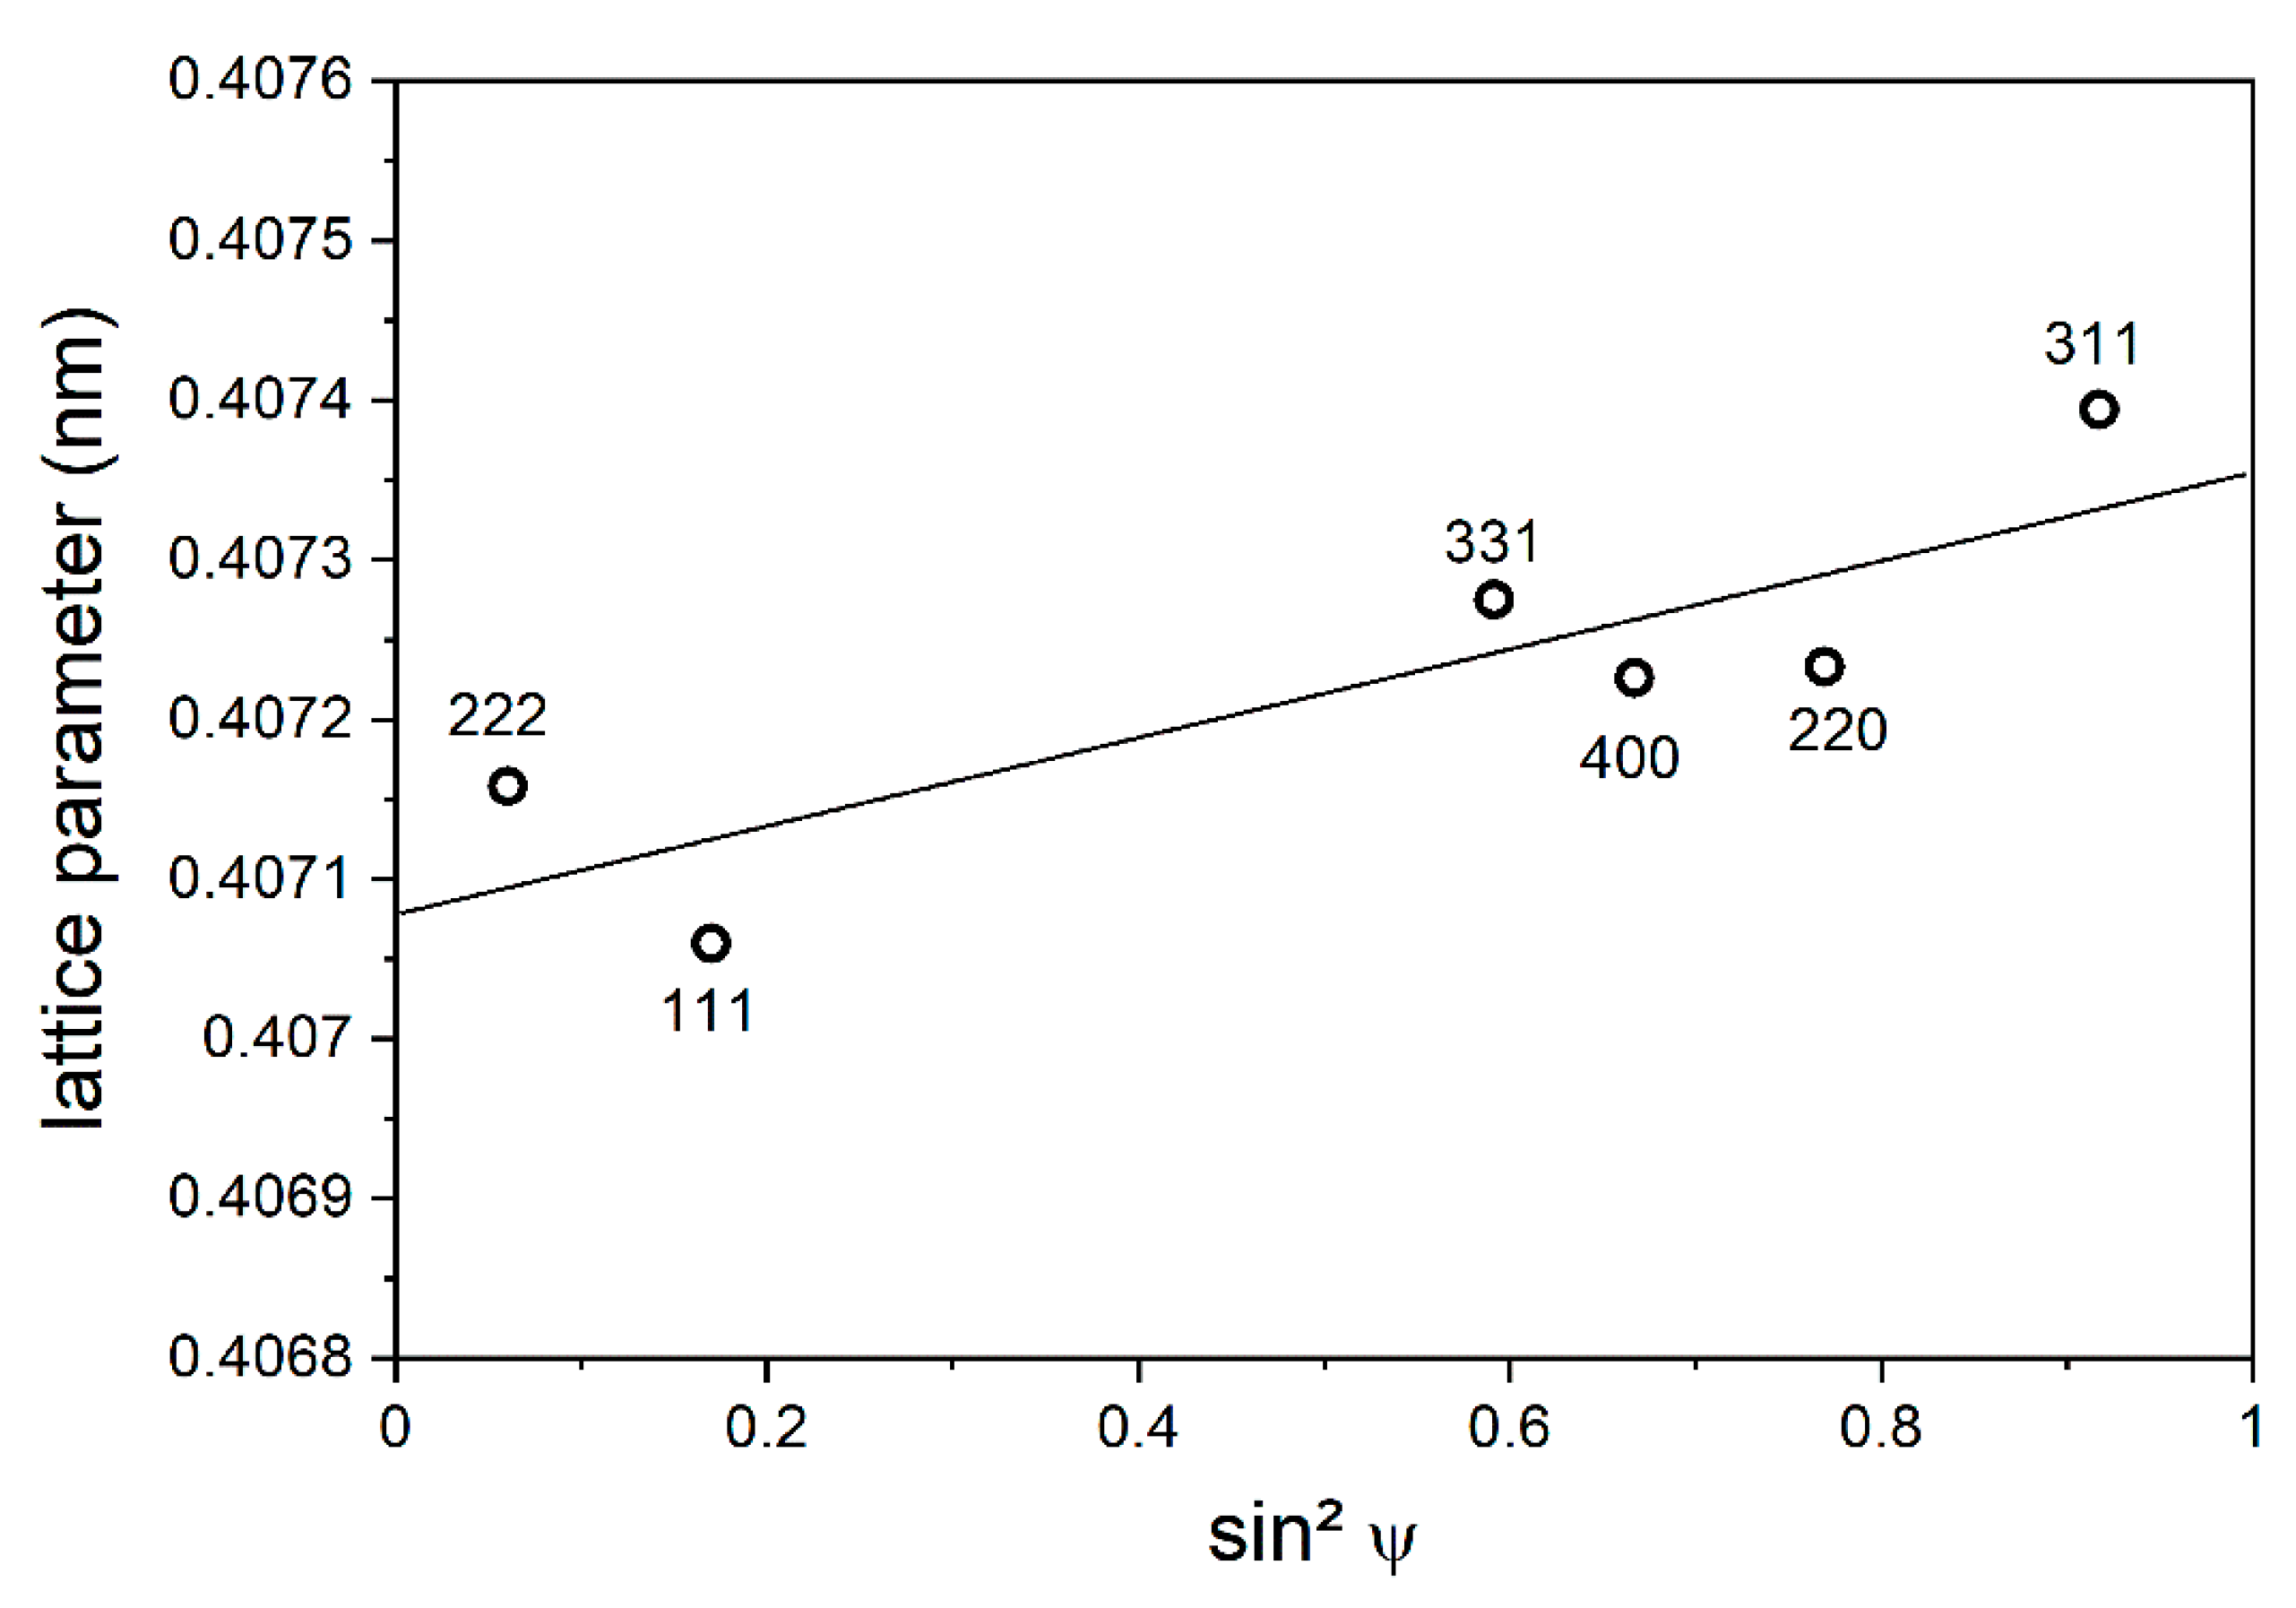
The estimated tensile stress in the coating was 504 MPa. Figure 3 presents this dependence of the lattice constant on sin2ψ. A value of the stress-free lattice constant a0 = 0.407192 nm is obtained. A Young’s modulus of 535 GPa and a Poisson’s ratio of 0.3 were used for this calculation.
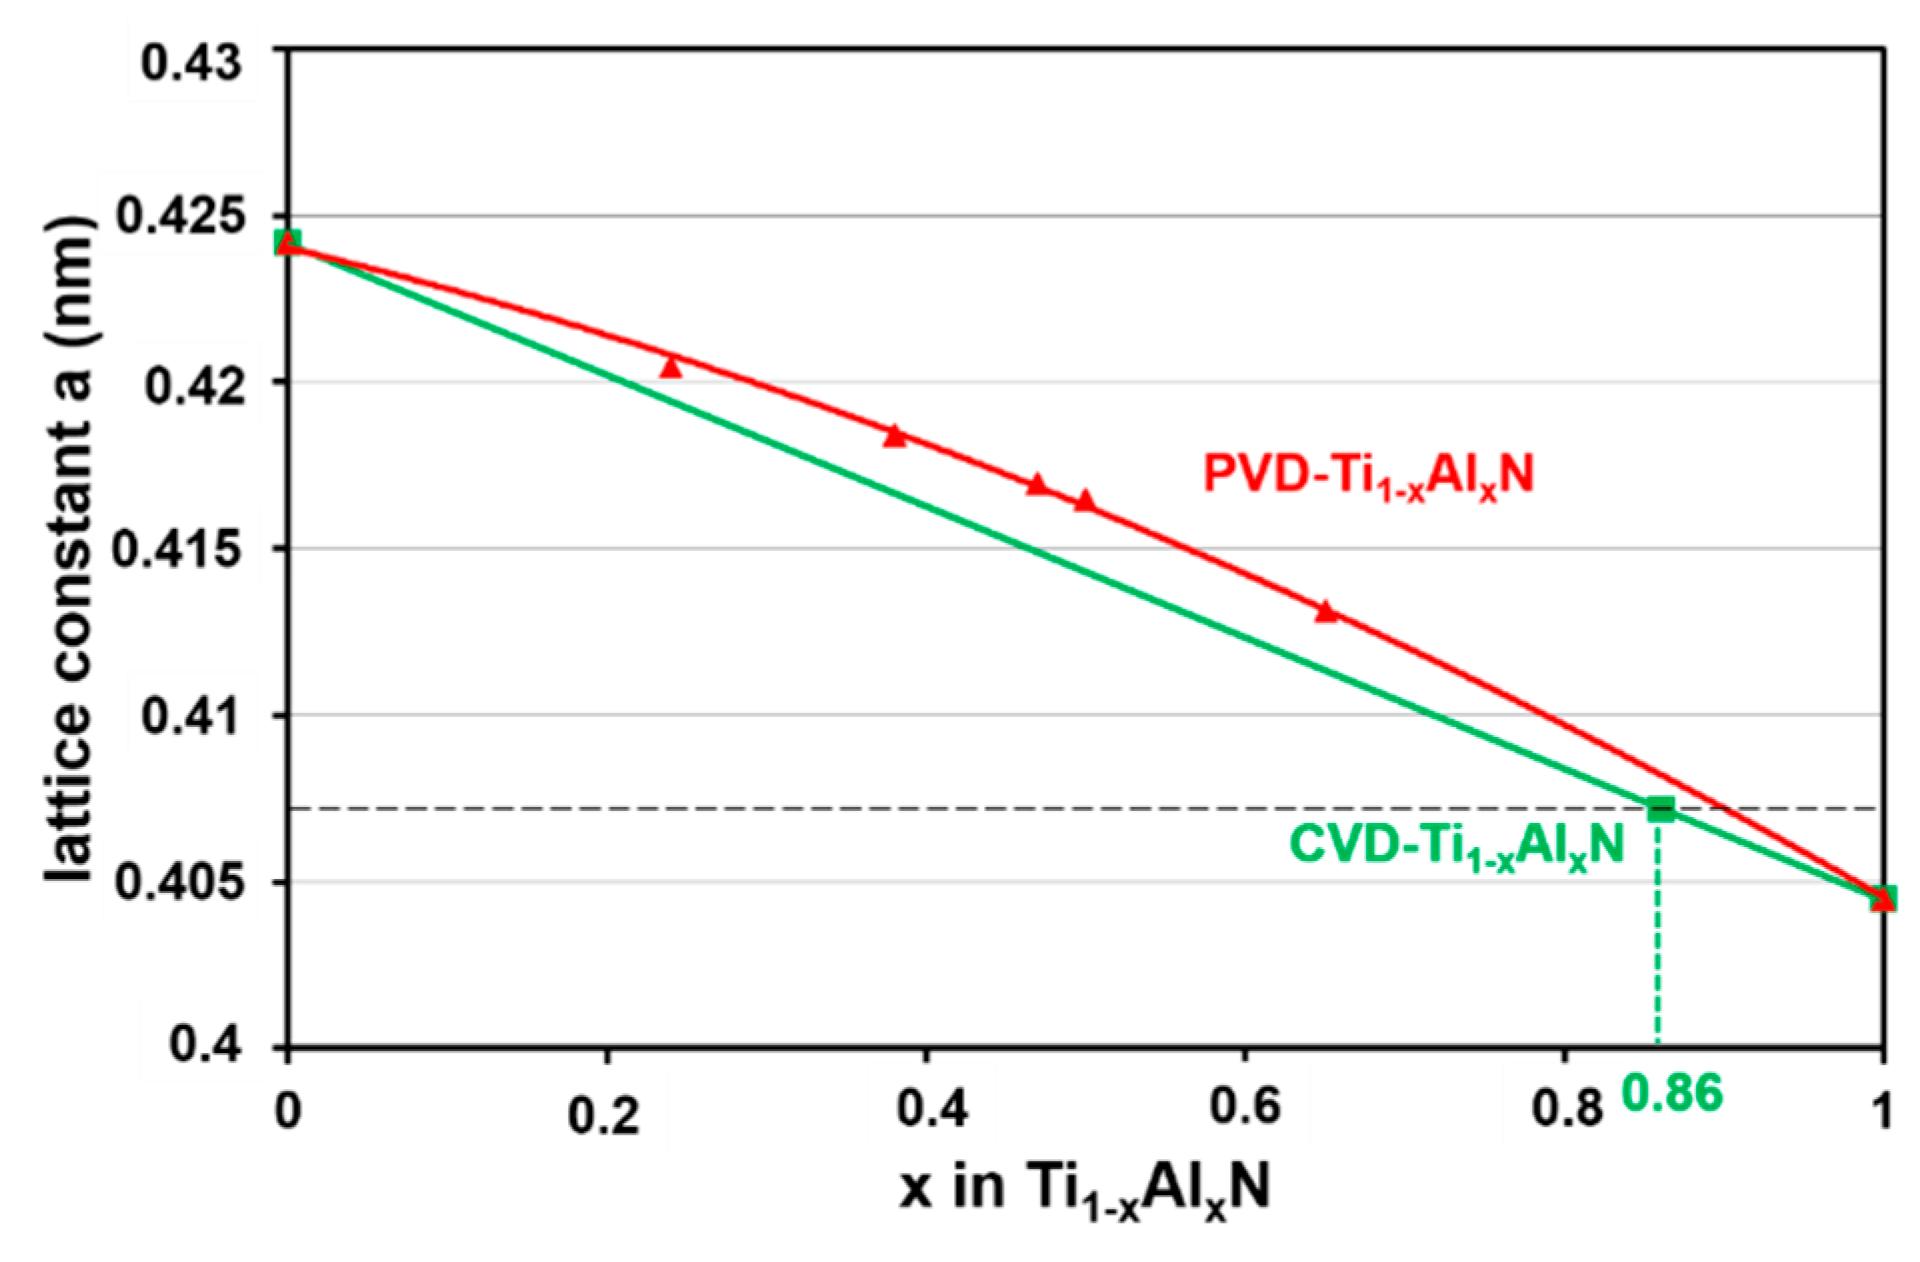
The stoichiometric coefficient x of the fcc-Ti1−xAlxN phase in the coating was estimated using Vegard’s law (see Figure 4). In Figure 4, the lattice constants of the binary systems fcc-TiN and fcc-AlN are applied according to the JCPDF cards 00-38-1420 [13] and 00-046-1200 [11], respectively. In the literature, another lattice constant (a = 0.408 nm) for fcc-AlN is often used [3,14], which is derived from studies on superlattice structures [14]. However, this value is too high and should not be applied because recent high-pressure investigations [15] confirm the value of JCPDF card 00-046-1200. A lattice parameter of a = 0.4046 nm was determined [15]. If strong linear behavior is assumed according to Vegard’s law, then the following linear equation can be derived:
a (nm) = 0.4242 − 0.0197x
The green line in Figure 4 represents this linear behavior and an x-value of 0.86 would result from the CVD layer in this work. Furthermore, experimental values of different PVD coatings are also inserted in Figure 4. Only literature data involving stress-free lattice constants [16,17] and powder diffraction measurement data [18] were used. PVD coatings often have noticeable compressive stress which changes the lattice parameters. Such uncorrected lattice parameters should not be applied for the discussion of a Vegard-like dependence. Considering these inserted data, strong linear behavior cannot be assumed.
A convex deviation is apparent. Using the data from the PVD layers, the following regression equation can be derived for Vegard-like behavior in the ternary compound fcc-Ti1−xAlxN:
a (nm) = 0.424 − 0.0115x − 0.0079x2
In this case, the calculated x value for the CVD Ti1−xAlxN layer in this work would be 0.9. This indicates that the true value of x lies in the range between 0.86 and 0.9.

3.2. Microstructure, Composition and X-ray Analysis of the Ti1−xAlxN Powder

3.2.1. Microstructure of the Ti1−xAlxN Powder

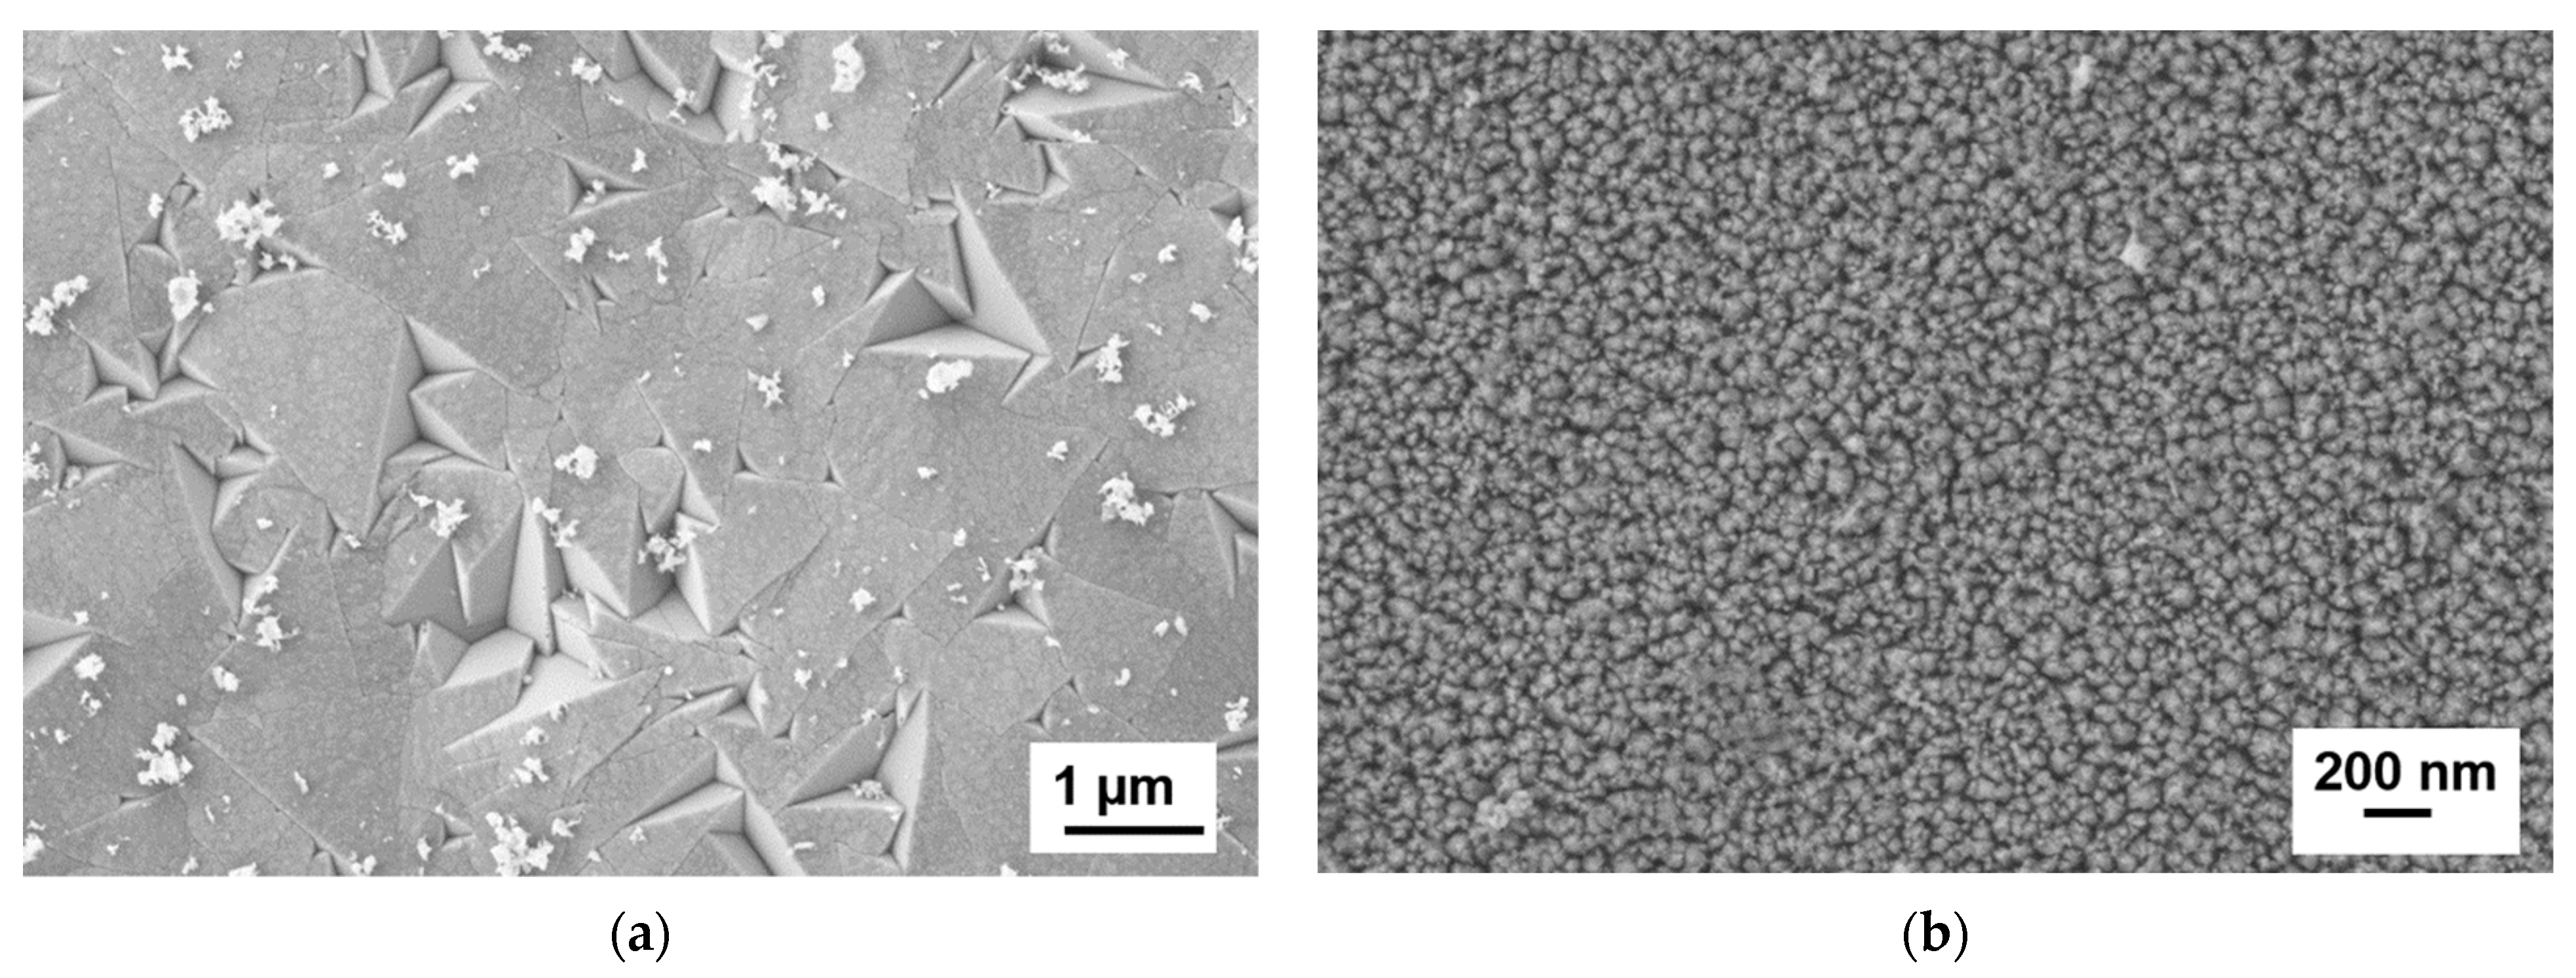
The Ti1−xAlxN coating on the mild steel foil was the basis for the powder production. After etching the steel foil, flakes of the free-standing Ti1−xAlxN layer were obtained. Figure 5 shows the top and bottom sides of a flake of this free-standing layer. The top side represents the surface side and the bottom side represents the former substrate side.
The bottom side has a nanocrystalline structure and the top side (the surface side) shows crystal sizes in the µm range due to the selection of crystal orientations during layer growth and subsequent texture formation. This structure indicates a zone where only the pure fcc-Ti1−xAlxN phase exists. This was confirmed by the subsequent SAED–HRTEM investigation at the same flake from the free-standing Ti1−xAlxN layer. The sample was analyzed using the plan-view mode.
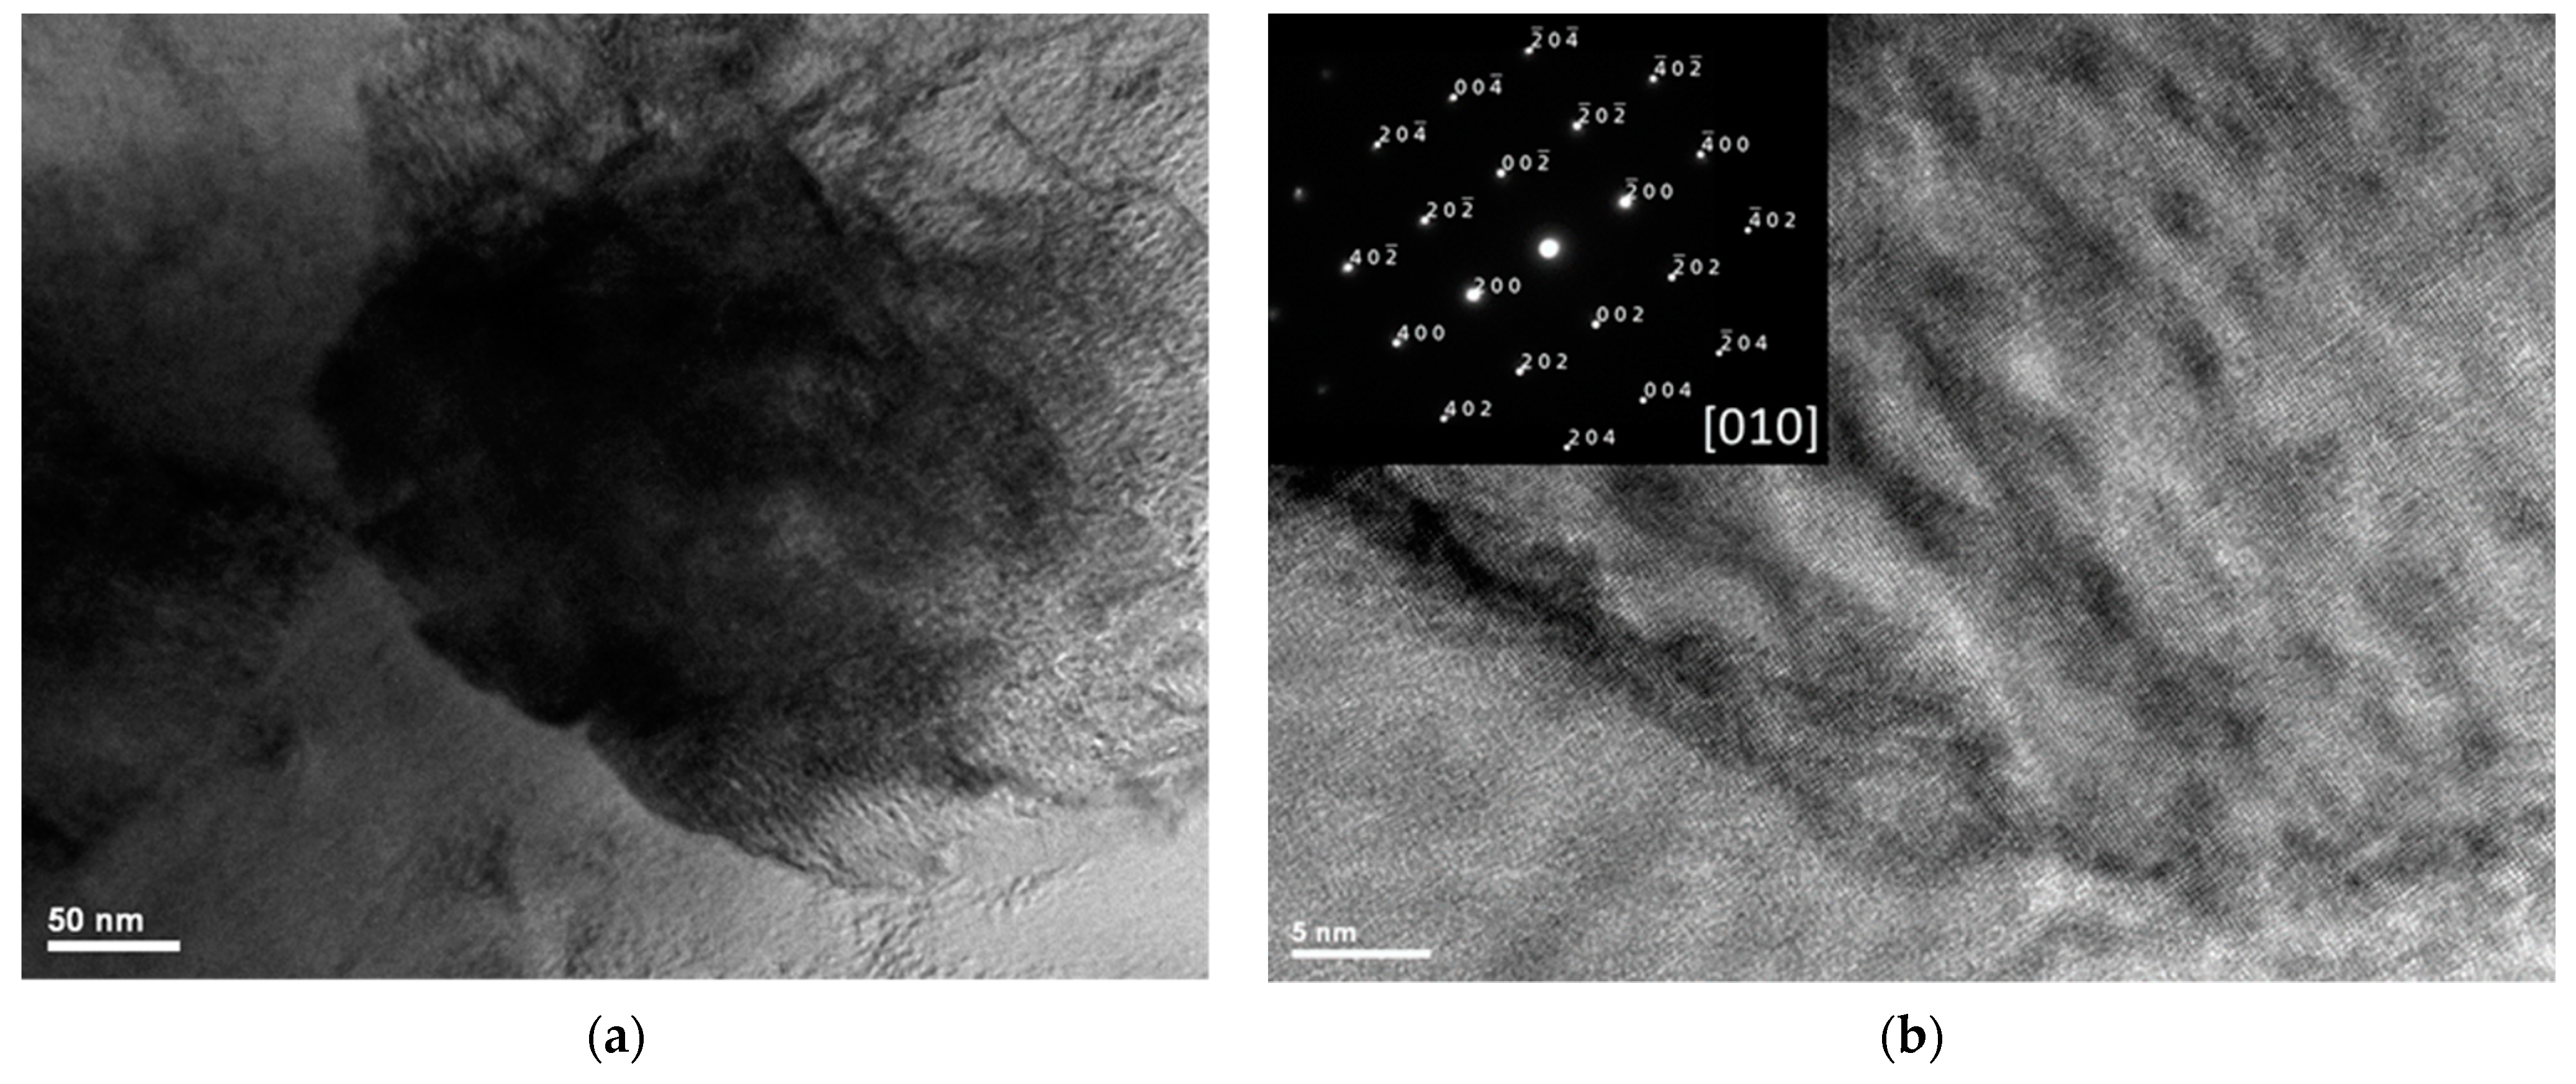
Figure 6 shows HRTEM images of a large Ti1−xAlxN grain in two magnifications. The microstructure analysis revealed that the structure of the sample is polycrystalline. There is no indication of another phase. The SAED–HRTEM analysis shows an fcc phase with a lattice parameter of ∼0.403 nm. Furthermore, the analysis of the grain in Figure 6 confirms [010] the orientation and shows structure faults as dislocations or dislocation loops.
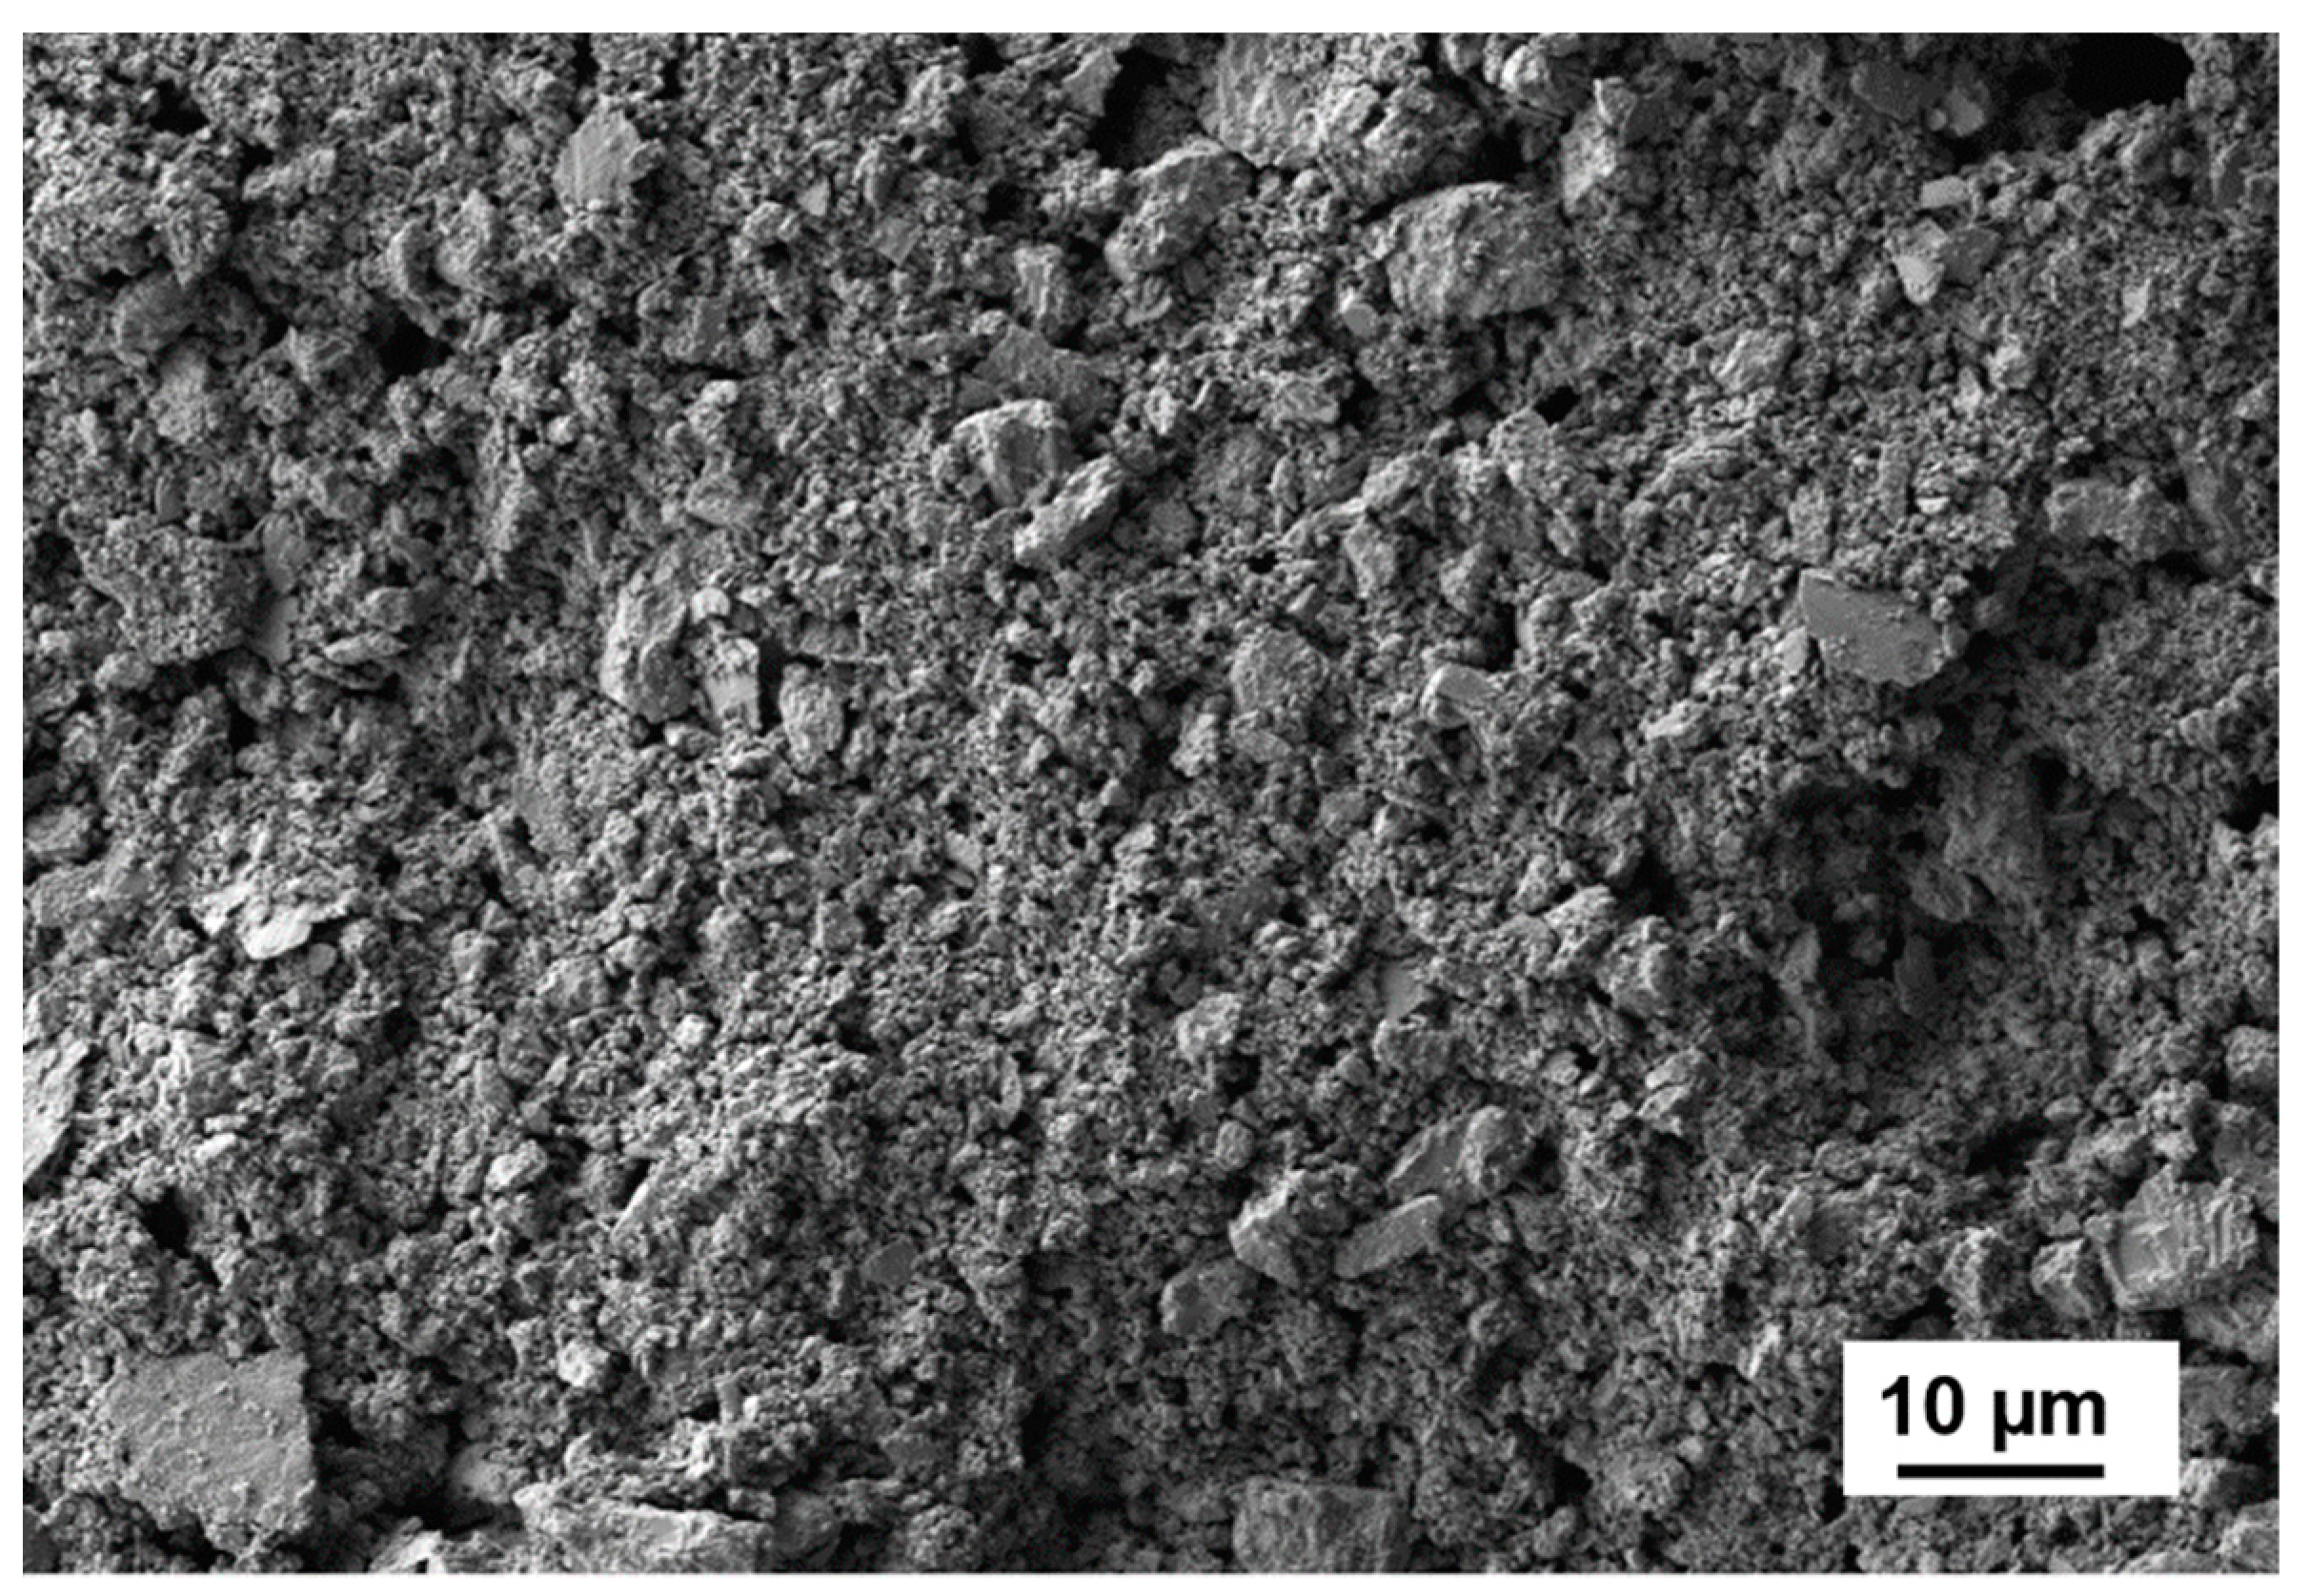
The flakes of the free-standing Ti1−xAlxN layer were ground in an agate mortar to a very fine-grained powder of <10 µm in order to avoid the texture effects caused by the layer growth. This powder has proved to be a good starting basis for the X-ray analysis described below. Figure 7 presents a SEM image of this fine-grained powder.

3.2.2. Composition of the Ti1−xAlxN Powder

The composition of the Ti1−xAlxN powder was investigated using a combination of WDS and EDS on the flake of the free-standing layer used for SEM and SAED–HRTEM investigation. The flake was ion polished to remove surface contamination prior to analyses. Table 1 shows that the elemental analysis on both sides of the Ti1−xAlxN flakes reveal a high agreement of the elemental concentrations and the stoichiometric coefficients x, having values of 0.87 and 0.88.
There is also good agreement with the stoichiometric coefficient of the fcc-Ti1−xAlxN phase in the coating, which is derived according to Vegard’s law in Section 3.1.2.

3.2.3. X-ray Analysis of the Ti1−xAlxN Powder

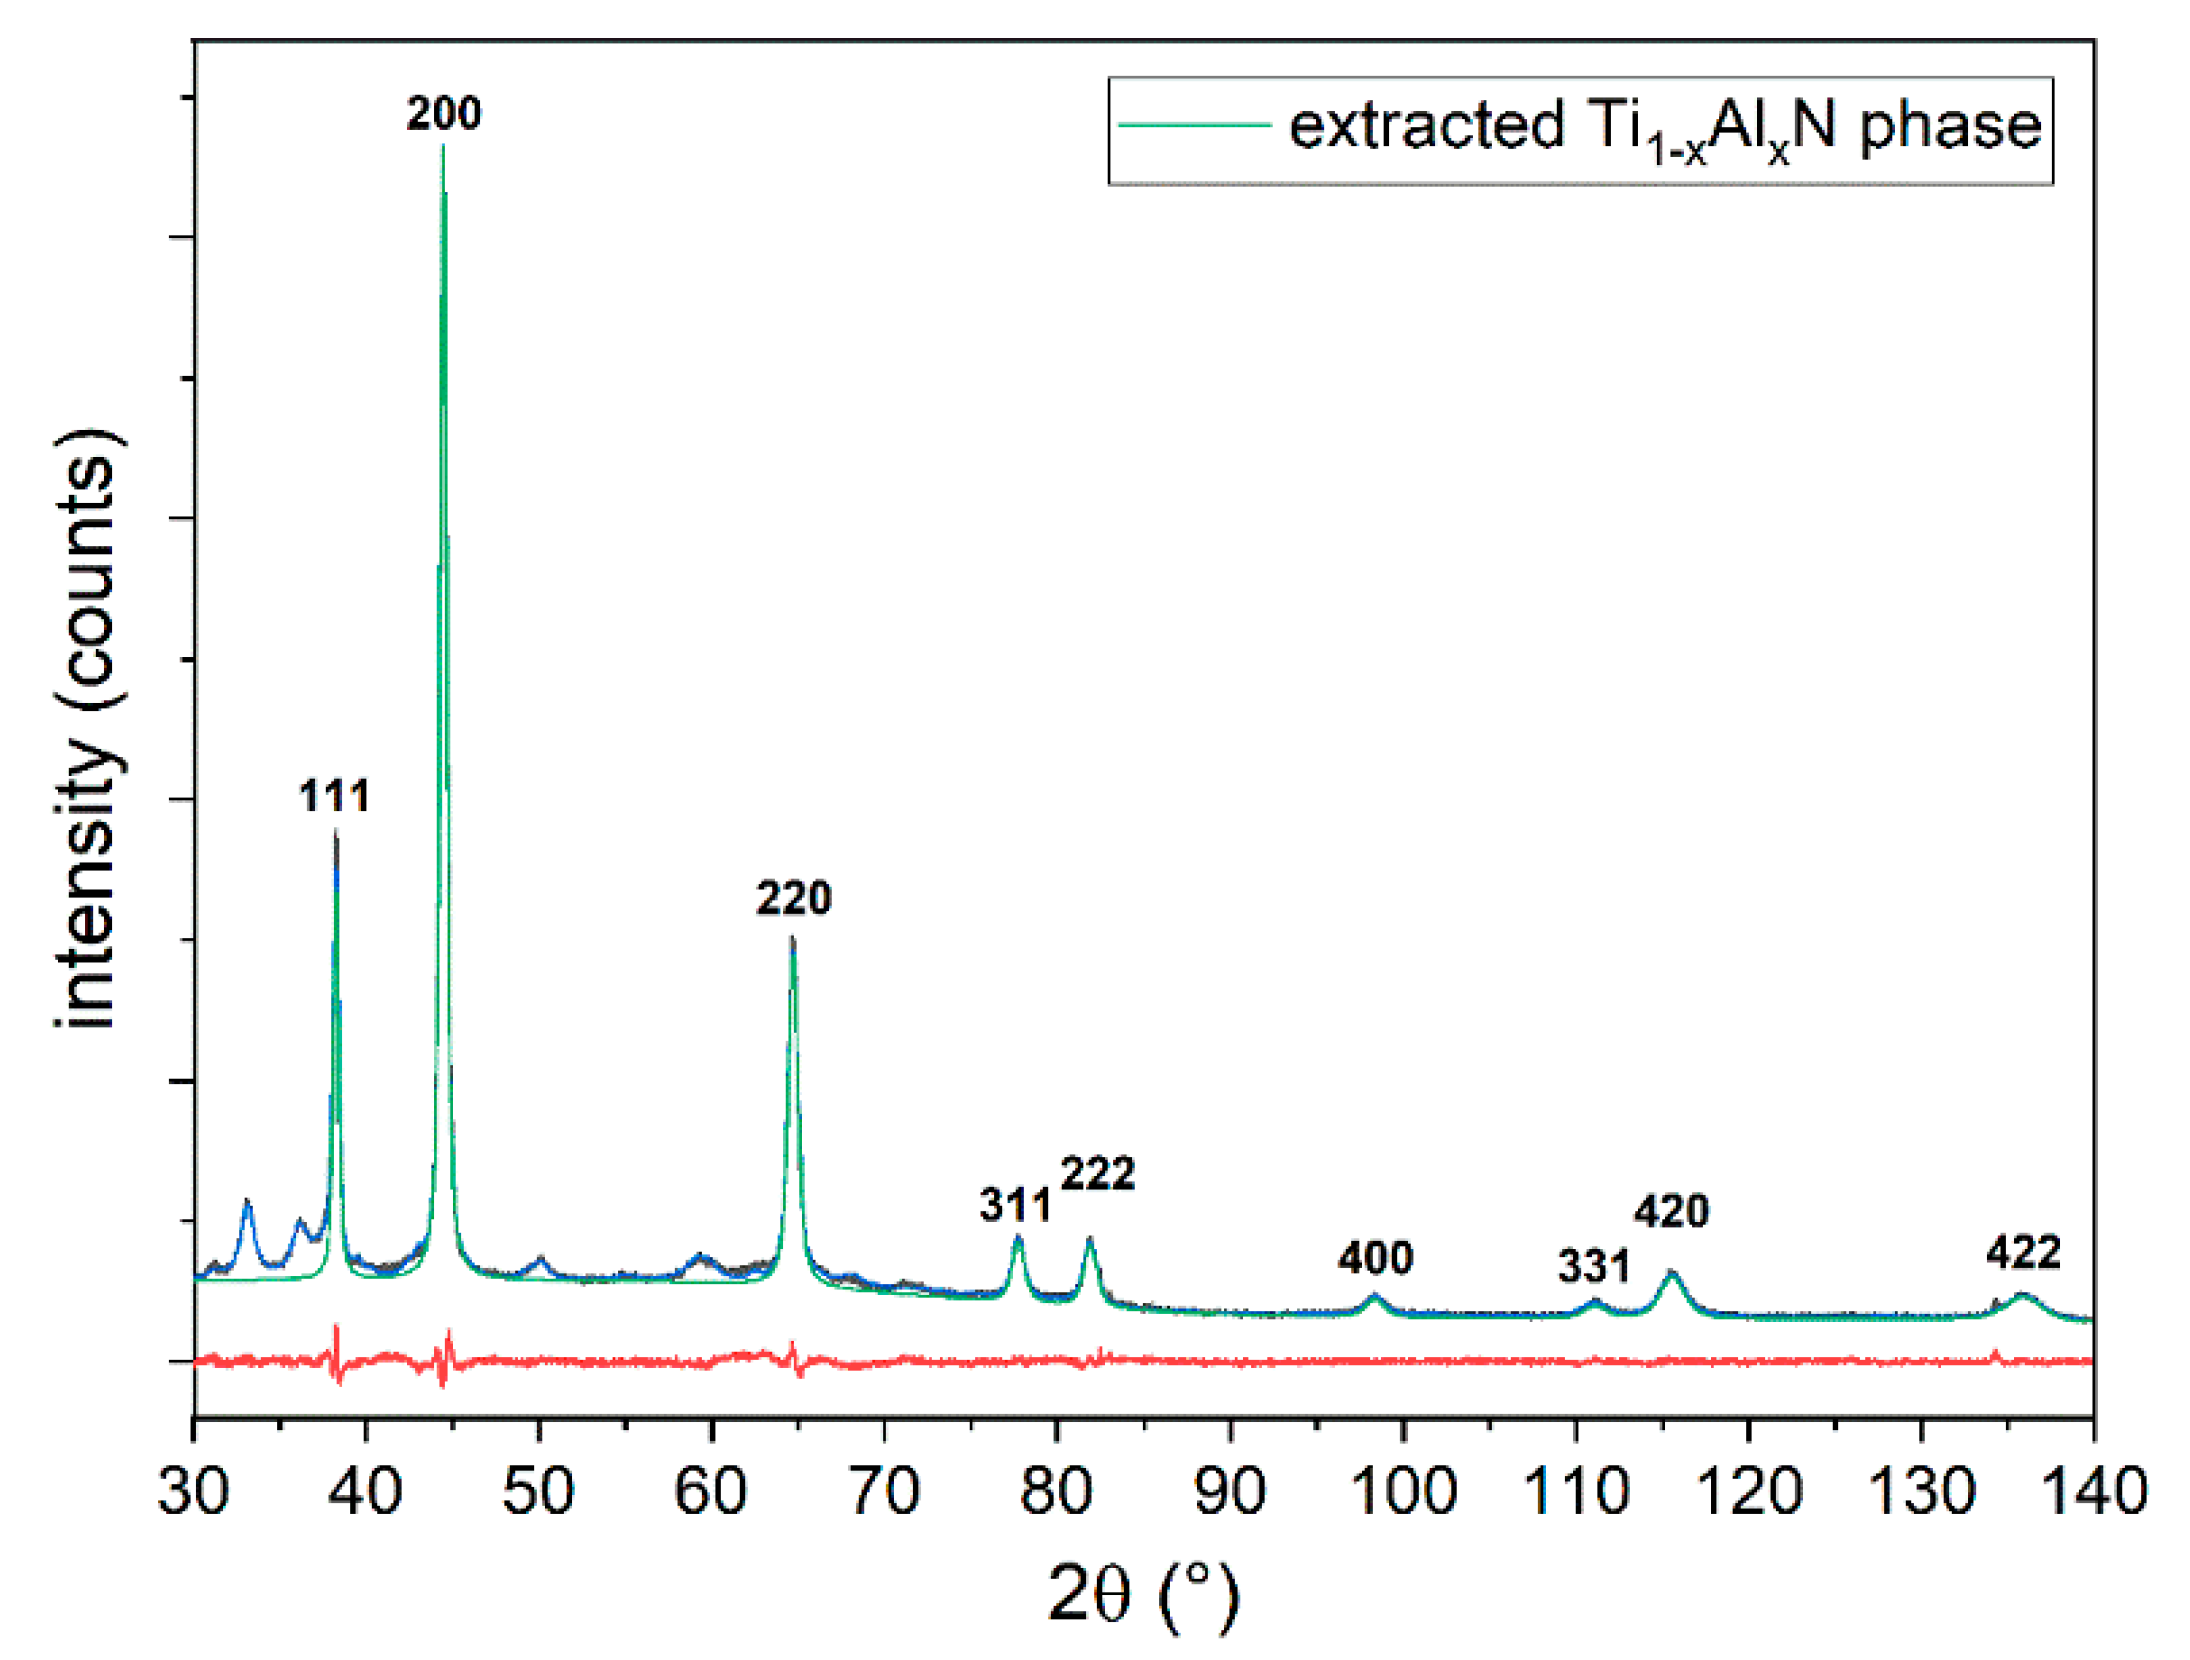
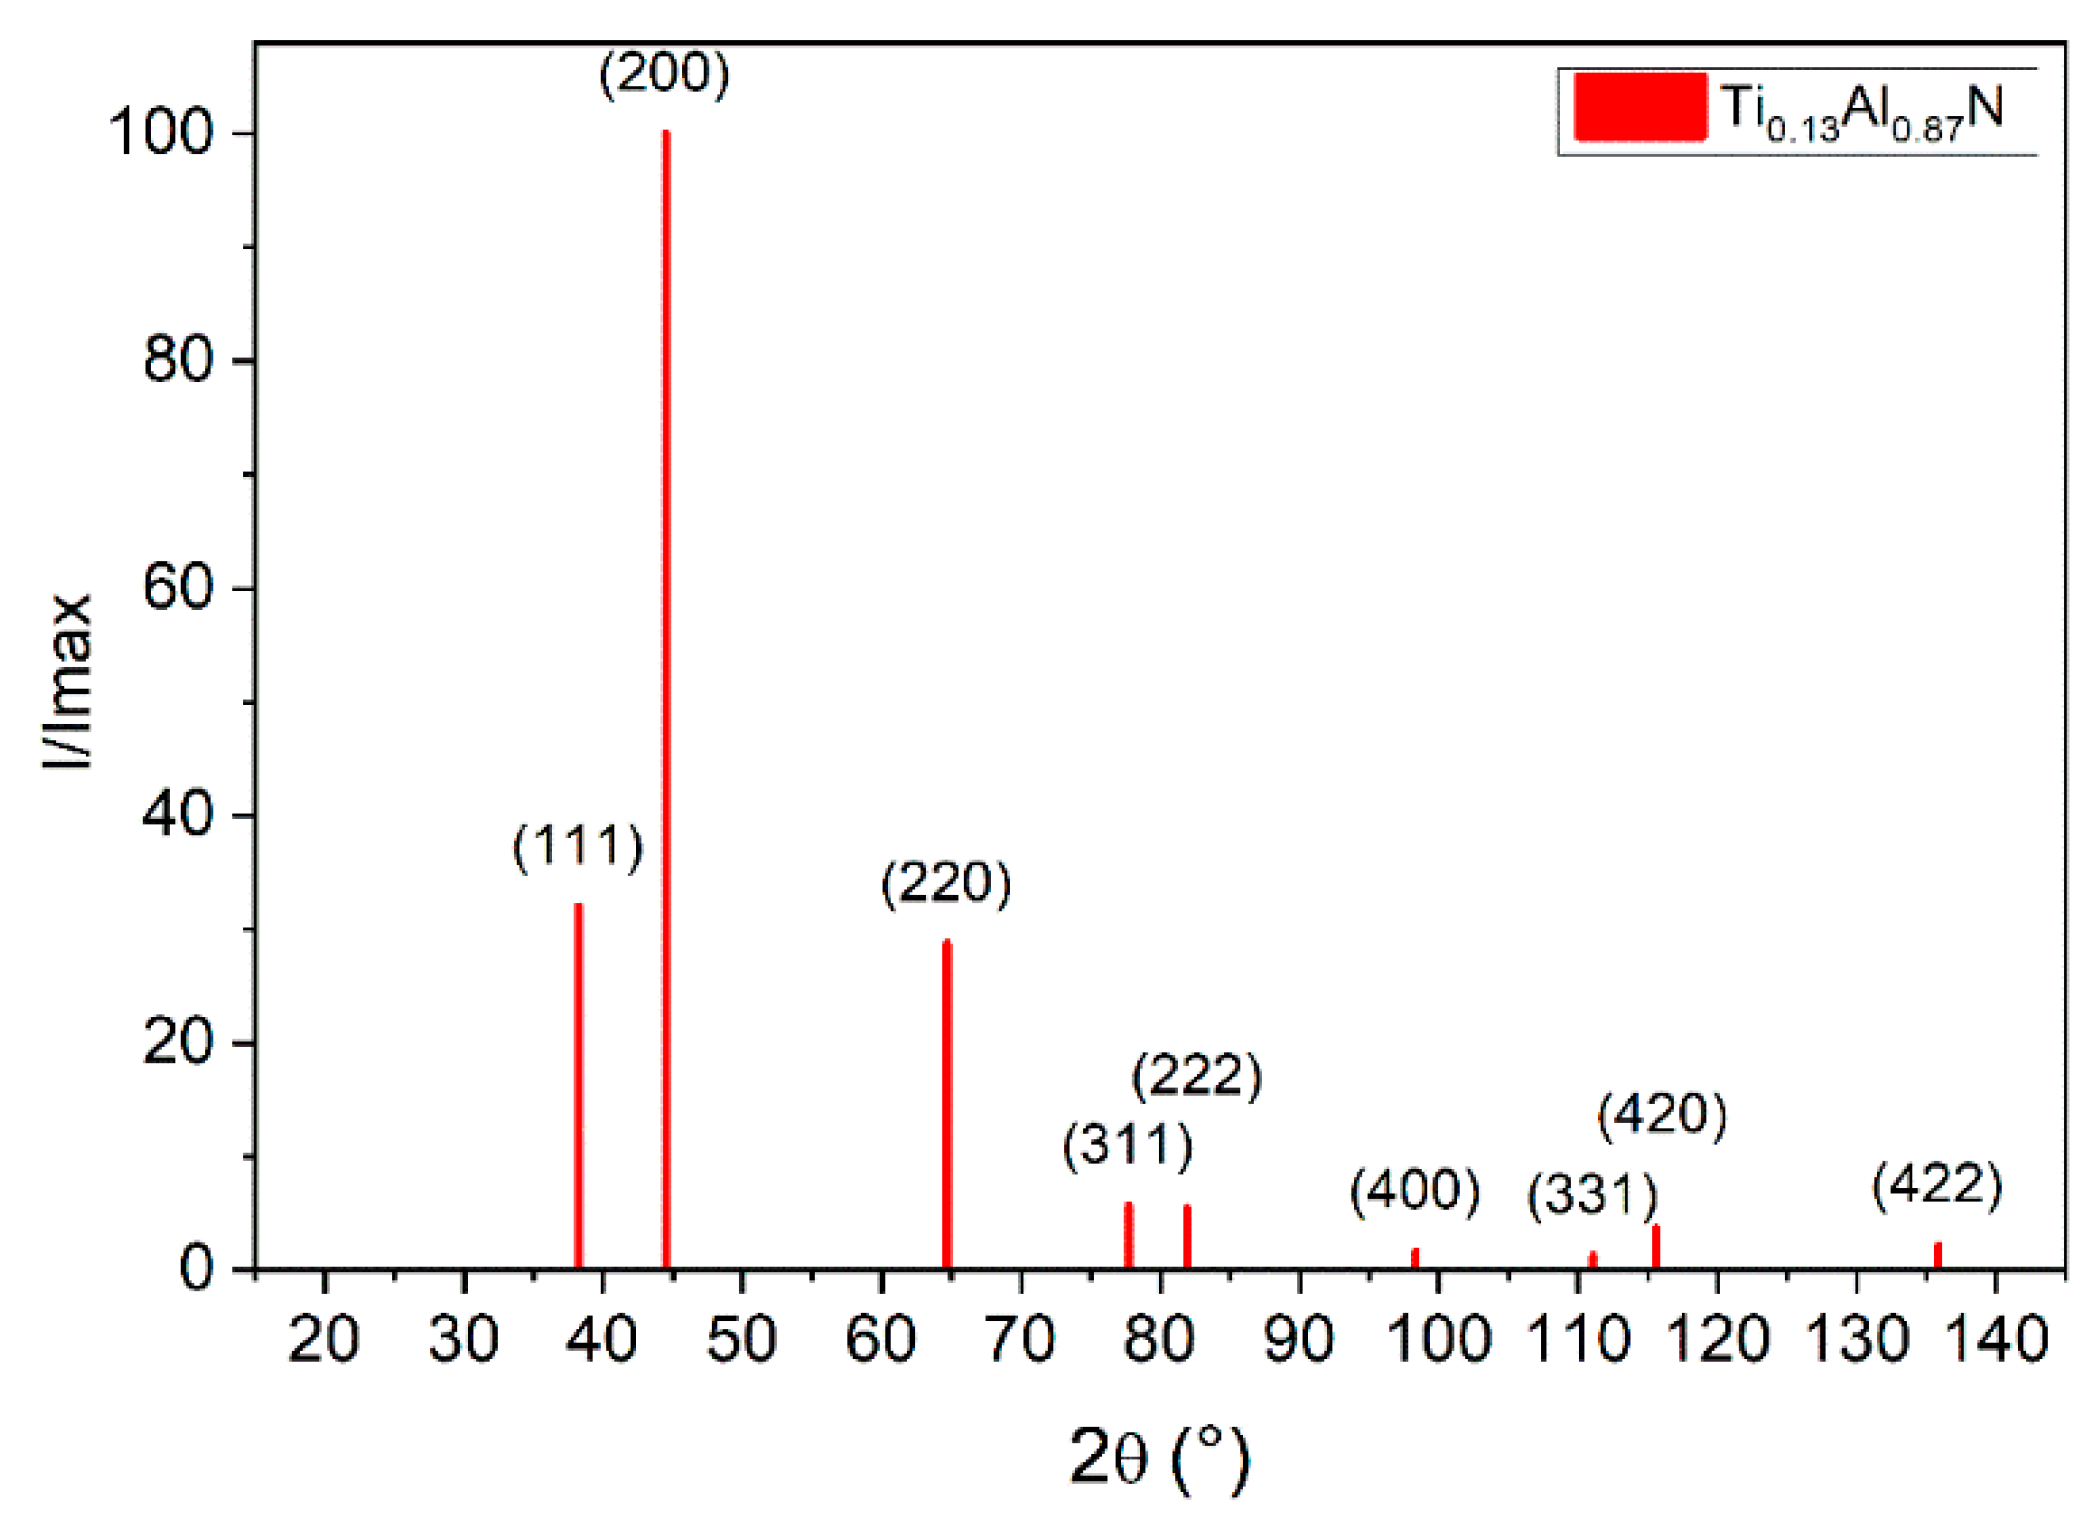
The Ti1−xAlxN powder was prepared in a low background silicon holder and the obtained sample was analyzed in the X-ray diffractometer. Figure 8 shows the original powder diffractogram and the extracted XRD diffractogram of the fcc-Ti1−xAlxN phase. A Rietveld analysis was conducted to obtain a quantitative description of the purity. The powder contained about 88% fcc-Ti1−xAlxN phase, which is an excellent starting point for the subsequent analyses. The extracted diffractogram was transformed in a normalized XRD diffractogram corresponding with the requirements of the JCPDF card. Figure 9 and Table 2 present the basic data for a powder diffraction file of a fcc-Ti1−xAlxN powder with x = 0.87. For the completion of the data file, a stress-free lattice constant of the powder sample was determined. A value of a = 0.407168 nm was obtained for the fcc-Ti1−xAlxN phase. A comparison with the data of the Ti1−xAlxN coating of chapter 3.1 demonstrates a very good agreement between both lattice constants.

4. Conclusions

A Ti1−xAlxN coating of about 10 µm thick was deposited on WC-Co inserts and on mild steel foil through CVD. The coating on the steel foil was used to produce a Ti1−xAlxN powder, after etching the foil. The coating and the powder were characterized by XRD, SEM, SAED–HRTEM, WDS and EDS. The analyses show that the content of the hexagonal AlN phase increases in the direction of the flow of gas in the CVD reactor. Nevertheless, the coating on the mild steel foil has large areas consisting of only the pure fcc-Ti1−xAlxN phase shown by SEM and SAED–HRTEM analyses on a flake of the free-standing layer. The composition of the powder was analyzed using the Rietveld method and it consisted of 88% fcc-Ti1−xAlxN. The high purity of the powder was an excellent starting point for determining the lattice constant and the X-ray diffractogram of fcc-Ti1−xAlxN. The stoichiometric coefficient x was determined on a flake consisting of pure fcc-Ti1−xAlxN. A value x = 0.87 was determined and it agrees well with the value of the coating on the WC-Co substrate, where x = 0.86 was obtained using Vegard’s law. Additionally, there is excellent agreement between the lattice constant of the fcc-Ti1−xAlxN powder and the stress-free lattice constant of the coating on the cemented carbide inserts, with values of a = 0.407168 nm and ao = 0.407192 nm, respectively. The X-ray diffractogram of the pure fcc-Ti1−xAlxN phase could be extracted and, finally, a powder diffraction file was created that was suitable for a JCPDF card.

Author Contributions

Conceptualization, I.E., M.H. and R.P.; methodology, I.E., M.H., B.M., R.P., J.Z. and J.K.; software, B.M. and J.Z.; validation, B.M., M.H., R.P. and J.K.; formal analysis, B.M., M.H. and J.Z.; investigation, M.H., B.M., J.Z. and J.K.; resources, I.E. and R.P.; data curation, B.M. and J.K.; writing—original draft preparation, I.E.; writing—review and editing, B.M., J.K. and R.P.; visualization, B.M. and J.Z.; supervision, I.E. and R.P.; project administration, I.E.; funding acquisition, I.E. and R.P. All authors have read and agreed to the published version of the manuscript.

Funding

This research was funded by the company Boehlerit GmbH & Co. KG, Kapfenberg, Austria. A part of this work was funded by Österreichische Forschungsförderungsgesellschaft mbH (FFG), Project No. 864828, “Tough_TiAlN”.

Institutional Review Board Statement

Not applicable.

Informed Consent Statement

Not applicable.

Data Availability Statement

The data presented in this study are available on request from the corresponding author.

Acknowledgments

The authors want to thank Kerstin Sempf for preparing the WDS and EDS analyses.

Conflicts of Interest

The authors declare no conflict of interest.

References

  1. Knotek, O.; Böhmer, M.; Leyendecker, T. On structure and properties of sputtered Ti and Al based hard compound films. J. Vac. Sci. Technol. A 1986, 4, 2695–2700. [Google Scholar] [CrossRef]
  2. PalDey, S.; Deevi, S.C. Single layer and multilayer wear resistant coatings of (Ti,Al)N: A review. Mat. Sci. Eng. A 2003, 342, 58–79. [Google Scholar] [CrossRef]
  3. Cremer, R.; Witthaut, M.; von Richthofen, A.; Neuschütz, D. Determination of the cubic to hexagonal structure transition in the metastable system TiN-AlN, Fresenius. J. Anal. Chem. 1998, 361, 642–645. [Google Scholar]
  4. Rafaja, D.; Šıma, M.; Klemm, V.; Schreiber, G.; Heger, D.; Havela, L.; Kužel, R. X-ray diffraction on nanocrystalline Ti1−xAlxN thin films. J. Alloys Comp. 2004, 378, 107–111. [Google Scholar] [CrossRef]
  5. Endler, I.; Höhn, M.; Herrmann, M.; Pitonak, R.; Ruppi, S.; Schneider, M.; van den Berg, H.; Westphal, H. Novel aluminum-rich Ti1−xAlxN coatings by LPCVD. Surf. Coat. Technol. 2008, 203, 530–533. [Google Scholar] [CrossRef]
  6. Pitonak, R.; Köpf, A.; Weißenbacher, R.; Keckes, J.; Stefenelli, M.; Todt, J.; Endler, I.; Höhn, M. Novel TiAlN coating by Medium Temperature Low Pressure CVD. In Proceedings of the 18th Plansee Seminar, Reutte, Austria, 3–7 June 2013. HM 37/1-37/12. [Google Scholar]
  7. Czettl, C.; Schleinkofer, U.; Schedle, F.; Wolf, C.; Lechleitner, M.; Holzschuh, H.; Bürgin, W. CVD TiAlN – Development and challenges for use in mass production History and development of CVD-TiAlN. In Proceedings of the 19th Plansee Seminar, Reutte, Austria, 29 May–2 June 2017. HM 45/1-45/13. [Google Scholar]
  8. PDF Database; The International Centre for Diffraction Data (ICDD): Newton Square, PA, USA.
  9. Gates-Rector, S.D.; Blanton, T.N. The powder diffraction file: A quality materials characterization database. Powder Diffr. 2019, 34, 352–360. [Google Scholar] [CrossRef] [Green Version]
  10. Powder Diffraction File, Int. Centre for Diffraction Data; Newton Square, PN, USA, 2011; file no. 00-025-1495.
  11. Powder Diffraction File, Int. Centre for Diffraction Data; Newton Square, PN, USA, 2019; file no. 00-046-1200.
  12. Vollstädt, H.; Ito, E.; Akaishi, M.; Akimoto, S.; Fukunaga, O. High pressure synthesis of rocksalt type of AlN. Proc. Jpn. Acad. Ser. B Phys. Biol. Sci. 1990, 66, 7–9. [Google Scholar] [CrossRef] [Green Version]
  13. Powder Diffraction File, Int. Centre for Diffraction Data; Newton Square, PN, USA, 2019; file no. 00-038-1420.
  14. Madan, A.; Kim, I.W.; Cheng, S.C.; Yashar, P.; Dravid, V.P.; Barn, S.A. Stabilization of cubic AlN in epitaxial AlN/TiN superlattices. Phys. Rev. Lett. 1997, 78, 1743–1746. [Google Scholar] [CrossRef]
  15. Schwarz, M.R.; Antlauf, M.; Schmerler, S.; Keller, K.; Schlothauer, T.; Kortus, J.; Heide, G.; Kroke, E. Formation and properties of rocksalt-type AlN and implications for high pressure phase relations in the system Si-Al-O-N. High. Press. Res. 2014, 34, 22–38. [Google Scholar] [CrossRef]
  16. Wüstefeld, C.; Rafaja, D.; Dopita, M.; Motylenko, M.; Baehtz, C.; Michotte, C.; Kathrein, M. Decomposition kinetics in Ti1−xAlxN coatings as studied by in-situ X-ray diffraction during annealing. Surf. Coat. Technol. 2011, 206, 1727–1734. [Google Scholar] [CrossRef]
  17. Rafaja, D.; Wüstefeld, C.; Baehtz, C.; Klemm, V.; Dopita, M.; Motylenko, M.; Michotte, C.; Kathrein, M. Effect of internal interfaces on hardness and thermal stability of nanocrystalline Ti0.5Al0.5N coatings. Metall. Mater. Trans. A 2011, 42A, 559–569. [Google Scholar] [CrossRef] [Green Version]
  18. Rogström, L.; Ullbrand, J.; Almer, J.; Hultman, L.; Jansson, B.; Odén, M. Strain evolution during spinodal decomposition of TiAlN thin films. Thin Solid Films 2012, 520, 5542–5549. [Google Scholar] [CrossRef] [Green Version]
Figure 1. Calotte section of the Ti1−xAlxN coating on WC-Co substrate.
Coatings 11 00683 g001
Figure 2. XRD diffractogram (GAXRD, φ = 3°) of the Ti1−xAlxN coating on the WC-Co substrate.
Coatings 11 00683 g002
Figure 3. Dependence of the lattice constant on sin2 ψ for the Ti1−xAlxN coating on WC-Co substrate.
Coatings 11 00683 g003
Figure 4. Lattice constants of fcc-Ti1−xAlxN layers as function of x according to Vegard‘s law for PVD layers and for the fcc-Ti1−xAlxN phase in the CVD layer of this work. The green line shows the linear Vegard’s plot and the red line presents the progression based on experimental data of PVD layers.
Coatings 11 00683 g004
Figure 5. SEM images of a flake of the free-standing Ti1−xAlxN layer: (a) top side; (b) bottom side.
Coatings 11 00683 g005
Figure 6. Bright field images of the structure of the free-standing Ti1−xAlxN layer in plan-view showing: (a) a large grain and (b) HRTEM and SAED image of a large fcc-Ti1−xAlxN crystal in higher resolution.
Coatings 11 00683 g006
Figure 7. SEM image of the Ti1−xAlxN powder after pulverizing in a mortar.
Coatings 11 00683 g007
Figure 8. XRD diffractogram of the Ti1−xAlxN powder sample (blue diffractogram) and extracted XRD diffractogram of the fcc-Ti1−xAlxN phase (green diffractogram). Below the red difference curve of the fitting procedure is given.
Coatings 11 00683 g008
Figure 9. Extracted and normalized XRD diffractogram of the fcc-Ti1−xAlxN powder.
Coatings 11 00683 g009
Table 1. Elemental analysis results on both sides of the flakes of the free-standing Ti1−xAlxN layer using WDS and EDS (flake surface was ion polished before elemental analysis) and calculated for stoichiometric coefficient x.
SampleAl (WDS) at.%Ti (WDS) at.%N (EDS) at.%O (WDS) at.%x
Ti1−xAlxN flake top side43.75.849.90.60.88
Ti1−xAlxN flake bottom side41.06.152.10.80.87
Table 2. Powder diffraction data of the fcc-Ti1−xAlxN powder.
h k lD (Å)2θ (°, Cu Kα)I/Imax (%)M MultiplicityN (h2 + k2 + l2)
1 1 12.3507938.25632.083
2 0 02.0358444.465100.064
2 2 01.4395664.70128.7128
3 1 11.2276677.7255.72411
2 2 21.1753981.8935.5812
4 0 01.0179298.3551.7616
3 3 10.93411111.1031.22419
4 2 00.91046115.5713.72420
4 2 20.83113135.8862.22436
Publisher’s Note: MDPI stays neutral with regard to jurisdictional claims in published maps and institutional affiliations.