Abstract
This paper studied the combined influences of the hot streak and swirl on the cooling performances of the NASA C3X guide vane coated with or without thermal barrier coatings (TBCs). The results show that: (1) Even under uniform velocity inlet conditions, the hot streak core can be stretched as it impinges the leading edge which causes higher heat load on the suction side of the forward portion. (2) The swirl significantly affects circumferential and radial migration of the hot streak core in the NGV passage. On the passage inlet plane, positive swirl leads to a hotter tip region on the suction side. In comparison, negative swirl leads to a hotter hub region on the pressure side. (3) Under the influence of swirl, migration of coolant improves the coverage of film cooling close to the midspan, while in the regions close to the hub and tip end-wall, the overall cooling performance decreases simultaneously. (4) In the regions with enough internal cooling, the cooling effectiveness increment is always larger than that in other regions. Besides, the overall cooling effectiveness increment decreases on the region covered by film cooling for the coated vane, especially in the region with negative local heat flux.
1. Introduction
Gas turbine, as one of the most advanced thermal prime movers, has achieved rapid development in aviation, power generation, shipping, petrochemical and other industries [1]. Because of the continuing demand for improvement of thermal efficiency and power, typical turbine inlet temperatures frequently exceed the highest allowable material temperature of airfoils [2]. Under such harsh running conditions, the turbine vane has to be protected to guarantee safe running conditions [1,2]. Typical advanced cooling techniques include internal cooling, film cooling as well as the use of thermal barrier coatings (TBCs) [3]. In the internal cooling technique, coolant from the last stage of the compressor enters the airfoil from the root, through internal cooling channels and exhaust from the tip to cool down the airfoil [1]. In the film cooling technique, coolant from separate rows of film cooling holes forms a protective layer of film cooling to defend the vane against the onslaught of the mainstream [2]. Because of the limited opportunities for further improvement of the film cooling performance, typically advanced gas turbine airfoils usually incorporate both TBCs and film cooling techniques [3,4].
Some researchers have studied the overall cooling performances of a coated vane or blade under uniform temperature inlet conditions [5,6,7]. Liu et al. [5] found that the influence of the mainstream inlet temperature on the temperature variation of coatings’ surfaces was larger than that of the heat transfer coefficient of cooling channels. Prasert et al. [6] claimed that the increment of turbulence intensity had a smaller influence on decreasing the average temperature. Shi et al. [7] found that TBCs showed both the positive and negative roles in improving cooling performance for the coated vane with or without film cooling. However, in real turbine stage inlet boundary, the distributions of velocity, turbulence and temperature show large non-uniformity both in the radial and circumferential directions [8]. The non-uniform distributions of velocity and turbulence can be caused by intensive residual swirl flow at the exit of lean-burn combustor which is widely applied to ensure combustion stability and lower NOx emissions [9]. The non-uniform distributions of temperature, known as hot streaks (HSs) are caused by the discrete nature of fuel nozzles and coolant flow of combustor lining [8]. It is noted that just a 25 K underprediction of the blade metal temperature can cause a halving of the blade life span [9]. However, for typical military engines, the temperature ratio can reach up to 1.24 times the mass averaged temperature [10]. Thus, it is important to examine the influence of the non-uniform inlet boundary conditions to maximize turbine performance and reliability.
Some researchers have studied the individual influence of swirls and hot streaks on the heat transfer characteristics and film cooling performance of uncoated vanes or blades. Povey et al. [11,12] and Stewart et al. [13] have made good efforts to measure the radial temperature profile at the exit of the lean-burn combustor. The measured temperatures ratio ranged from 0.59 to 1.24 for different mean temperatures. However, in the open literature whole field temperature measurements are still limited. Simone et al. [14] found that hot streaks aligned with the leading edge leading to a higher thermal load on the suction side of the vane because of the mixing effect of the vane wake. The intensive residual swirl flow at the exit of the lean-burn combustor influences the passage secondary flow, and thus the aerodynamics and heat transfer performance. Feng et al. [15] claimed that hot streaks aligned with the passage lead to less heat load on the vane surface than when aligned with the leading edge. Intensive residual swirl flow at the exit of the lean-burn combustor changed the incidence of vanes and thus twisted the stagnation line. Qureshi et al. [16] found that swirl flow changed the vortex pattern and thus the pressure loads distribution of the first stage vane passage. Jacobi et al. [17,18] found the swirl flow induces vortices at the leading edge of the vane. Qureshi et al. [19,20] found the swirl flow changed the strength of the passage vortex and increased the Nusselt number on both the hub and tip of an airfoil. Werschnik et al. [21] claimed that the higher turbulence intensity induced by swirl flow increased the heat transfer and thus decreased the film cooling effectiveness near the hub region. Schmid et al. [22] found that the negative swirl flow declined the aerodynamic penalty in the turbine.
Even though there are numerous literature studies on the individual influence of swirls and hot streaks, few studies have considered the combined effects on the temperature distribution and heat loads over the vane surface. Also, there are no results in the open literature about the combined influences of swirls and hot streaks on the cooling performance of a coated vane or blade. Based on these viewpoints, conjugate heat transfer (CHT) analyses have been applied to the NASA C3X guide vane with or without TBCs. Firstly, baseline cases with or without TBCs under uniform turbine inlet boundary conditions have been examined. Then, six other cases about the individual effects of swirls and hot streaks or their combined effect have been studied. The objective of this study was to reveal the TBCs’ insulation characteristics and cooling performance under the combined effects of hot streaks and swirls to provide a guideline for the cooling arrangement design process of coated vanes.
2. Numerical Methods
2.1. Mesh Generation and Calculation Techniques
The film-cooled NASA guide C3X vane used in this study is a 2D stainless steel nozzle guide vane (NGV) reported by Hylton et al. [23,24]. The span and axial chord are 77.22 and 78.16 mm, respectively [23,24]. Three irregular-shaped coolant channels span the forward portion of the vane which feeds rows of film cooling holes with the same diameter of 0.1 cm, as seen in Figure 1a. In addition, 48 cylindrical film cooling holes are mounted on the leading edge with the spanwise angle of 45°. Furthermore, 52 cylindrical film cooling holes which are orthogonal to the span are mounted on both sides of the vane, as seen in Figure 1a. Besides, ten radial cooling channels are located along the axial of the aft portion of the vane. The forward portion and aft portion of the vane is split by a thermal barrier [23]. The computational domain extends up to 1.5 Cax upstream and 2 Cax downstream of the vane, respectively, as seen in Figure 1b. A hybrid grid approach is adapted using the commercial ANSYS ICEM CFD 18.2 software (Ansys, Canonsburg, PA, USA). The aft portion of the vane is meshed with unstructured hexahedral mesh, while the forward portion is meshed with tetrahedral grids. An O-grid scheme with 20 layers of hexahedral elements is applied to the boundary layer along the entire surface of the vane, as seen in Figure 1c. Three mesh models with 10.1, 15.4 and 20.9 million grid elements, respectively, are used to ensure grid independence. A grid independence study was initially carried out for the uniform inlet case which is based on the experiment Case 44,344 reported by Hylton et al. [23,24]. In this case, the total temperature, pressure and turbulence intensity are 701 K, 285.13 kPa and 6.5%, respectively [23]. The mass flow rates of coolant are 0.638 × 10⁻², 0.752 × 10⁻² and 0.134 × 10⁻¹ kg/s for the inlet of leading edge (LE), pressure side (PS) and suction side (SS) coolant channels, respectively [24]. The total inlet temperatures of the LE, PS and SS coolant channels are 602.86, 581.83 and 595.85 K, with the same turbulence intensity of 5% [23,24]. The inlet and outlet conditions of ten radial cooling channels are consistent with the conditions provided in Ke et al. [25].
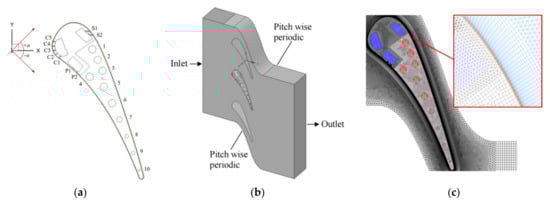
Figure 1.
Computational domain and mesh. (a) Vane structure; (b) Computational domain; (c) Mesh.
In order to estimate the combined influences of swirls and hot streaks on the cooling performance, steady state simulations by means of conjugate heat transfer (CHT) analyses have been applied with the commercial ANSYS FLUENT 18.2 code. Both the mainstream and cooling flows have been defined as the ideal gas to consider their compressible nature [25]. Molecular kinetic theory has been applied to model the viscosity, conductivity and specific heat [25]. In order to accurately predict the boundary layer of laminar flow and the transition state, the transition k-kl-ω turbulence model has been applied to predict the turbulent transition and flow separation. In the fluid domains, the Reynolds averaged continuity, momentum, and the energy equations have been solved. On the basis of Fourier’s law, only the energy equation is solved in the solid domain [14]. The mesh interface technique with coupled wall have been applied at all interfaces of fluid and solid to ensure the equivalent of temperatures and heat fluxes of the solid domain and fluid domains at the vicinity of interface [15]. In the present work, the P1 model is adopted to estimate the influence of radiative transfer. To improve computational accuracy, the residual levels of the continuity and energy equations were reduced to levels of 10−3 and 10−6, respectively. In addition, the mass flow error between the inlet and exit is reduced to below 0.1%. To ensure that the numerical results are independent of the mesh strategy, the normalized total pressure and static temperature along the midspan among three meshes are compared in Figure 2. To evaluate the reliability of the solved transport equations and the numerical schemes used in this study, and experimental results of the Case 44,344 [23,24] is compared to the numerical results in Figure 3. The references total pressure and static temperatures are 285.13 kPa and 701 K, respectively. Overall, the maximum deviations between calculated values of different meshes are smaller than 5%. The medium-mesh with 15.4 million grid elements is selected for hot streak and swirl simulation, as seen in Figure 2. For the normalized total pressure, the predicted data are very close to the experimental results, except for the region between 25% and 50% Cax. For the normalized total temperature, calculated values are also in close agreement with the experimental results, as seen in Figure 3.
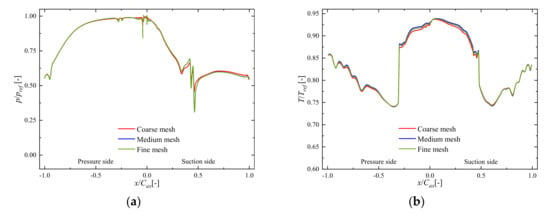
Figure 2.
Grid independence test. (a) Pressure profile; (b) Temperature profile.
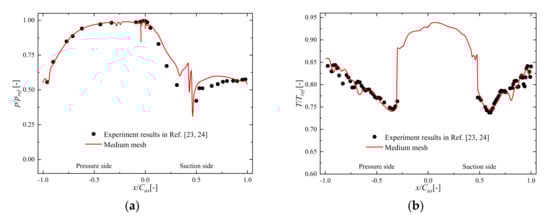
Figure 3.
Comparisons of numerical results with experimental results [23,24]. (a) Pressure profile; (b) Temperature profile.
2.2. Thermal Parameter Definition
For a typical time-mean temperature field in turbine inlet, the region with peak temperature is located near the midspan, while near the tip and hub of the vane, there are cool regions with lower temperatures. Temperature distortion factors (TDFs) are used to quantify the temperature non-uniformity of hot streaks [9]. There are several definitions of TDFs in recent studies [9,10,11]. The overall TDF (OTDF) is a measure of the divergence of the hottest gas streak from the mean temperature [9]. The radial TDF (RTDF) is a measure of the non-uniformity of the circumferentially averaged temperature field [10]. Local OTDF (LOTDF) and local RTDF (LRTDF) are used to describe the form of the temperature profile. The definitions are as follows:
Here the is the area mean temperature, the is the circumferential mean temperature which is a function of radial height, the ΔTcomb is the temperature rise across the combustor, T is the local temperature. The subscript “max” identifies the maximum [11]. Besides, the subscripts “3” and “4” identify that the temperature has been taken at the combustor inlet and exit planes, respectively [12]. In a real turbine stage inlet boundary, the distributions of velocity also show large non-uniformity both in the radial and circumferential directions which can be caused by intensive residual swirl flow at the exit of the lean-burn combustor [9]. The interaction between hot streaks and swirls changes the hot streak core and film cooling coverage which significantly redistributes the heat load on the vane surface. For a modern lean-burn combustor, the peak vane at the turbine inlet are over ±40° at the extreme swirl conditions [9]. The definitions is as follows:
Here the ρ is the density of mainstream, the uax and utan is the inlet axial and tangential velocity component of the mainstream, as seen in Figure 1a [8,9].
The overall cooling effectiveness is used to quantify cooling performances of airfoil. Increment of overall cooling effectiveness (Δφ) is used to quantify the cooling performance increment resulting from the coatings for the coated vane [11]. The definitions are as follows:
Here the T is the local vane surface temperature of the uncoated vane, Tc is the inlet temperature of coolant, TTBC is the local subtract surface temperature of the coated vane, T∞ is the inlet temperature of the mainstream, T′ is the coatings surface temperature, as seen in Figure 4 [11].
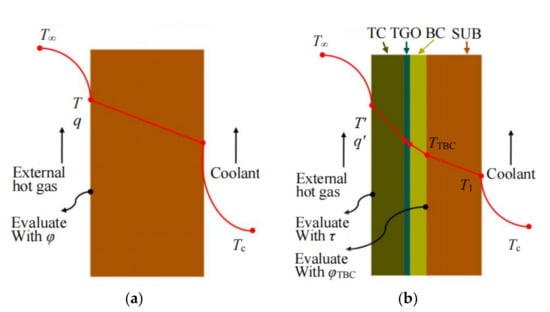
Figure 4.
Thermal parameters definition for uncoated vane and coated vane. (a) Uncoated vane; (b) Coated vane.
The flux drop δq is used to evaluate the influence of the thermal barrier coating on the heat flux. The definition is as follows:
Here q and q′ are the local heat flux at the interface of solid and fluid for the uncoated vane and coated vane, respectively.
2.3. Boundary Conditions
In this work, eight cases with different temperature distribution and swirl orientations are modeled, as shown in Table 1. Case 1 and Case 4 with uniform temperature inlet conditions are modeled as the baseline cases for the uncoated vane and coated vane, respectively. The boundary conditions of mainstream and coolant ejection are based on the experimental data of Case 44,344 reported by Hylton et al. [23,24], as shown in Table 2. For the coated vane, three coating layers are added on the external surface of the substrate. The thickness definition of the bond coating (BC), thermally grown oxide (TGO) and top coating (TC) are 150, 10 and 300 μm which are based on the coated vane reported by Liu et al. [5]. The material properties of the gas, substrate, BC, TGO and TC are shown in Table 3. To study the individual influence of hot streaks, temperature profiles with the mass averaged total temperature of 701 K are specified at the stage inlet of the Case 2 and Case 5 for the uncoated and coated vane, respectively. The temperature ratio profile which is fitted by a polynomial function of order four is based on the experimental results reported by Koupper et al. [26]. Figure 5 shows the temperature ratio which is defined as θ = T/T0 in the stage inlet plane. In Figure 5a, it can be observed that the ratio of the maximum of temperature ratio is about 1.03, while the minimum is about 0.88, for the whole stage inlet plane. Hot streak temperature profiles with positive or negative inlet swirl are specified at the stage inlet planes of the Case 3 and Case 4 for the uncoated vane, and at the stage inlet planes of the Case 7 and Case 8 for the coated vane. Figure 6 and Figure 7 show the distribution of hot streaks, swirl anglse as well as velocity vectors at the stage inlet plane. The swirl angle profile is also based on the experimental results reported by Koupper et al. [26]. In the radial direction, the maximum swirl angle is about 18.5° which locates at the 80% span, while the minimum locates at the 20% span, as seen in Figure 5b. Both the hot streak temperature and swirl angle profile are defined with the user-defined function (UDF) method with commercial software ANSYS FLUENT 18.2 (Ansys, Canonsburg, PA, USA) [27].

Table 1.
Definition of the simulation cases.
Table 2.
Boundary conditions.
Table 3.
Material properties.
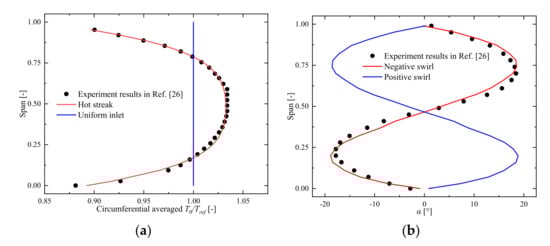
Figure 5.
Circumferential averaged temperature and swirl angle profiles [26]. (a) Temperature profile; (b) Swirl angle profile.
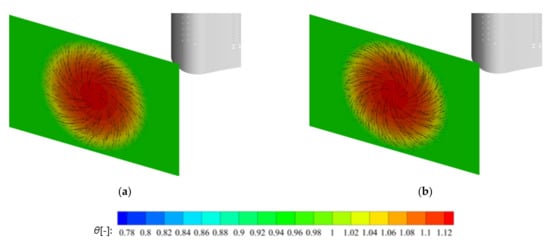
Figure 6.
Hot streak and velocity vectors distribution at the stage inlet plane. (a) Case 3: HS and positive swirl; (b) Case 4: HS and negative swirl.
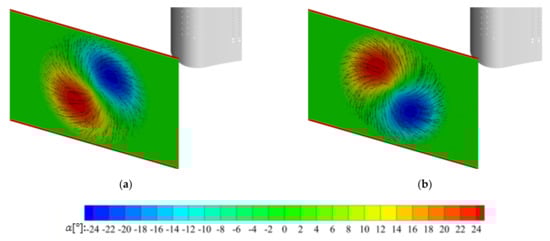
Figure 7.
Swirl angle and velocity vectors distribution at the stage inlet plane. (a) Case 3: HS and positive swirl; (b) Case 4: HS and negative swirl.
3. Discussion
3.1. Influence of Swirl on the Aerodynamics Characteristics
Figure 8 shows the temperature contours and hot streak core which are visualized through the iso-surface of total temperature at 701 K, for different cases. For the uniform inlet case, a local maximum of static temperature can be observed in the region close to the stagnation line, as seen in Figure 8a. Further along the suction side, strong acceleration of the mainstream rapidly decreases the static temperature. In comparison, the temperature remains at a high value until the region close to the trailing edge on the pressure side where close to the stagnation line of the neighboring vane. Under the influence of hot streak, most part of the vane surface on the pressure side is flooded with the hot streak core, as seen in Figure 8b. In comparison, only part of the forward portion of the vane is covered with the hot streak core on the suction side. Under the influence of positive swirl, hot streak core moves slightly toward the hub region on the pressure side, as seen in Figure 8c. In comparison, it moves slightly toward the tip region on the pressure side under the influence of the negative swirl, as seen in Figure 8d.
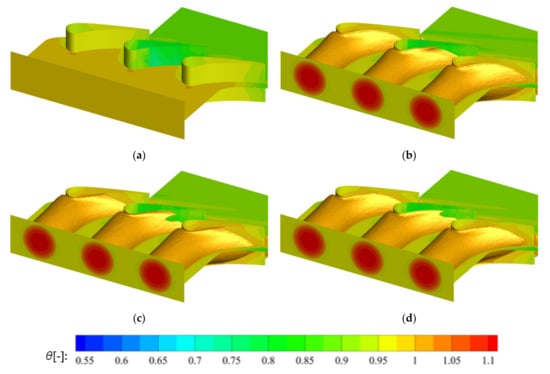
Figure 8.
Stretching of hot streak core for different cases. (a) Case 1: uniform inlet; (b) Case 2: HS only; (c) Case 3: HS and positive swirl; (d) Case 4: HS and negative swirl.
Figure 9 shows the temperature and velocity vectors distribution at the cutting plane of −10% Cax, for different cases. The origin of coordinates is located in the stagnation line at the midspan. Under the influence of hot streakd, it is clear the hot streak core is redistributed as it impinged the leading edge, as seen in Figure 9b. Higher temperatured along with shorter circumferential length scales can be observed on the suction side. As expected, swirls change the flow field, and thus stretch the hot flow both in the circumferential and radial directions, as seen in Figure 9c,d. For the hot streak and positive swirl case, the temperature increases close to the tip region on the suction side, and the hub region on the pressure side, as seen in Figure 9c. In addition, a pair of counter-rotating vortices are located near the tip region. Thus, gas with a relatively smaller positive incidence is located close to the hub region. Comparing with the hot streak only case, the temperature increases close to the hub region on the suction side, and close to the tip region on the pressure side, as seen in Figure 9d. Besides, a pair of counter-rotating vortices are located close to the hub region.
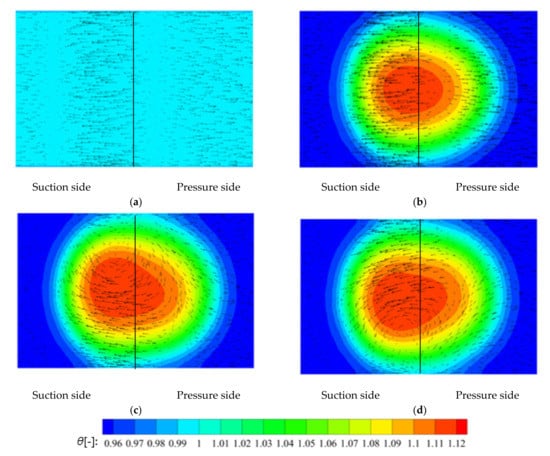
Figure 9.
Temperature and velocity vector distribution at the cutting plane of −10% Cax. (a) Case 1: uniform inlet; (b) Case 2: HS only; (c) Case 3: HS and positive swirl; (d) Case 4: HS and negative swirl.
Figure 10 shows the temperature profiles in both the circumferential and radial directions at the plane of stage inlet and −10% Cax. By comparing Figure 10a with Figure 10c, it can be observed that the shape of the NGV passage seems to have a relatively small influence on the local temperature distribution both in the circumferential and radial directions, for the uniform inlet case. Under the influence of hot streaks, there is also a relatively smaller difference in the radial direction, as seen in Figure 10a,b. A local maximum temperature which is about 784 K is located close to the midspan, for both the cutting planes. In the circumferential direction, a much flatter temperature profile is located on the pressure side at −10% Cax plane, as seen in Figure 10d. It is clear that the temperature decreases from 784 K at the stagnation line to 701 K at about −33% pitch length on the pressure side, while this happens at about 30% pitch length on the suction side. Comparing with the hot streak only case, the temperature drops are about 2.8 K, for Case 3 and Case 4, as seen in Figure 10b. In comparison, the temperature increases close to the tip and hub region. Under the influence of positive swirl, there is a clear temperature increment close to the tip region compared with other cases, as seen in Figure 10b. A local maximum can be noticed close to the 55% span which is about 781.7 K, for the hot streak and positive case. In comparison, a negative swirl leads to a hotter hub region, where a local maximum is located close to the 45% span which is about 782.1 K, for the hot streak and negative case, as seen in Figure 10b. In the circumferential direction, flatter temperature profiles are located on the pressure side at −10% Cax plane, as seen in Figure 10d. A local minimum can be noticed close to about 14% pitch length, for Case 3 and Case 4. Considering the significant difference in temperature and velocity vector distribution, the aerodynamics and heat transfer characteristics of NGV under the combined influence of hot streaks, swirls and the shape of the NGV passage should be clearly revealed. Their negative influences should be lessened as much as possible.
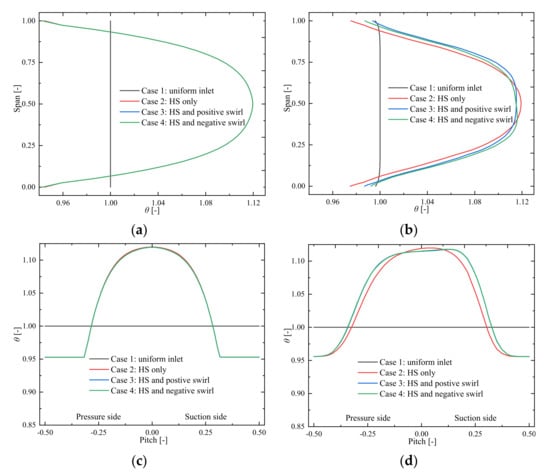
Figure 10.
Local temperature profiles along the circumferential and radial directions. (a) Temperature profiles at the passage inlet; (b) Temperature profiles at the −10% Cax plane; (c) Temperature profiles at the passage inlet; (d) Temperature profiles at the −10% Cax plane.
3.2. Influence of Hot Streak and Swirl on the Cooling Performance of the Uncoated Vane
Figure 11 shows the streamline pattern of coolant ejected from film cooling holes located on the leading edge, pressure side and suction side, for different cases. For the uniform inlet case, coolant exhausted from C1 to C3 film rows passes the pressure side downstream, while coolant from the C4 and C5 film rows passes towards the suction side. As it passes through the vane surface, the coolant migrates radically toward the tip region on the pressure side, as seen in Figure 11a. In comparison, the radical migration of coolant is suppressed by the secondary flow channel vortex on the suction side [23,24]. On the downstream of the pressure side, most of the coolant from the leading edge is pushed to lift off and reattach on the far downstream of the vane surface after it impinges the downstream cooling film. In comparison, homogeneous film coverage can be noted on the suction side. Under the influence of hot streaks, there is no noticeable difference in the streamline pattern of coolant, as seen in Figure 11b. Under the influence of positive swirl, hot flow with negative incidence in the tip region transports the coolant toward the midspan. In the hub region, the radical migration of coolant is also enhanced by the hot flow with positive incidence, especially for the coolant from the leading edge film cooling holes, as seen in Figure 11c. For the hot streak and positive case, film coolant is also transported to the midspan, as seen in Figure 11d. The difference of coolant streamline pattern between two cases is that, relatively larger ejection incidence of film coolant can be observed in the tip region, for the hot streak and positive case. In comparison, larger ejection incidence of film coolant can be observed close to the hub region, for the hot streak and negative case.
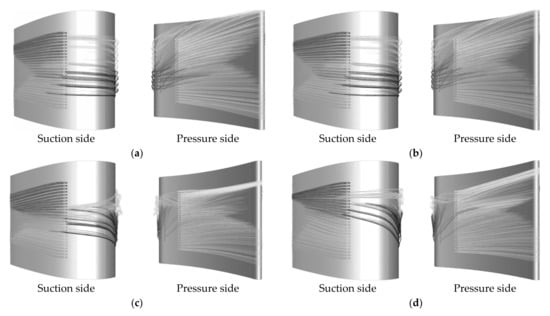
Figure 11.
Streamline pattern of coolant for different cases. (a) Case 1: uniform inlet; (b) Case 2: HS only; (c) Case 3: HS and positive swirl; (d) Case 4: HS and negative swirl.
Figure 12 shows the distributions of overall cooling effectiveness on the external surface of the uncoated vane, for different cases. For the uniform inlet case, the lowest overall cooling effectiveness can be observed close to the hub and tip regions close to the stagnation line and uncovered by film cooling, as seen in Figure 12a. On the pressure side, coolant exhausted from the C1 to C3 film rows detaches at the boundary layer and reattaches on the downstream of the vane surface. Therefore, regions close to the exits of C3 film row cannot be effectively covered by film cooling, especially for the film cooling holes close to the inlet of the PS coolant channels. On the suction side, homogeneous film coverage leads to relatively more uniform total cooling effectiveness distributions. On the aft portion of the vane, a local minimum appears between two alongside radial cooling channels, and a local maximum close to a radial channel [23]. Besides, the overall cooling effectiveness of the hub is much lower than that of the tip because of the heating of coolant in the radial direction [24]. Under the influence of hot streaks, the overall cooling effectiveness decreases significantly over the vane surface, especially on the midspan of forward portion where under the direct impingement of the hot streaks, as seen in Figure 12b. Comparing with the hot streak-only case, the overall cooling effectiveness of the Case 3 and Case 4 increases in the region close to the midspan of the forward portion. In comparison, it decreases in the tip and hub regions in the forward portion of the vane, as seen in Figure 12c,d. On the aft portion of the vane, the overall cooling effectiveness decreases because of the circumferential stretching of hot fluid for Case 3 and Case 4.
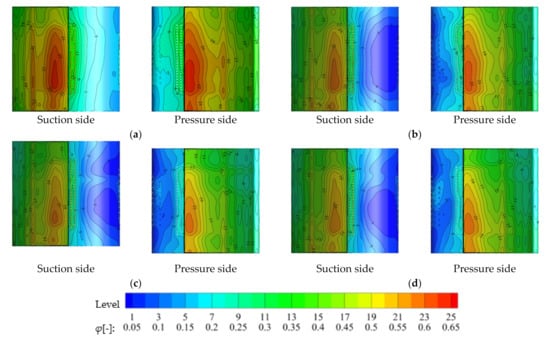
Figure 12.
Overall cooling effectiveness distribution for different cases. (a) Case 1: uniform inlet; (b) Case 2: HS only; (c) Case 3: HS and PSW; (d) Case 4: HS and NSW.
Figure 13 shows the dimensionless pressure and overall cooling effectiveness profiles along the vane surface at cuttings planes of the 25%, 50% and 75% span, for different cases. It is clear that the rules of the total pressure show the same trend for different cases. A local maximum can be observed in the region close to the stagnation line. Further along the suction side, strong acceleration of the mainstream leads to a rapid decrease of pressure. In the region between 25% and 50% Cax, coolant ejection from leading edge and suction side leads to pressure profile fluctuations [23]. On the pressure side, the pressure remains at a high value until the region close to the trailing edge where it is close to the stagnation line of the neighboring vane [24]. In Figure 13, higher fluid temperature together with less coolant leads to lower overall cooling performance on the forward portion of the vane, where a local minimum appears close to the stagnation line. As described, two irregular-shaped coolant channels along with 100 cylindrical film cooling holes are mounted on the pressure side, while only one channel with 52 holes is located close to the suction side [23,24]. Thus, a rapid increment of cooling effectiveness can be observed along the pressure side, for the uniform inlet case, as seen in Figure 13, although under the influence of lower fluid temperature, relatively lower cooling effectiveness can be observed on the suction side. Further downstream, the strong shock along with the transition of the boundary layer leads to a rapid decrease of cooling performance over the vane surface [23,24]. Under the influence of hot streaks, the amplitude decrease of cooling effectiveness on the suction side is larger than that of the pressure side, as seen in Figure 13. Comparing with the uniform inlet case, the overall cooling effectiveness is reduced from about 0.294 to 0.239, a reduction of about 18.7% at the −25% Cax of the midspan on the pressure side, for the hot streak only case. In comparison, the overall cooling effectiveness reduces from 0.203 to 0.049, a reduction of about 76% at the 25% Cax of the midspan on the suction side. On the aft portion of the vane, the decrease of cooling effectiveness on the trailing edge is larger than that of other regions. Under the influence of swirls, the cooling effectiveness decreases on most parts of the vane surface, except for the suction side of the forward portion for the hot streak and swirl cases, as seen in Figure 13. As mentioned above, the temperature increases close to the tip region on the suction side and the hub region on the pressure side for the Case 3. Thus, the overall cooling effectiveness of the Case 3 is smaller than that of the Case 4 at the 25% span on the pressure side and at the 75% span on the suction side. Comparing with that of the Case 4, the overall cooling effectiveness reduces from about 0.402 to 0.375, a drop of about 6.7% at the 75% Cax of the 25% span on the pressure side. On the suction side, the overall cooling effectiveness reduces from 0.414 to 0.388, a reduction of about 6.3% at the 75% Cax of the 75% span. Considering the significant decline of cooling performance on the hub and tip region for the hot streak and swirl cases, enhanced cooling arrangement designd are necessary in those regions.
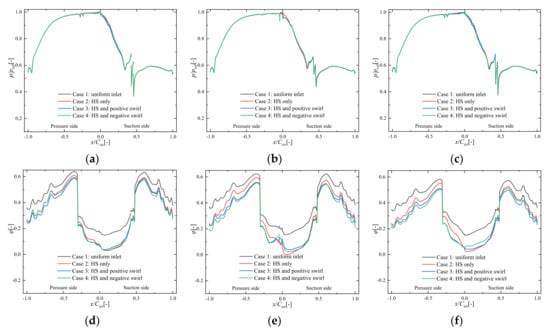
Figure 13.
Pressure and overall cooling effectiveness profiles along the vane surface. (a) pressure at z = 25% span; (b) pressure at z = 50% span; (c) pressure at z = 75% span; (d) overall cooling effectiveness at z = 25% span; (e) overall cooling effectiveness at z = 50% span; (f) overall cooling effectiveness at z = 75% span.
3.3. Influence of Hot Streaks and Swirls on the Heat Transfer Characteristics
Figure 14 shows the distribution of local heat flux and heat flux reduction on the external vane surface for different cases. For the uniform inlet case, it is clear that in the regions with sufficient internal cooling, the local heat flux is always larger than in other regions, as seen in Figure 14a. As mentioned above, the main function of film cooling is forming a protective layer to decrease the heat flux transfer from the mainstream to the vane structure. In Figure 14a, it is clear that a relatively lower local heat flux can be observed in the regions covered by film cooling, especially on the aft portion of the vane. Although the main function of film cooling is not directly cooling the vane surface, regions with negative local heat flux can be observed on both surface sides. On the suction side, regions with negative local heat flux can be observed in the regions close to the downstream of the film cooling holes and in the regions close to the trailing edge. On the pressure side, regions with negative local heat flux are located close to the upstream of the D1 film row. As mentioned above, the strong acceleration of the mainstream rapidly decreases the static temperature in the regions close to the stagnation line on the suction side and to the trailing edge on the pressure side. Thus, the introduction of film cooling can easily lead to negative local heat flux in those regions. Under the influence of hot streaks, the local heat flux increases significantly in the regions close to the film cooling holes of the forward portion under the direct impingement of the hot streak, as seen in Figure 14b. Apart from the influence of temperature redistribution, swirls transport the film coolant from the leading edge toward the midspan which enhances the film cooling coverage in those regions. In comparison, the migrating coolant film worsens the film coolant coverage in the hub and tip end-wall regions which increases the local heat flux in those regions. For hot streak and positive swirl cases, regions with negative heat flux can be observed on the suction side because of the enhancement of the film cooling coverage, as seen in Figure 14c. Figure 15 shows the distribution of local heat flux reduction on the external surface, for different cases. A positive value means a decrease in the local heat flux because of the coatings.
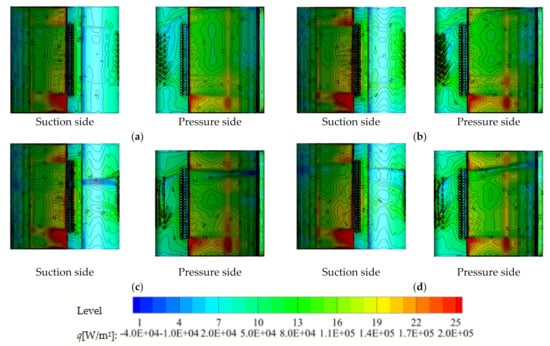
Figure 14.
Local heat flux distribution for different cases. (a) Case 1: uniform inlet; (b) Case 2: HS only; (c) Case 3: HS and positive swirl; (d) Case 4: HS and negative swirl.
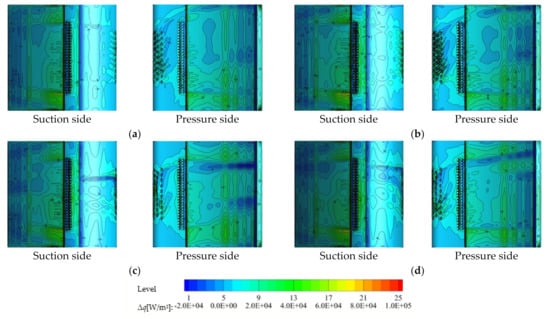
Figure 15.
Local heat flux drop distribution for different cases. (a) Case 1: uniform inlet; (b) Case 2: HS only; (c) Case 3: HS and positive swirl; (d) Case 4: HS and negative swirl.
Comparing Figure 14 with Figure 15, it is clear that the distribution of local heat flux reduction is analogous to that of local heat flux. In the regions with higher local heat flux, the heat flux reduction is always larger than in other regions for a coated vane. In addition, a negative value can be observed in the same regions with negative local heat flux, where adding coatings decreases the heat flux transfer from the vane to the mainstream.
Figure 16 shows the distribution of local heat flux and heat flux reduction along the external surface at cutting planes of the 25%, 50% and 75% span, for different cases. In Figure 16, it is clear that sharp fluctuations of the local heat flux and heat flux reduction profile can be observed in the region close to the film cooling holes for all the cases. Despite the film cooling hole regions, a negative heat flux can be observed in the region between about 32% and 34% Cax, as well as the region around 99.5% Cax on the suction side, for the uniform inlet case, as seen in Figure 16b. On the pressure side, a negative heat flux is located between about −93% and −95% Cax of the midspan. Comparing with uniform inlet case, the increment of heat flux and heat flux reduction on the suction side is higher than that of the pressure side, especially on the midspan, as seen in Figure 16b. Comparing with the uniform inlet case, the heat flux reduction increases from about −1200 to 1479 W/m2 at the 25% Cax of the midspan on the suction side. On the pressure side, the heat flux reduction increases from about 21,000 to 32,113 W/m2 on the −25% Cax of the midspan. On the pressure side of the aft portion, the local heat flux and heat flux reduction of the Case 3 is higher than that of the Case 4 on the 25% span. On the suction side of the aft portion, higher heat flux and heat flux reduction can only be observed on the cutting plane of the 25% span, for the Case 4. As mentioned above, the main function of TBCs is forming protective coating layers with lower heat flux conductivity to decrease the heat flux transfer from the hot flow to the vane structure. However, in the region with negative local heat flux of coated vane, adding coatings decreases the heat flux transfer from the vane to the mainstream. Thus, their negative influences on the overall cooling performance should be clearly revealed for the coated vane.
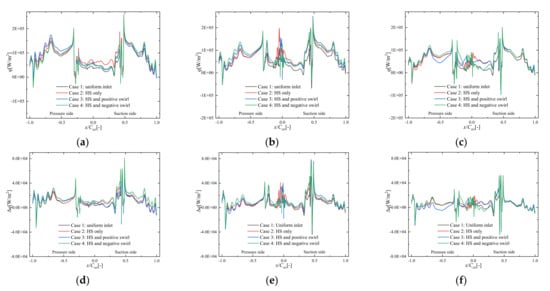
Figure 16.
Local heat flux and heat flux drop distribution along the vane surface. (a) local heat flux at z = 25% span; (b) local heat flux at z = 50% span; (c) local heat flux at z = 75% span; (d) heat flux drop distribution at z = 25% span; (e) heat flux drop distribution at z = 50% span; (f) heat flux drop distribution at z = 75% span.
3.4. Influence of Hot Streak and Swirl on the Cooling Performance of the Coated Vane
Figure 17 shows the overall cooling effectiveness distribution of the coated vane for different cases. For the coated vane, the overall cooling effectiveness distribution is just an analogy to that of the uncoated vane. Lower overall cooling effectiveness occurs in the region close to the stagnation line, especially in the region close to the end-wall the forward portion. On the aft portion of the vane, regions with higher cooling effectiveness are located in the region near the radial cooling channels, while relatively lower cooling effectiveness can be observed between the adjacent cooling channels [23,24]. Under the influence of hot streaks, the cooling effectiveness decreases on the whole vane surface, especially on the suction side of the forward portion, as seen in Figure 17b. Comparing with the hot streak only case, cooling effectiveness increases on the suction side of forward portion. While it decreases on the aft portion of the vane, especially in the tip region, for the Case 3 and Case 4, as seen in Figure 17c,d. Figure 18 shows the cooling effectiveness increment because of the coatings, for different cases. For the uniform inflow case, in the regions with sufficient internal cooling, the cooling effectiveness increment is always larger than in other regions, especially in the region close to radical cooling channels, as seen in Figure 18a. The cooling effectiveness increment decreases in the region covered by film cooling, especially in the region downstream of the film cooling holes and region close to the trailing edge with lower or negative local heat flux. Comparing with the uniform inlet case, the cooling effectiveness increment increases on the whole vane surface, especially on the suction side of the forward portion, as seen in Figure 18b. Under the influence of swirls, radial migration of coolant improves the coverage of film cooling on the region close to the midspan. Besides, it decreases the cooling effectiveness increment in those regions, as seen in Figure 18c,d.
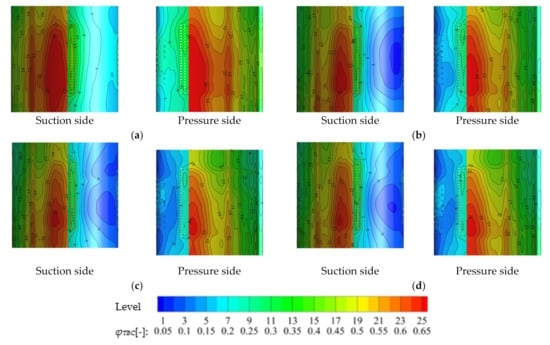
Figure 17.
Overall cooling effectiveness distribution of coated vane for different cases. (a) Case 5: uniform inlet; (b) Case 6: HS only; (c) Case 7: HS and positive swirl; (d) Case 8: HS and negative swirl.
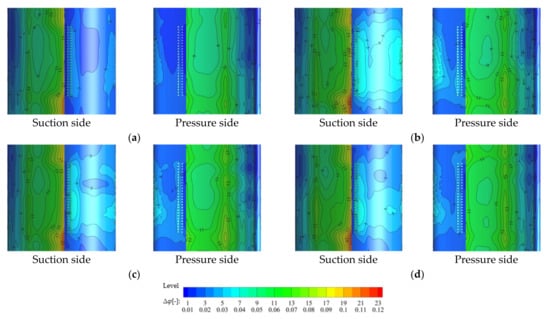
Figure 18.
Cooling effectiveness increment distribution of coated vane for different cases. (a) Case 1: uniform inlet; (b) Case 2: HS only; (c) Case 3: HS and positive swirl; (d) Case 4: HS and negative swirl.
Figure 19 shows the overall cooling effectiveness and cooling effectiveness increment distribution along the subtract surface at cutting planes of the 25%, 50% and 75% span, for different cases. Comparing Figure 4 with Figure 19, the overall cooling effectiveness of coated vane is larger than that of uncoated vane on the whole vane surface. In addition, the difference of overall cooling effectiveness between different coated cases is smaller than that of the uncoated vane. In Figure 19, it is clear that a lower cooling effectiveness increment can be observed on the forward portion of the vane, where a local maximum can be observed close to the stagnation line for all the cases. The cooling effectiveness increment decreases along the vane surface to where the local minimum is reached on both surface sides. For the uniform inlet case, the local minimum can be observed on the −19% Cax where it is close to the downstream of the film cooling holes on the pressure side, as seen in Figure 19. Besides, a local minimum can be observed on the 31% Cax on the suction side close to the region with negative local heat flux, as seen in Figure 16 and Figure 19. Further along the vane surface, other local minimums can also be observed close to film cooling holes where there is a negative heat flux. It is noted that the substrate metal temperature of a coated vane is influenced by the temperature of the mainstream and coolant, the temperature gradient of coatings and substrates, as well as the distance of the cooling channels from the surface. For the coated vane, the largest temperature gradient is located inside the coatings. In the regions with higher local heat load, the temperature gradient of coatings is always larger than in other regions. Thus, larger cooling effectiveness increments can be observed in those regions. Also, local heat loads decrease in the region under the coverage of film cooling which decreases the temperature gradient inside the coatings and thus reduces the cooling effectiveness increment in those regions for the coated vane. In the region with negative local heat flux, adding coatings decreases the heat flux transfer from the vane structure to the mainstream which decreases the cooling performance in those regions. Consequently, the local minimum of cooling effectiveness increment can be observed in those regions.
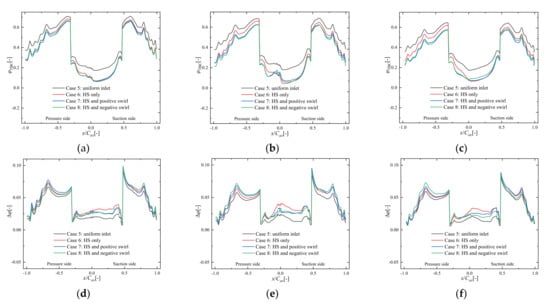
Figure 19.
Cooling effectiveness and cooling effectiveness increment along the vane surface; (a) cooling effectiveness at z = 25% span; (b) cooling effectiveness at z = 50% span; (c) cooling effectiveness at z = 75% span; (d) cooling effectiveness increment at z = 25% span; (e) cooling effectiveness increment at z = 50% span; (f) cooling effectiveness increment at z = 75% span.
Comparing with the uniform inlet case, the cooling effectiveness increment increases on the whole surface, especially on the suction side of the vane, as seen in Figure 19. Comparing with the uniform inlet case, the cooling effectiveness increment increases from 0.015 to 0.021, at the −25% Cax of the midspan on the pressure side. In comparison, the cooling effectiveness increment increases from 0.013 to 0.03, at the 25% Cax of the midspan on the suction side. On the aft portion of the vane, the overall cooling effectiveness increment of the Case 3 is larger than the Case 4 on the pressure side of the 25% span and on the suction side of the 75% span. Comparing with the Case 4, the overall cooling effectiveness increment changes from about 0.058 to 0.064 at the −75% Cax of the 25% span for the Case 3. In comparison, the overall cooling effectiveness increment changes from 0.051 to 0.056 at the 75% Cax of the 75% span for the Case 3.
4. Conclusions
This paper studies the combined influences of hot streaks and swirls on the cooling performances of the NASA C3X guide vane coated with or without TBCs. The following conclusions can be drawn:
- Even with uniform velocity inlet condition, the hot streak core can be stretched as it impinges on the leading edge which causes a higher heat load on the suction side of forward portion. The interactions between hot streaks and swirls significantly redistributes the hot streak core. On the passage inlet plane, positive swirl leads to a hotter tip region on the suction side. In the radial direction, a local maximum of 781.7 K locates near the 55% span. In comparison, negative swirl leads to a hotter hub region on the pressure side. In the radial direction, a local maximum of 782.1 K is located close to the 45% span.
- Under the influence of swirl, migration of coolant improves the coverage of film cooling close to the midspan, while close to the hub and tip region, the film cooling coverage decreases simultaneously. Positive swirl leads to a more negative impact on film cooling coverage on the tip region. In comparison, negative swirl leads to a more negative impact on the hub region. Comparing with that of the Case 4, the overall cooling effectiveness reduces from about 0.402 to 0.375 at the −75% Cax of the 25% span on the pressure side for the Case 3. On the suction side, the overall cooling effectiveness reduces from 0.414 to 0.388 at the 75% Cax of the 75% span. Thus, enhancing the cooling arrangement design is necessary in the hub and tip region.
- In the regions with enough internal cooling, adding coatings leads to larger cooling effectiveness increment for the coated vane. In addition, the local heat load decreases in the region under the coverage of film cooling which decreases the temperature gradient inside the coatings and thus decreases the cooling effectiveness increment in those regions for the coated vane. Comparing with that of the Case 4, the overall cooling effectiveness increment changes from about 0.058 to 0.064 at the −75% Cax of the 25% span for the Case 3. In comparison, the overall cooling effectiveness increment changes from 0.051 to 0.056 at the 75% Cax of the 75% span for the Case 3. Thus, improving internal cooling is a guaranteed way of improving the cooling performance for a coated vane.
- In most parts of the vane surface, TBCs block heat flux from the mainstream into the vane which improves the cooling performance of the coated vane. In the regions with negative local heat flux, TBCs blocks the heat flux transfer from the solid vane into the mainstream and thus play negative roles in improving cooling performance. The interaction between hot streak and swirl changes the hot streak core and film cooling coverage which significantly redistributes the heat load on the vane surface and thus the influence of TBCs on the cooling performance of the coated vane.
- Local minimum of cooling effectiveness increment can be observed in the regions with negative local heat flux for the coated vane, where adding coatings decreases the heat flux transfer from the substrate surface to the mainstream, and thus decreases the overall cooling performance in those regions for the coated vane. Thus, avoiding over-cooling in the regions downstream the film cooling holes and tailing edge of vane surface should be appropriately taken into consideration during the cooling arrangements design process for the coated vane.
Author Contributions
In this paper, L.S. carried out the simulation, and wrote this paper. H.H. and Y.L. improved the discussions; S.X. and C.G. improved this paper overall. All authors have read and agreed to the published version of the manuscript.
Funding
This research was funded by National Natural Science Foundation of China, grant number 51806184 and Natural Science Foundation of Hunan Province, Grant No. 2019JJ50590.
Institutional Review Board Statement
Not applicable.
Informed Consent Statement
Not applicable.
Data Availability Statement
Data sharing not applicable.
Conflicts of Interest
The authors declare no conflict of interest.
Nomenclature
| x, y, z | Cartesian Coordinates [mm] |
| Cax | axial chord [mm] |
| Cp,BC | specific heat capacity of bond coating [J/(kg·K)] |
| Cp,f | specific heat capacity of fluid [J/(kg·K)] |
| Cp,SUB | specific heat capacity of substrate [J/(kg·K)] |
| Cp,TC | specific heat capacity of top coating [J/(kg·K)] |
| Cp,TGO | specific heat capacity of thermally grown oxide [J/(kg·K)] |
| p | Pressure [Pa] |
| pref | reference pressure [285.13 × 10³ Pa] |
| q | local heat flux at the interface of solid and fluid for the uncoated vane |
| q’ | local heat flux at the interface of solid and fluid for the coated vane |
| T | metal surface temperature without TBC [K] |
| Tc | inlet temperature of cooling air [K] |
| Tref | reference temperature [701 K] |
| TTBC | metal surface temperature with TBC [K] |
| Tw | vane local wall temperature [K] |
| T∞ | inlet temperature of mainstream [K] |
| T′ | surface temperature outside the coating [K] |
| ΔTTBC | relative reduction of the substrate temperature due to coating |
| ρSUB | density of substrate [kg/m3] |
| ρTC | density of top coating [kg/m3] |
| ρTGO | density of thermally grown oxide [kg/m3] |
| ρBC | density of bond coating [kg/m3] |
| φTBC | overall cooling effectiveness of the coated vane |
| Δφ | overall cooling effectiveness increment due to coating |
| ΔTcomb | the temperature rise across the combustion chamber |
| uax | inlet axial |
| urad | radial velocity |
| utan | Combustion chamber |
| Greek letters | |
| α | swirl angle |
| φ | overall cooling effectiveness of the uncoated vane |
| δq | delta heat flux |
| θ | temperature ratio |
| Abbreviations | |
| NGV | nozzle guide vane |
| TBC | thermal barrier coating |
| HS | hot streak |
| CHT | conjugate heat transfer |
| LE | leading edge |
| PS | pressure side |
| SS | suction side |
| PSW | positive swirl |
| NSW | negative swirl |
| Subscripts | |
| w | wall |
| c | cooling air |
| ref | reference |
| ∞ | mainstream |
References
- Je-Chin, H.; Michael, H. Recent studies in turbine blade internal cooling. Heat Transf. Res. 2010, 41, 803–828. [Google Scholar]
- Zhang, J.Z.; Zhu, X.D.; Huang, Y.; Wang, C.H. Investigation on film cooling performance from a row of round-to-slot holes on flat plate. Int. J. Therm. Sci. 2017, 118, 207–225. [Google Scholar] [CrossRef]
- Padture, N.P.; Gell, M.; Jordan, E.H. Thermal barrier coatings for gas-turbine engine applications. Science 2002, 296, 280–284. [Google Scholar] [CrossRef] [PubMed]
- Feuerstein, A.; Knapp, J.; Taylor, T.; Ashary, A.; Bolcavage, A.; Hitchman, N. Technical and economical aspects of current thermal barrier coating systems for gas turbine engines by thermal spray and EBPVD: A review. J. Therm. Spray Technol. 2008, 17, 199–213. [Google Scholar] [CrossRef]
- Liu, J.H.; Liu, Y.B.; He, X.; Liu, L. Study on TBCs insulation characteristics of a turbine blade under serving conditions. Case Stud. Therm. Eng. 2016, 8, 250–259. [Google Scholar] [CrossRef]
- Prasert, P.; Soemsak, Y.; Suwin, S.; Daniele, D.; Huazhao, X.; Jianhua, W. Investigation of cooling performances of a non-film-cooled turbine vane coated with a thermal barrier coating using conjugate heat transfer. Energies 2018, 11, 1000. [Google Scholar]
- Shi, L.; Sun, Z.Y.; Lu, Y.F. The combined influences of film cooling and thermal barrier coatings on the cooling performances of a film and internal cooled vane. Coatings 2020, 10, 861. [Google Scholar] [CrossRef]
- Li, Y.; Su, X.; Yuan, X. The effect of mismatching between combustor and HP vanes on the aerodynamics and heat load in a 1-1/2 stages turbine. Aerosp. Sci. Technol. 2019, 86, 78–92. [Google Scholar] [CrossRef]
- Wang, Z.; Wang, D.; Wang, Z.; Feng, Z. Heat transfer analyses of film-cooled HP turbine vane considering effects of swirl and hot streak. Appl. Therm. Eng. 2018, 142, 815–829. [Google Scholar] [CrossRef]
- Zhang, K.; Li, Z.; Li, J. Effect of swirl on the vane endwall aerothermal performance with endwall misalignment at transonic condition. Int. J. Heat Mass Transf. 2019, 144, 118662. [Google Scholar] [CrossRef]
- Povey, T.; Chana, K.S.; Jones, T.V.; Hurrion, J. The effect of hot-streaks on HP vane surface and endwall heat transfer: An experimental and numerical study. J. Turbomach. 2007, 29, 32–43. [Google Scholar] [CrossRef]
- Povey, T.; Qureshi, I. Developments in hot-streak simulators for turbine testing. J. Turbomach. 2009, 131, 83–97. [Google Scholar] [CrossRef]
- Stewart, W.R.; Bogard, D.G. Experimental thermal field measurements of film cooling above the suction surface of a turbine vane. J. Eng. Gas Turbines Power 2017, 137, 102604. [Google Scholar] [CrossRef]
- Simone, S.; Montomoli, F.; Martelli, F. Analysis on the effect of a non-uniform inlet profile on heat transfer and fluid flow in turbine stages. J. Turbomach. 2012, 134, 011012. [Google Scholar] [CrossRef]
- Feng, Z.; Liu, Z.; Shi, Y.; Wang, Z. Effects of hot streak and airfoil clocking on heat transfer and aerodynamic characteristics in gas turbine. J. Turbomach. 2016, 138, 021001–021010. [Google Scholar] [CrossRef]
- Qureshi, I.; Povey, T. A combustor-representative swirl simulator for a transonic turbine research facility. Proc. Inst. Mech. Eng. Part G J. Aerosp. Eng. 2011, 225, 737–748. [Google Scholar] [CrossRef]
- Jacobi, S.; Mazzoni, C.M.; Chana, K.; Rosic, B. Investigation of unsteady flow phenomena in first vane caused by combustor flow with swirl. J. Turbomach. 2016, 139, 041006. [Google Scholar] [CrossRef]
- Jacobi, S.; Rosic, B. Thermal investigation of integrated combustor vane concept under engine-realistic condition. J. Turbomach. 2017, 139, 021005. [Google Scholar] [CrossRef]
- Quresh, I.; Beretta, A.; Chana, K.; Povey, T. Effect of aggressive inlet swirl on heat transfer and aerodynamics in an unshrouded transonic HP turbine. J. Turbomach. 2012, 134, 61021–61023. [Google Scholar] [CrossRef]
- Qureshi, I.; Smith, A.D.; Povey, T. HP vane aerodynamics and heat transfer in the presence of aggressive inlet swirl. J. Turbomach. 2013, 135, 021040. [Google Scholar] [CrossRef]
- Werschnik, H.; Hilgert, J.; Wilhelm, M.; Bruschewski, M.; Schiffer, H.P. Influence of combustor swirl on endwall heat transfer and film cooling effectiveness at the large scale turbine rig. J. Turbomach. 2017, 139, 081007. [Google Scholar] [CrossRef]
- Schmid, G.; Krichbaum, A.; Werschnik, H.; Schiffer, H.P. The impact of realistic inlet swirl in a 1-1/2 stage axial turbine. In Proceedings of the ASME Turbo Expo 2014: Turbine Technical Conference and Exposition, Düsseldorf, Germany, 16–20 June 2014. [Google Scholar]
- Hylton, L.D.; Nirmalan, V.; Sultanian, B.K.; Kauffman, R.M. The effects of leading edge and downstream film cooling on turbine vane heat transfer. In NASA Technical Report; NASA: Washington, DC, USA, 1988. [Google Scholar]
- Hylton, L.D.; Mihelc, M.S.; Turner, E.R.; Nealy, D.A.; York, R.E. Analytical and experimental evaluation of the heat transfer distribution over the surfaces of turbine vanes. In NASA Technical Report; NASA Lewis Research Center: Cleveland, OH, USA, 1982. [Google Scholar]
- Ke, Z.; Wang, J. Conjugate heat transfer simulations of pulsed film cooling on an entire turbine vane. Appl. Therm. Eng. 2016, 109, 600–609. [Google Scholar] [CrossRef]
- Koupper, C. Unsteady Multi-Component Simulations Dedicated to the Impact of the Combustion Chamber on the Turbine of Aeronautical Gas Turbines. Ph.D. Thesis, Universite de Toulouse, Toulouse, France, 2015. [Google Scholar]
- Jiang, Y.; Zheng, Q.; Dong, P.; Yao, J.; Hai, Z.; Jie, G. Conjugate heat transfer analysis of leading edge and downstream mist–air film cooling on turbine vane. Int. J. Heat Mass Transf. 2015, 90, 613–626. [Google Scholar] [CrossRef]


Publisher’s Note: MDPI stays neutral with regard to jurisdictional claims in published maps and institutional affiliations. |
© 2021 by the authors. Licensee MDPI, Basel, Switzerland. This article is an open access article distributed under the terms and conditions of the Creative Commons Attribution (CC BY) license (https://creativecommons.org/licenses/by/4.0/).