Abstract
Air plasma spray technique (APS) is widely used in the biomedical industry for the development of HA-based biocoatings. The present study focuses on the influence of powder homogenization treatment by high-energy ball milling (HEBM) in developing a novel hydroxyapatite-barium titanate (HA/BT) composite coating deposited by APS; in order to compare the impact of the milling process, powders were homogenized by mechanical stirring homogenization (MSH) too. For the two-homogenization process, three weight percent ratios were studied; 10%, 30%, and 50% w/w of BT in the HA matrix. The phase and crystallite size were analyzed by X-ray diffraction patterns (XRD); the BT-phase distribution in the coating was analyzed by backscattered electron image (BSE) with a scanning electron microscope (SEM); the energy-dispersive X-ray spectroscopy (EDS) analysis was used to determinate the Ca/P molar ratio of the coatings, the degree of adhesion (bonding strength) of coatings was determinate by pull-out test according to ASTM C633, and finally the nanomechanical properties was determinate by nanoindentation. In the results, the HEBM powder processing shows better efficiency in phase distribution, being the 30% (w/w) of BT in HA matrix that promotes the best bonding strength performance and failure type conduct (cohesive-type), on the other hand HEBM powder treatment promotes a slightly greater crystal phase stability and crystal shrank conduct against MSH; the HEBM promotes a better behavior in the nanomechanical properties of (i) adhesive strength, (ii) cohesive/adhesive failure-type, (iii) stiffness, (iv) elastic modulus, and (v) hardness properties.
1. Introduction
In recent decades, biomaterials research has focused on the improvement of implant design features to accelerate bone healing as well as to provide support to the affected part of the human body. Metallic biomaterials like stainless steel (SS), titanium (Ti) and its alloys are widely used as artificial hip prothesis, bone, and dental implants due to their mechanical strength, excellent corrosion resistance, tensile strength, hardness, and durability [1,2]. One of the major problems associated with these materials is a poor implant fixation owing to the lack of osteoconductivity and osteoinductivity [2,3]. Moreover, metallic implants often get encapsulated by fibrous tissue prolonging the healing time and increase the risk of aseptic loosening [4]. Recently, surface modification in biomaterials has been more common in commercialized processes because the implant is the first part that interacts with the host tissue. Therefore, this modification is focused on promoting a better bio-interaction between the bulk material and the host tissue to prevent failures and promote the cell activity that occurs in the interface of biomaterials [5,6,7,8]. Numerous techniques have been elaborated to enhance the surface compatibility of implants with bone. Hydroxyapatite (HA Ca10(PO4)6(OH)2) and other calcium phosphates (CaPs) like tetracalcium phosphate (TTCP Ca4(PO4)2O) and tricalcium phosphate (TCP Ca3(PO4)2) are widely used to develop biomaterials like bone fillers, bone tissue engineering scaffolds, and bioactive coatings for implants [5,6,9,10,11,12,13]. One of the most striking properties of CaPs in orthopedic implants can enhance bone growth across the interface of the implant and the biological tissue promoting a natural fixation and reduce the use of types of cements. Furthermore, unlike the other calcium phosphates, the HA is a natural bioceramic, it is the major component of bone tissue and had a low solubility in contact with body fluids. In this manner, HA has gradually become an indispensably bioceramic used as a coating to promote a good biological response and a corrosion barrier for metallic substrates [11,12,13,14,15,16].
The atmospheric plasma spraying (APS) process is the most commonly used method for the commercial production of HA implants, some of the advantages of APS over other techniques are (i) the low cost, (ii) high deposition rate obtaining coatings with thicknesses greater than 100 microns in a matter of minutes, (iii) stronger bonding [5,10,15], and (iv) increased uniform bone ingrowth and/or on growth at the bone–implant interface [17]. However, during the plasma spray process, HA powder is subjected to high temperature and decompose to phases like TTCP, TCP, and CaO. These phases can have both a positive and negative impact on different properties [6,10,13,15,18]. Attempts are done to obtain bio composites with multifunctional properties and stronger bone grafting qualities. Different studies report the combination of HA with barium titanate (BT) to obtain HA/BT composites for scaffolds development and coatings shows a good cell interaction and promotes an osseo-integration [19,20,21,22,23,24,25,26].
High-energy ball milling, also called the mechanical alloying process, is widely used for developing new nanomaterials, alloys, quasicrystalline materials, and nanocomposites in powder form to produce new materials for diverse industrial applications, as aerospace, aeronautic, construction, automotive and biomedical industries. For the development of new biomaterials, high energy ball milling was used to produce new alloys and composites materials with better behavior than traditional processing materials, this technique has a high impact on mechanical, physicochemical, and biological properties, this technique performs a better phase homogenization in alloys and composites materials that improves these better behaviors [18,27,28]. The high-energy ball milling technique is simple and has a high potential to scale up to produce large quantities of coatings.
The work aims to optimize the feedstock homogenization processes to develop a novel HA/BT composite coating for its future application in orthopedic coated prothesis. Additionally, this research was carried out to determine the impact of the feedstock homogenization processes and the BT weight percentage ratio influence in phase distribution to enhance the bonding degree behavior. To assess this impact, the coating powder feedstock was treated by two routes: high-energy ball milling (HEBM) and mechanical stirring homogenization (MSH). To evaluate the effect of BT on the HA-based coating matrix, three different percentage weight ratios were used: 10%, 30%, and 50%.
2. Experimental Procedure
2.1. Powder and Processing
Pure synthetic HA (CAS# 1306-06-5) with a particle size around 35–60 µm procured commercially from CaP Biomaterials, LLC (East Troy, WI, USA) was used as the feedstock to develop coatings according to ISO 13997-2 (implants for surgery—hydroxyapatite, part 2: coatings of hydroxyapatite) [29], the minimum amount of HA phase in implant coatings shall be 50% mass fraction or greater. To analyze the influence of BT in the HA matrix the feedstock was prepared by blending different weight percent ratio (w/w%), as it describes in Table 1, of BT nanoparticles (CAS# 12047-27-7, US Research Nanomaterials, Inc, Houston, TX, USA), with particle size around of 180–220 nm. The different powder matrix was homogenized by two different methods: (i) mechanical stirring homogenization (MSH), and (ii) high energy ball mill (HEBM). For MSH, the powders were deposited in a flask and rotated for 1 h at 50 rpm at an angle of 50°. For HEBM, a high energy ball mill (SPEX 8000M, Metuchen, NJ, USA) was used. Zirconia stabilized with yttrium (YSZ 8% mol) balls were used as a grinding medium; the diameters of the grinding medium were 1 cm and 0.5 cm at a mass-ball ratio of 2:1; the grinding was carried into a nylamide vial for 25 min with 0.2 mL of alcohol as a control agent.

Table 1.
Nomenclature used for different weight percent ratio of HA-BT composite.
2.2. Substrate Preparation
The Ti6Al4V-extra low interstitial (ELI) grade titanium alloy was used as a substrate, in the form of disks with 18 mm of diameter and 3 mm of thickness. The samples were cut down in a low-speed precision cutting machine (IsoMet, BEUHLER, Lake Bluff, IL, USA) with a 4″ diamond wafering blade (MetLab Co., Niagara Falls, NY, USA) and polished with SiC emery paper of 180, 220, 400, 600 grit size. The substrate disks were then grit blasted with 700 µm alumina grits. After the superficial treatment the samples were cleaned in an ultrasonic bath with pure ethanol (JT Baker solution, Phillipsburg, NJ, USA) to remove the fat on the surface and then dried.
2.3. Plasma Spraying
Plasma spray deposition technique is the process of spraying a material in form of powder onto a surface to offer a coating. The material is added into a very high temperature plasma flame, where it is heated and accelerated to a higher velocity. Therefore, the melted particles collide onto the substrate surface. In this study, coatings were developed by PRAXAIR Surface Technologies plasma thermal spray equipment (SG100, Indianapolis, IN, USA). The coating process parameters employed are shown in Table 2. To determine the coating thickness, a micrometer was employed to measure the samples before and after the coating process. The thickness was around 180–200 µm. The measurements were confirmed by SEM in cross-section analysis.
Table 2.
Air plasma spray (APS) parameters.
3. Characterization
3.1. Crystal Phases Identification
X-ray diffraction (XRD) measurements were realized to identify the phases present in the different powder matrices and coatings. X-ray diffractometer BRUKER, D8 ADVANCE (Karslruhe, Germany), was used with Cu Kα radiation (λ = 1.5418 Å). The diffraction data were collected through Bragg–Brentano geometry over the range of 20° to 60° in 2θ. The acquisition rate was 0.02° in 2θ for 100 s. Match! Crystal impact software version 3.11 [30] was employed for phase identification.
The next step consists of determining the average apparent size and standard deviation using the Scherrer’s formula [31] for the HA and BT phase of the coatings. To model the peak shape, the Thompson–Cox–Hasting pseudo-Voigt axial divergence asymmetry function is considered in the profile fitting FullProf suite program [32]. For the refinement of the X-ray diffraction pattern, the instrumental resolution file (IRF) of the X-ray diffractometer was considered to perform the line broadening correction. The FWHM of the Gaussian (HG) and Lorentzian (HL) components of the peak profile have an angular dependence given by
where V and W parameters are associated with the IRF. U and X parameters have a meaning in terms of strain. Y and IG parameters are in terms of apparent size. The refinement of X-ray diffraction patterns was displayed in the WinPlotR suite program [33] and plotted in OriginPro.
3.2. Morphology and Phase Distribution
The secondary electrons (SE) and backscattered electrons (BSE) image by the scanning electron microscope (SEM) HITACHI (SU3500, Naka, Japan) and field emission scanning electron microscope (FE-SEM) JEOL (JSM7401, Tokyo, Japan) were employed to acquire the micrographs of the primary powders and the different feedstock of HA/BT. For the analysis, powders were dispersed in a pure ethanol solution (JT Baker) by ultrasonic bath, then an aliquot of the solution was taken and deposited on a SiO.
The backscattered electrons (BSE) and elemental distribution by X-ray energy dispersion spectroscopy (EDS, Oxford Aztec, Abingdon, Oxfordshire, UK) techniques attached by the scanning electron microscope (SEM) HITACHI (SU3500, Naka, Japan), were employed to acquire the superficial and cross-section contrast image to determinate the HA/BT coatings phase and elemental distribution, respectively. For cross-section SEM analysis, the HA/BT coatings samples were sectioned through the same cutting process mentioned in the 1.2 substrate preparation section. The samples were then assembled into resin, submitted to metallographic preparation and polished with alumina.
3.3. Bonding Strength
The adhesion degree measure was performed in INSTRON, 3382 10 Ton universal testing machine according to the ASTM C-633 (Standard Test Method for Adhesion or Cohesion Strength of Thermal Spray Coatings) [34], the total adhesion of the coating was determinate, as well as the failure-type that might occur during the test. For the test configuration Ti6Al4V alloy fixtures were prepared by the same methodology described in the 1.2 section. The fixtures were then coated with HA/BT powders as stated in the 1.3 plasma spraying process. Conforming to the ASTM C633 test configuration the HA/BT coated fixtures were assembled with Armstrong Epoxy Adhesives (A12, ARMSTRONG PRODUCTS CO, North Billerica, MA, USA). For each sample a 0.030 inches per minute tensile load was applied meanwhile the maximum load was registered for a five-repetition assay.
After the adhesive strength assay, visual analysis was realized to identify the adhesive/cohesive failure behavior of the coating. Moreover, the coated fixture surface and the epoxy side fixture were analyzed by ImageJ software version 1.51j8 [35] in order to quantify the percent of adhesive/cohesive failure behavior.
3.4. Nanomechanical Properties
Nanomechanical properties such as stiffness (S), elastic modulus (E), and hardness (H) were evaluated using nanoindentation, using a Nano Indenter (Agilent technologies model G200, Chandler, AZ, USA) coupled with a DCM head. The equipment was calibrated using a standard fused silica sample. Tests parameters of area function were: C0 = 24.08, C1 = −177.29, C2 = 6724.23, C3 = −25,403.10, and C4 = 18,745.11. The coefficients or parameters of area function are constants that describe the deviation from the Berkovich geometry due to blunting at the tip [36]. Berkovich diamond indenter with a tip radius of 20 ± 5 nm was used to determine the elastic modulus, stiffness, and hardness. The loads were 0.3 and 5 mN. The strain rate of 0.05 s−1, harmonic displacement of 1 nm, frequency of 75 Hz, Poisson’s coefficient of ν = 0.36 were employed, and in arrangement matrix of 5 × 5 indentations with total of 25 measurements were recorded per zone. During indentation, a curve describing the relationship between load (P) and displacement (h) is continuously monitored, with the purpose of measure the nanomechanical properties of the composite samples. The Oliver and Pharr method with controlled cycles [36] was used. The basic analysis of nanoindentation load-displacement curve (P-h) was established based on the elastic contact theory given by Sneddon [37,38]. The elastic modulus was determined by the Sneddon equation’s as
where β is a constant that depends on the geometry of the indenter (β = 1.034 for a Berkovich indenter), Er is the reduced elastic modulus, which accounts for the fact that elastic deformation occurs in both the sample and the indenter, and A is the contact area that is a function of the penetration depth or displacement (h) [36]. The elastic modulus, E, can be calculated by considering the compliance of the specimen and the indenter tip combined in series,
where Ei, E, and υi, υ are elastic modulus and Poisson’s ratio of diamond indenter and specimen respectively. For the diamond indenter Ei = 1140 GPa and υi = 0.07 are used (G200 Agilent manual, Agilent technology, USA, Chandler, AZ, USA). The hardness (H) was calculated using Equation:
4. Results
4.1. Powder Characterization
Figure 1 shows the SE micrographs of the primary powders and the respective histogram obtained from the particle size distribution analysis. The micrographs show a spheroidal and sub rounded particle morphology for synthetic HA and BT powders, respectively. ImageJ software was employed to measure the particle size from at least five SE micrographs. The histogram which contains 300 particle measure data were analyzed by Origin Pro software version 8.5 [39], LogNormal fit curve using the Levenberg–Marquardt iteration method was employed to determine the average particle size of the powders. The histograms obtained confirm that the average particles sizes of the commercial powders are around 47 ± 7 µm for HA and 201 ± 6 nm for BT.
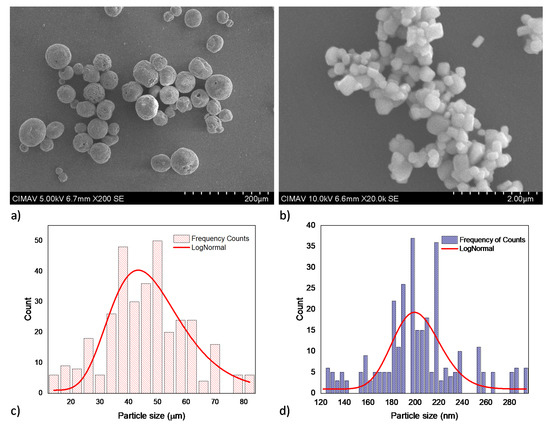
Figure 1.
Primary powders SEM micrographs and the respective particle size histograms for: (a) and (c) HA, (b) and (d) BT.
Furthermore, representative HA/BT powders micrographs acquired by FE-SEM from the BSE signal, shown in Figure 2, exhibit the impact of the two powder homogenization processes. Figure 2a reveals that concerning the HA and BT primary powders the MSH process does not promote any change in morphology or particle size for the HA/BT powders. On the other hand, the HEBM homogenization process leads to particle size decreases only for the majority phase, which is the brighter one in Figure 2b. According to the 2c HEBM process histogram, the particle size average decreases about 7 ± 6 µm. In addition, despite the homogenization process and weigh percent ratio the BT nanoparticles maintains both morphology and size as Figure 2a,b show. Careful observation of the FE-SEM images exhibits that the BT phase presents some affinity for the hydroxyapatite surface, this phase tends to ‘encapsulate’ the HA particles.
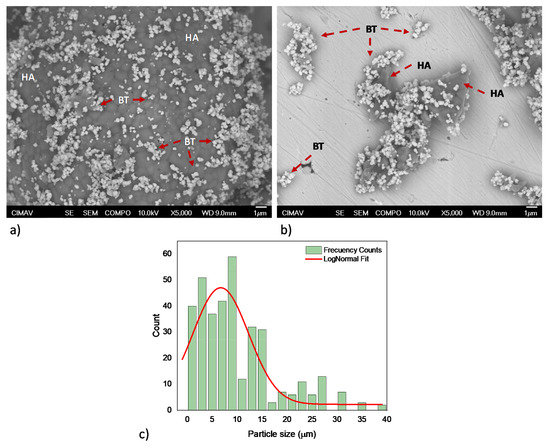
Figure 2.
HA/BT feedstock FE-SEM micrographs; (a) powder processing by MSH, and (b,c) powders processing by HEBM and their respective histogram.
4.2. Crystal Phase Identification
The XRD patterns of HA and BT primary powders presented in Figure 3, correspond to the HA (ID pattern 00-074-0556) and BT (ID pattern 00-081-2204) standard XRD peaks. Figure 3, shows the XRD patterns from the (a) MSH and (b) HEBM HA/BT powders homogenization process. For all the samples the peak broadness, intensities and positions agree with the HA and BT XRD peaks. XRD analysis from the HA/BT samples did not reveal other calcium phosphate, oxide or metallic phase formation owing to the different BT (w/w%) ratio or the homogenization process.
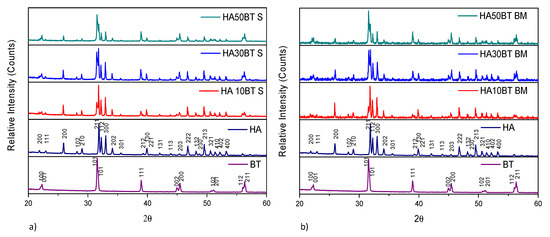
Figure 3.
XRD patterns of primary powders vs different HA/BT samples: (a) powders homogenized by MSH (S), and (b) powders homogenized by HEBM (BM).
The X-ray diffraction patterns reveal that the MSH and HEBM process do not change the crystal structure, no generates a phase transition, or neither reaction between HA and BT during the homogenization process.
Panel a and b of Figure 4 display the Rietveld refinement of X-ray diffraction pattern (using profile fitting FullProf suite program) for HA and BT powders which exhibits the average apparent size of 42.6 ± 0.4 and 7.1 ± 0.1 nm, respectively.
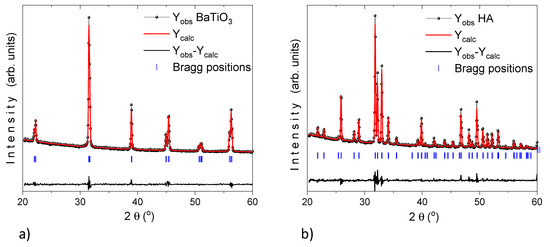
Figure 4.
XRD pattern (black dotted line, Yobs) for (a) BaTiO3 and (b) HA. Refinement analysis (red solid line, Ycalc) by the Rietveld method using the profile fitting FullProf Suite program. The horizontal (black solid line) represent the residual and the vertical lines (blue solid lines) are the Bragg positions.
X-ray diffraction patterns of the samples coated by plasma spray with different HA/BT powders homogenized by (a) MSH and (b) HEBM are shown in Figure 5. The XRD patterns clearly show that the sharp peaks corresponding to HA were broadened after the coating process for both HA/BT powders homogenization processes. In contrast with the HA/BT powder samples, with Match! Crystal impact software [30] was possible to detect the thermal degradation phases for the HA/BT coated samples, the intensities of these phases, the lattice plane (040) related to TTCP (¤ ID pattern 00-070-1379) phase, in addition the lattice plane (015) associated with TCP (● ID pattern 00-032-0176) phase. Finally, the lattice planes (111), (200), and (220) it corresponds to CaO (○ ID pattern 01-082-1690); the intensity of these degradation phases exceeds the background noise. In this manner, they can consider as a typical signal of a crystalline phase. Even with Match Crystal Impact, these signals are indexed with the corresponding ID patterns. The reported intensities are among the few signs that do not overlap with HA and BT signals.
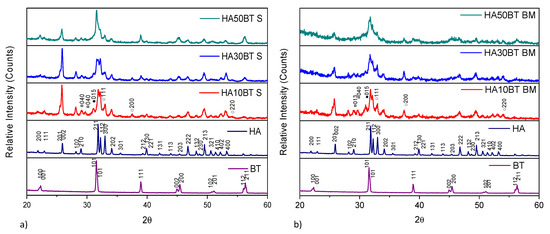
Figure 5.
XRD patterns of primary powders vs. different weight HA/BT mixes coatings: (a) coatings development using MSH obtained by homogenization process and (b) coatings development using high energy ball milling powder obtained by homogenization process.
Another side effect of the APS process was the crystallite size modification. Both homogenization processes showed a widening effect of the diffraction peaks, which indicates that phases suffered a crystallite shrinking effect of crystallite. The combination of different phenomena that occurs during the coating deposition such as: (i) the high-velocity collision of the particles, (ii) the high temperature reached by the droplets in contact to the plasma torch, and (iii) the quick solidification of droplets that takes place because of the rapid dissipation of heat to the substrate are some factors that promote the crystallite shrinking, amorphization, and as phases in APS deposition [40]. Origin Pro version 2018 [39] was employed to simulated Pseudo-Voigt fit curves by deconvolution method to determinate the FWHM for crystallite size calculation by Scherrer equation, coatings developed by MSH showed a crystallite shrinking effect, from 64 ± 3 nm to 29 ± 5 nm for HA phase, and 49 ± 3 nm to 21 ± 3 nm for BT phase; in case of coatings fabricated with the HA/BT powders homogenized by HEBM process the crystallite shrank to 21 ± 3 nm for HA and 23 ± 2 nm for BT; in case of HA phase in HEBM the shrinking effect it is major due to the contribution of plasma spray deposition and, as it shows in Figure 5b, the diminishing of the particle size caused by the HEBM process.
4.3. Image Analysis and Phase Distribution
HA/BT coatings superficial, cross-section, and their respective EDS elemental mapping images were obtained to evaluate the phase distribution. Figure 6 reveals the formation of brighter splats that corresponds to the agglomerated BT phase present in the surface of the coatings. In comparison with MHS coatings from Figure 6a,c,d, the samples developed with the HEBM powders exhibit more homogeneous phase distribution behavior as the Figure 6b,e,f BSE micrographs show. For low weight ratio concentrations (10% and 30%) the HEBM process promotes a BT low agglomeration in the HA matrix, the size of this splats is smaller than the splats formed in MSH coatings. Figure 6f shows that increase of BT concentration of 50 w/w% influences the increment and larger BT splats. On the other hand, for MSH coatings the BT phase agglomeration effect was observed, including from the low concentration of BT in the HA matrix. Figure 7 shows the cross-section BSE images, the Figure 7a,c,e reveals a large lamellar structure of BT splats formed in MSH coatings. In contrast against the MSH, in Figure 7b,d,f shows a more alternant and more compact lamellar structure formed in HEBM coatings. However in both homogenization methods, the increment of BT (w/w%) shows a enlarge effect of this lamellar structure. Besides for both methods in cross-section was observed the presence of cracks in the surface of the coatings (indicated with orange arrows in Figure 7), these cracks are typically formed during the plasma spray deposition due to high temperature reached and the quick heat dissipation of the coating. In contrast, in the interface of the substrate and the coating, the HEBM against MSH powder processing, promotes greater physical adsorption of the coatings with better mechanical interlocking behavior, does not demonstrate any coating-substrate interface fracture, as it indicated with light green arrows in Figure 7a,c,e, the MSH coatings show a poor mechanical interlocking property. Furthermore, for both methods it is possible to observe the presence of porosity and fractures in the coating region that are typically formed for HA-based coatings as a cause of the high temperature reached during the APS deposition process.
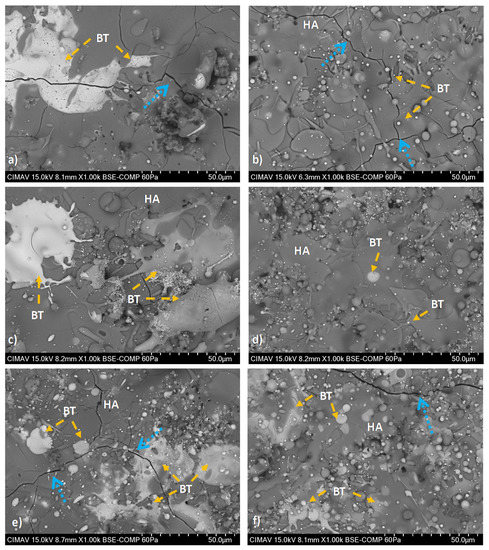
Figure 6.
Superficial BSE micrographs of coatings developed with; (i) MSH: (a) HA10BT S, (c) HA30BT S, and (e) HA50BT S; and (ii) HEBM: (b) HA10BT BM, (d) HA30BT BM, and (f) HA50BT BM. According to the BSE image signal acquisition the BT phase shows in white regions (identify in orange arrows) and HA as a continuous phase was in the gray zones. The typically fractures of the coating due to high temperature reached during the APS deposition and rapid cooling marked in blue arrows.
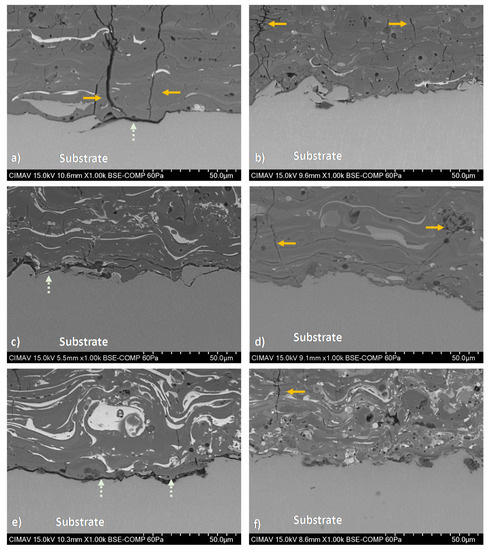
Figure 7.
Cross-section BSE micrographs of coatings developed with (i) MSH powders; (a) HA10BT S, (c) HA30BT S, and (e) HA50BT S; and (ii) HEBM powders: (b) HA10BT BM, (d) HA30BT BM, and (f) HA50BT BM. The typically fractures of the coating marked by orange arrows, this due to high temperature reached during the APS deposition and rapid cooling. The light green arrows show the interface cracks due to poorly mechanical interlocking behavior.
In Figure 8, shows the cross-section of the coating HA30BT by HEBM process, it is possible to see that the thickness of the coating was above 50 µm and under the 200 µm to guarantees long-term stability of the implant [41].
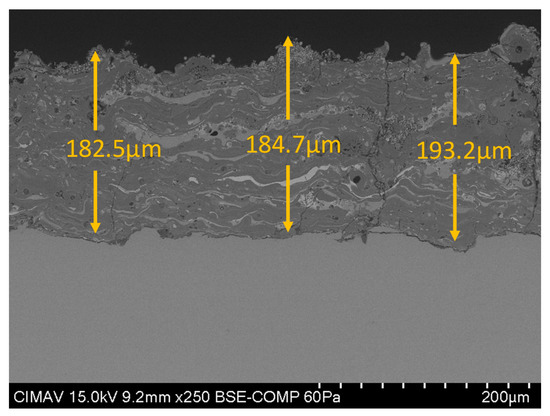
Figure 8.
Cross-section SEM micrography of HA30BT HEBM coating.
Figure 9 and Figure 10, show a representative for EDS elemental mapping for superficial and cross-section of the HA/BT coatings, in superficial and cross-section respectively; the BSE micrographs shows the brighter splats regions in the coating, according to elemental mapping these zones corresponds to the BT phase in the coatings.
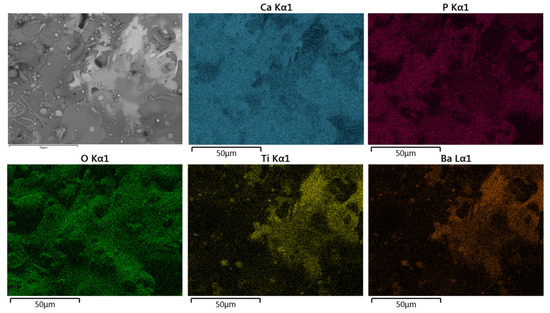
Figure 9.
Typical SEM-BSE image in superficial section and corresponding EDS elemental mapping of Ca, P, O, Ti, and Ba of HA30BT coating performed with HEBM powders.
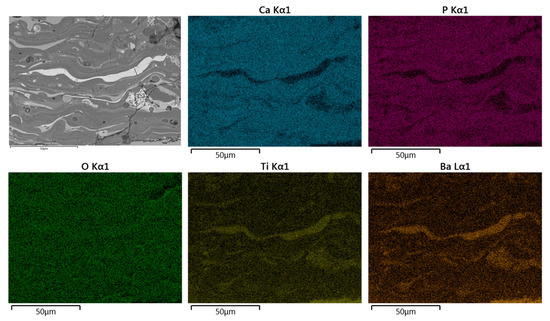
Figure 10.
Typical SEM-BSE image in cross-section and corresponding EDS elemental mapping of Ca, P, O, Ti, and Ba of HA30BT coating performed with HEBM powders.
For both configurations, the elements Ca, P, O, Ti, and Ba were detected. Concerning the results obtained from the superficial BSE images, the agglomerated phase (Figure 9 and Figure 10 selected region) corresponds mostly with Ti and Ba EDS signal. Thus, it can be inferred that the brighter splats are composed of the BT phase.
Figure 11 and Figure 12 shows both the BSE image and semiquantitative elemental analysis by EDS in the superficial section of the MSH and HEBM coatings. For both homogenization process, coatings show an increment in Ca/P molar ratio, as it sees in Table 3 for the semiquantitative elemental analysis by EDS. At the coating, only with HA the Ca/P molar ratio was 1.67 and the molar ratio of the coatings with BT shows an increment of the Ca/P molar ratio over to 2.00; according to XRD analysis, the increase in Ca/P ratio might due to the thermal degradation of HA to TCP, TTCP, CaO; and vaporization of P2O5 phase due to the high temperature reached during the plasma spray process. Both the ball milling processing and the amount of BT on the coating matrix promote greater thermal stability for the HA phase; also, coatings developed by MSH show higher values of Ca/P ratio than their homologous developed by ball milling. On other hand, the increasing amount of BT in the HA matrix shows a diminished the Ca/P ratio, this decrease in Ca/P ratio may be due to the BT phase promoting the thermal stability of HA.
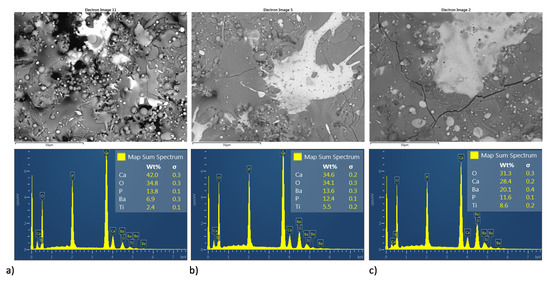
Figure 11.
Superficial BSE micrographs and EDS spectrum of coatings development by MSH; ((a–c) HA10BT S, HA30BT S, and HA50BT S respectively).
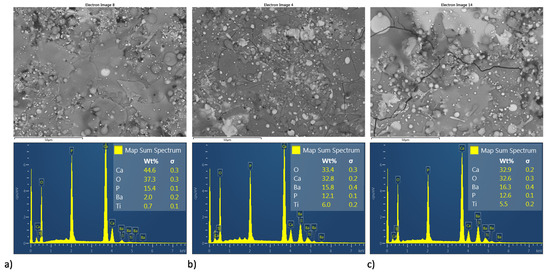
Figure 12.
Superficial BSE micrographs and EDS spectrum of coatings development by HEBM powder homogenization process (a–c) HA10BT BM, HA30BT BM, and HA50BT BM respectively.
Table 3.
Semiquantitative composition of HA/BT coatings measured by EDS.
4.4. Adherence
According to the analysis of adherence by ASTM C633 “Tensile strength assay” [34], presented in Figure 13 and Table 4 the coatings deposited with the powders homogenized by HEBM exhibit a better adherence degree behavior than the adherence values registered for the coatings developed the MSH feedstock; this behavior is related with a better phase distribution reached by homogenization process, as SEM micrographics (Figure 5 and Figure 6) show. In contrast with the pure HA samples, coatings developed with MSH powders present an increase in the adherence degree with values of 3%, 44%, and 10% (HA10BT S, HA30BT S, and HA50BT S respectively). However, for the coatings developed with powders HEBM feedstock the adhesive strength was increased 68%, 106%, and 87% (HA10BT BM, HA30BT BM, and HA50BT BM respectively) with respect to the pure HA coating. In both cases of the homogenization process, the maximum adherence detected correspond to 30 (w/w%) of BT in the matrix, which is a value of adherence above of the registered for the coatings composed by 10 and 50 (w/w%) of BT.
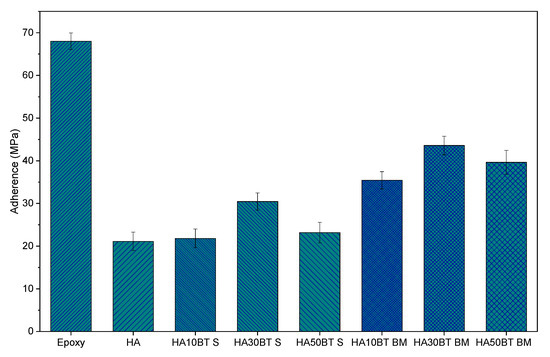
Figure 13.
Adhesive strength behavior of coatings development by MSH powder homogenization process and high energy ball milling powder homogenization process. Epoxy and HA as a comparative control.
Table 4.
Adhesives strength values and standard deviation of samples.
Figure 14 shows the visual analysis for the fixtures once subjected to the tensile strength assay for the different coatings. Based on the standard ASTM C633 the visual analysis allows to determinate a cohesive or adhesive-type failure for APS coatings. In base of the phase distribution evaluated with the BSE technique (Figure 6 and Figure 7, the most homogeneous phase distribution was obtained for the coatings developed by HEBM powders and exhibit mainly a cohesive-type failure, as Figure 13e–g images confirm. The failure occurs in the interface of the coating and in the epoxy side; the results of this analysis show a cohesive degree value of 85%, 89%, and 81% for HA10BT BM, HA30BT BM, and HA50BT BM coatings respectively. Furthermore, the coatings developed by MSH present an adhesive-type failure. This failure occurs in the interface of the substrate and the coatings, this is due to the poor mechanical interlocking properties of the coating. In Figure 14a for HA coating, b, c, and d for HABT´s coatings; demonstrate that the failure occurs the coating and the substrate interfaces with adherence values of 84%, 86%, 42%, and 75% for pure HA, HA10BT S, HA30BT S, and HA50BT S respectively.
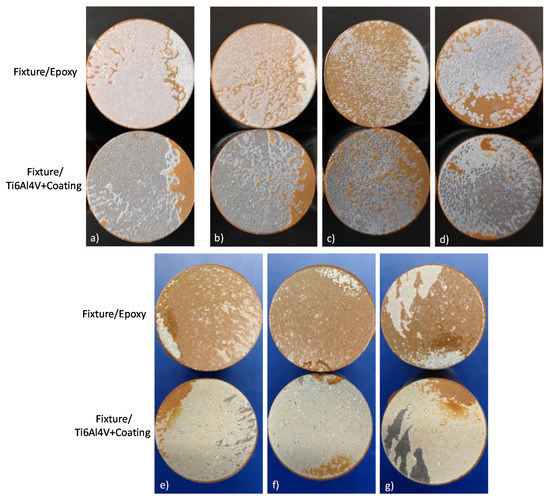
Figure 14.
Visual analysis for determination of cohesive/adhesive failure-type of coatings according to ASTM C633; (a) HA coating; (b–d) coatings development by MSH (HA10BT S, HA30BT S, and HA50BT S respectively); (e–g) coatings development by HEBM powder homogenization process (HA10BT BM, HA30BT BM, and HA50BT BM respectively).
4.5. Mechanical Properties
The Figure 15a,b is presented the characteristics curves load versus displacement into surface of the representative samples HA10BT-S and HA50BT-S in nanoindentation, synthesized by the method of stirring in solution. Figure 15c,d correspond to the HA10BT-MB and HA50BT-MB sample, synthesized by mechanical milling method. For example, for the samples with mechanical milling method, we can observe how the maximum deep of penetration in the sample with 10% BT content is around hmax = 65 ± 5nm, while in the sample with 50% BT it is hmax = 45 ± 3 nm. This is due to the reinforce of coating matrix by BT. On the other hand, coatings by MSH method (HA10BT-S and HA50BT-S) show a greater dispersion in the depth penetration or displacement in to surface than the samples prepared by HEMB (HA10BT-MB and HA50BT-MB), due that the phases in a HEMB present a better homogenization.
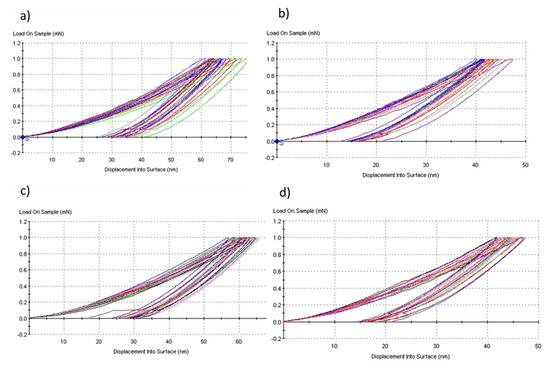
Figure 15.
Load versus displacement into surface characteristics curves for coatings method, (a) HA10BT−S, (b) HA50BT−S, (c) HA10BT−MB, and (d) HA50BT−MB.
In Figure 16a,b, the elastic modulus and hardness are presented as a function of the composition or ratio of HA and BaTiO3 (BT). In these graphs we can clearly see how the elastic modulus and hardness increase with the BT ratio since this is a ceramic with mechanical properties greater than HA. Gaillard et al. and Sung-Soo et al. report, that the BT has elastic modulus values of 190 GPa with a tetragonal structure [42,43]; while Kumar et al. (2002) [44] report, that the pure hydroxyapatite has a hardness of 6.19 GPa and an elastic modulus of 125 GPa.
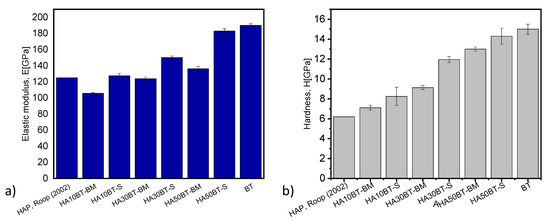
Figure 16.
Elastic modulus and hardness as a function of the BT/HA ratio and the powder preparation method (a,b) respectively.
On the other hand, it is also observed how the HEBM powder preparation method shows greater homogenization and lower hardness and elastic modulus, due to the differences in mechanical properties of HA with respect to BT; that MSH method is more heterogeneous and the values are more marked for hardness and elastic modulus. Nanomechanical properties such as stiffness, elastic modulus and hardness evaluated by nanoindentation are presented in Table 5.
Table 5.
Stiffness, elastic modulus, and hardness of samples evaluated by nanoindentation.
It is observed that applying the statistic ANOVA method in Origin Pro version 2018 [39], no significant difference is observed between the two homogenization methods (p > 0.05, null hypothesis is accepted). On the other hand, by means of the statistical analysis and the results, it found a significant influence in the mechanical properties related to the concentration of BT in the matrix of the coatings (p < 0.05, alternative hypothesis is accepted). As it shows in Figure 15 for the load vs. displacement curves for both homogenization methods at the same concentration, coatings present a similar behavior, the deep penetration of nanoindenter was around 65 nm. However, different behavior can be observed when changing of BT concentration for the same method due to the hardness of BT the penetration depth is less for both methods the deep penetration was around 45 nm.
5. Discussion
According to the standards the mechanical strength behavior, phase degradation and crystallinity of coatings is some of the main properties required for the development of HA-based coatings, some factors that influence these features were identified in this study. One of these factors was the BT concentration in the coating, it could be observed that the BT-phase behaves like a reinforcement material. As observed in the results, increasing the amount of BT in the matrix promoted a greater adhesive strength, stiffness, elastic modulus, and hardness. Another factor that had a high impact on mechanical properties like a bond strength behavior was the powder processing method, coatings developed by HEBM powder processing showed the highest values in this behavior, which is mainly due to a greater effect of BT distribution in the HA matrix and the greater mechanical interlocking achieved by HEBM powder processing, the maximum adhesion value achieved was 44 ± 2 MPa that it corresponds to HA30BT BM coating, this value is relatively close to that reported by Zhiguo et al. (2013) [45] (47.4 MPa) for a pure BT-based supersonic plasma spray coating and far above from the reported by Gadow et al. (2010) [15] (25 MPa) for HA coating applied by different thermal spray techniques. On another hand, according to the standard ASTM C633-08 [34] for visual failure analysis, coatings developed by the HEBM process shows a cohesive-type failure behavior, the cohesive failure results showed an 85%, 90%, and 81% for the coatings HA10BT BM, HA30BT BM, and HA50BT BM respectively. On another hand, coatings developed by MSH shows an adhesive type failure is predominant. This failure-type refers to the poor internal strength between the substrate and the coating, this failure type may endanger the prosthesis in case of the coating yielding; for another hand, as stated in coatings by HEBM may promotes a better failure behavior, a cohesive-type failure promotes an internal strength between the substrate and the coating, thusly the prothesis will not be endangered if the coating yields. According to these results, the 30 (w/w%) in the matrix was the maximum concentration that can be taken in a HA/BT composite material since at higher concentrations there is a decrease in mechanical properties such as adhesive strength behavior, this infers a Gauss distribution.
Through the XRD analysis for the coatings developed in this study (HEBM and MSH), the typical thermal degradation phases of the HA could be elucidated. As mention by Gadow, R. et al. (2010) [15], Kotian et al. (2019) [46], Heimann et al. (2013) [41], and Liao et al. (1999) [46], this phenomenon occurs due the high temperature reaches during the thermal spray deposition process. The HA decompositions start with the dehydroxylation that occurs in the range of 1173 to 1623 K, this tends to release functional group OH- from the crystalline forming oxy-hydroxyapatite (OHA). Reaching the temperature to 1620 to1758 K HA degradation results in TCP and CaO formation. Finally increasing the temperature over 1750 K TTCP and P2O5 start to form. In case of P2O5 phase, as reported by Heimann (2018) [47], is a rapid evaporative phase at this temperature.
Accordingly, coatings with a mass ratio of 50% are discarded for use as coatings for orthopedic prostheses, since they do not comply with the minimum established by the ISO 13799-2 standard [29]. According to the crystallite size calculation, for both methods MSH and HEBM, a crystallite shrinking effect occurs. This phenomenon is due principally to the plasma spray deposition. In the case of the HA phase in HEBM the shrinking effect is major due to the contribution of plasma spray deposition and the diminishing of the particle size in the homogenization process. As mentioned by Okasaki M. et al. (1992) [48] and LeGeros et al. (1993) [16], the crystallite shrank of HA may increase the solubility of HA based biomaterial and promotes a major activity with the medium; N. Ribeiro et al. (2010) [49] reports that HA crystallite size in order 10 nm had an important role in the adsorption of proteins that involve in cell activity; according to this, the crystallite shrank of the development of the coatings by HEBM may promote the cell growth activity.
In conjunction with the analysis of semiquantitative elemental spectroscopy using EDS, the change in the Ca/P molar ratio was determined. As reported by Chow L. et al. (2009) [6], Heimman R (2018) [47] and Lozoya D. et al. (2017) [50], the increase in Ca/P molar ratio in thermal sprayed HA-based coatings is due to the main presence of thermal decomposition phases like a TTCP, CaO, and the vaporization of P2O5 during the coating deposition. As it observed, HEBM in comparison to MSH coatings shows a slightly better increment in Ca/P molar ratio; it increased from 1.67 (HA value) to 2.1 for HEBM coatings and to 2.3 to MSH coatings. According to this, the better phase distribution reached by HEBM promotes a better thermal stability of the powders during the APS deposition.
As a relevant requirement of ISO 13779-2:2008 [29], the total amount of the CaO phase present must be relatively lower than TTCP and TCP. Unlike CaPs, and according to studies conducted by Mucalo M. et al. (2015) [10], CaO has an extremely high solubility in contact with the physiological environment, so a chronological action in a physiological medium could compromise the mechanical properties of the coating and cause failure. On the other hand, as specified by Surmeney et al. (2012) [5], the remaining CaO can be hydrolyzed by hydrothermal treatment; similarly Nimkerdphol et al. (2014) [51] report that the CaO phase in contact with the bodily fluid possible is hydrolyzed and transformed into a more stable compound such as calcium carbonate (CaCO3) or HA. According to the above, it could be observed that being treated by HEBM and increasing the concentration of BT in the matrix plays an important role in the thermal stability of the phase HA, so such treatment shows potential for application as a coating for orthopedic implants.
By contrast, to crystallite size analysis for the coating’s developed the APS parameters used promotes a crystallite shrank; as mentioned by Okasaki M. et al. (1992) [48] and LeGeros et al. (1993) [16], the crystallite shrank of HA may increase the solubility of HA based biomaterial and promotes a major activity with the medium; N. Ribeiro et al.(2010) [51] reports that HA crystallite size in order 10 nm had an important role in the adsorption of proteins that involve in cell activity; according to this, the crystallite shrank of the development of the coatings HEBM may promote the cell growth activity.
6. Conclusions
Regarding the homogenization treatments, the results show that the coatings developed by HEBM have a significant impact on the adhesive strength properties and their failure behavior. However, according to the statistical analysis for mechanical properties as a Young modulus and hardness, the HEBM homogenization process does not present great effect against MSH process.
Based on the results obtained with HEBM powders processing, and in accordance with the limitations of the percentage of phases established by ISO 13779-2 for the development of HA-based composite coatings, we find that the maximum BT concentration in HA-based coatings is close to 30 (w/w%). For further studies, the evaluation of coatings HA/BT based, a mass fraction closer to 30% may be considered.
As mentioned by the authors, the crystallite shrank observed in the developed coatings may promotes a better activity in the physiological environment and promotes the cell osteogenesis process.
Author Contributions
R.G.B. performed and designed the experiments, analyzed the data and wrote de paper; Z.S.G.E. provided technical support to perform the experiments; K.C.G. wrote de paper; I.L.B. provided technical support to perform the experiments; A.H.M. provided technical support to perform the experiments; G.H.P. analyzed the data; and V.M.O.C. directed and designed the experiments, contributed reagents/materials/tools, analyzed the data, and wrote the paper. All authors have read and agreed to the published version of the manuscript.
Funding
R.G.B. thanks to Mexico-CONACYT for the PhD scholarship support. The authors would like to thank Conacyt for the financial support.
Institutional Review Board Statement
Not applicable.
Informed Consent Statement
Not applicable.
Data Availability Statement
The raw data supporting the conclusions of this article will be made available by the authors, without undue reservation, to any qualified researcher.
Acknowledgments
We would like to give special thanks for the technical assistance of Ruben Castañeda, Karla Campos (NanoTech), Ernesto Guerrero (NanoTech), Erick Escobar, Amirah Orozco Murphy, Roberto Talamantes, Adán Borunda, and Roberto Camarillo.
Conflicts of Interest
The authors declare no conflict of interest.
References
- Senthilkumar, G.; Kaliaraj, G.S.; Vignesh, P.; Vishwak, R.S.; Nivin Joy, T.; Hemanandh, H. Hydroxyapatite—Barium/strontium titanate composite coatings for better mechanical, corrosion and biological performance. Mater. Today Proc. 2021, 44, 3618–3621. [Google Scholar] [CrossRef]
- Roy, M.; Bandyopadhyay, A.; Bose, S. Ceramics in Bone Grafts and Coated Implants. In Materials and Devices for Bone Disorders; Academic Press: San Diego, CA, USA, 2017; Chapter 6; pp. 265–314. [Google Scholar]
- Roy, M.; Bondyyopadhyay, A.; Bose, S. Induction plasma sprayed nano hydroxyapatite coatings on titanium for orthopaedic and dental implants. Surf. Coat. Technol. 2011, 205, 2785–2792. [Google Scholar] [CrossRef]
- Marsh, A.C.; Chamorro, N.P.; Chatzistavrou, X. Long-term performance and failure of orthopedic devices. In Bone Repair Biomaterials; Elsevier Ltd.: Cambridge, MA, USA, 2019; Chapter 15; pp. 349–410. [Google Scholar]
- Surmenev, R.A. A review of plasma-assisted methods for calcium phosphate-based coatings fabrication. Surf. Coat. Technol. 2012, 206, 2035–2056. [Google Scholar] [CrossRef]
- Chow, L. Next Generation Calcium Phosphate-Based Biomaterials. Dental Mater. J. 2009, 28, 1–10. [Google Scholar] [CrossRef]
- Costescu, A.; Ciobanu, C.S.; Iconaru, S.L.; Ghita, R.V.; Chifiriuc, C.M.; Marutescu, L.G.; Predoi, D. Activity, Evaluation of Low Silver Concentrations in Silver-Doped Hydroxyapatite Nanoparticles. J. Nanomater. 2013, 2013, 1–9. [Google Scholar] [CrossRef]
- Ciobanu, C.S.; Groza, A.; Iconaru, S.L.; Popa, C.L.; Chapon, P.; Chifiriuc, M.C.; Hristu, R.; Stanciu, G.A.; Negrila, C.C.; Ghita, R.V.; et al. Antimicrobial Activity Evaluation on Silver Doped Hydroxyapatite/Polydimethylsiloxane Composite Layer. Biomed. Res. Int. 2015, 2015, 926513. [Google Scholar] [CrossRef]
- Banerjee, S.; Banerjee, S.; Chakraborty, A.; Pal, T.K. Surface modifications of Endosseous dental implants: A review. J. Indian Dent. Assoc. 2016, 10, 19–25. [Google Scholar]
- Mucalo, M. Hydroxyapatite (HA) for Biomedical Applications; Woodhead Publishing Limited: Waltham, MA, USA, 2015; pp. 1–364. [Google Scholar]
- Dorozhkin, S. Calcium orthophosphates in nature. Materials 2009, 2, 399–498. [Google Scholar] [CrossRef]
- Park, J.B. Bioceramics: Properties, Characterizations, and Aplications, 1st ed.; Springer: Iowa, IA, USA, 2008; pp. 177–197. [Google Scholar]
- Ratner, B.D. Biomaterials Science: An Introduction to Materials in Medicine, 3rd ed.; Elsevier Academic Press: San Diego, CA, USA, 2012. [Google Scholar]
- Wang, Z.; Ye, F.; Chen, L.; Lv, W.; Zhang, Z.; Zang, Q.; Peng, J. Preparation and Degradation Characteristics of MAO/APS Composite Bio-Coating in Simulated Body Fluid. Coatings 2021, 11, 667. [Google Scholar] [CrossRef]
- Gadow, R.; Killinger, A.; Stiegler, N. Hydroxyapatite coatings for biomedical applications deposited by different thermal spray techniques. Surf. Coat. Technol. 2010, 205, 1157–1164. [Google Scholar] [CrossRef]
- LeGeros, R.Z. Biodegradation and Bioresorption Phosphate Ceramics of Calcium. Clin. Mater. 1993, 14, 65–88. [Google Scholar] [CrossRef]
- Sun, L.; Berndt, C.C.; Gross, K.A.; Kucuk, A. Material Fundamentals and Clinical Performance of Plasma-Sprayed Hydroxyapatite Coatings. J. Biomed. Mater. Res. 2001, 58, 570–592. [Google Scholar] [CrossRef]
- Suryanarayana, C. Mechanical alloying and milling. Prog. Mater. Sci. 2001, 46, 1–184. [Google Scholar] [CrossRef]
- Feng, J.; Yuan, H.; Zhang, X. Promotion of osteogenesis by a piezoelectric biological ceramic. Biomaterials 1997, 18, 1531–1534. [Google Scholar] [CrossRef]
- Baxter, F.R.; Bowen, C.R.; Turner, I.G.; Dent, A.C. Electrically Active Bioceramics: A Review of Interfacial Responses. Ann. Biomed. Eng. 2010, 38, 2079–2092. [Google Scholar] [CrossRef]
- Dubey, A.; Balani, K.; Basu, B. Electrically active biocomposites as smart scaffolds for bone tissue engineering. In Nanomedicine: Technologies and Applications, 1st ed.; Woodhead Publishing Limited: Philadelphia, PA, USA, 2012; pp. 537–570. [Google Scholar]
- Baxter, F.R.; Turner, I.G.; Bowen, C.R.; Gittings, J.P.; Chaudhuri, J.B. An in vitro study of electrically active hydroxyapatite-barium titanate ceramics using Saos-2 cells. J. Mater. Sci. 2009, 20, 1697–1708. [Google Scholar] [CrossRef]
- Polley, C.; Distler, T.; Detsch, R.; Lund, H.; Springer, A. 3D Printing of Piezoelectric Barium Titanate-Hydroxyapatite Scaffolds with Interconnected Porosity for Bone Tissue Engineering. Materials 2020, 13, 1773. [Google Scholar] [CrossRef] [PubMed]
- Reis, J.; Frias, C.; Canto, C.; Lu, M.; Marques, T.; Sim, O.; Potes, J. A New Piezoelectric Actuator Induces Bone Formation In Vivo : A Preliminary Study. J. Biomed. Biotechnol. 2012, 2012, 613403. [Google Scholar] [CrossRef]
- Jacob, J.; More, N.; Kalia, K.; Kapusetti, G. Piezoelectric smart biomaterials for bone and cartilage tissue engineering. Inflamm. Regen. 2018, 38, 2. [Google Scholar] [CrossRef]
- Zarkoob, H.; Ziaei-rad, S.; Fathi, M.; Dadkhah, H. An investigation on mechanical behavior of barium titanate foam with hydroxyapatite coating. Ceram. Int. 2012, 38, 3445–3451. [Google Scholar] [CrossRef]
- Rane, A.V.; Kanny, K.; Abitha, V.K.; Thomas, S. Methods for Synthesis of Nanoparticles and Fabrication of Nanocomposites. In Synthesis of Inorganic Nanomaterials, 1st ed.; Woodhead Publishing: Cambridge, MA, USA, 2018; pp. 121–139. [Google Scholar]
- Yang, L. (Ed.) Nanotechnology-Enhanced Metals and Alloys for Orthopedic Implants; Woodhead Publishing Limited: Waltham, MA, USA, 2015; pp. 24–47. [Google Scholar]
- ISO 13779-2 Implants for Surgery-Hydroxyapatite; Part 2: Coatings of hydroxyapatite; International Organization for Standardization: Geneva, Switzerland, 2018; pp. 1–5.
- Putz, H.; Brandenburg, K. Match! 3.11—Phase Analysis Using Powder Diffraction; Crystal Impact: Bonn, Germany, 2003. [Google Scholar]
- Cullity, B.D. Elements of X-Ray Diffraction; Addison Wesley: Boston, MA, USA, 1978. [Google Scholar]
- Rodriguez-Carbajal, J. Recent advances in magnetic structure determination by neutron powder diffraction. Phys. B Condens. Matter 1993, 192, 55–69. [Google Scholar] [CrossRef]
- Roisnel, T.; Rodriguez-Carbajal, J. WinPLOTR: A Window Tool for Powder Diffraction Pattern Analysis. Mater. Sci. Forum 2001, 378–381, 118–123. [Google Scholar] [CrossRef]
- Method, S.T. ASTM C633-08 Standard Test Method for Adhesion or Cohesion Strength of Thermal Spray Coatings; ASTM International: West Conshohocken, PA, USA, 2008; Volume 3, pp. 1–7. [Google Scholar]
- Schneider, C.A.; Rasband, W.S.; Eliceiri, K.W. NIH Image to ImageJ: 25 years of image analysis. Nat. Methods 2012, 9, 671–675. [Google Scholar] [CrossRef]
- Oliver, W.C.; Pharr, G. An improved technique for determining hardness and elastic modulus using load and displacement sensing indentation experiments. J. Mater. Res. 1992, 7, 1564–1583. [Google Scholar] [CrossRef]
- Sneddon, I.N. The Relation between Load and Penetration in the Axisimmetric Boussinesq Problem for a Punch of Arbitrary Profile. Int. J. Eng. Sci. 1965, 3, 47–57. [Google Scholar] [CrossRef]
- Doerner, M.F.; Gardner, D.S.; Nix, W.D. Plastic Properties of Thin Films on Substrates as Measured by Submicron Indentation Hardness and Substrate Curvature Techniques. J. Mater. Res. 1986, 1, 845–851. [Google Scholar] [CrossRef]
- Origin(Pro), Version 2018; OriginLab Corporation: Northampton, MA, USA, 2018.
- Kotian, R.; Rao, P.P.; Madhyastha, P. Original Article X-ray diffraction analysis of hydroxyapatite—Coated in different plasma gas atmosphere on Ti and Ti-6Al-4V. Eur. J. Dent. 2019, 11, 438–446. [Google Scholar]
- Heimann, R.B. Surface & Coatings Technology Structure, properties, and biomedical performance of osteoconductive bioceramic coatings. Surf. Coat. Technol. 2013, 233, 27–38. [Google Scholar]
- Gaillard, Y.; Hurtado, A.; Muños-Saldaña, J.; Anglada, M.; Trápaga, G. Nanoindentation of BaTiO3: Dislocation nucleation and mechanical twinning. J. Phys. D: Appl. Phys. 2009, 42, 085502. [Google Scholar] [CrossRef]
- Ryu, S.S.; Kim, H.T.; Kim, H.J.; Kim, S. Characterization of mechanical properties of BaTiO3 ceramic with different types of sintering aid by nanoindentation. J. Ceram. Soc. Jpn. 2009, 117, 811–814. [Google Scholar]
- Kumar, R.R.; Wang, M. Modulus and hardness evaluations of sintered bioceramic powders and functionally graded bioactive composites by nano-indentation technique. Mater. Sci. Eng. A 2002, 338, 230–236. [Google Scholar] [CrossRef]
- Xing, Z.; Wang, H.; Zhu, L.; Zhou, X.; Huang, Y. Properties of the BaTiO3 coating prepared by supersonic plasma spraying. J. Alloys Compd. 2014, 582, 246–252. [Google Scholar]
- Liao, C.J.; Lin, F.H.; Chen, K.S.; Sun, J.S. Thermal decomposition and reconstitution of hydroxyapatite in air atmosphere. Biomaterials 1999, 20, 1807–1813. [Google Scholar] [CrossRef]
- Heimann, R.B. Plasma-Sprayed Hydroxylapatite Coatings as Biocompatible Intermediaries Between Inorganic Implant Surfaces and Living Tissue. J. Therm. Spray Technol. 2018, 27, 1212–1237. [Google Scholar] [CrossRef]
- Okazaki, M.; LeGeros, R.Z. Crystallographic and chemical properties of Mg-containing apatites before and after suspension in solutions. Magnes. Res. 1992, 5, 103–108. [Google Scholar]
- Ribeiro, N.; Sousa, S.R.; Monteiro, F.J. Influence of crystallite size of nanophased hydroxyapatite on fibronectin and osteonectin adsorption and on MC3T3-E1 osteoblast adhesion and morphology. J. Colloid Interface Sci. 2010, 351, 398–406. [Google Scholar] [CrossRef][Green Version]
- Lozoya-Rodríguez, D.A.; De Lima, R.; Fraceto, L.F.; Ledezma Perez, A.; Bazaldua Dominguez, M.; Gomez Batres, R.; Reyes Rojas, A.; Orozco Carmona, V. Development of HA/Ag-NPs Composite Coating from Green Process for Hip Applications. Molecules 2017, 22, 1291. [Google Scholar] [CrossRef]
- Nimkerdphol, A.; Otsuka, Y.; Mutoh, Y. Effect of dissolution/precipitation on the residual stress redistribution of plasma-sprayed Hydroxyapatite coating on Titanium substrate in simulated body fluid (SBF). J. Mech. Behav. Biomed. Mater. 2014, 36, 98–108. [Google Scholar] [CrossRef]


Publisher’s Note: MDPI stays neutral with regard to jurisdictional claims in published maps and institutional affiliations. |
© 2021 by the authors. Licensee MDPI, Basel, Switzerland. This article is an open access article distributed under the terms and conditions of the Creative Commons Attribution (CC BY) license (https://creativecommons.org/licenses/by/4.0/).