Article

Aspects of Coatings on Buckypaper as a Study into the Expected Effects of Coatings on Carbon Nanotube Wires

1
Department of Chemical Engineering, Tecnológico de Monterrey, Monterrey 64849, NL, Mexico
2
Department of Material Science, Rice University, Houston, TX 77005, USA
*
Author to whom correspondence should be addressed.
Coatings 2021, 11(7), 743; https://doi.org/10.3390/coatings11070743
Submission received: 4 May 2021 / Revised: 7 June 2021 / Accepted: 9 June 2021 / Published: 22 June 2021

Abstract

:
Buckypaper (BP) was used as an accumulation of nanotubes to simulate as carbon nanotube (CNT) wires to study the interaction between four different insulating coating materials and CNTs. The wettability and electrical conductivity performance of each CNT/coating pair was assessed. The BP was prepared by filtering a sonicated solution of single-walled carbon nanotubes and N,N-Dimethylformamide, through a polytetrafluoroethylene (PTFE) membrane of 0.45 µm pore size. It was observed with Scanning Electron Microscopy, its chemical composition determined by X-ray Photoelectron Spectroscopy, its imperfections and purity measured by Raman Spectroscopy and the porosity (%) and pore distribution obtained by Nitrogen Physisorption. The results showed similar porosity and surface structure to that of reported CNT wires. The surface free energy of the BP was obtained through the Owens-Wendt method, and surface tension of the coatings was calculated with pendant drop measurements to find the adhesion and wettability parameters. Epoxy resin showed the highest wettability and adhesion, which resulted in infiltration into the BP that decreased electrical conductivity by 65%. In contrast, the insulating varnish showed much lower level of wettability and adhesion which resulted in the lowest decrease in conductivity (9.3%).

1. Introduction

The inclusion of carbon nanotubes (CNTs) in composites has been shown to enhance the performance of materials used in many industries such as aerospace, automotive, civil infrastructure, marine, and sporting goods [1]. Other material property improvements have been seen in the areas of electrical heating, polarization, energy harvesting, and inductors [2,3,4,5]. The most promising applications of CNTs are the ones where functional materials are made of 100% CNTs. Two areas that can benefit from such materials are transportation and energy distribution, i.e., replacing metal conductors used for electrical wiring and electricity transmission lines with lightweight, multifunctional alternatives. CNT-based conduction wires have shown high conductivity while remaining low in weight. Iodine doping of CNT fibers has shown further increases in electrical conductivity, achieving higher specific conductivities than copper and aluminum [6]. However, any attempt to substitute the typical metallic conductors with CNT-based fibers should consider the necessary insulative coating and how to apply it. Those considerations require studying the coating phenomena and their effects on electrical conductivity. To study these phenomena, several items should be considered, such as the hydrophobic nature of the CNT, its porous structure, and wettability [7,8,9]. With this in mind, this study investigated the interactions between several insulative coating materials and buckypaper (a surrogate for CNT wires) made from single-walled carbon nanotubes (SWCNT) to determine the effects of wettability and adhesion on electrical conductivity.

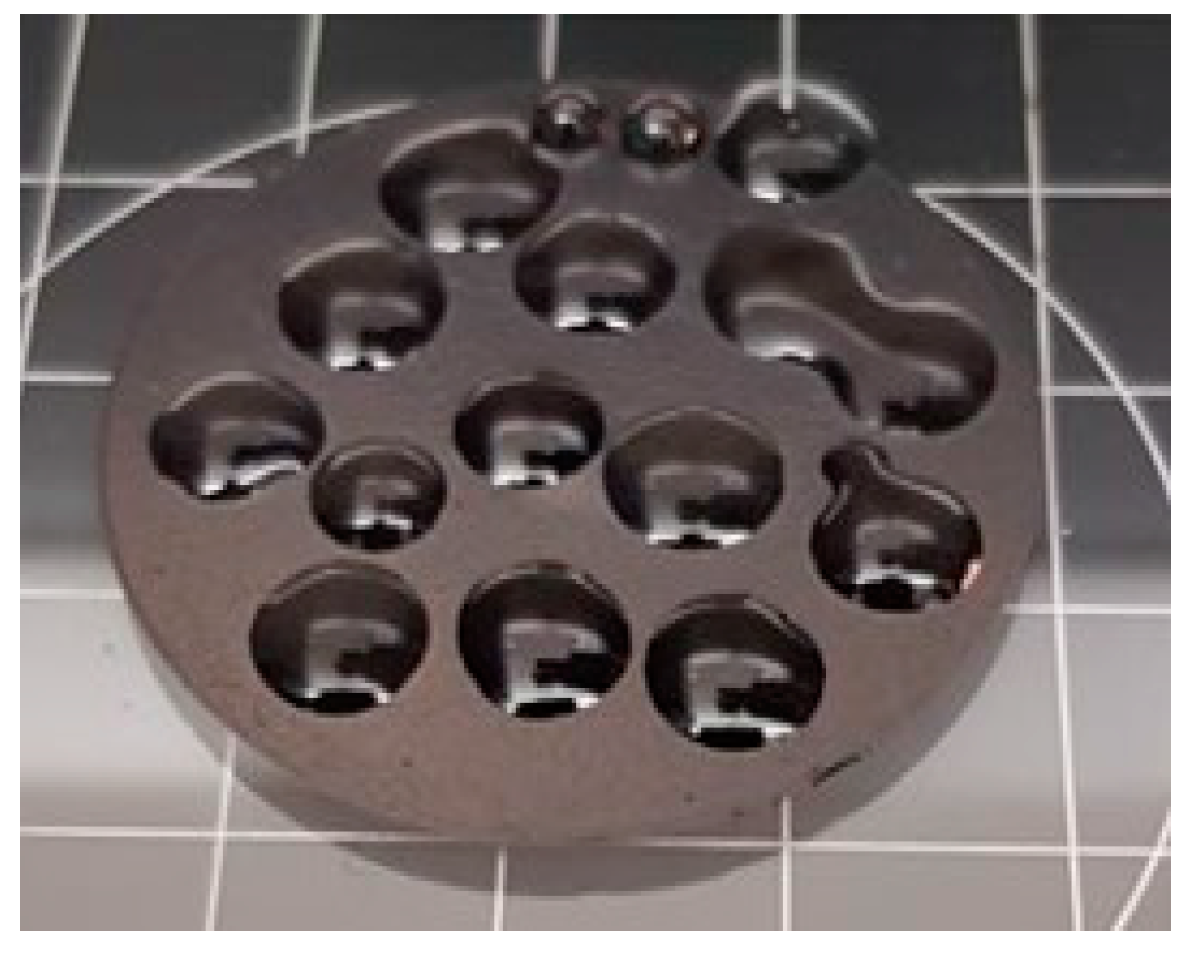
2. Materials and Methods

SWCNT, produced by the high-pressure carbon monoxide (HiPCO) method, were acquired from NanoRidge Materials (Houston, TX, USA, 97% purity). These SWCNT were processed into buckypaper (BP) by the following method:
  • A solution of 0.0540 g of SWCNTs and 100 mL of N, N-Dimethylformamide obtained from Sigma Aldrich® (St. Louis, MO, USA) is prepared.
  • The solution is then sonicated for 45 min with a tip sonicator with a 45% amplitude and a pulse rate of 2 s on and 2 s off.
  • As soon as the sonication is over, 50 mL of isopropanol are poured and allowed to sit for 15 min on a filtering setup consisting of a 1000 mL vacuum filtering flask, a rubber stopper, a glass support base, a 300 mL glass funnel, a clamp and a polytetrafluoroethylene membrane filter with a 47 mm diameter and 0.45 µm pore size from Sartorius Stedim Biotech GmbH (Göttingen, Germany).
  • The membrane is taken from the setup and the BP is carefully peeled and placed on a Petri dish. It is then placed in the oven at 80 °C for 30 min.
The BP was tested with four different coating materials. For the coating, the selected insulating materials were:
Glyptal® 1201 Red Enamel (Glyptal®, Chelsea, MA, USA, Xylene solvent, 60% weight of solids).
Glyptal® 1202 Insulating Varnish (Glyptal®, Chelsea, MA, USA, Xylene solvent, 50% weight of solids).
635 Thin Epoxy Resin and 635 Epoxy Hardener from US Composites® (West Palm Beach, FL, USA) in a 2:1 ratio.
Epolene® wax from Westlake Chemicals (Houston, TX, USA).
The surface of uncoated BP was studied using a Renishaw in Via confocal Raman microscope, a PHI Quantera XPS, FEI Quanta 400 SEM, and a Quantachrome Novatouch NT1LX–1 instrument (Boynton Beach, FL, USA). The wettability measurements were taken with KRÜSS DSA100S (Krüss Scientific Instruments, Hamburg, NY, USA). The electrical resistance was measured with a Keithley 2400 Source meter (Keithley Instruments, Cleveland, OH, USA).

3. Results and Discussion

Several properties need to be considered when investigating effective insulating coatings for CNT wires, such as the surface properties of the CNT wire, its structure, and compatibility with those coatings. The established methods for obtaining many of these properties utilize large, flat samples. Typically, the diameters of CNT wires are very small and incompatible with equipment that measures contact angles. Bundling CNT wires to create a large enough sample would also not be compatible as the surface of this bundle would not be flat and would add unnatural porosity. Therefore, this study used BP as a surrogate for CNT wires. Using BP allows for the determination of the properties needed to assess the effects of coatings on a CNT substrate, like a CNT wire. Using BP as an approach to study CNT wires requires the quality of the CNTs, BP porosity, surface tension, and electrical conductivity to be determined. The quality of the CNTs in the BP was determined by Raman Spectroscopy data and X-ray Photoelectron Spectroscopy (XPS).

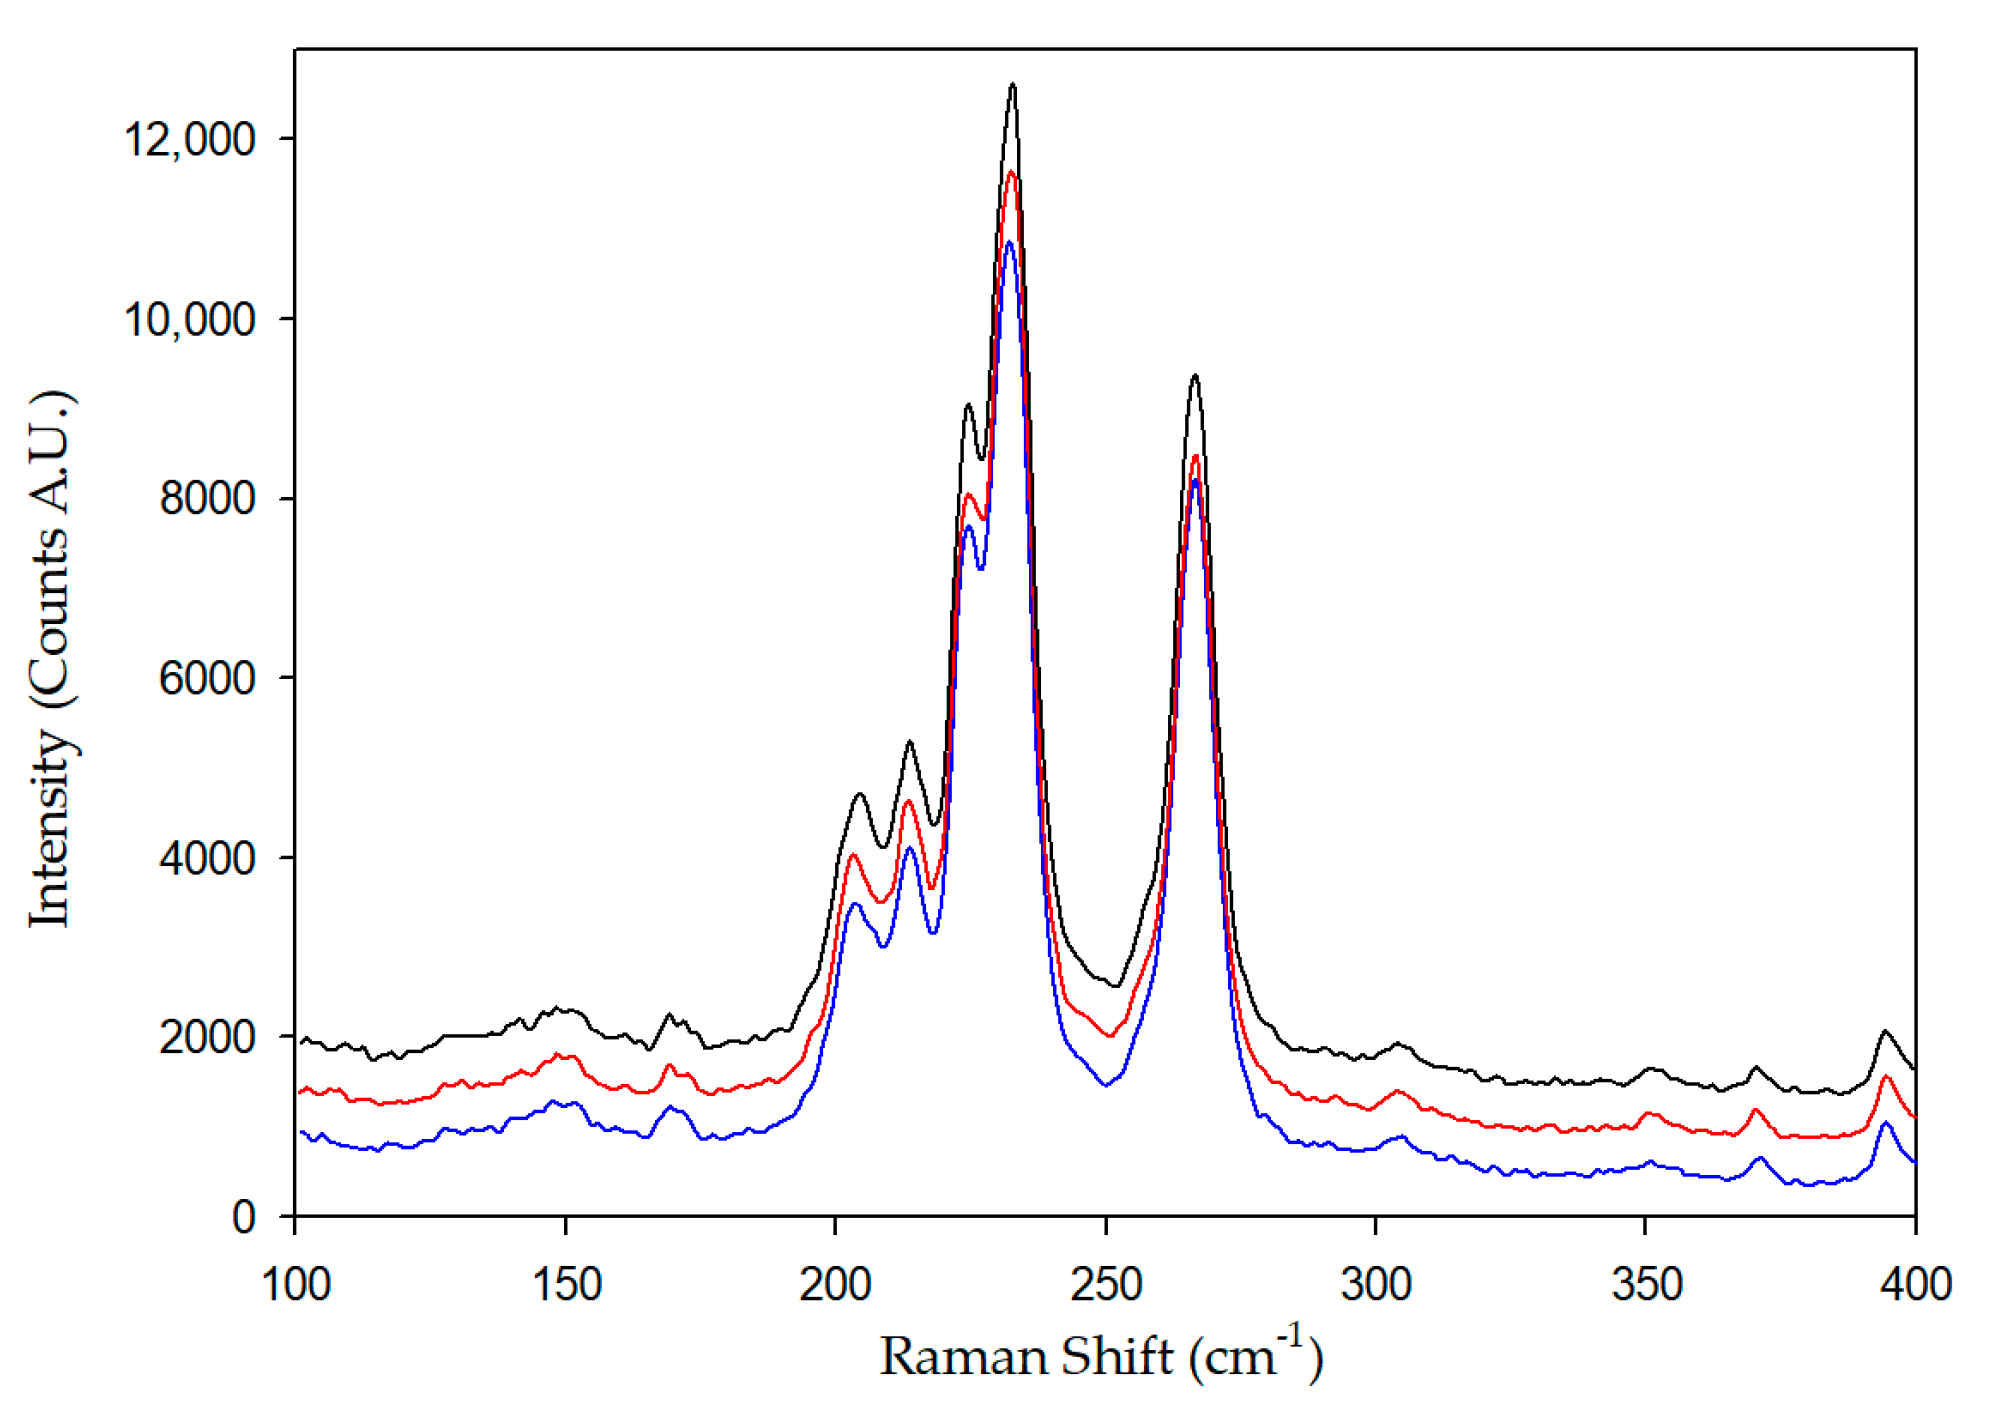
3.1. Raman Spectroscopy

Raman spectroscopy was performed on the buckypaper with a 785 nm beam at three different spots (tests 1, 2, and 3) on the same BP. Figure 1a shows the same behavior for the three measurements performed on different spots of the same BP. This suggests a consistency in the amount of material analyzed. It can be observed that, after normalizing the graphs, the three measurements overlap for each laser beam, suggesting that even in the spots where thickness was not the same, the concentration was very similar.
Using the average Radial Breathing Mode (RBM) peaks from Figure 2, a 0.98 nm diameter was calculated with Equation (1) and the published values [10] for the A and B constants (A = 234 nm/cm, B = 10 cm−1 for SWCNT) that depend on the number of CNT layers and tube–tube interactions.
WRBM = A/dt + B
A G/D ratio (non-defective carbon/defective carbon) of 16.61 for analysis of defects also from the Raman data indicated that the BP is a CNT structure of medium quality.

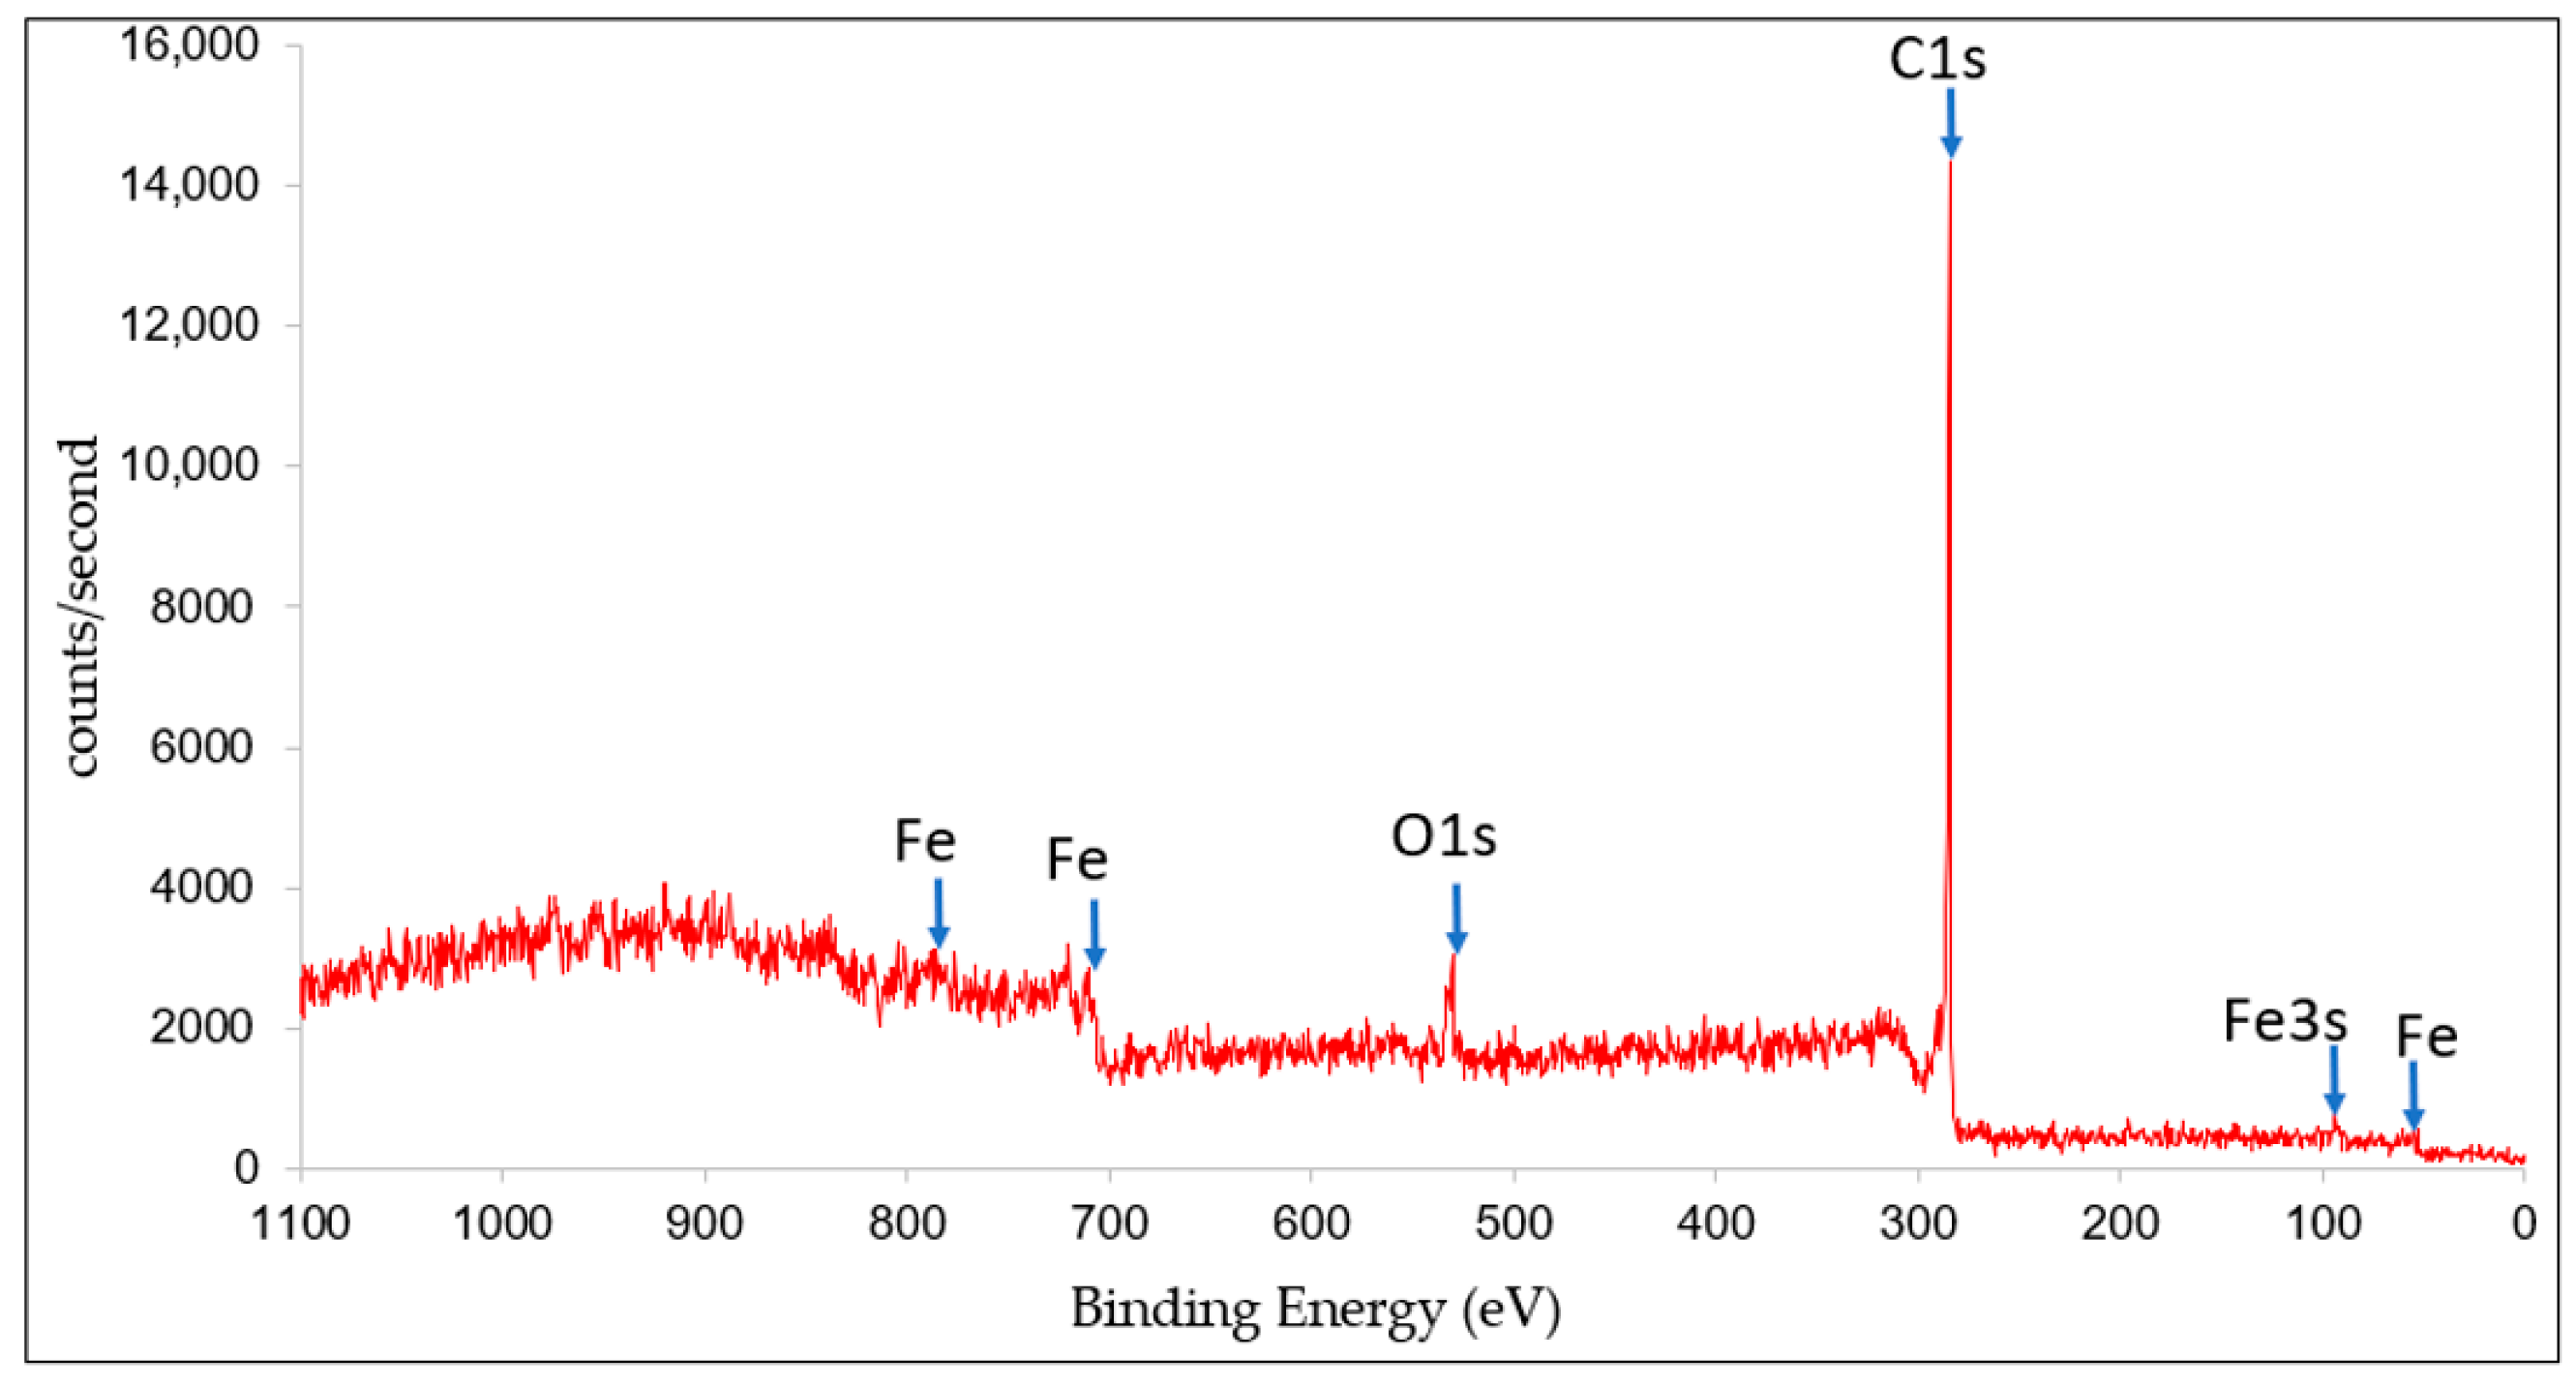
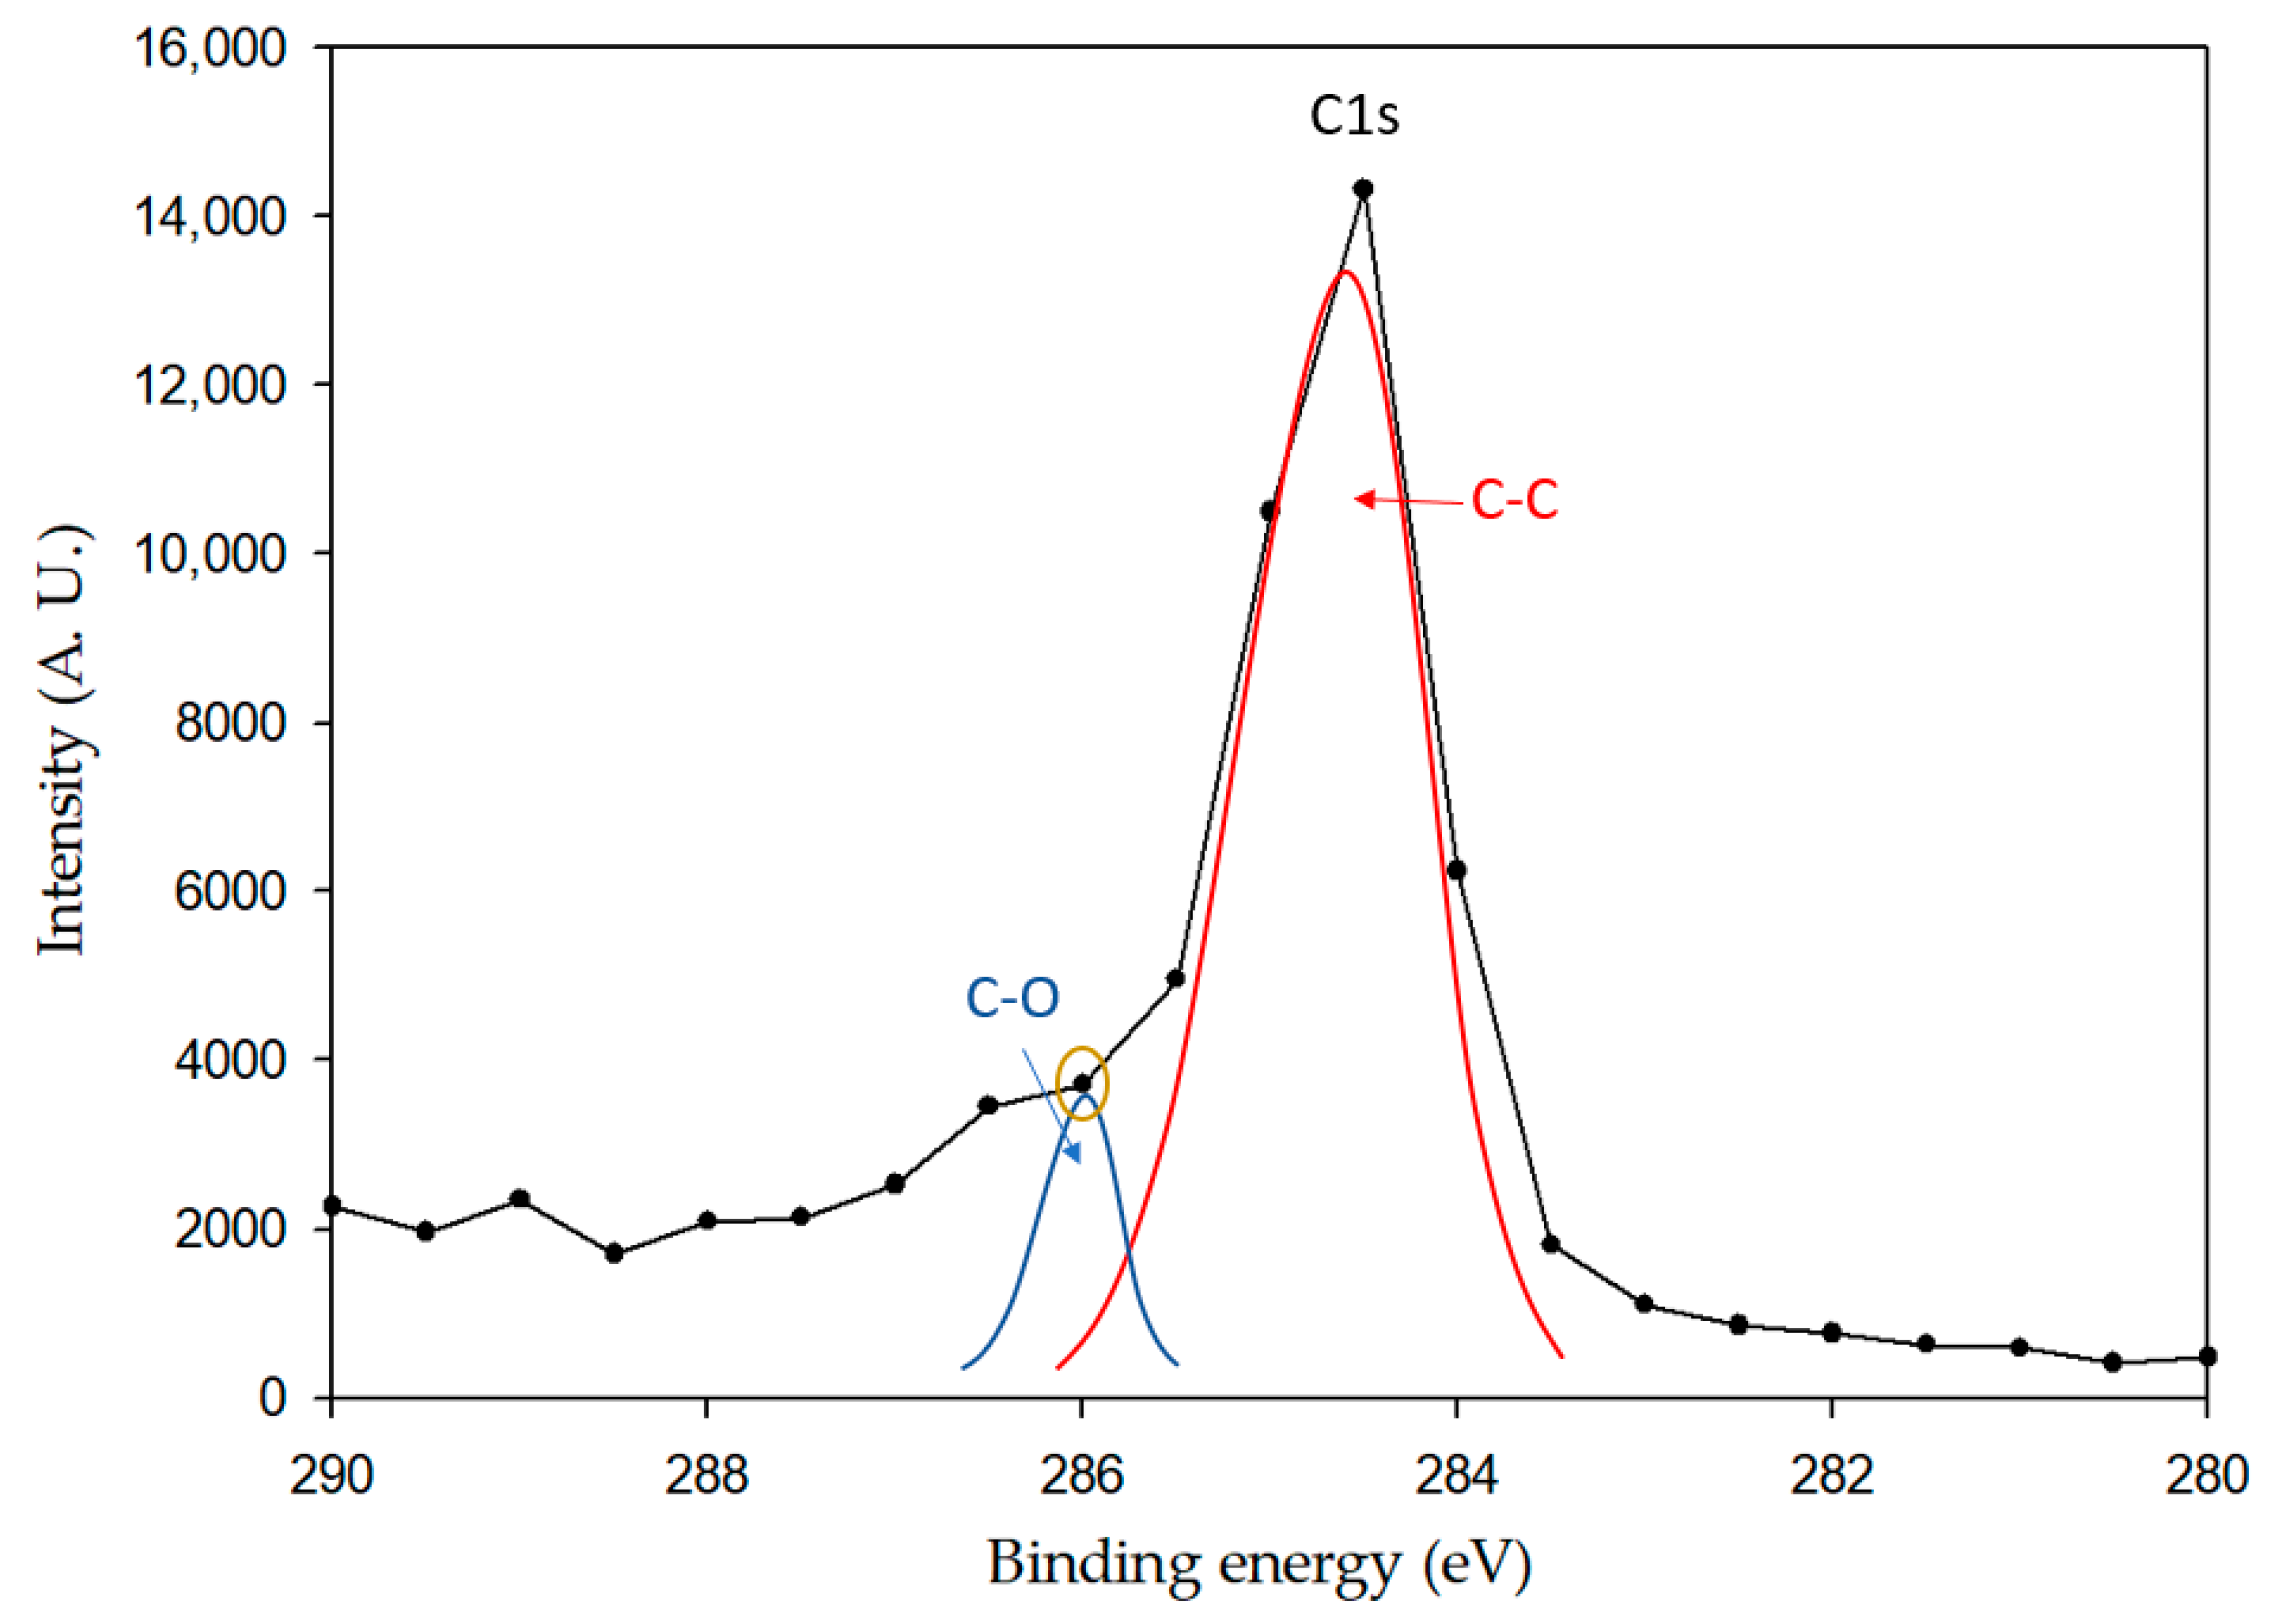
3.2. X-ray Photoelectron Spectroscopy (XPS)

The three main elements found by XPS were Carbon, Iron, and Oxygen (Figure 3). A simple deconvolution was analyzed for the obtained spectra, where C-O bonds were found (Figure 4). The O1s region shows a peak at 530 eV, which indicates the presence of metal oxides. Since carbon pentacarbonyl is used as the precursor, it makes sense that metal oxide impurities are also detected.

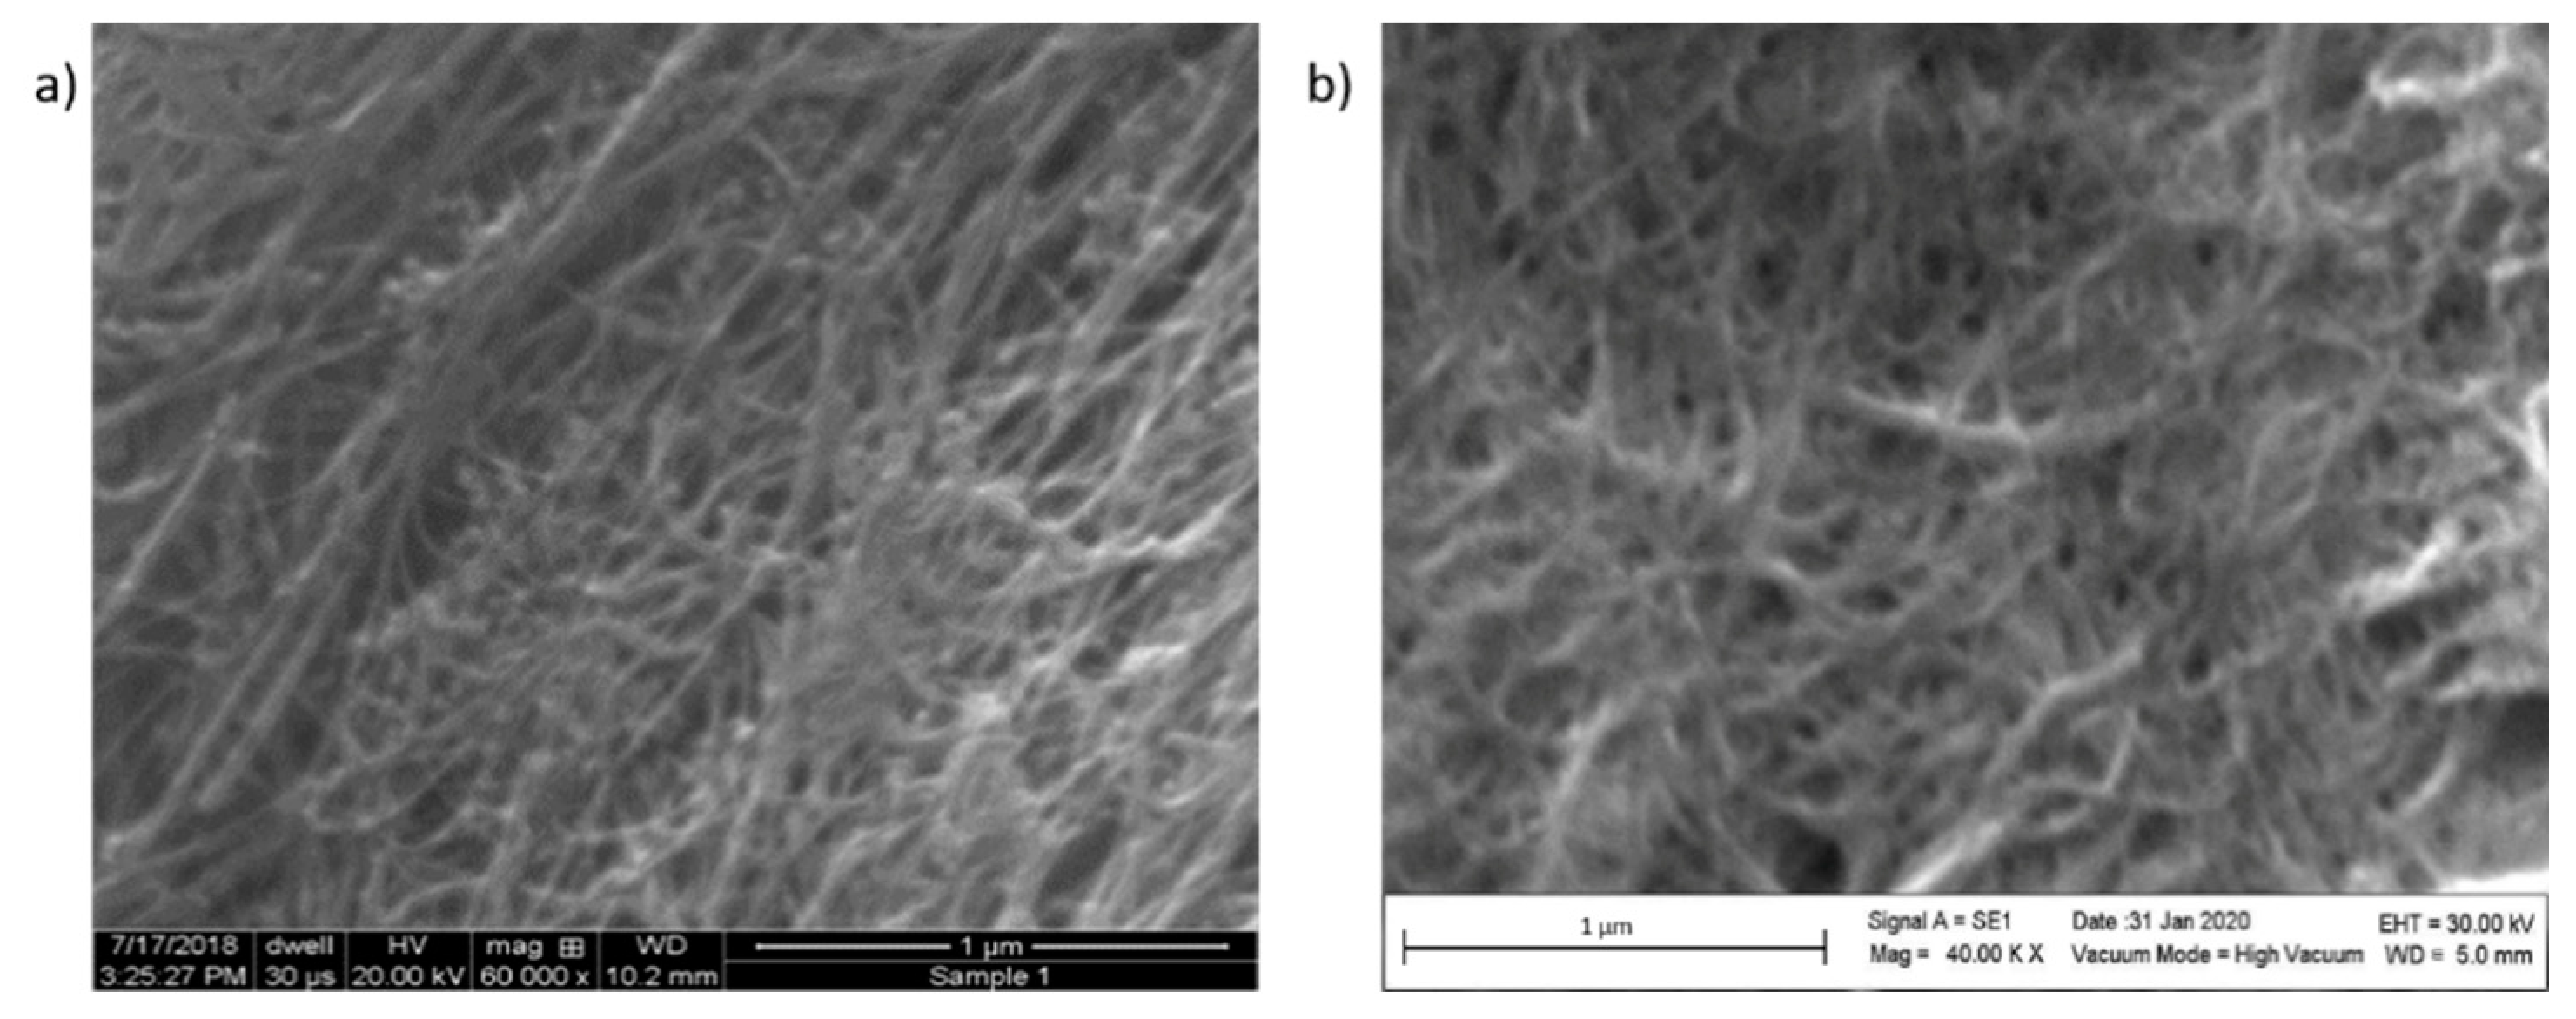
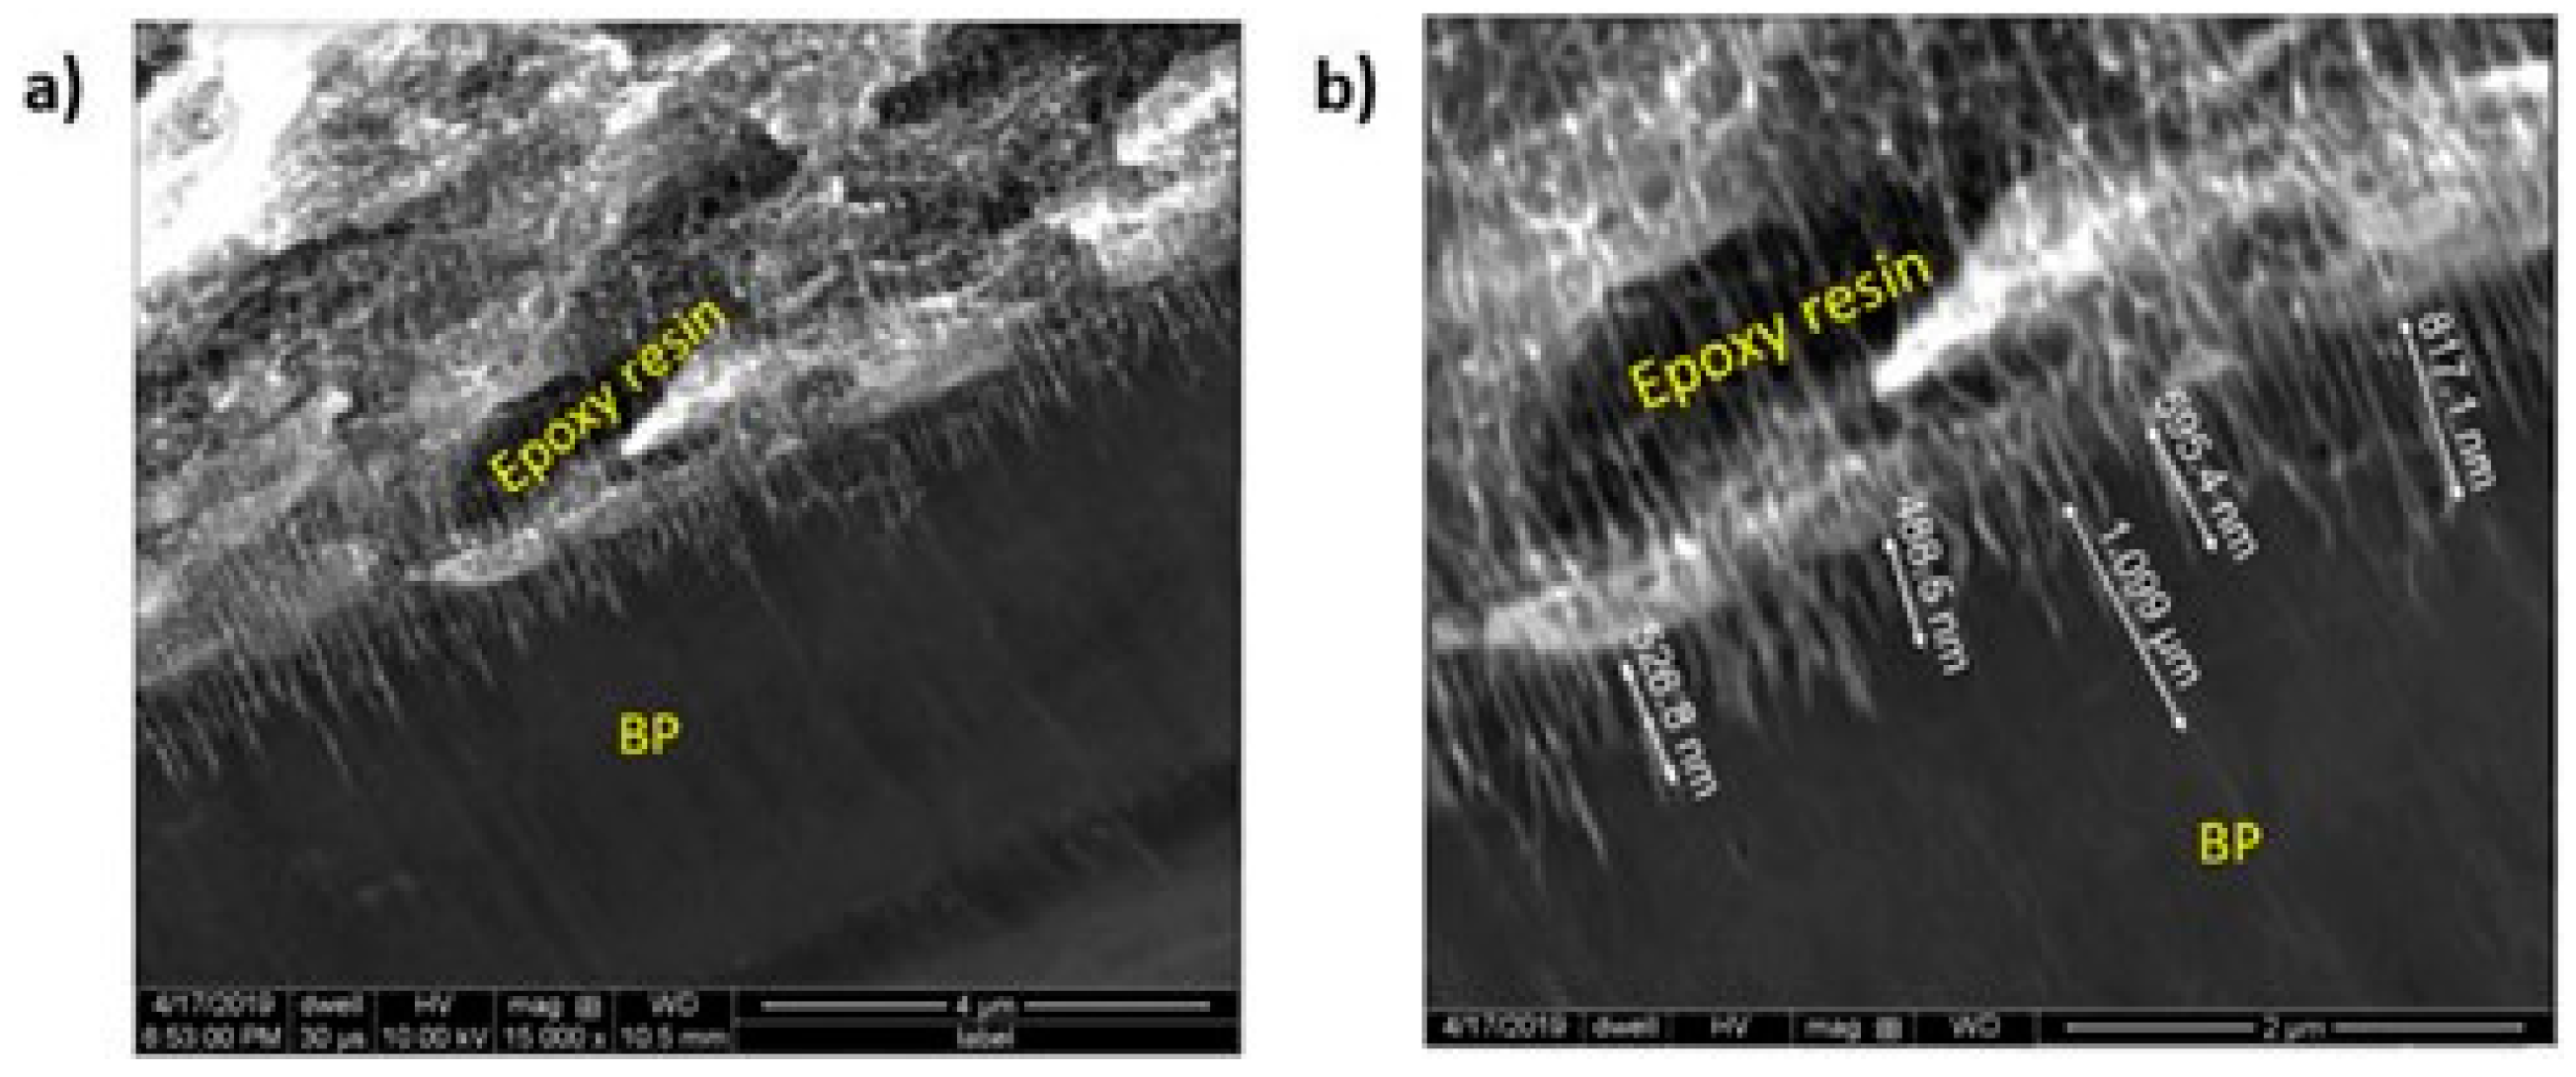
3.3. Surface Comparison

The BP showed similar surfaces (Figure 5) as MWCNT fibers, with the fiber surface having more alignment due to the direction given when forming it. Henceforth, it is one of the reasons that BP is used in this investigation as an approximation to CNT fibers.

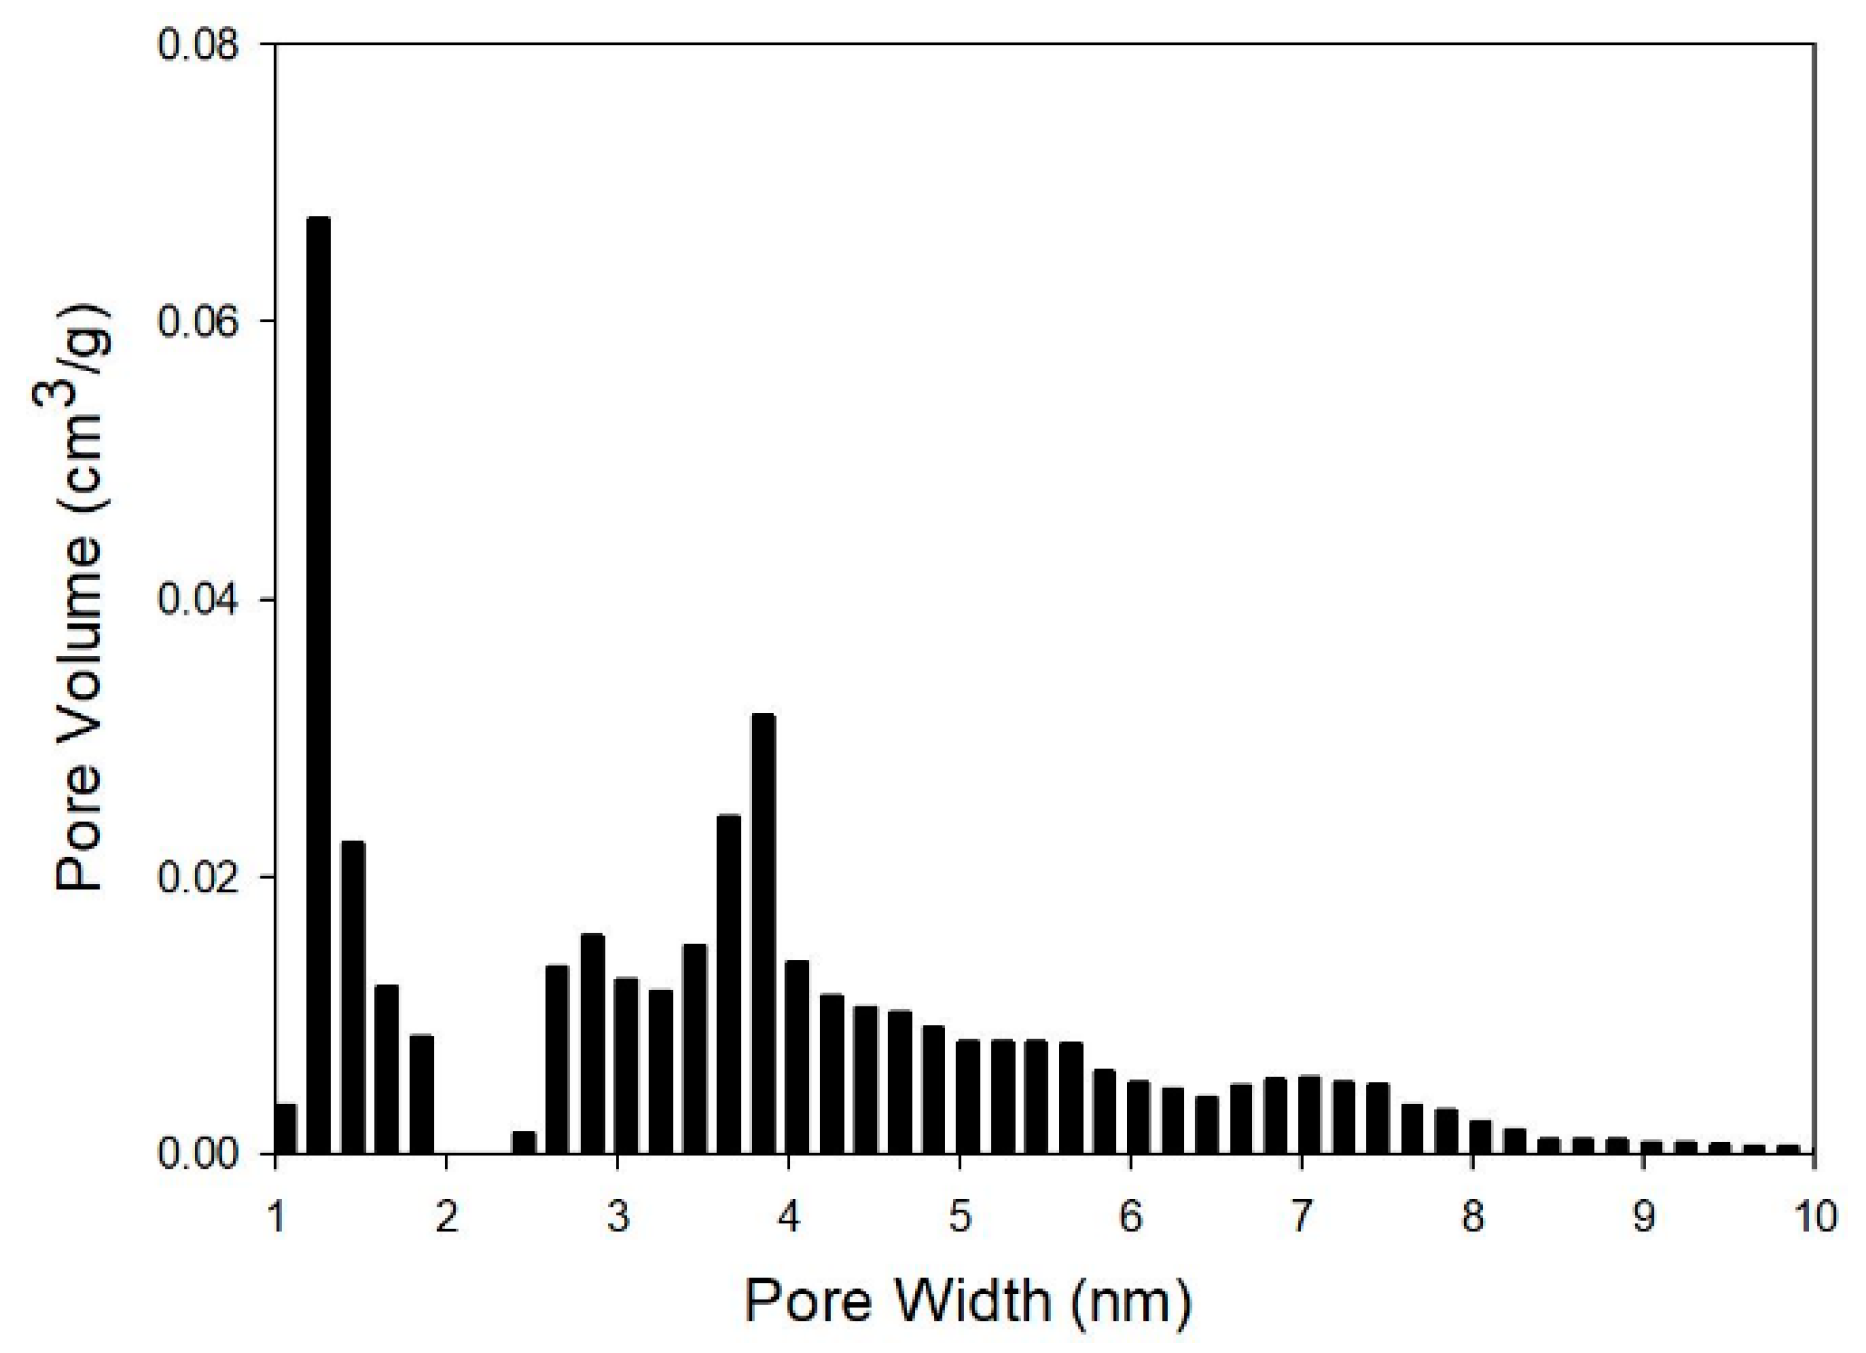
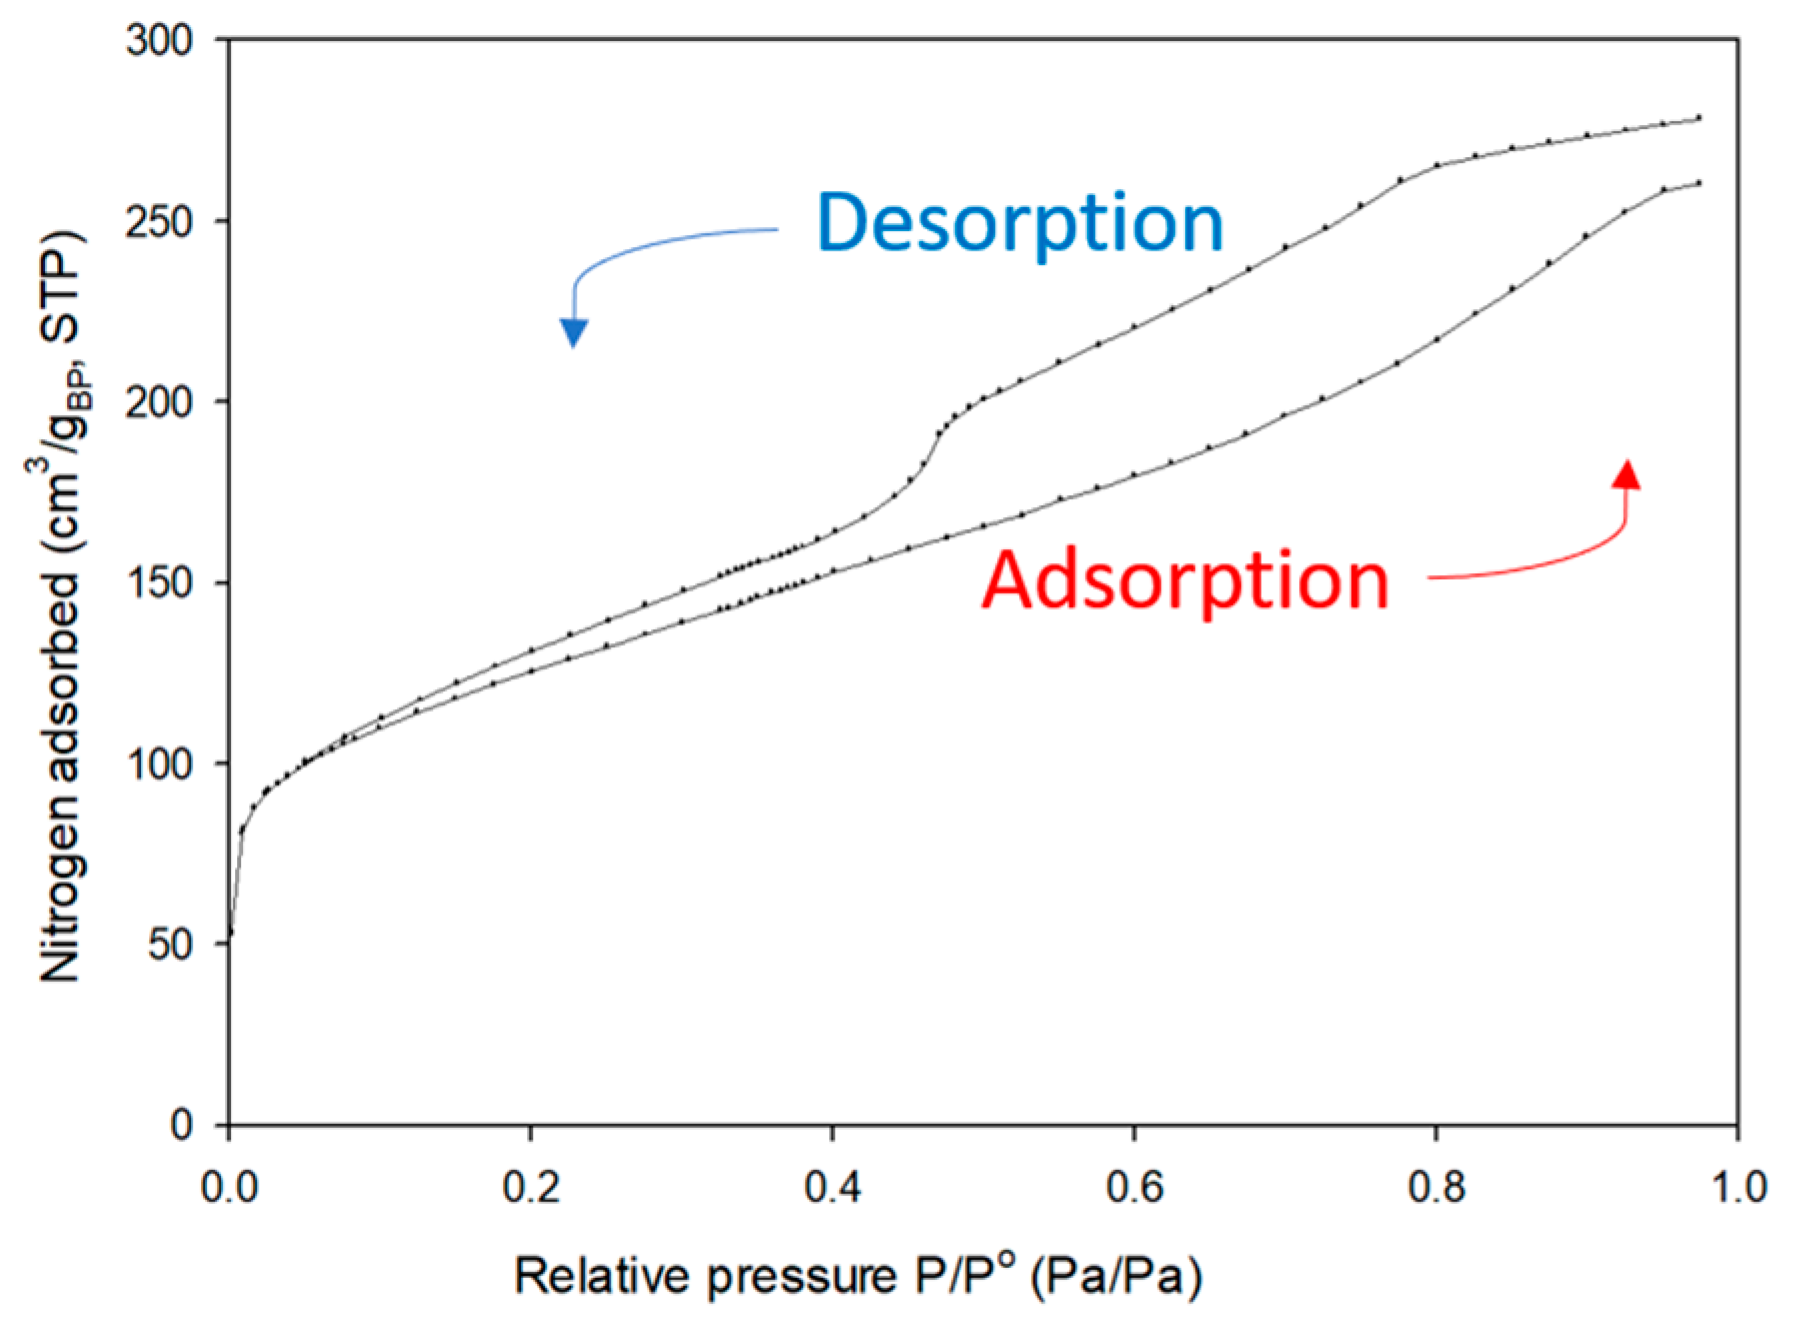
3.4. Nitrogen Physisorption
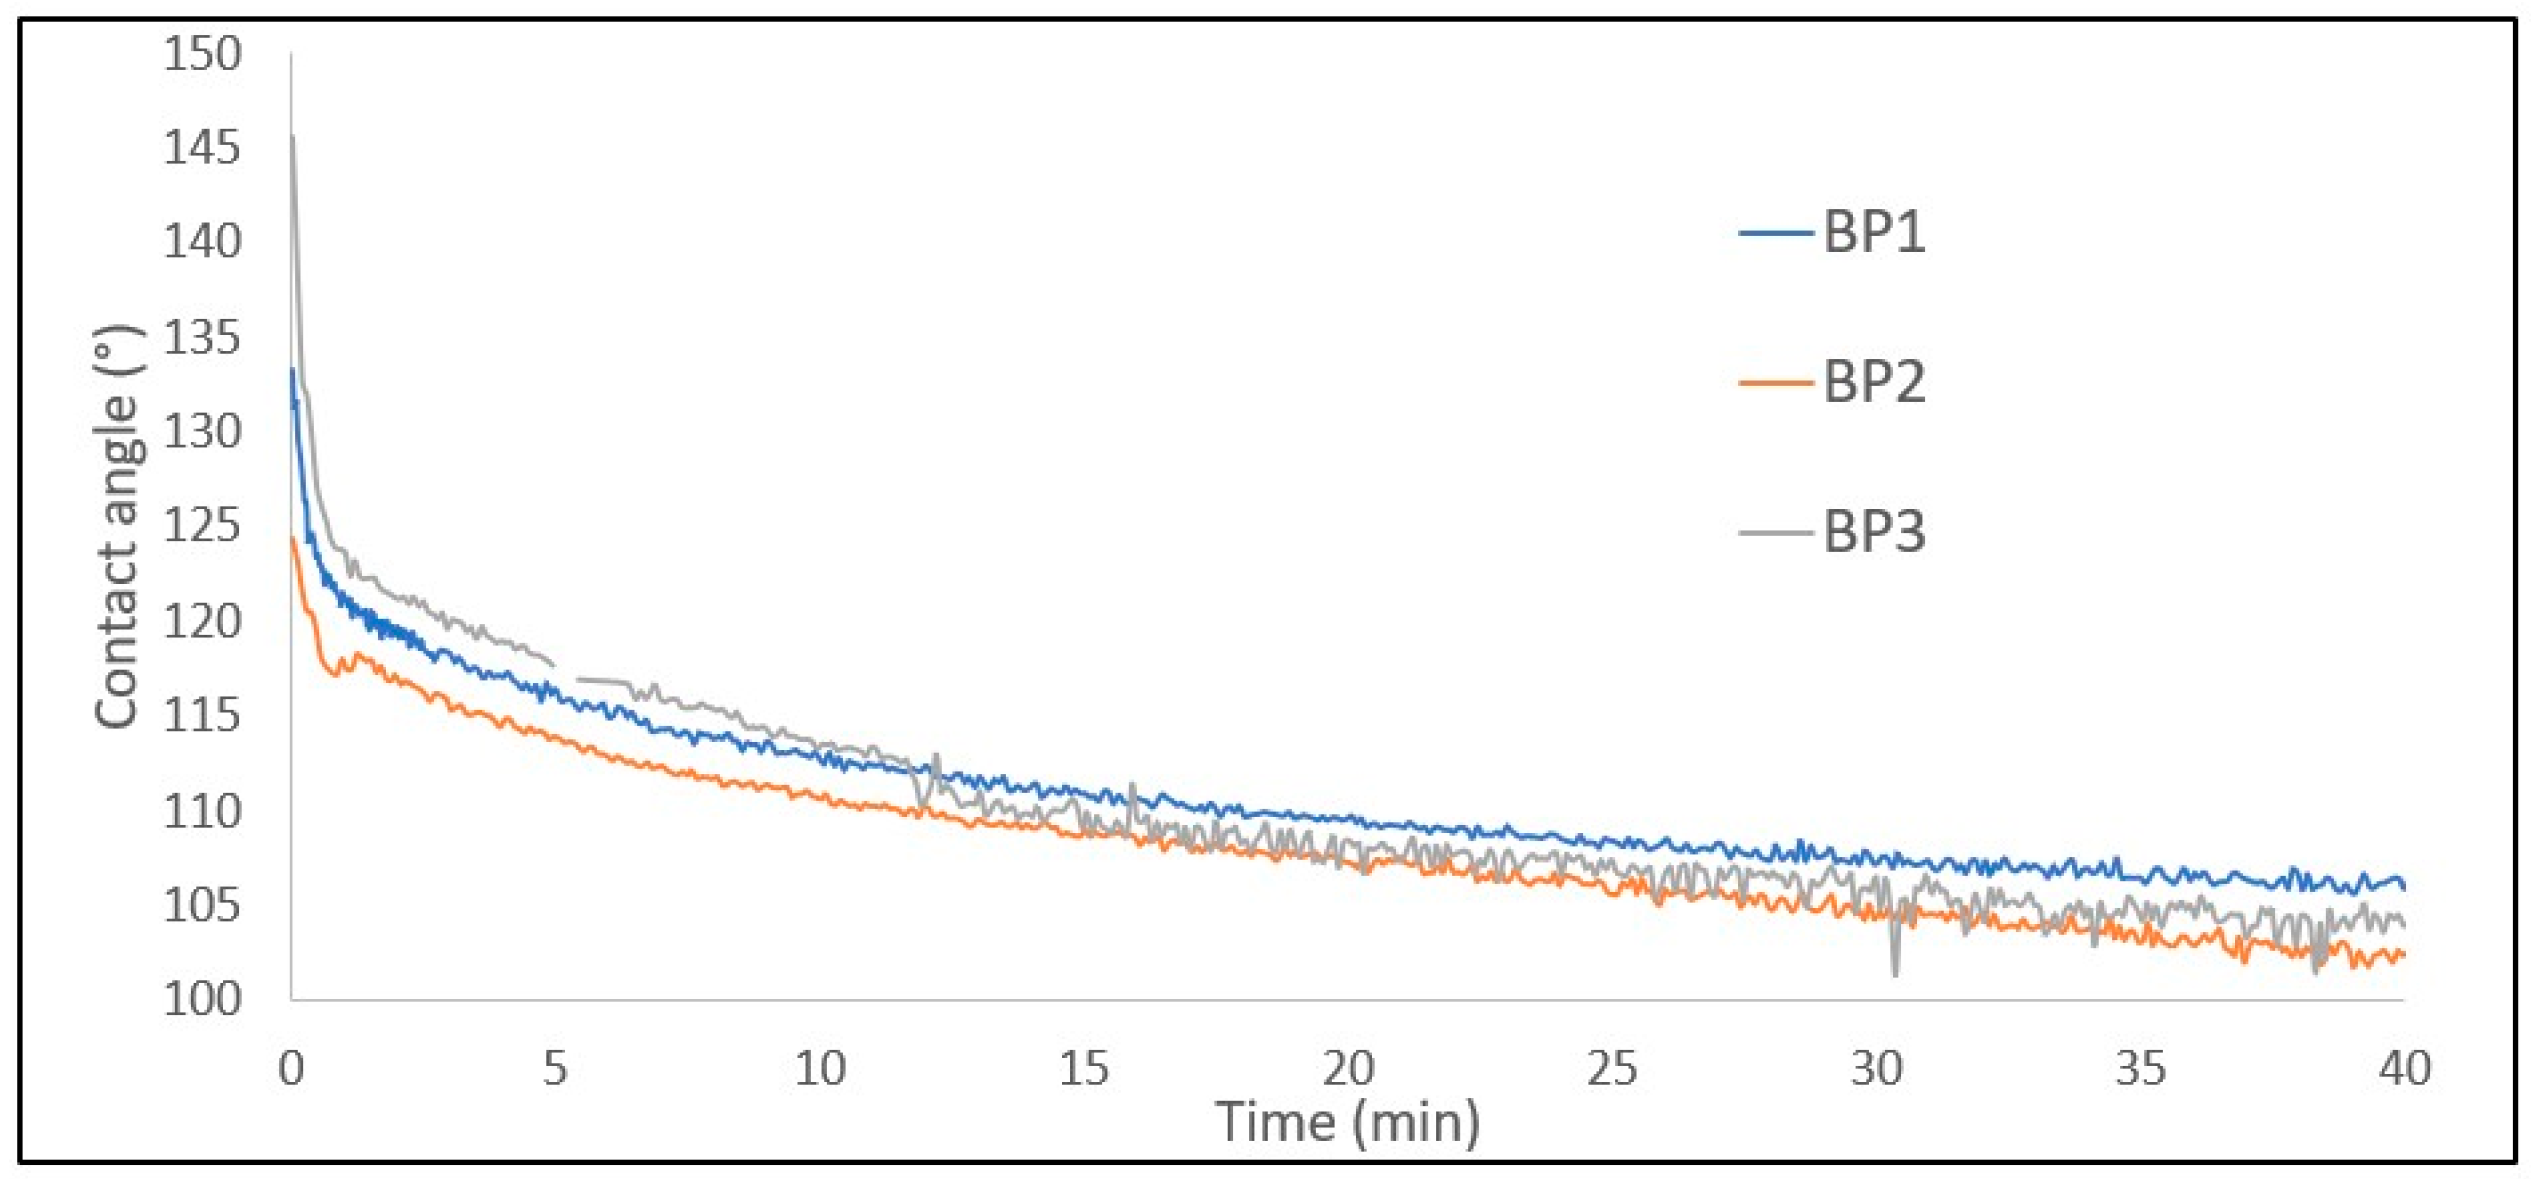
The surface area by the Brunauer–Emmett–Teller (BET) method [11] was 447.01 m2/gBP, and the porosity according to the Density Functional Theory (DFT) [12] was 30.45% (Table 1). DFT data show two types of pore diameter distributions: one that is centered in the 1.25–1.45 nm range and the other in the 3.85–4.05 nm range (Figure 6). However, some pores of diameters as high as 185.1 nm were also detected by the Barret-Joyner-Halenda (BJH) method [13].
The obtained isotherm (Figure 7) shows a Type IV(a) isotherm [14], which indicates the presence of a mesoporous structure with gas condensation in some pores. Additionally, a hysteresis Type H4 is observed, which is associated with the filling of micropores. This is in accordance with the results from the pore distribution shown in Figure 6.
The diameter of pores from the first distribution is similar to the SWCNT diameter, which could mean that the gas entered the inner diameter of some nanotubes, and the pore widths from the second distribution could represent pores formed by the random arrangement of the nanotubes when the BP was formed. The dimensions of the BP were measured to calculate porosity. The thickness of the BP was observed using images from a Scanning Electron Microscope at a ×1349 magnification, at twenty different spots of a 0.025 g BP, with the average resulting in 34.08 µm. The BP has a diameter of 35.4 mm. The porosity was then calculated considering that the BP has a cylindrical geometry and using pore volume results.
The porosity obtained with BJH method is in accordance with that reported by L. Zhan, where he obtained a 23.7% porosity [7] for their multi-walled carbon nanotube (MWCNT) fiber. The porosity data are used to determine the wettability and adhesion parameters of the coatings on the BP. In turn, the wettability requires measuring the surface tension of the coatings and surface free energy (SFE) of the BP.

3.5. Wettability

The surface free energy of the BP, calculated with the Owens-Wendt method [15], resulted in 59.63 mJ/m2 (45.27 mJ/m2 for the polar component and 14.41 mJ/m2 the non-polar component). The 59.63 mJ/m2 value agrees with a theoretical estimation [16] of 40-80 mJ/m2 for the critical surface energy of single-walled CNTs.
The Owens-Wendt method required the sessile drop technique data (shown in Figure 8) to determine the average contact angle of three drops of HPLC water (49.30°), diiodomethane (18.43°), and glycerol (39.32°) on BP. Only the initial contact angle was considered. The higher polar behavior could be coming from oxygen present in the BP, as observed in the XPS spectra.
The surface tension of the coatings on the liquid-air interface was measured by pendant drop analysis (Table 2). The only exception was the Epolene® wax, since it instantly solidified at room temperature. Maintaining high temperatures on the syringe while on the KRÜSS DSA100S proved to be a challenge.
At room temperature, the initial contact angle (CA0) formed on the BP by the coatings was measured in sets of 3 drops on three different BPs for 5 min each, with one of the drops on each set being measured for 40 min at a 5 s interval (Figure 9).
The contact angle of the coatings on the BP was measured for 40 min, and a logarithmic decay was observed. The average of the initial contact.
Weaker bonding behavior with the BP was shown for insulating varnish and red enamel and a stronger bonding for epoxy resin. For calculating the wetting parameters, it is essential to consider that the BP is a random arrangement of CNT with empty spaces filled with air. The Cassie-Baxter model [17] connects the “average” contact angle with the contact angle that would be obtained in a homogeneous structure (Equation (2)).
cosθeq = fscosθCNT + (1 − fs)cosθi
where fs is the fraction of the solid–coating interface, which was considered as 0.695 (1 minus porosity obtained with DFT), θeq is the equilibrium contact angle, θCNT is the predicted contact angle on a smooth surface and θi is the coating–air contact angle and is 180° [18].
Since the observed contact angle changes with time, the challenge was to determine the equivalent contact angle that should be used in Equation (2). A logarithmic behavior fitted most of the changes in the contact angle over time for the three coatings, which means that the most significant change of contact angle happens in the first minutes of being made. Therefore, the average between the initial contact angle and the contact angle after 5 min (Table 3) was used as the equilibrium contact angle (θeq). This resulted in imaginary values for θeq when using contact angles from epoxy resin because of the low contact angles show a higher wettability that could be represented better in a Wenzel [19] model. Regardless, the average between the initial contact angle and the contact angle after 5 min was considered for epoxy resin as θCNT.
The four main wetting parameters calculated are the work of adhesion (Wa), the spreading coefficient (S), the wetting tension (∆F), and interfacial surface tension (γsl). These parameters are obtained with the following equations:
Wa = γs + γl −γsl
S = γs − (γlsl)
∆F = γs − γsl
γsl = γs − γlcosθCNT
Using the surface free energy of the BP, the surface tension of the coatings, and the adjusted contact angles, wettability, and adhesion parameters for the system BP-coating were obtained (Table 4). The results showed that the epoxy resin has the highest wettability and adhesion, while the red enamel has the lowest.
The epoxy resin had the highest spreading coefficient, and its higher wetting is expected since low contact angles were obtained in comparison to the other two coatings. The higher the spreading coefficient, the easier it is to apply and cover the fiber with the coating. Epoxy resin has the highest value since it is directly related to the spreading coefficient and general wetting of the BP, which is why maximum wetting tension is also preferred for the coating of fibers. Interfacial tension is the work required to increase the size of the interface between two adjacent phases that do not mix completely with one another. The optimal coating is achieved with minimum interfacial tension, where epoxy resin had the lowest interfacial tension. However, for the wire, we want high levels of adhesion as long as it does not affect the conductivity too negatively.
To have a better understanding of the physical interfacial interactions, SEM images of the interface formed between the BP and all four coatings were taken at different magnifications. Since variable pressure on the SEM was not available, the problem of charging affected the quality of the SEM images. The epoxy resin was the most interesting (Figure 10): a maximum penetration of 1 µm into the BP was observed (3.2% thickness infiltration). The higher wettability helped it to get into the pores. However, the more the epoxy penetrates, the more it can affect conductivity. This image also shows that pores inside the BP could have more of a cylindrical shape than a spherical one. Using the average pore size and the distance between six selected pores (35.4 nm average diameter) from Figure 10 and considering a linear approach, porosity results in 45.3%. This porosity is higher than the one calculated from the DFT (30.45%), probably due to the low number of pores with a pore width higher than 20 nm obtained from that method.
Some pores on the surface of the BP showed in Figure 5a were also measured with the Image J software (Version 1.52v). These 40 nm pores are indeed similar to the 35.4 nm average diameter of the pores where epoxy resin is entering the BP.

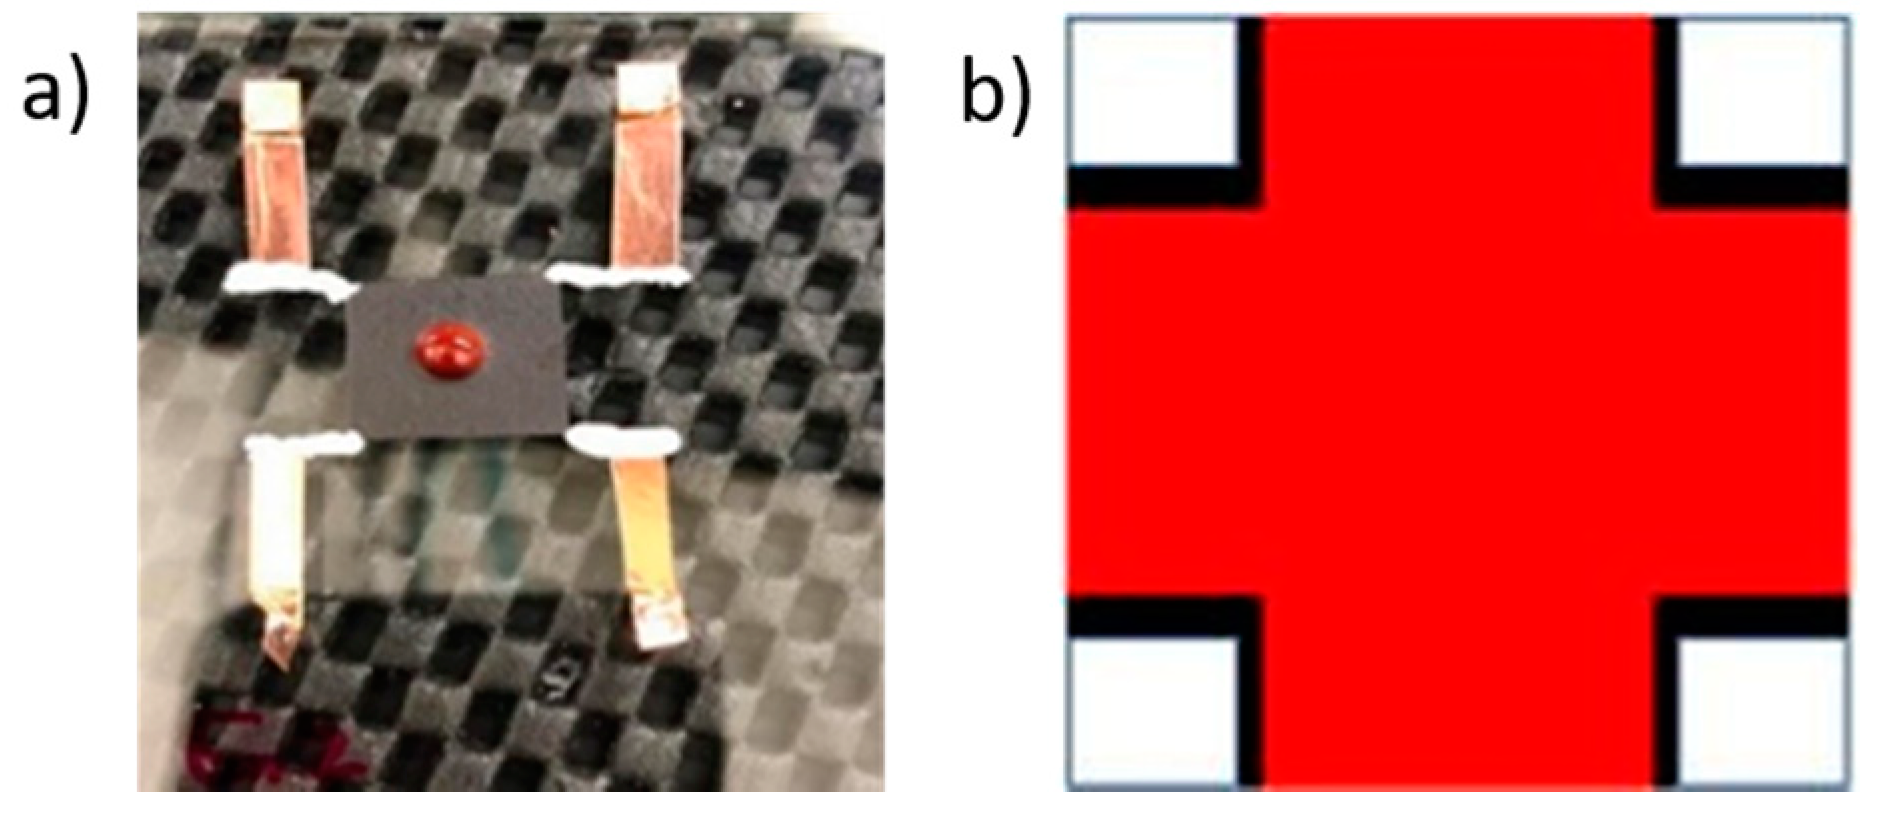
3.6. Electric Conductivity

The sheet resistance and electrical resistivity measurements were obtained as outlined by the National Institute of Standards and Technology standards, through the Van Der Pauw method [20]. The setup consists of 12 mm × 12 mm BP squares, with silver paint on the edges leading to a copper tape, where measurements are taken at a fixed current of 2.5 mA and room temperature. In total, 15 samples were prepared. After the resistances were measured in sets of three, samples were coated with the four coating materials. Each coating was cured, as indicated in Table 5.
For an even coating, three drops of the coating were deposited in the center of the sample (Figure 11a) and then spread with a razor in a cross pattern (Figure 11b), leaving the corners uncoated. Three uncoated buckypapers were used as control samples.
Resistivity values were obtained prior to coating (day 0) and for 1, 4, and 7 days after coating. Uncoated BP served as the control. Resistivity was then converted into conductivity, and sample values were averaged. For all coatings, there was a sudden decrease in conductivity from days 0 to 4. However, in the following days, the conductivity increased slightly (Table 6). The control samples also experienced an increase in conductivity up to day 7 (24.48%), which could be due to the environmental laboratory conditions, such as humidity interacting with the iron.
Coating with epoxy resin resulted in the highest decrease in conductivity (64.99%). That can be explained by the SEM images observed at the interface (Figure 10), where the coating seems to penetrate into the pores of the BP.
PE wax showed the second-highest decrease in conductivity (39.59%), while the insulating varnish and the red enamel were the two best performance coatings in terms of conductivity, with decreases by day 7 of only 9.31% and 10.20%, respectively. Thus, the insulating varnish is considered as the best coating based on electrical conductivity for the making of CNT cables. These conductivity and wettability results show that as coating wettability and adhesion increase, the electrical conductivity of the coated BP decreases (Table 7).

4. Conclusions

When selecting an appropriate insulative coating for CNT wires (or other conduction-focused CNT-based materials), several factors must be considered. For a porous conductor, such as CNT wires, there exists a trade-off in coating compatibility with the substrate and electrical conduction. That is, the more the coating is able to wet the porous substate, the larger the decrease in conductivity. In this study, wettability was found to be the most important factor affecting the electrical conductivity of coated BP. Coatings with a high wettability allow infiltration into the BP and consequently reduce the electrical conductivity. These high-wettability coatings permeate into regions of the BP, increasing the anchoring of the coating to the CNT bundles, as was the case for the epoxy resin. Such permeation decreases the connectivity among the carbon nanotubes within the BP and consequently reduces the pathways for electrical conduction. In contrast, low-wettability coatings show the smallest decrease in conductivity. Out of the four coatings, the insulating varnish caused the smallest decrease in electrical conductivity for the coated BP and presented the one of the lowest wettabilities. Low-wettability coatings permeate less into the CNT substrate, which causes less disruption to the CNT conduction pathways. However, a coating with a low wettability can potentially decrease coating adhesion and effective spreading. The results and methodology presented here can be used by others seeking to address this trade off, a necessary step if these light-weight CNT wires are to be considered as suitable replacements for traditional metal conductors.

Author Contributions

Conceptualization, J.B.-R. and E.B.; methodology, J.A., L.I., J.B.-R. and E.B.; software, J.B.-R. and E.B.; validation, J.A., J.B.-R. and E.B.; formal analysis, J.A., L.I., J.B.-R. and E.B.; investigation, J.A.; resources, J.B.-R. and E.B.; data curation, J.A., J.B.-R. and E.B.; writing—original draft preparation, J.A., L.I., J.B.-R. and E.B.; writing—review and editing, J.A., L.I., J.B.-R. and E.B.; visualization, J.A., J.B.-R. and E.B.; supervision, J.B.-R. and E.B.; project administration, J.B.-R. and E.B.; funding acquisition, J.B.-R. and E.B. All authors have read and agreed to the published version of the manuscript.

Funding

The authors are grateful to CONACYT, Tecnológico de Monterrey and Rice University for providing funding for this project.

Institutional Review Board Statement

Not applicable.

Informed Consent Statement

Not applicable.

Data Availability Statement

The data presented in this study are available on request from the corresponding author.

Acknowledgments

Rice University played a big role in this research by facilitating equipment and materials.

Conflicts of Interest

The authors declare no conflict of interests.

References

  1. Ayyagari, S.; Al-Haik, M.; Rolin, V. Mechanical and Electrical Characterization of Carbon Fiber/Bucky Paper/Zinc Oxide Hybrid Composites. C J. Carbon Res. 2018, 4, 6. [Google Scholar] [CrossRef] [Green Version]
  2. Chu, K.; Kim, D.; Sohn, Y.; Lee, S.; Moon, C.; Park, S. Electrical and Thermal Properties of Carbon-Nanotube Composite for Flexible Electric Heating-Unit Applications. IEEE Electron Device Lett. 2013, 34, 668–670. [Google Scholar] [CrossRef]
  3. Zubair, A.; Tsentalovich, D.E.; Young, C.C.; Heimbeck, M.S.; Everitt, H.O.; Pasquali, M.; Kono, J. Carbon nanotube fiber terahertz polarizer. Appl. Phys. Lett. 2016, 108. [Google Scholar] [CrossRef]
  4. Kim, S.; Haines, C.S.; Li, N.; Kim, K.J.; Mun, T.J.; Choi, C.; Baughman, R.H. Harvesting electrical energy from carbon nanotube yarn twist. Science 2017, 357, 773–778. [Google Scholar] [CrossRef] [Green Version]
  5. Faraby, H.M.; Rao, A.M.; Bandaru, P.R. Modeling high energy density electrical inductors operating at thz frequencies based on coiled carbon nanotubes. IEEE Electron Device Lett. 2013, 34, 807–809. [Google Scholar] [CrossRef]
  6. Zhao, Y.; Wei, J.; Vajtai, R.; Ajayan, P.M.; Barrera, E.V. Iodine doped carbon nanotube cables exceeding specific electrical conductivity of metals. Sci. Rep. 2011, 1, 1–5. [Google Scholar] [CrossRef] [Green Version]
  7. Zhang, L.; Wang, J.; Fuentes, C.A.; Zhang, D.; Van Vuure, A.W.; Seo, J.W.; Seveno, D. Wettability of carbon nanotube fibers. Carbon 2017, 122, 128–140. [Google Scholar] [CrossRef]
  8. Janas, D.; Herman, A.P.; Boncel, S.; Koziol, K.K. Iodine monochloride as a powerful enhancer of electrical conductivity of carbon nanotube wires. Carbon 2014, 73, 225–233. [Google Scholar] [CrossRef]
  9. Qiu, J.; Terrones, J.; Vilatela, J.J.; Vickers, M.E.; Elliott, J.A.; Windle, A.H. Liquid infiltration into carbon nanotube fibers: Effect on structure and electrical properties. ACS Nano 2013, 7, 8412–8422. [Google Scholar] [CrossRef] [PubMed]
  10. Costa, S.; Borowiak-Palen, E.; Kruszynska, M.; Bachmatiuk, A.; Kalenczuk, R.J. Characterization of carbon nanotubes by raman spectroscopy. Mater. Sci. Pol. 2008, 26, 433–441. [Google Scholar]
  11. Brunauer, S.; Emmett, P.H.; Teller, E. Adsorption of gases in multimolecular layers. J. Am. Chem. Soc. 1938, 60, 309–319. [Google Scholar] [CrossRef]
  12. Pore Size Analysis by Gas Adsorption and the Density Functional Theory. Available online: https://www.azom.com/article.aspx?ArticleID=5189 (accessed on 15 January 2020).
  13. Barrett, E.P.; Joyner, L.G.; Halenda, P.P. The determination of pore volume and area distributions in porous substances. I. Computations from nitrogen isotherms. J. Am. Chem. Soc. 1951, 73, 373–380. [Google Scholar] [CrossRef]
  14. Thommes, M.; Kaneko, K.; Neimark, A.V.; Olivier, J.P.; Rodriguez-Reinoso, F.; Rouquerol, J.; Sing, K.S. Physisorption of gases, with special reference to the evaluation of surface area and pore size distribution (IUPAC Technical Report). Pure Appl. Chem. 2015, 87. [Google Scholar] [CrossRef] [Green Version]
  15. Owens, D.K.; Wendt, R.C. Estimation of the surface free energy of polymers. J. Appl. Polym. Sci. 1969, 13, 1741–1747. [Google Scholar] [CrossRef]
  16. Dujardin, E.; Ebbesen, T.W.; Krishnan, A.; Treacy, M.M. Wetting of single shell carbon nanotubes. Adv. Mater. 1998, 10, 1472–1475. [Google Scholar] [CrossRef]
  17. Cassie, A.B.D.; Baxter, S. Wettability of porous surfaces. Trans. Faraday Soc. 1944, 40, 546–551. [Google Scholar] [CrossRef]
  18. McHale, G. Cassie and Wenzel: Were they really so wrong? Langmuir 2007, 23, 8200–8205. [Google Scholar] [CrossRef] [PubMed]
  19. Wenzel, R.N. Resistance of solid surfaces to wetting by water. Ind. Eng. Chem. 1936, 28, 988–994. [Google Scholar] [CrossRef]
  20. Resistivity and Hall Measurements. Available online: https://www.nist.gov/pml/engineering-physics-division/popular-links/hall-effect/resistivity-and-hall-measurements (accessed on 30 September 2019).
Figure 1. Raman spectroscopy at 785 nm beam of a BP at three different spots, with a 500-count displacement between each (a); normalized graphs, each with a 0.015-normalized intensity displacement (b).
Coatings 11 00743 g001
Figure 2. Radial Breathing Mode (RBM) from Figure 1a.
Coatings 11 00743 g002
Figure 3. X-ray photoelectron spectroscopy of the BP.
Coatings 11 00743 g003
Figure 4. Simple deconvolution of the carbon spectra from Figure 3.
Coatings 11 00743 g004
Figure 5. (a) MWCNT fiber surface taken at ×60,000 magnification and 10.2 mm working distance (WD) and (b) surface of a SWCNT buckypaper taken at ×40,000 magnification and 5 mm WD.
Coatings 11 00743 g005
Figure 6. Distribution of the total pore volume by the total pore volume of all different pore widths by the DFT in a histogram, starting from a width of 1.05 nm and grouping every 0.2 nm increase.
Coatings 11 00743 g006
Figure 7. Isotherm graph for the adsorption (lower line) and desorption (higher line) of nitrogen in the BP.
Coatings 11 00743 g007
Figure 8. A BP with single drops of HPLC water applied through most of the surface.
Coatings 11 00743 g008
Figure 9. Measurement of the contact angle of a drop of red enamel on a BP through the Young-Laplace fitting for 40 min after it was placed on three different BPs.
Coatings 11 00743 g009
Figure 10. (a) Image of the interface formed from a BP coated with epoxy resin (coated side is the upper layer) at ×15,000 and (b) ×30,000 magnifications.
Coatings 11 00743 g010
Figure 11. Buckypaper is connected to copper tape using silver paint. (a) The BP has three fused drops of red enamel in the center that were spread in a cross pattern (b).
Coatings 11 00743 g011
Table 1. Data obtained from physisorption results (pore width is the pore with the highest mode).
MethodSurface Area
(m2/gBP)
Pore Volume
(cm3/gBP)
Pore width
(nm)
Porosity
(%)
BET447---
DFT3120.41.1830
BJH2470.33.7423
Table 2. Surface tension of the coating-air interface on different coatings.
CoatingSurface Tension (mN/m)
Insulating Varnish29.75
Red Enamel36.39
Epoxy Resin with hardener34.47
Table 3. Contact angle at time 0 and 5 min (CA0 and CA5) for insulating varnish, red enamel, and epoxy resin.
CoatingCA0(°)CA5(°)CAAvg(°)
Insulating Varnish118.59100.05109.32
Red Enamel131.84114.82123.33
Epoxy Resin42.9531.0136.98
Table 4. Wetting parameters (mJ/m2) calculated for red enamel, insulating varnish, and epoxy resin.
CoatingγslWaS∆F
Red Enamel72.4323.59−49.19−12.80
Insulating Varnish60.7328.65−30.85−1.10
Epoxy resin32.0962.01−6.9327.54
Table 5. Curing conditions for all coatings.
CoatingTemperatureTime
Insulating Varnish100 °C3 h
Red Enamel100 °C3 h
Epoxy Resin40 °C5 h
Wax25 °C8 h
Table 6. Average conductivity change (∆σ) of each set of 3 samples from their first day of measurement (Day 0).
Sampleσ Day 0 (S/m)σ Day 7 (S/m)
Control2.27 × 1042.82 × 104
Varnish2.51 × 1042.27 × 104
Epoxy2.73 × 1040.96 × 104
Enamel2.78 × 1042.50 × 104
Wax2.54 × 1041.53 × 104
Table 7. Wetting parameters (mJ/m2) calculated for red enamel, insulating varnish, and epoxy resin, as well as the conductivity decrease that the BP-coating system experienced.
ParameterRed EnamelVarnishEpoxy Resin
γsl72.4360.7332.09
Wa23.5928.6562.01
S−49.19−30.85−6.93
∆F−12.80−1.1027.54
∆σ−10.20%−9.31%−64.99%
Publisher’s Note: MDPI stays neutral with regard to jurisdictional claims in published maps and institutional affiliations.

