Abstract
Leading edge protection (LEP) coating systems are applied to protect turbine blade edges from rain erosion. The performance of a LEP system is assessed in an accelerated rain erosion test (RET) as a metric for industrial application, but these tests are expensive. Modelling methods are available to predict erosion, based on fundamental material properties, but there is a lack of validation. The Springer model (1976) is analysed in this work to assess it as a tool for using material fundamental properties to predict the time to failure in a rain erosion test. It has been applied, referenced and industry validated with important partial considerations. The method has been applied successfully for erosion damage by wear performance prediction when combined with prior material data from rain erosion test (RET), instead of obtaining it directly from fundamental properties measured separately as Springer proposed. The method also offers accurate predictions when coupled with modified numerical parameters obtained from experimental RET testing data. This research aims to understand the differences between the experimental data used by Springer and the current industry approach to rain erosion testing, and to determine how it may introduce inaccuracies into lifetime predictions of current LEP systems, since they are very different to those tested in the historic modelling validation. In this work, a review of the modelling is presented, allowing for the understanding of key issues of its computational implementation and the required experimental material characterisation. Modelling results are discussed for different original application issues and industry-related LEP configuration cases, offering the reader to interpret the limits of the performance prediction when considering the variation in material fundamental properties involved.
1. Introduction
Protecting the leading edge of wind turbine blades has developed into a major challenge for the wind industry [1]. Leading edge erosion occurs both onshore and offshore, but appears to be accelerated offshore due to the harsher environmental conditions. The problem removes material from the blade surface which affects the aerodynamic performance, and hence power production of the blade. To restore the aerodynamic shape of the leading edge, expensive in-situ repairs are required.
Leading edge protection (LEP) coating systems are applied to protect blade edges from erosion. The performance of an LEP system is assessed in an accelerated rain erosion test (RET). It may be done following the wind industry recommended practice DNVGL RP-0171 [2]. In this, a sample is fixed to an arm and rotated at a high speed through a rain field until droplet impact erosion occurs. Currently, there is no thoroughly validated method to relate test results to in-field erosion performance during its complete lifetime. It is an active research topic for wind blade manufacturers and material developers.
Springer [3] proposed a model that relates material fundamental properties to predict the time to failure in a rain erosion test. It has been applied [4,5], referenced [6,7] and industry validated [8]. In order to predict the incubation time and the mass removal rate, other different modelling studies can be found in the literature [9,10,11,12]. The stress history in the coating and in the substrate has to be identified analytically or numerically [13,14,15,16]. It is affected by the shockwave progression due to the vibro-acoustic properties of each layer, and by the time interval of the repeated water droplet impacts. The fatigue life of the material is then calculated, and the models can be applied to estimate the stress at different locations through the thickness, i.e., the coating surface or at the coating–substrate interface, etc.
The Springer formula requires specific coating and substrate material properties, such as speed of sound measurements, as input parameters. The model does not account for a very high-rate transient pressure build-up, or that the viscoelastic effects are frequency dependent for the materials involved [4,5]. However, the materials and experimental testing used by Springer were aerospace-based, and generally dissimilar to those currently used within the wind industry. Historic testing used in [3] to develop the Springer model operated at local velocities ranging between 223 and 966 m/s. This is significantly higher than a current rain erosion test, where the velocity range examined is typically between 85 and 125 m/s, and no greater than 173 m/s. A combination of aluminium, polyester and glass reinforced epoxy was used as the substrate in the historic testing [3], while glass fibre-reinforced plastic is used in current testing. The Springer model also ignores the inclusion of a filler layer, which is common in current wind turbine leading edge protection systems. Furthermore, the same fatigue value was used for different LEP materials, ranging from nickel to polyurethane. This study aims to understand if the differences between the experimental data used by Springer and the current industry approach to rain erosion testing is introducing inaccuracies into lifetime predictions of current LEP systems, since they are very different to those tested for the modelling validation.
Considering the aforementioned previous assumptions, the method has been applied successfully for wear erosion damage performance prediction, combined with prior material data from rain erosion test results, instead of obtaining the fundamental properties values separately.
This research proposes a perspective on a way of achieving a comprehensive modelling tool to analyse the effect of the fundamental material properties in rain erosion performance. This work identifies the limits and capabilities of the appropriate model as a tool for industry for accurate predictions, compared to that obtained from experimental RET test data. In this work, the proposed modelling cases are completely developed and used to interpret the required experimental material characterisation and its relationship with the LEP erosion performance predictions. The paper is organised into three sections. In the first section, a review of the modelling is presented, allowing for the understanding of the key issues of its computational implementation. In the second section, the experimental material characterisation is developed, and rain erosion tests are completed to obtain erosion performance data. In the final section of the work, the modelling results are discussed for different application issues and LEP configuration cases. The modelling procedure is examined for different numerical and experimental limitations. It also offers accuracy predictions when coupled with modified numerical parameters obtained from experimental Rain Erosion Testing (RET) data.
2. Erosion Lifetime Prediction Modelling Based on the Springer Model. A Review
In this section, the Springer model is introduced and reviewed, before being applied in the subsequent sections. The model assumes a semi-infinite homogenous substrate covered by a single layer of uniform coating. The substrate is assumed to be sufficiently thick so that stress wave reflections introduced by the droplet do not occur in subsequent layers. The model is limited to erosion failures such as progressive fatigue failure mode or coating wear.
The advancement of erosion damage can be experimentally measured with appropriate RET, as described in detail in the next section. The first stage of erosion is the incubation period, where damage progresses without a visual change or a distinctive loss in the material mass. Then, after a necessary cumulation of fatigue degradation has developed in a given location, the coating starts to lose mass with a constant erosion rate. This point marks the end of the incubation period.
During the incubation period, the total number of impacts per unit area, , is related to the total number of impacts per site, , by
where d is the droplet diameter.
Springer proposes that the total number of impacts per site in the incubation period can be found by evaluating
where is the erosion strength of the coating, is the average stress on the surface of the coating and and are defined as empirical constant parameters. Springer determined the constants and as 7 × 10⁻⁶ and 5.7, respectively, by fitting Equation (2) to the experimental data available at the time.
Substituting the constants and Equation (2) into Equation (1) gives:
The average stress of the coating surface is defined as
where is dependent on the droplet impact velocity diameter , is the impedance of the material (the subscript refers to the liquid (L), coating (C) and substrate (S) layers), is the density, is the elastic wave speed, is the relative acoustic impedance between the liquid droplet and coating and , between the coating and substrate, and is the thickness parameter that accounts for the attenuation of the reflections at the coating layer.
The erosion strength of a coating is initially defined in terms of its base material properties, as seen
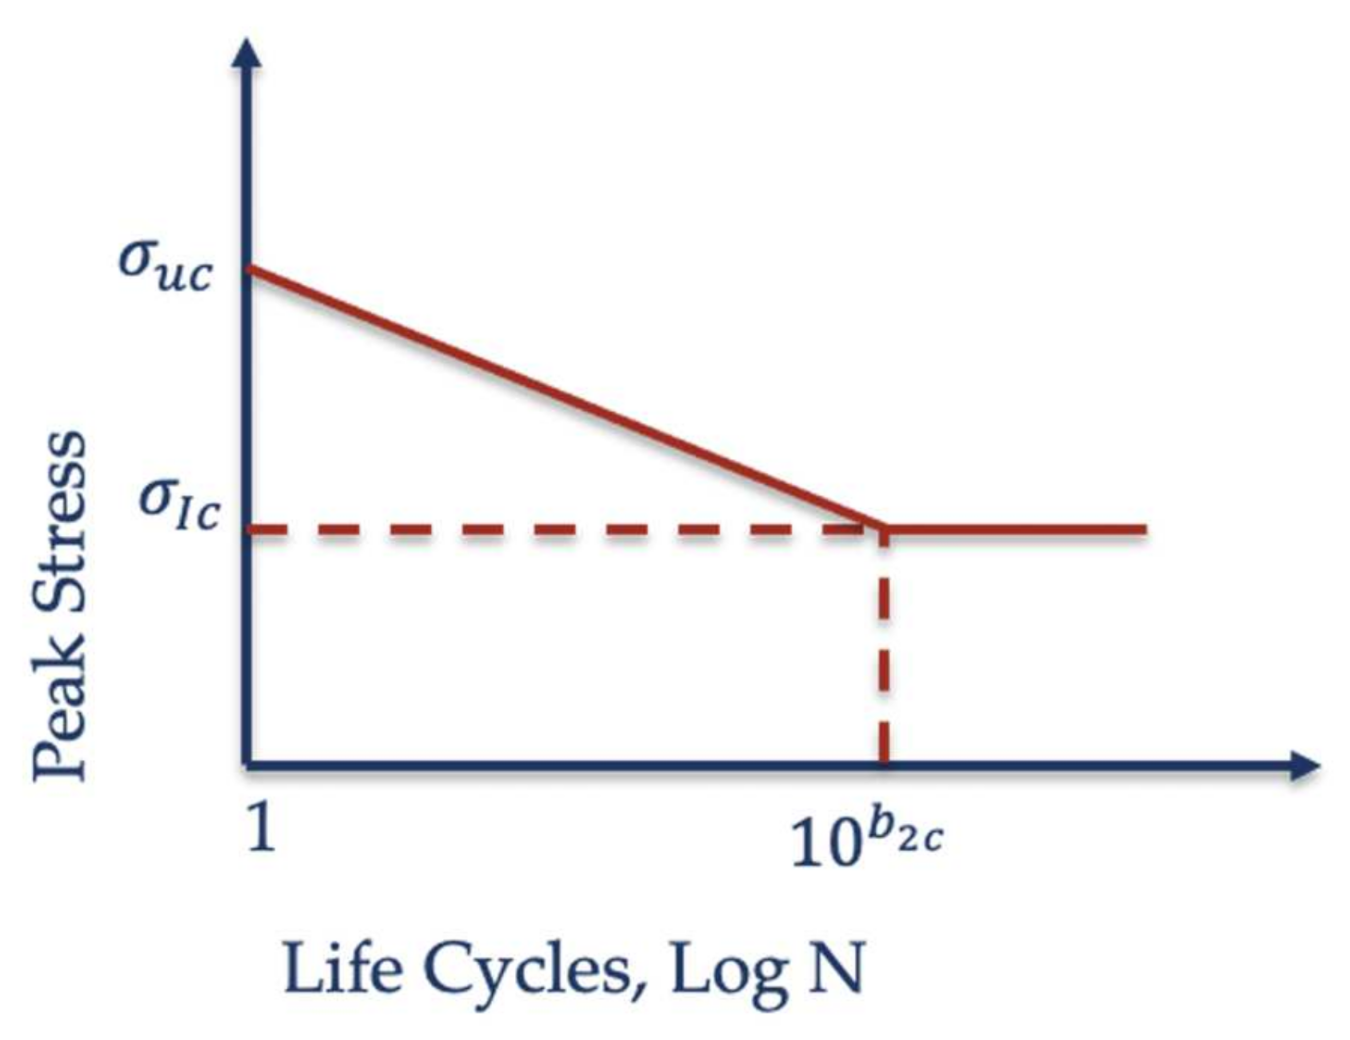
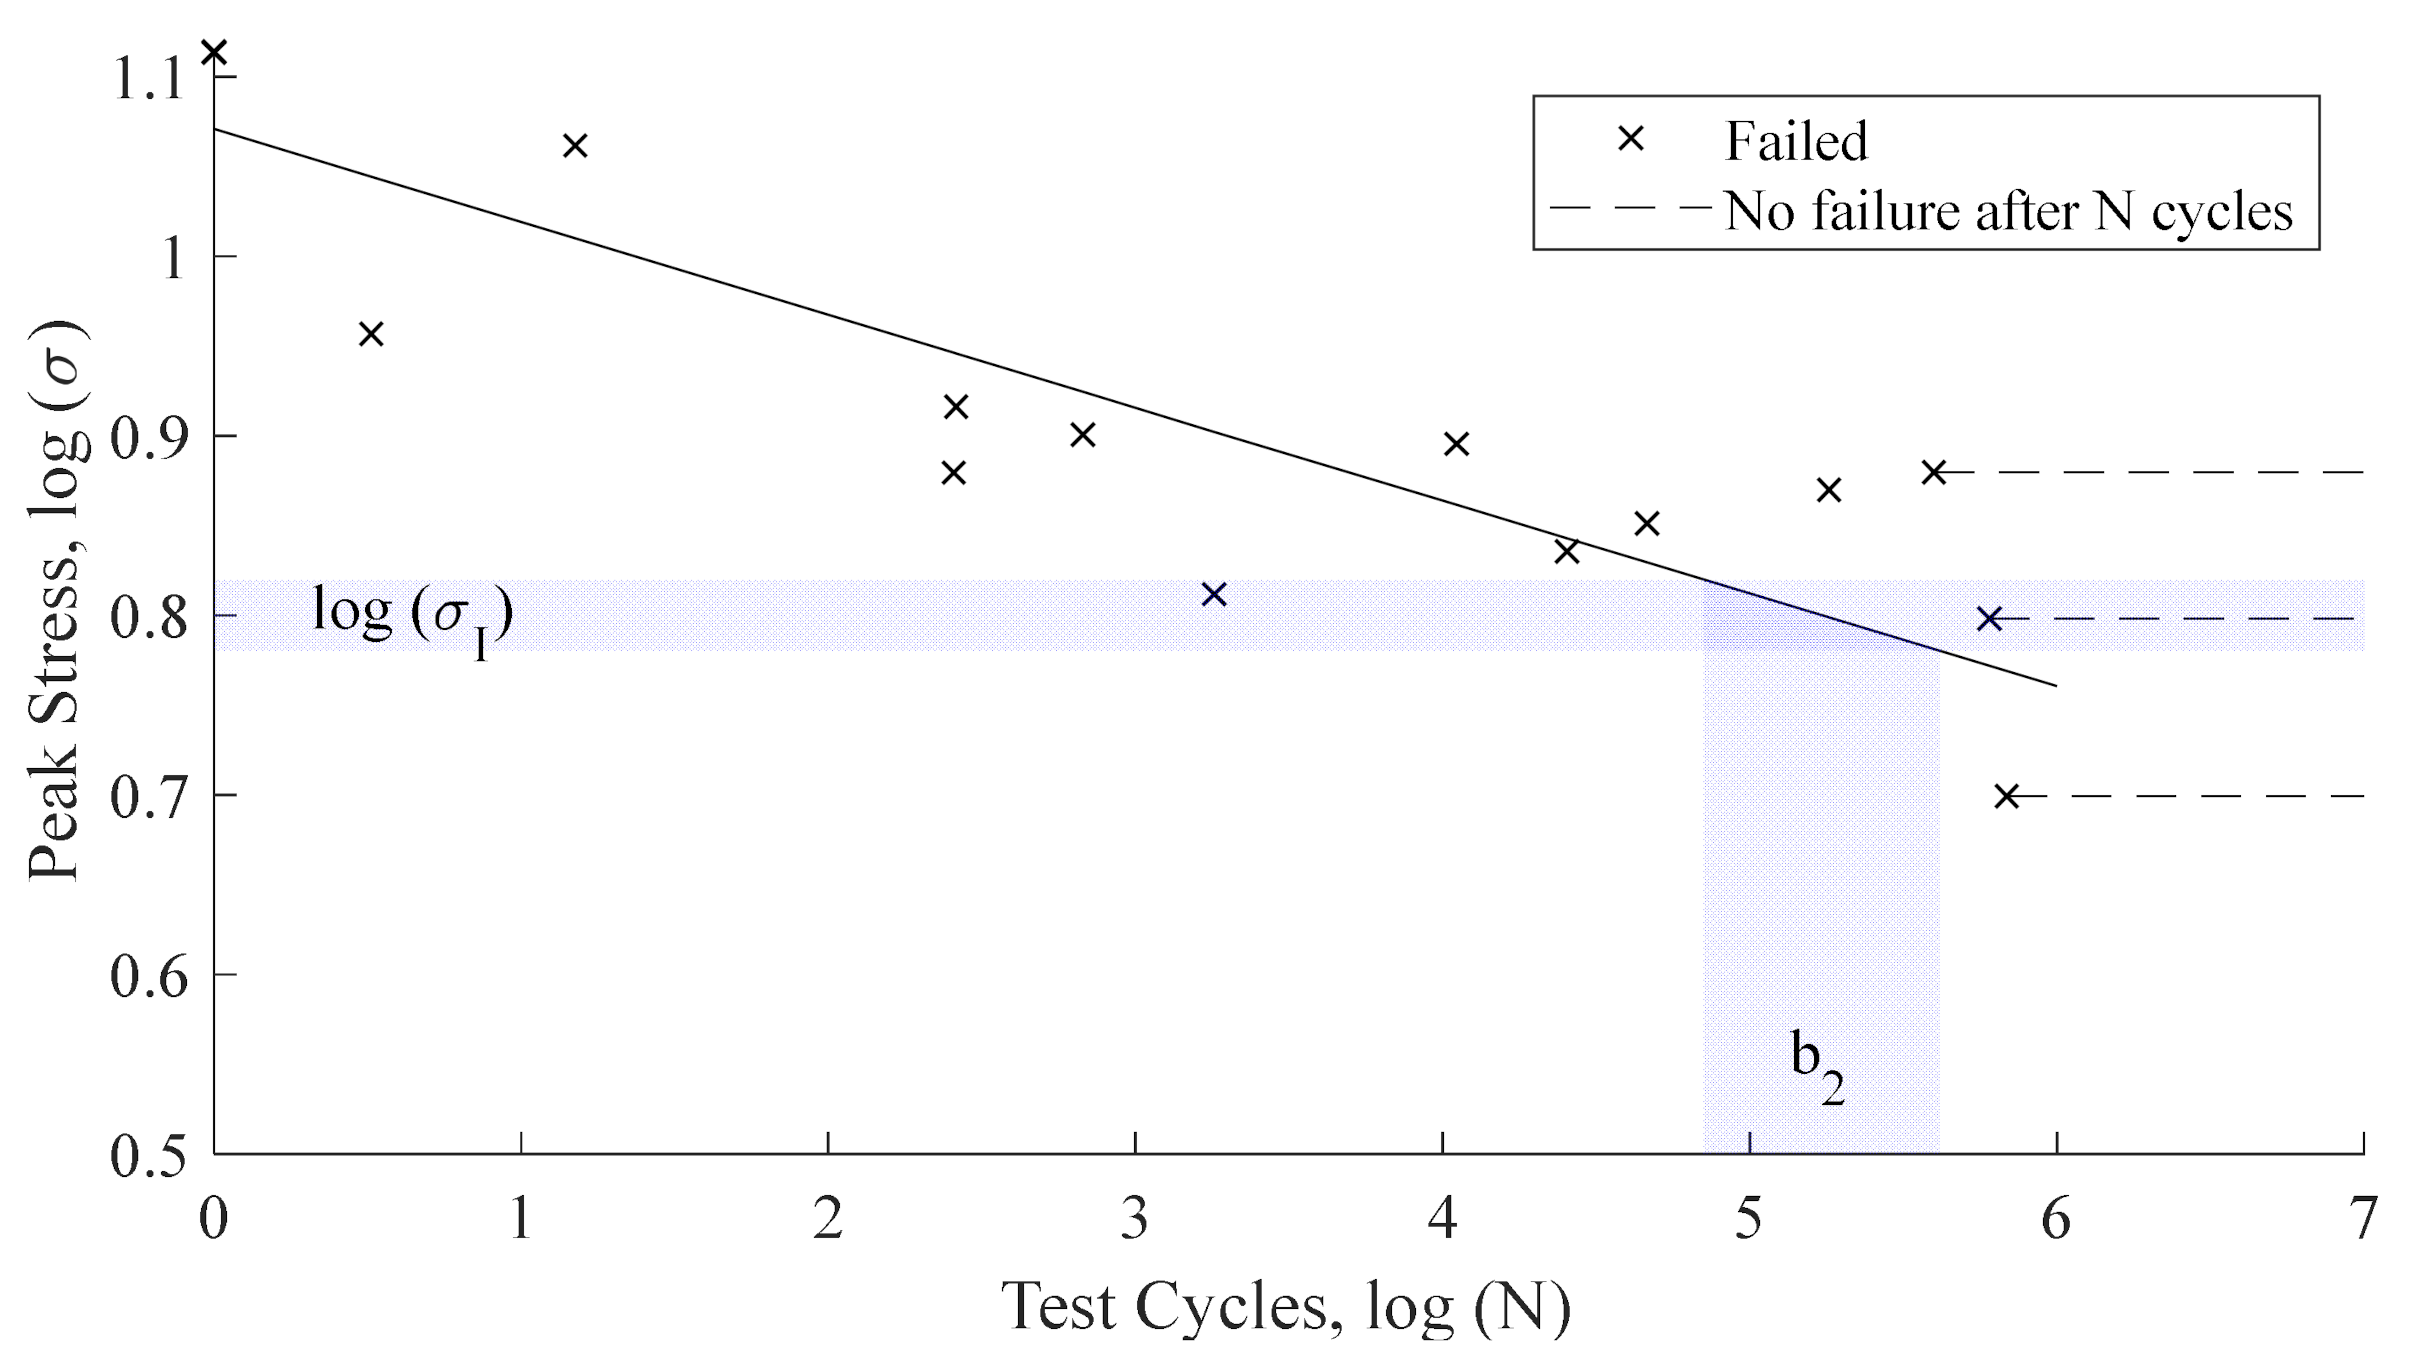
where is the ultimate tensile strength of the coating, is the endurance limit, is a Wöhler fatigue constant and is the Poisson’s ratio. An important issue for fatigue analysis is how to consider the effect of the fatigue slope parameter for the coating since it is difficult to obtain experimentally for typical LEP elastomeric materials. The constant, can be found from the Wöhler fatigue curve
where b2c matches to the “knee” in the fatigue curve (that may be estimated with its endurance limit ) and the coating ultimate tensile strength is defined for N = 1, see Figure 1. Equation (5) may be simplified assuming that and .
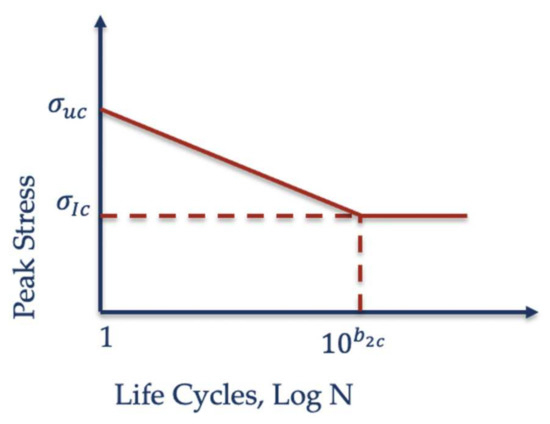
Figure 1.
Fatigue curve aproximation.
In order to include the damping effect of the coating by means of the average number of mechanical wave reflections and the relative impedance parameter that acts on the coating-substrate interface, Equation (5) may be finally stated as an equivalent erosion resistance parameter for the coating, as:
Springer’s analytical model quantitatively predicts the erosion of coated materials under the previously untested conditions. The semi-empirical formulation of Equations (3), (4) and (7) to estimate the incubation period requires different material parameters and operational conditions to be defined. The erosion lifetime prediction model described in this section was computationally assessed and applied by the authors in [4,5] as a model to carry out studies into the optimisation of the acoustic impedance characterisation involved on the LEP material performance criteria. In this work, the modelling methodology is applied to analyse the effects of variation in the material parameters that define the erosion “strength”, namely the ultimate tensile strength, endurance limit, Poisson’s ratio and the ‘knee’ in the fatigue curve. A complete map of the input parameters of the modelling is presented in Figure 2, to summarise all the material properties and operational conditions required in the modelling, as well as how their relevant equations interact to predict the end of the incubation period for a material [3].
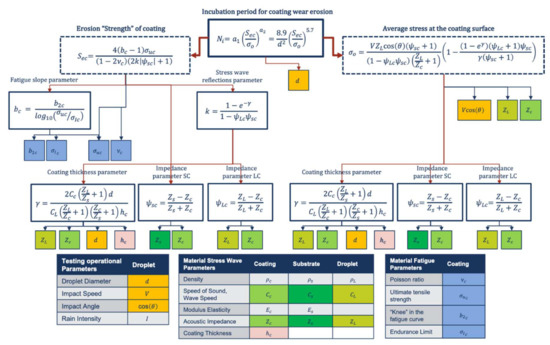
Figure 2.
Map of input data for the wear erosion lifetime modelling from [4]. Diagram of liquid, coating and substrate material and droplet impact operational parameters affecting rain erosion performance.
3. Material Characterisation and Rain Erosion Testing
To assess the Springer model, a series of property measurements and rain erosion tests have been performed on a LEP coating system. The coating system considered is an industrially used erosion resistant topcoat, consisting of one layer of topcoat and a filler layer. The filler was applied by filler knife and sanded smooth to achieve the required thickness using 120 grit sandpaper. Thickness was measured initially using a wet film comb and subsequently using an ultrasonic thickness gauge (Elcometer PTG8, Elcometer, Manchester, UK). The LEP coating was applied by brush, again using the wet film comb for coating thickness measurement. The coating characterisation is developed completely, with all the required material parameters as depicted in previous section, Figure 2.
3.1. Material Base Properties Measurement
The density of the coating was determined with a Guy-Lussac pycnometer (Fisher Scientific, Waltham, MA, USA). A piece of solid cured coating was placed into the pycnometer, and 30 mL of water was added to find its volume. The density was then calculated from the volume and the known increase in pycnometer mass when the coating was added according to ISO 2811 [17].
The Springer model does not account for the very high-rate transient pressure build-up and the viscoelastic material effects involved in a droplet impact event [4]. The highly transient material behavior during the collision introduces a range of high frequencies into the material. LEP polymers are viscoelastic materials, and as a result their mechanical and acoustical property will depend upon the measurement frequency and temperature. However, the model requires the speed of sound of the coating and substrate to be measured at a single value [5]. The speed of sound values in this work were found using a 20 MHz transducer (Elcometer, Manchester, UK).
Additionally, for the droplet impact analysis and modelling, it is important to note that the ultimate tensile strength characterisation represents an important input parameter, and its strain rate dependent value may be an important source of deviation on the modelling accuracy. Characterising LEP materials at high strain rates is difficult, even at small amplitudes, as the regime of interest at a very high frequency is limited. In this work, the ultimate tensile strength, Poisson’s ratio, endurance limit and the ‘knee’ in the fatigue curve have been determined as considered by Springer [3]. The static and fatigue tests were completed on rectangular thin film coatings with thicknesses ranging between 0.07 and 0.1 mm. Samples were produced with the same processes with which they are applied to the wind turbine blade, in order to provide representative material properties. Tensile tests were completed to obtain the Poisson’s ratio and ultimate tensile strength of the coating, according to ASTM D882 [18]. The test was performed at a strain rate of 5 mm/min with no pre-tension until the failure of the sample.
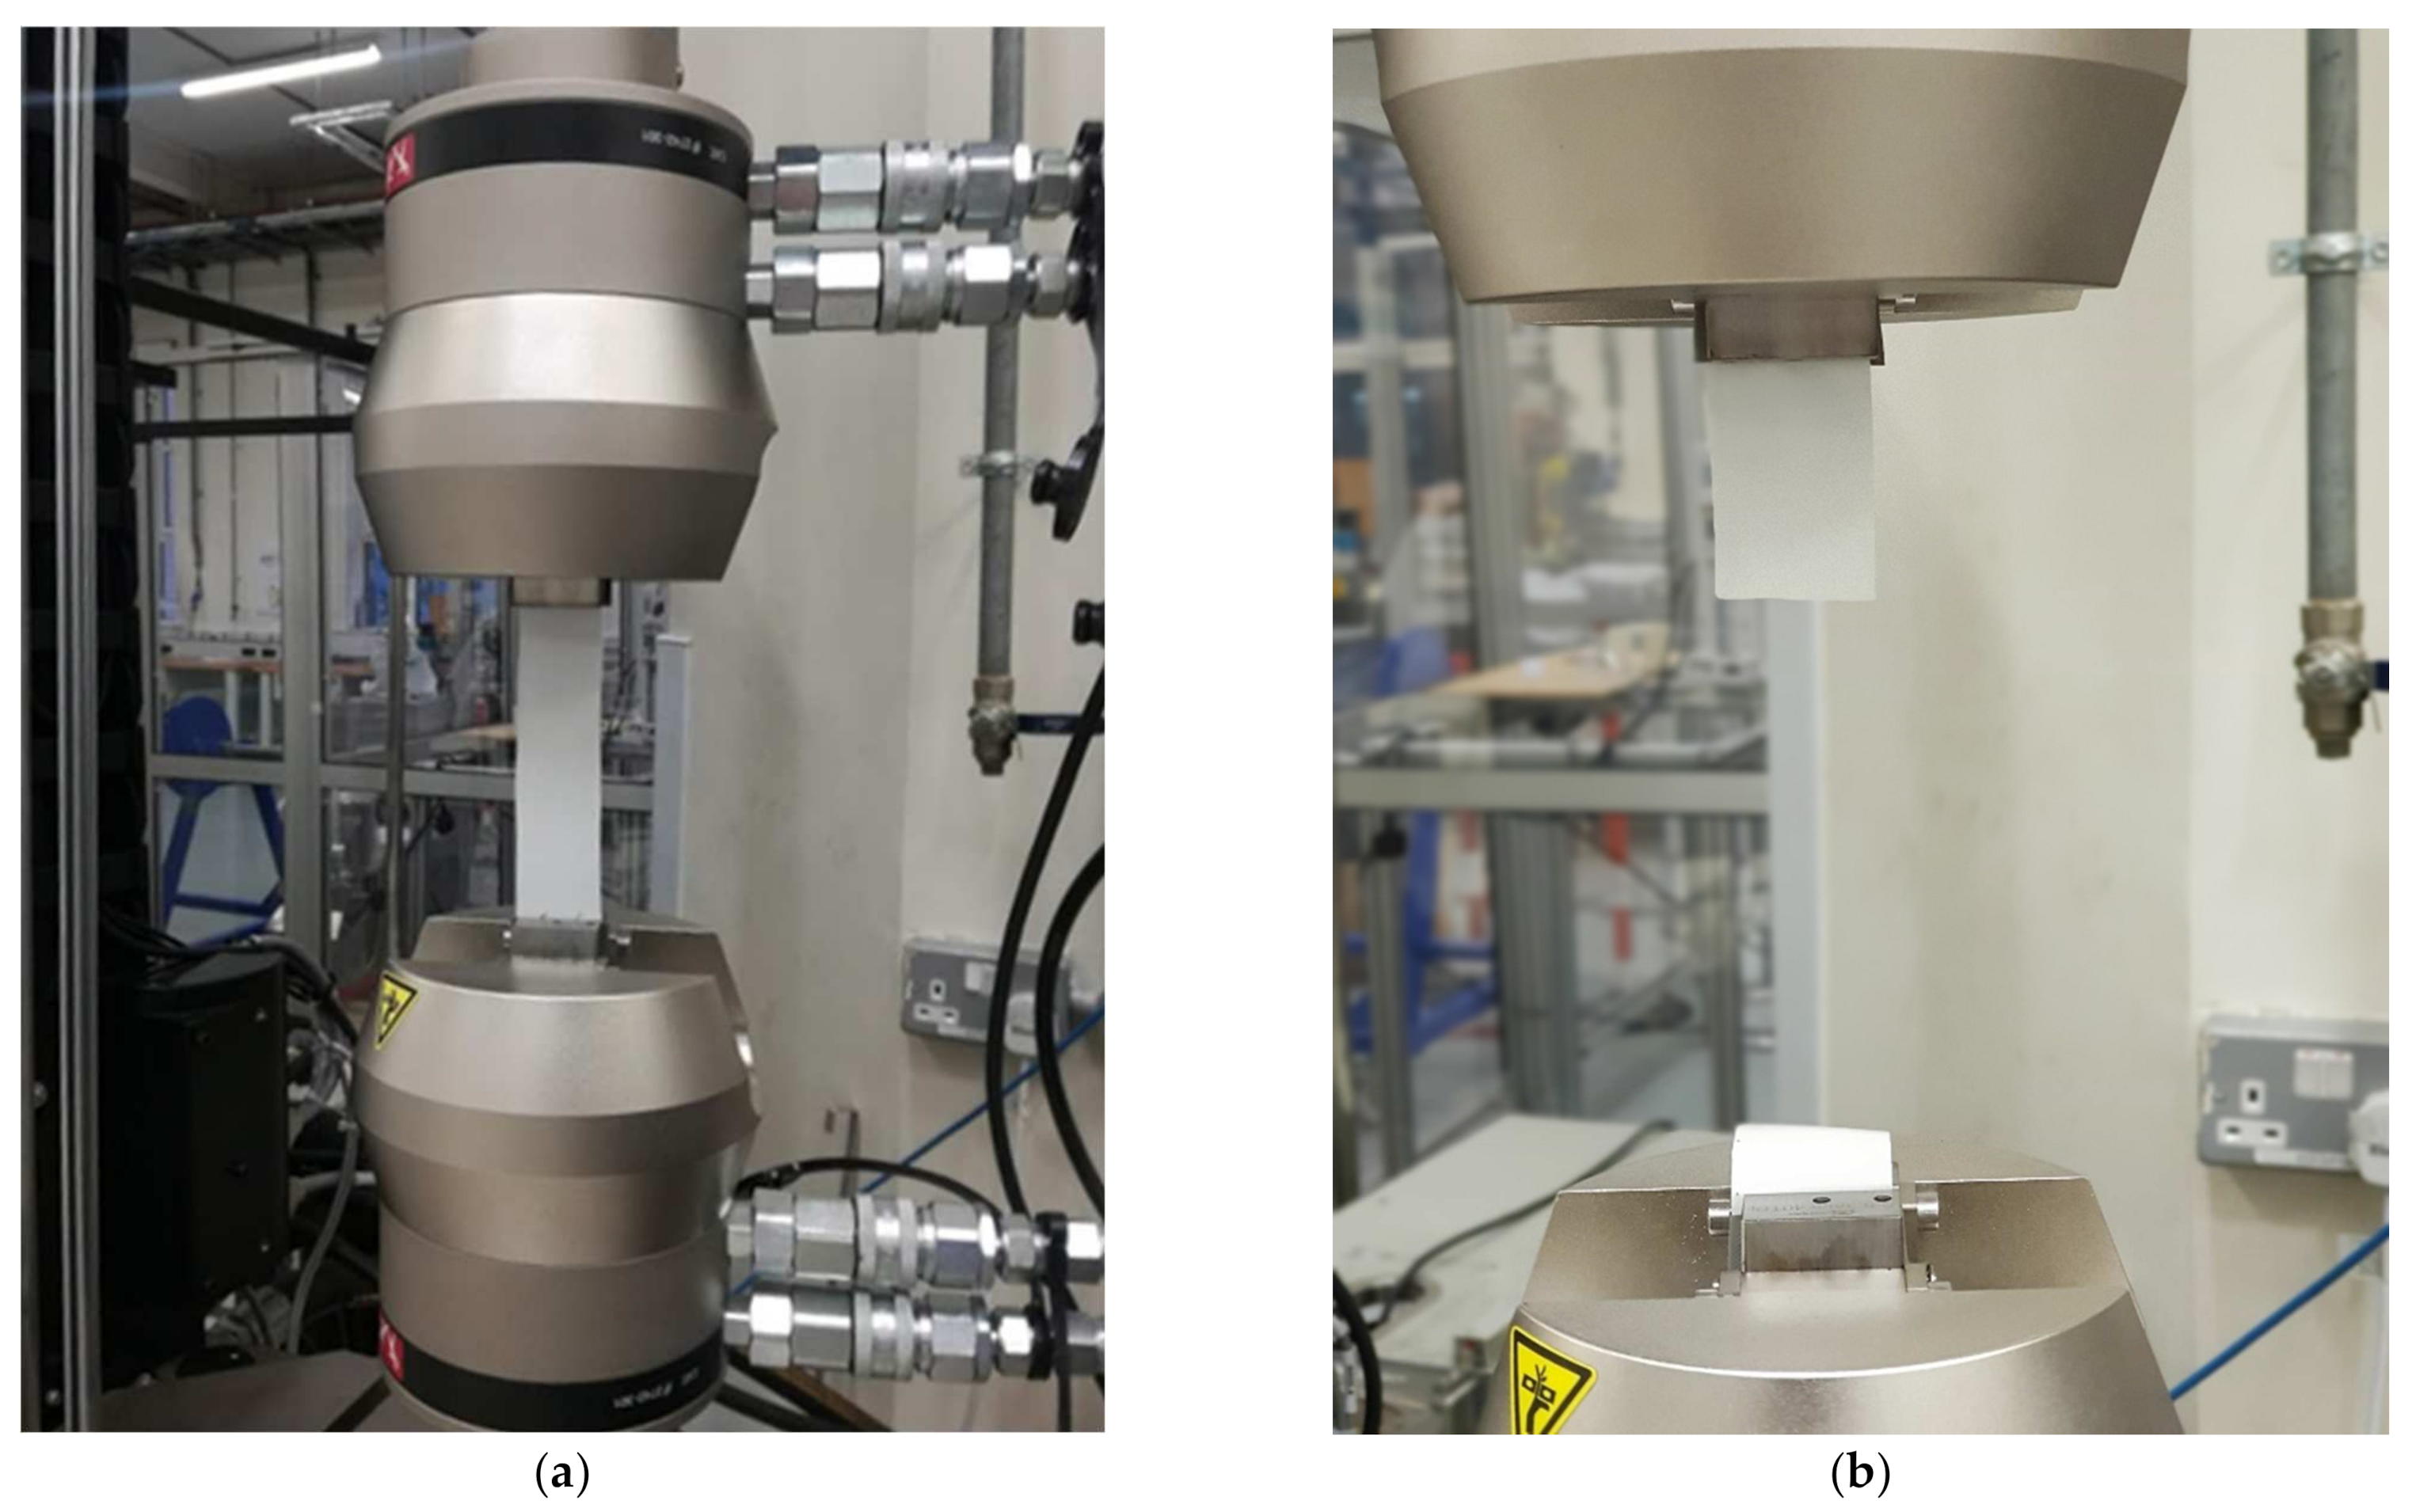
Thin film tension-tension fatigue tests were completed on the coating, with a sinusoidal frequency of 4 Hz, which is low enough to avoid a significant temperature rise in the sample. The minimum applied stress was 10% of the maximum applied stress, giving an R value of 0.1. Samples were inspected before and after failure to determine if failure was void driven, in which case the result was rejected. Figure 3 displays the test setup, as well as an acceptable test with failure in the gauge length and not in the grips.

Figure 3.
Testing setup used in the fatigue tests (a) and an acceptable failure (b).
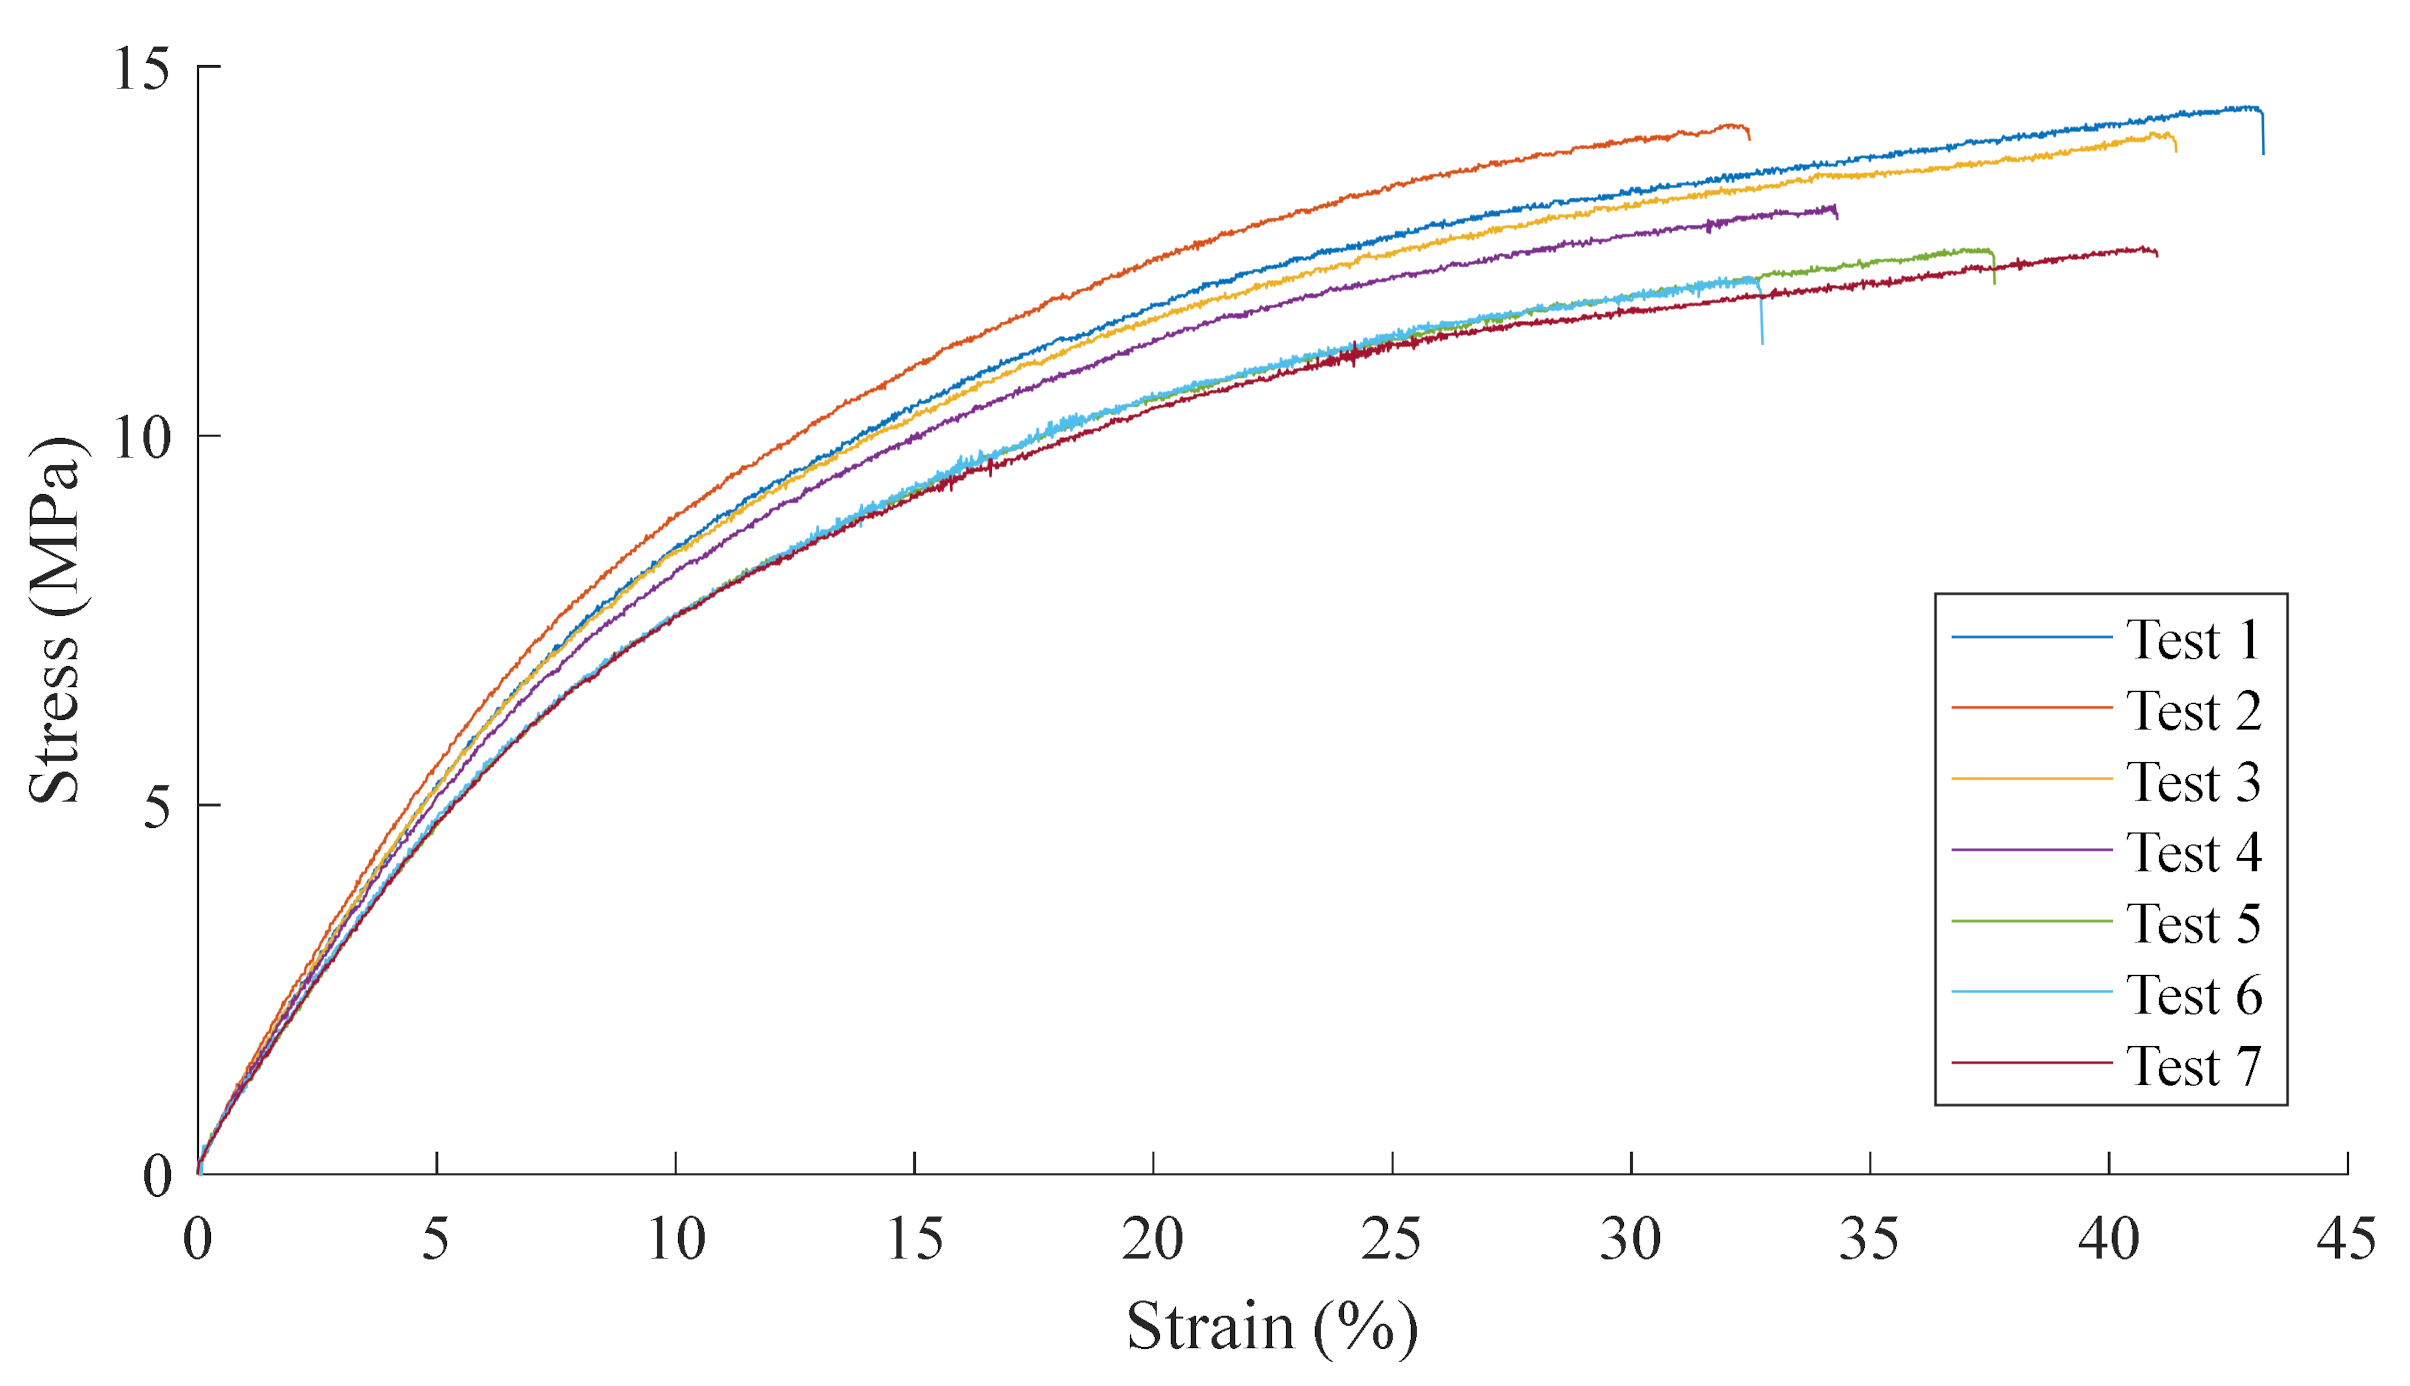
The tensile test and fatigue results can be seen in Figure 4 and Figure 5, respectively. The fatigue results broadly follow the shape of the Wöhler curve outlined by Springer with an even variability at both high and low stresses and a coefficient of determination of 0.76. Interpreting the results to determine the endurance limit and the knee of the fatigue curve possesses a degree of subjectivity, and this uncertainty has been captured in the Coefficient of Variation (CoV). The endurance limit, , and the knee of the curve, b2c, have been estimated between 6.02 and 6.61 MPa and between 4.8 and 5.6, respectively. Utilising the middle values 6.31 MPa and b2c = 5.2 and substituting them into Equation (6) gives a Wöhler fatigue constant, —different to the 20.9 Springer assumes for all materials in [3]. When the uncertainty in evaluating Figure 5 is included, the upper value for is 18.07. Furthermore, factoring in uncertainties in the testing and scatter in the results, and that the Wöhler fatigue constant obtained is potentially within acceptable limits of Springer’s, assumed 20.9. However, further improvements in the fatigue testing of LEP coatings is required to reduce these uncertainties and improve the confidence in results to be able to conclude if the 20.9 value proposed is suitable for the viscoelastic LEP systems employed on wind turbine blades.
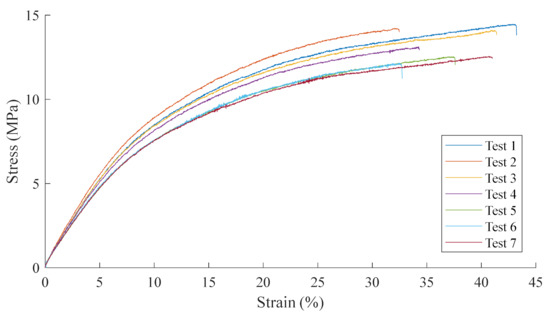
Figure 4.
Tensile test results for the coating.

Figure 5.
Fatigue test results for the coating. The blue error bounds illustrate the uncertainty in the obtained endurance limit and fatigue “knee” values.
Table 1 presents the averages and the CoV from the base property material tests.

Table 1.
Base property material test results for the coating and composite substrate.
3.2. Rain Erosion Testing
Rain erosion tests were performed on the coating system in Offshore Renewable Energy (ORE) Catapult’s whirling arm erosion test rig (R&D A/S, Hinnerup, Denmark). This rig is the wind industry standard design used with the DNV-GL-RP-0171 [2] guideline for testing of rotor blade erosion protection systems. During the test, erosion is expected to grow linearly from the tip end, which experiences the highest local velocity speed, towards the root, where the local velocity is lower.
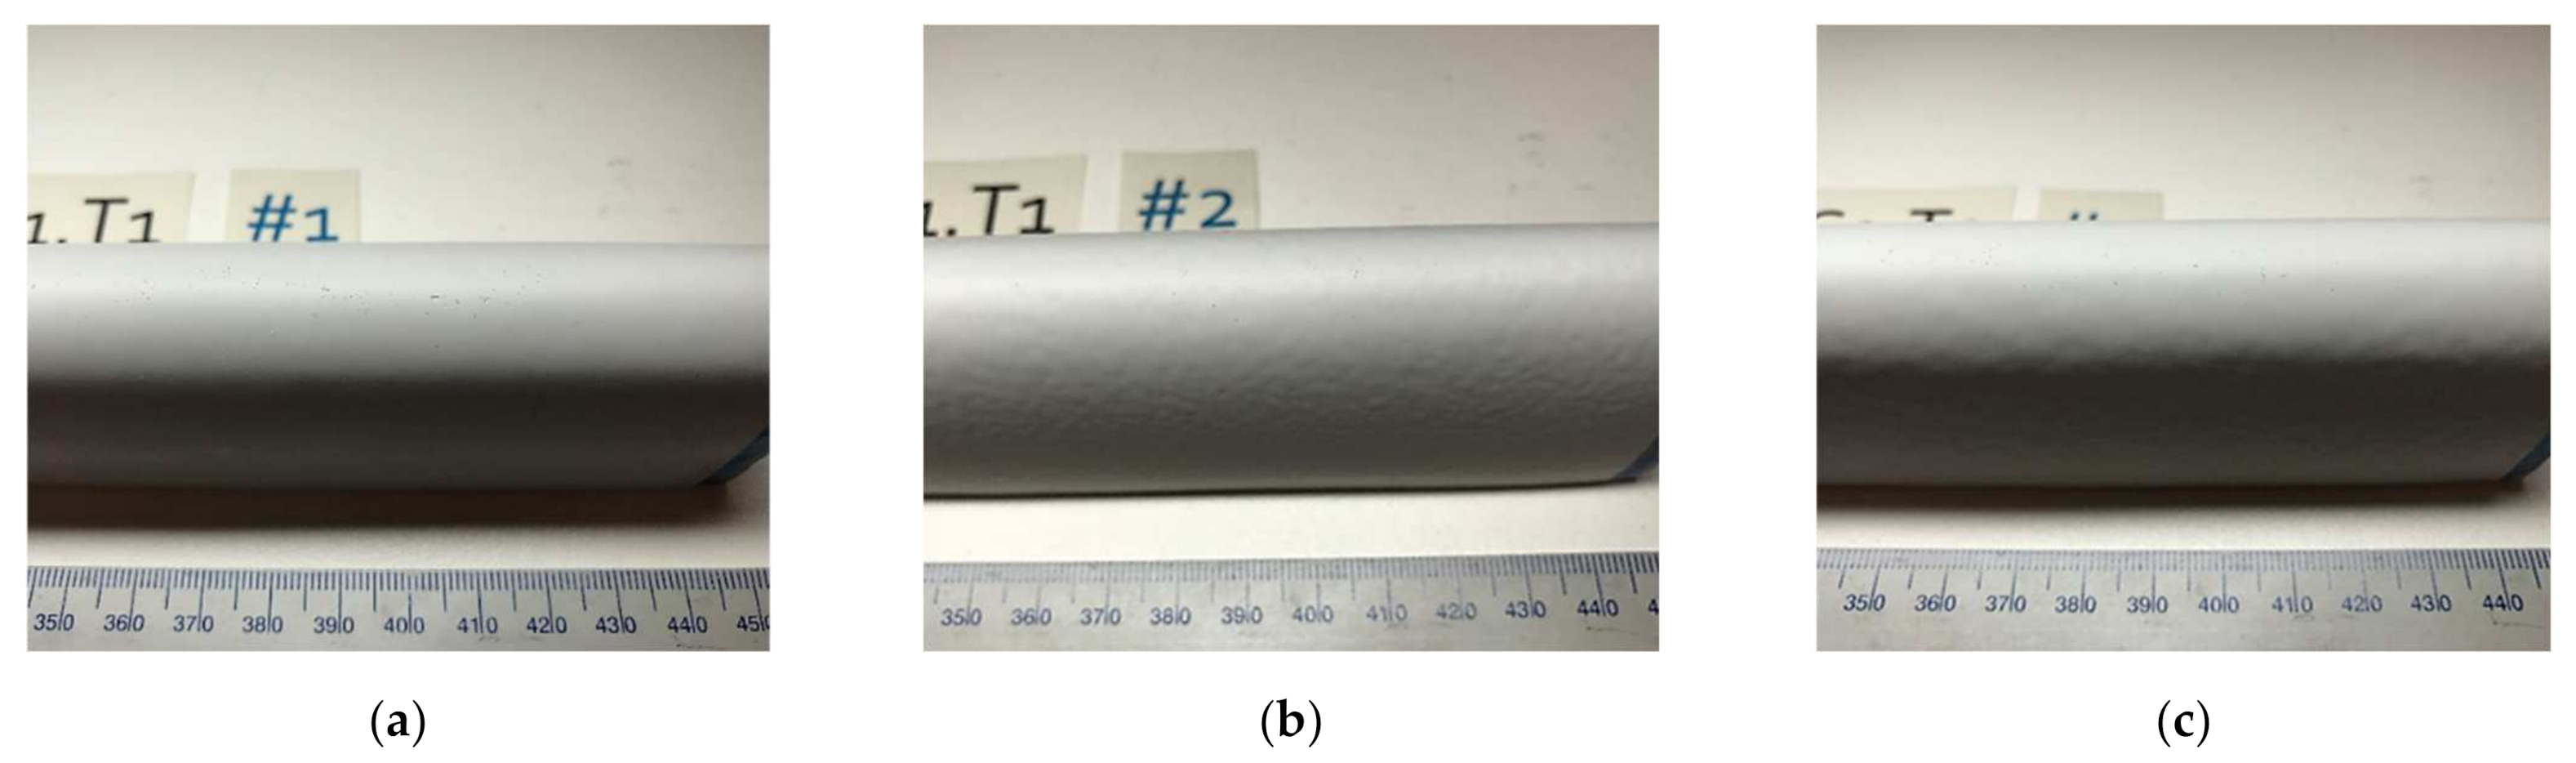
The test specimens were prepared in line with their service application procedure at a relevant in-situ wind turbine application temperature of 15 °C and 70% humidity. The specimens can be seen in Figure 6 at the start of the test. The samples were provided in three configurations: one sample with the LEP coating of standard thickness (sample #1), one sample of LEP coating of thicker than standard (sample #2) and one sample with two coats of standard thickness (sample #3), giving coating thicknesses of 120, 180 and 240 μm, respectively.
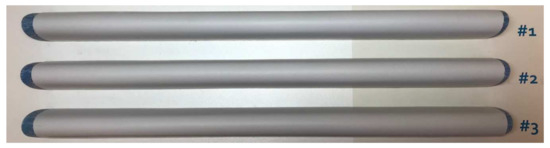
Figure 6.
The three rain erosion samples at the start of the test. The high-speed tip end is on the right-hand side of the figure.
Voids and defects can cause erosion pits to occur ahead of the erosion front, and therefore thorough inspection of the sample prior to the test is essential to enable correspondence with any unusual erosion. All three samples showed a relatively smooth even coating with minimal defects. Sample #1 had a 10 mm depression in the surface towards the tip, while sample #2 had a 3 mm depression in the surface approximately 30 mm from the root and sample #3 had a 5 mm cut at the root.
The samples were tested under a rotational velocity of 1000 rpm, providing a local impact velocity of 105 m/s at the centre of the sample, 84 m/s at the root and a maximum of 125 m/s at the tip. A mean droplet size of 2.49 mm with a CoV of 0.8% was used. The samples were visually inspected every hour, and the location with the slowest local velocity that had reached incubation was recorded. The test stopped once the coating is eroded through and the composite structure of the specimen exposed.
The Springer model predicts the end of the incubation period for a given impact velocity. To evaluate the prediction, the incubation location, which can be related with velocity, and time, which can be related with the number of impacts in the test rig used, were recorded throughout the test. The first incubation points were reached in the samples after 4 h of testing, and are presented in Figure 7.
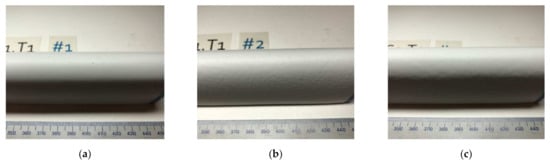
Figure 7.
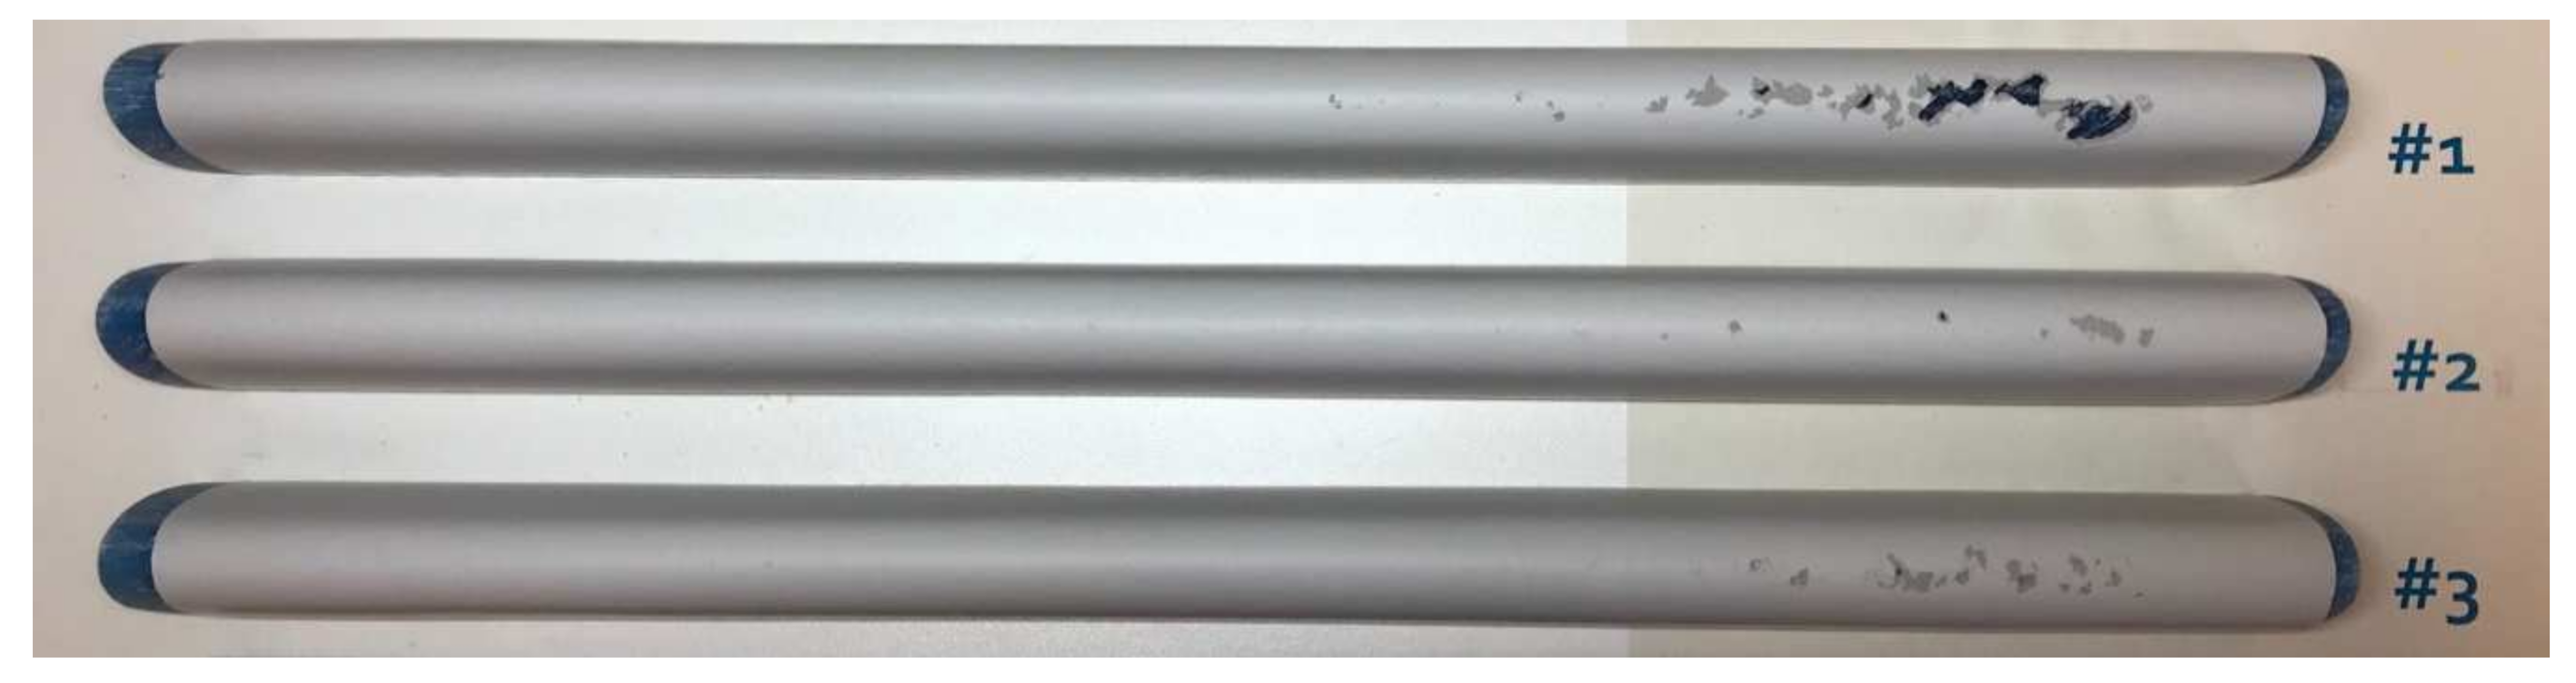
Incubation reached on the test samples after 4 h in the rain erosion test rig. Pitting can be observed on the leading edge of: (a) Sample #1 at 407, 401, 388, 354 and 294 mm; (b) Sample #2 at 410, 398 and 368 mm; and (c) Sample #3 at 405, 402, 394, 373, 357 and 331 mm.
In line with the DNV-GL-RP-0171 [2] guideline, the time to end of incubation can be directly related to the number of droplets impacting each point and the local velocity at the impact location. Figure 8 presents the incubation curve for the three samples.
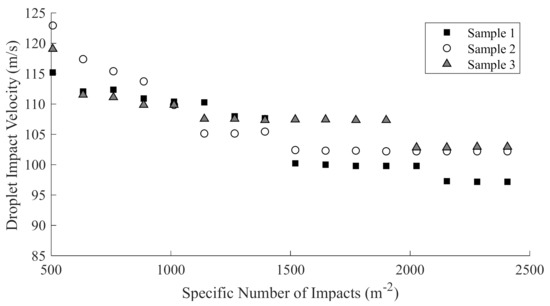
Figure 8.
Incubation curve for the test specimens, presenting the end of incubation at different local velocities.
Erosion progressed along the three samples at similar rates up to 1500 m−2 specific impacts, after which the erosion progressed slightly faster along sample #1 than #2 or #3. Breakthrough to the composite substrate was reached in 8 h for sample #1, while sample #2 and #3 both reached breakthrough in 11 h. Sample #1 experiences the most substantial erosion, which can be seen by the large patches of blue substrate in Figure 9, followed by sample #3, with sample #2 showing the least erosion damage. These results suggest that while different layer thicknesses have little impact on the time to incubation, the layer configuration and thickness change the rate of erosion through to the substrate. The Springer model assessed in this study estimates the time to incubation, and therefore the time to breakthrough is not considered in the further analysis.

Figure 9.
The test samples after 11 h in the rain erosion test rig at a rotational velocity of 1000 rpm.
4. Quantitative Analysis of Rain Erosion Lifetime Performance Prediction
4.1. Case 1. Derivation of the Erosion Strength from Base Material Properties and Performance Analysis Based on Springer Modelling
In this section, the erosion strength is determined by considering the material properties as input parameters as defined in Table 1 for the testing coupon results depicted in Figure 8. The erosion strength of a coating is initially defined in terms of its base material properties numerically as:
Including the damping effect:
Finally, the average stress on the coating surface at x = 0 is defined with as:
So
The fact that Springer model uses 20.9 for all materials is the same as in fact introducing another constant, and limiting the effect of the fatigue properties variation of the materials.
It is also possible, using Equation (3), to find the erosion strength of the coating from rain erosion test data. The number of impacts per m2 per second, , is
where is the droplet concentration in the test rig and is the impact velocity. Their values are dependent on the test conditions, and can be determined using the guideline for rain erosion testing, DNV-GL-RP-0171 [2].
The percentage damage of a coating, D, is given by
where is the percentage damage per second and is the test time. The percentage damage per second is found from:
The coating reaches the end of its incubation period when is equal to 1. By combining Equations (3), (8), (9) and (10) and rearranging them, the erosion strength of a coating from rain erosion tests can be found as:
As introduced before, a suitable complete parameter that includes “overall” LEP capabilities to withstand the impact energy in fatigue analysis is given by the erosion strength . It is defined by Equation (5), which is affected by all the fundamental properties of the LEP system, as depicted in Figure 2. It may be used in combination of the averaged stress to account additionally for the operational load conditions applied during impact, mainly the droplet impact velocity and the droplet diameter, see Equation (4). The estimation of both parameters together as , the higher the better, allow one to infer appropriate analysis with a general equation as a power law , where parameters a1 and a2 are derived in the used modelling with constant values. It is important to note that the exponent constant value a2 is crucial for evaluating the speed of the erosion advancement, since the parameter characterises the complete material behavior under the particular load conditions.
The erosion strength of a given LEP system is derived using its RET data by matching the and values for a given RET data VN plot result as:
In our case, all the values were obtained for all the damages (coupling and of each tested batch. The mean value of each set of points defined was obtained and plotted, see Figure 10 and Figure 11.

Figure 10.
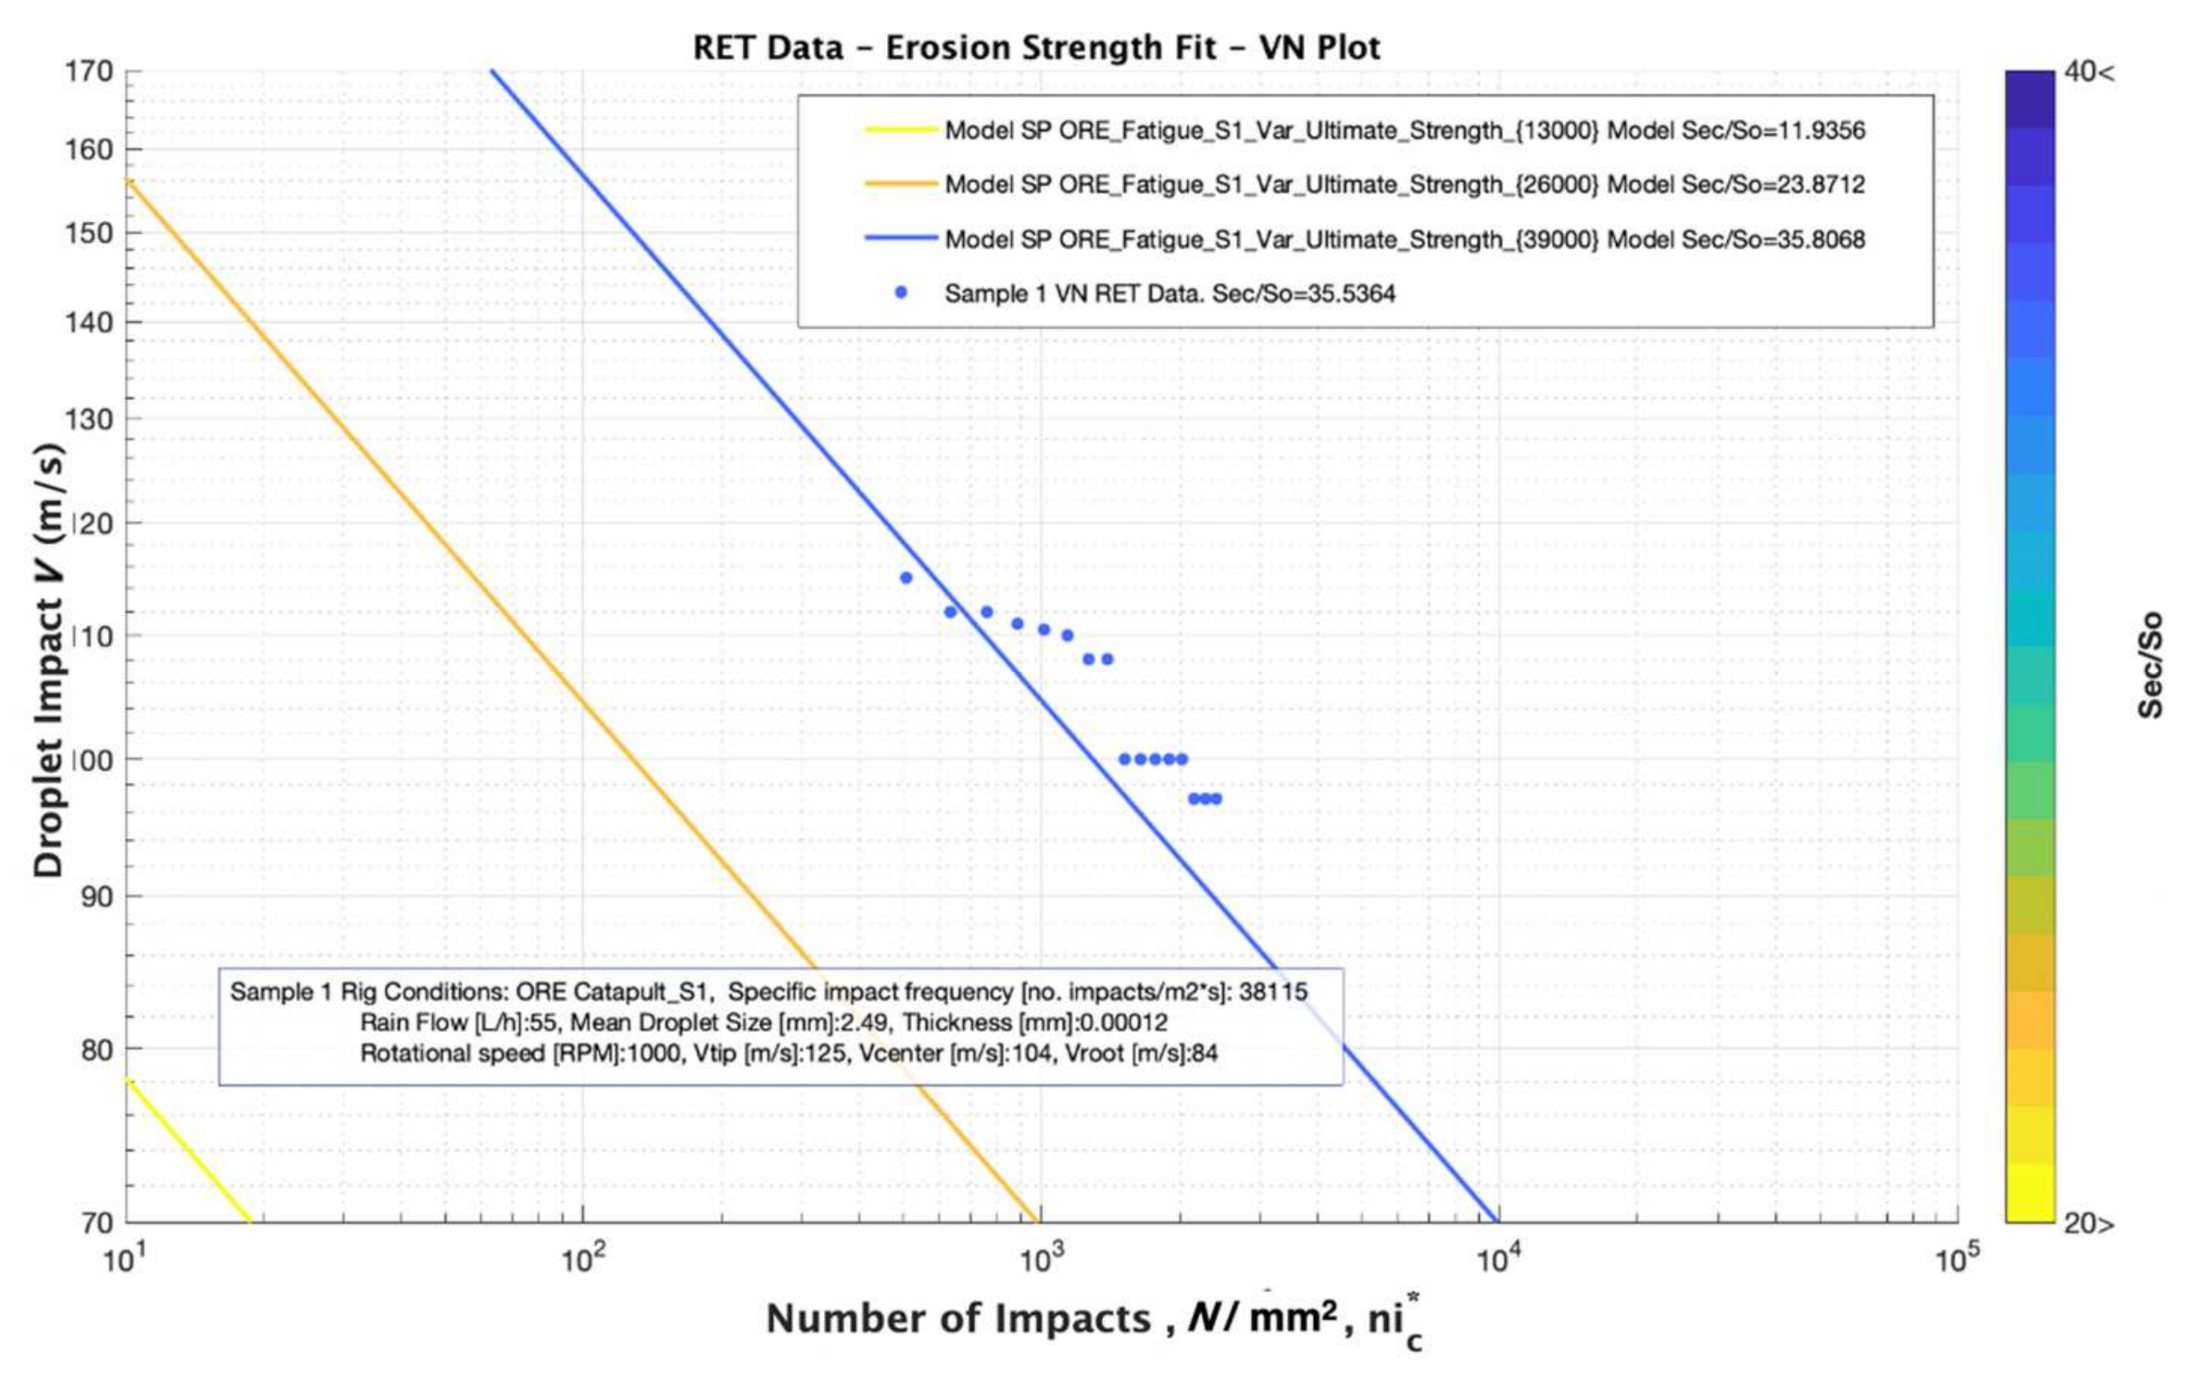
Simulation results for analysing the effect of ultimate tensile strength, (MPa) variation considering comparable values of 13, 26 and 39 MPa and a Fatigue “knee” constant value of 16.52.
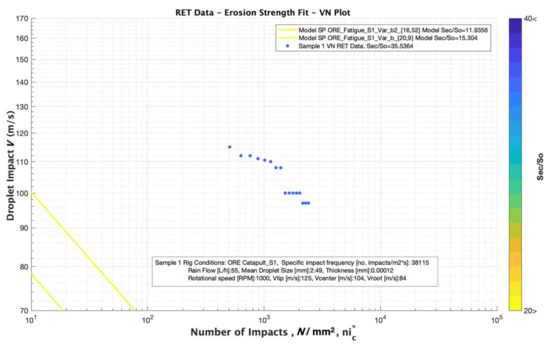
Figure 11.
Simulation results for analysing the effect of Fatigue “knee” variation considering comparable values of 16.52 and 20.9 and Ultimate tensile strength, constant value of 13 MPa.
The modelling results do not agree with the RET data. The Ultimate Strength input parameter value assumed in static conditions testing (see Figure 4) gives poor results when compared with the experimental tested data. Alternatively, a power-law relation to describe the strain rate sensitivity of studied materials was used from [19,20] as:
In which defines the strain rate, B is a material parameter that is a function of temperature, strain and material microstructure and m is the strain-rate sensitivity (SRS) index. Further studies are required in order to justify their values for each material case, but in our worked simulation, it can be observed in Figure 10 that the simulation fits with the RET data for a strain rate in Equation (17) of 800 Hz, i.e., . The effect of the Fatigue “knee” variation is plotted in Figure 11, and it is clear that its variation does not strongly affect the fitting accuracy of the modelling with the RET data. Its relationship with the high strain rate behavior of the materials is also unclear, and further analysis should be completed to examine this aspect.
A third case of analysis is depicted in Figure 12 for comparing the effect of the thickness variation of the Sample 1, Sample 2 and Sample 3 cases. All the RET data has been analysed with the Springer model using the same material parameters discussed previously, but noting the influence of the three different thicknesses values. The results clearly state that the thickness does not affect the performance in terms of the incubation time, as indicated experimentally and observed in Figure 8.
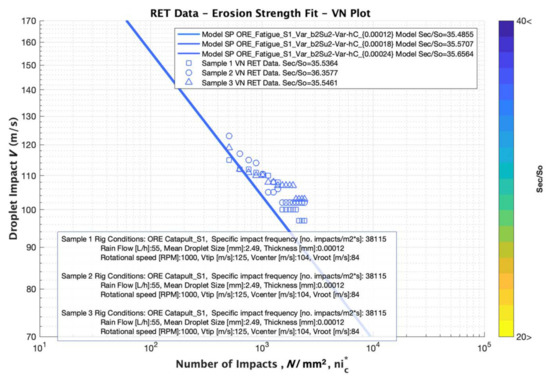
Figure 12.
Simulation results for analysing the effect of LEP Thickness Variation with three thicknesses of 120, 180 and 240 μm, respectively for Sample 1, Sample 2 and Sample 3 cases. The Fatigue “knee” values of 16.52 and ultimate tensile strength, constant value of 39 MPa in all the cases.
4.2. Case 2. Derivation of the Erosion Strength from VN Testing Data and Performance Analysis Based on Linear Regression
In this section, the droplet impact Velocity versus Number of impacts plot (commonly known as VN-plot) is derived from the RET data obtained experimentally, and is treated like fatigue data with the number of events to incubation failure, N and dependent on a variable associated directly with stress, in this case the impact velocity, V. The erosion strength of a given LEP system is derived using its RET data by matching and values for a given RET data VN plot as in the previous section. Generally, fatigue data can be well described to Equation (2) by a power law of type
which, in a log-log graph, becomes a linear law with slope m and intercept log(a):
It is straightforward then to obtain the linear regression fitting in a logarithmic-logarithmic representation. Statistical treatment to obtain the characteristic VN curve, above which 95% of the population is expected to lie with a 95% confidence, according to ASTM E739-10:2015 is used, see [21]. A statistical method for the estimation of tolerance bounds for uncertain variables is implemented. The method is used in conjunction with regression analysis results to estimate tolerance bounds for fatigue relations, such as S-N curves, for prediction of the fatigue life of coating damage stress. In general, this is not a very user-friendly method. A simplification based on a certain assumption about the available test data is introduced, and a graphical representation of the results by the simplified method is developed for considering linear fatigue slope that provides easy-to-use results for the practical purposes and scope of this research.
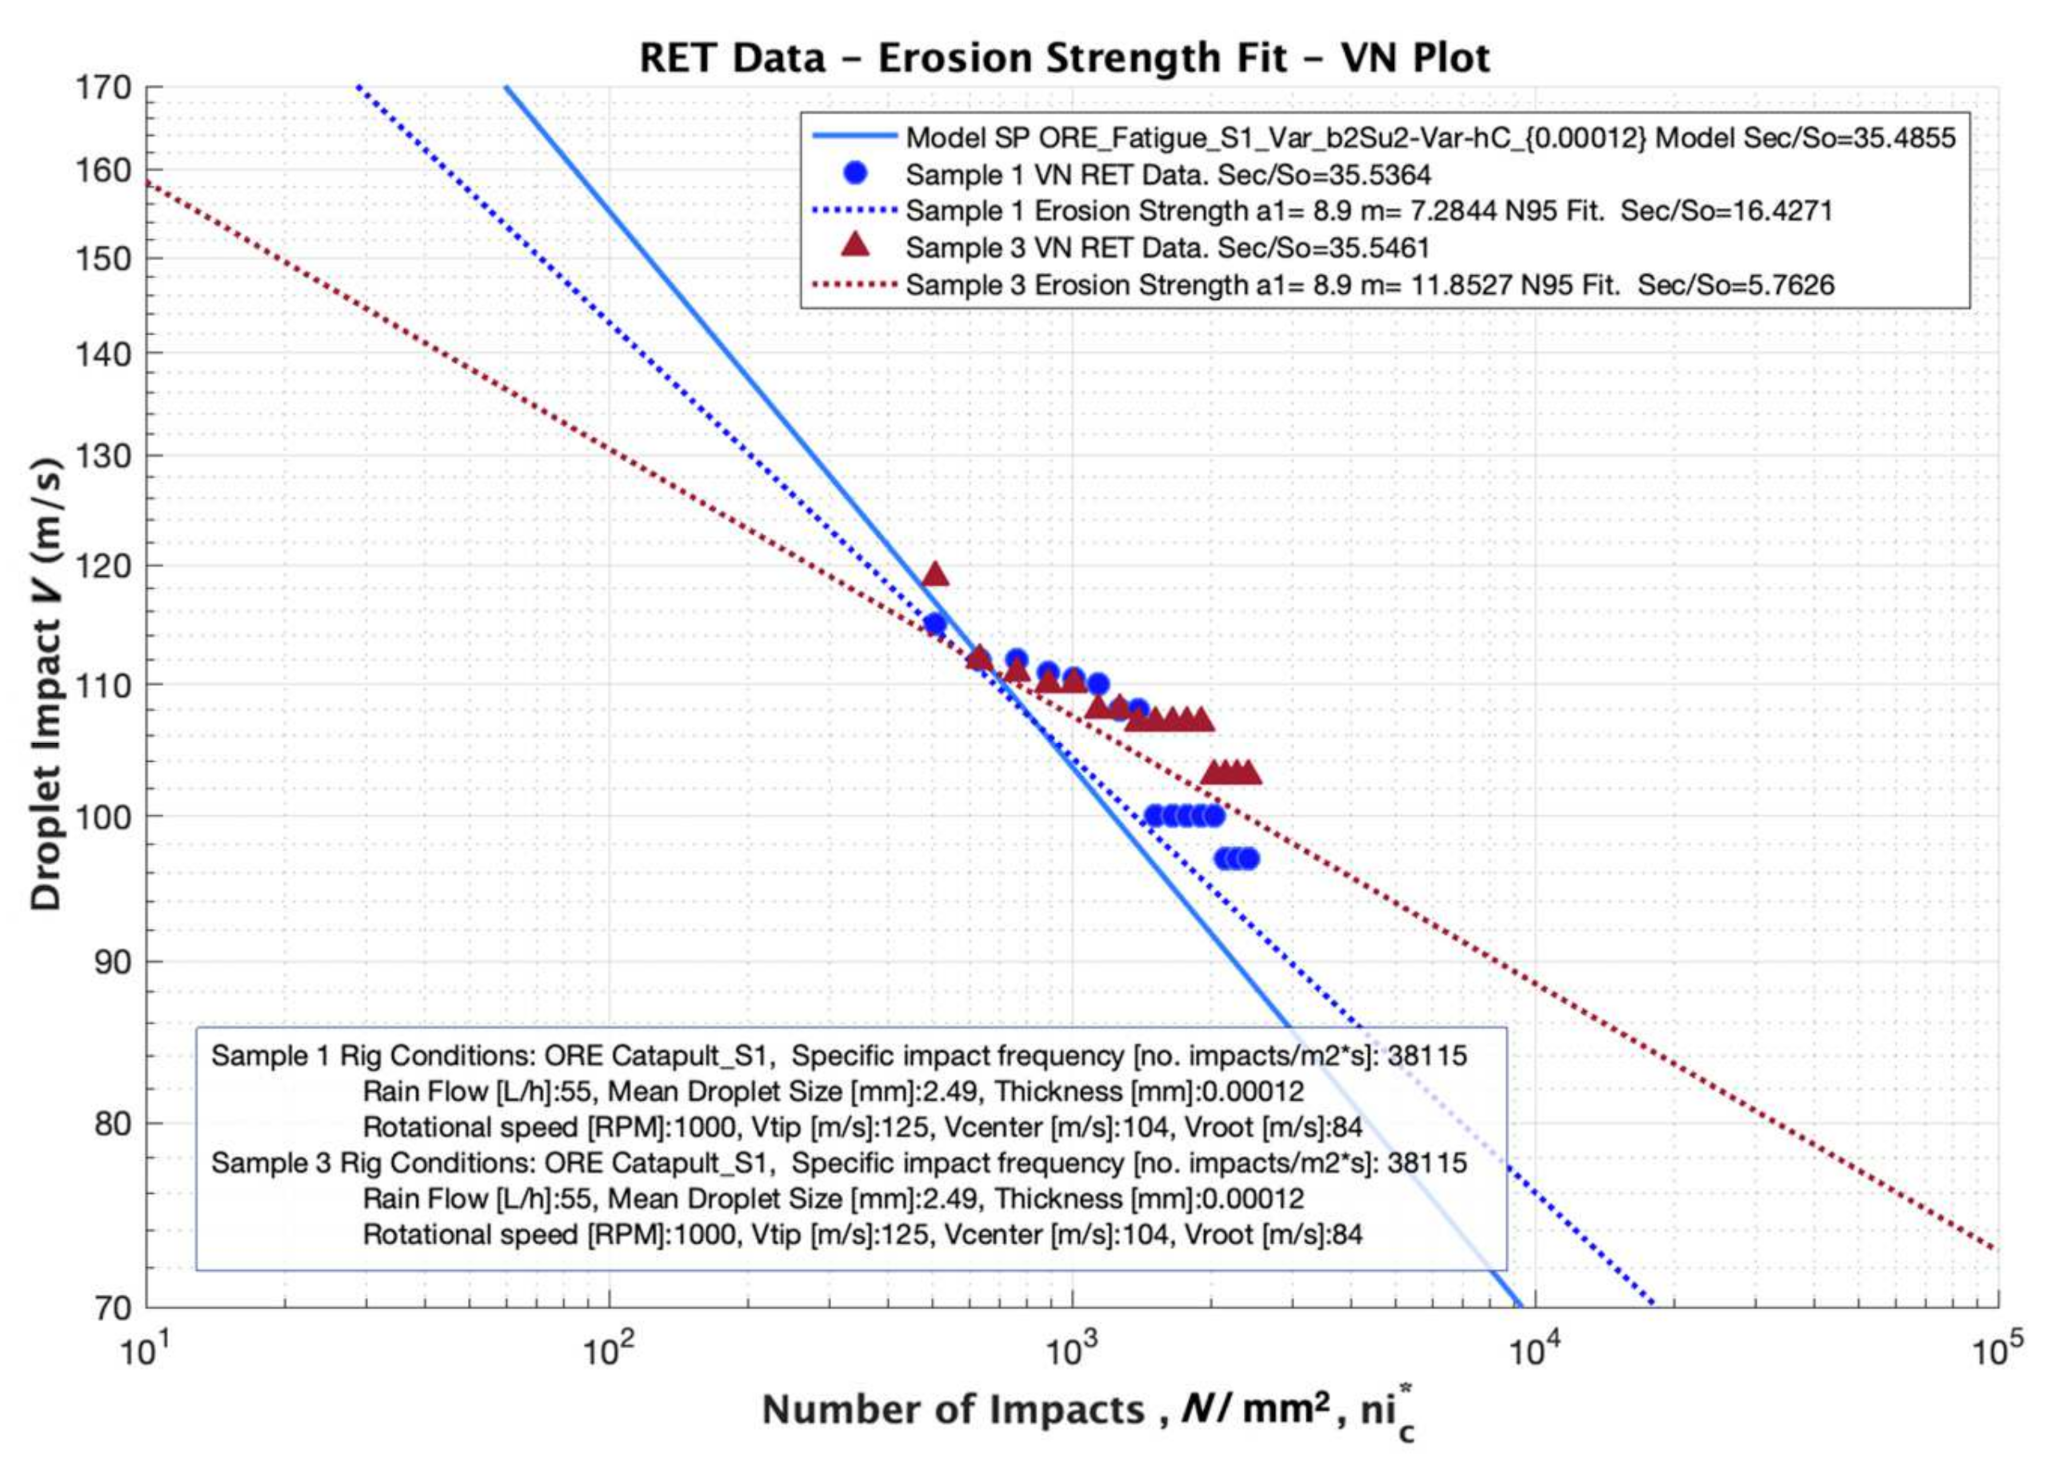
In our analysis, Springer model undertakes a pure numerical constant exponent value of a2 = 5.7 for all the testing conditions and materials. This assumption is not always best fitting with RET tested data, due to the uncertainties of the material configurations and rig testing conditions. Appropriate data fitting through the power law constant m = a2 (slope of the VN curve) may be required for adequate performance analysis and tested data for a given configuration. RET data of samples 1 and 3 (see Figure 6 for details) are compared with simulated results in Figure 13. The use of m = 5.7 slope value used by Springer Model and m = 7.28 fitted by linear regression for Sample 1 and m = 11.85 for Sample 3 is scrutinised. It is also necessary to point out that a constant value for a1 = 8.9 defined in Equation (3) is assumed for the three cases.
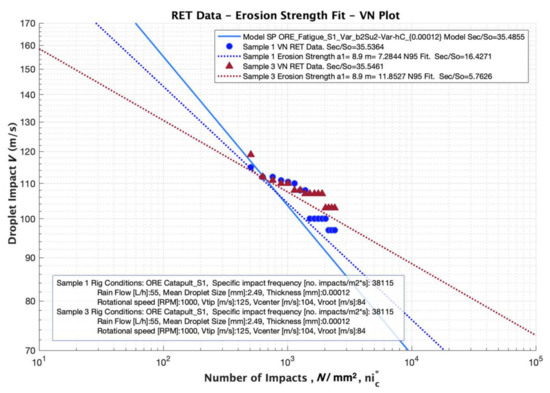
Figure 13.
Erosion strength from VN testing data fit and performance analysis based on adjusted power law with Linear Regression, compared with Springer modelling parameters.
5. Conclusions
This work has been developed in a context of identifying and improving appropriate numerical and analytical models as a tool to analyse how to connect LEP fundamental material properties with rain erosion performance. Simplified modelling procedures such as Springer to predict wear surface erosion was used and implemented to define criteria for identifying suitable LEP coating performance. The Springer model is based on numerical parameters defined with specific experimental observations. Variations on material or RET configurations may include important differences and uncertainties when applied in the performance analysis. However, the experimental data used to develop the model is unrepresentative of the testing and materials currently used within the wind industry. The Springer model also ignores the multilayer configuration, which is common in current wind turbine leading edge protection systems. Furthermore, the same fatigue numerical parameters were used for different coating materials, ranging from metals to polymer applications. The differences between the experimental data used by Springer and the current industry approach to rain erosion testing indicates that the empirical constants used within the model are unlikely to be applicable directly to leading edge erosion of wind turbine blades in many cases. As a result, using the model reliably may introduce inaccuracies in lifetime predictions. Specifically, in the case of using viscoelastic materials, the highly transient material behaviour during waterdrop collisions require appropriate material characterisation at high strain rates. On the other hand, the model’s capabilities have been demonstrated in this research enabling it to be used as a tool to evaluate how each material property effects the ‘Erosion Strength’ as a ‘global’ input parameter in the modelling. It also offers accuracy predictions, when coupled with modified numerical parameters obtained from experimental RET testing data. The main novelty of the research is focussed on the discussed modelling cases that are treated completely, allowing for the interpretation of the required experimental material characterisation and its relationship with the LEP erosion performance accuracy predictions.
Author Contributions
Conceptualisation, R.H., K.D. and F.S.; investigation, R.H.; methodology, R.H., K.D. and F.S.; resources, A.Š. and C.W.; software, L.D., J.R. and F.S.; supervision, K.D., C.W. and F.S.; validation, R.H., K.D. and F.S.; and writing—original draft, R.H. and F.S. All authors have read and agreed to the published version of the manuscript.
Funding
This research has been partially funded by the DEMOWIND-2 Project Offshore Demonstration Blade (ODB) Funded by MINECO with reference PCIN-069-2017, by the ESI-Group Chair at CEU-UCH and from the European Union’s Horizon 2020 research and innovation program under grant agreement No 811473. Project “LEP4BLADES”. This work was also supported by the Engineering and Physical Sciences Research Council through the EPSRC Centre for Doctoral Training in Composites Manufacture (Grant No.: EP/K50323X/1), project partner the Offshore Renewable Energy Catapult, and the EPSRC Future Composites Manufacturing Hub (Grant No.: EP/P006701/1). The authors would also like to thank the Wind Blade Research Hub for their support in the delivery of this paper.
Institutional Review Board Statement
Not applicable.
Informed Consent Statement
Not applicable.
Data Availability Statement
Data is contained within the article.
Conflicts of Interest
The authors declare no conflict of interest.
References
- Herring, R.; Dyer, K.; Martin, F.; Ward, C. The increasing importance of leading edge erosion and a review of existing protection solutions. Renew. Sustain. Energy Rev. 2019, 115, 109382. [Google Scholar] [CrossRef]
- DNVGL: RP-0171. Testing of Rotor Blade Erosion Protection Systems: Recommended Practice; DNV GL: Oslo, Norway, 2018; Available online: http://www.dnvgl.com (accessed on 9 July 2020).
- Springer, G.S. Erosion by Liquid Impact; John Wiley and Sons: New York, NY, USA, 1976. [Google Scholar]
- Domenech, L.; Renau, J.; Šakalytė, A.; Sánchez, F. Top coating anti-erosion performance analysis in wind turbine blades depending on relative acoustic impedance. Part 1: Modelling approach. Coatings 2020, 10, 685. [Google Scholar] [CrossRef]
- Domenech, L.; García-Peñas, V.; Šakalytė, A.; Francis, D.P.; Skoglund, E.; Sánchez, F. Top coating anti-erosion performance analysis in wind turbine blades depending on relative acoustic impedance. Part 2: Material characterization and rain erosion testing evaluation. Coatings 2020, 10, 709. [Google Scholar] [CrossRef]
- Ibrahim, M.E.; Medraj, M. Water Droplet Erosion of Wind Turbine Blades: Mechanics, Testing, Modeling and Future Perspectives. Materials 2019, 13, 157. [Google Scholar] [CrossRef] [Green Version]
- Law, H.; Koutsos, V. Leading edge erosion of wind turbines: Effect of solid airborne particles and rain on operational wind farms. Wind Energy 2020, 23, 1955–1965. [Google Scholar] [CrossRef]
- Eisenberg, D.; Laustsen, S.; Stege, J. Wind turbine blade coating leading edge rain erosion model: Development and validation. Wind Energy 2018, 21, 942–951. [Google Scholar] [CrossRef]
- Slot, H.; Gelinck, E.; Rentrop, C.; van der Heide, E. Leading edge erosion of coated wind turbine blades: Review of coating life models. Renew. Energy 2015, 80, 837–848. [Google Scholar] [CrossRef]
- Tobin, E.; Young, T.; Raps, D.; Rohr, O. Comparison of liquid impingement results from whirling arm and water-jet rain erosion test facilities. Wear 2011, 271, 2625–2631. [Google Scholar] [CrossRef]
- Adler, W.F. Waterdrop impact modeling. Wear 1995, 186–187, 341–351. [Google Scholar] [CrossRef]
- Gohardani, O. Impact of erosion testing aspects on current and future flight conditions. Prog. Aerosp. Sci. 2011, 47, 280–303. [Google Scholar] [CrossRef]
- Doagou-Rad, S.; Mishnaevsky, L.M., Jr.; Bech, J.I. Leading edge erosion of wind turbine blades: Multiaxial critical plane fatigue model of coating degradation under random liquid impacts. Wind Energy 2020, 23, 1752–1766. [Google Scholar] [CrossRef]
- Fang, J.; Owens, R.G.; Tacher, L.; Parriaux, A. A numerical study of the SPH method for simulating transient viscoelastic free surface flows. J. Non-Newton. Fluid Mech. 2006, 139, 68–84. [Google Scholar] [CrossRef] [Green Version]
- Verma, A.S.; Castro, S.G.; Jiang, Z.; Teuwen, J.J. Numerical investigation of rain droplet impact on offshore wind turbine blades under different rainfall conditions: A parametric study. Compos. Struct. 2020, 241, 112096. [Google Scholar] [CrossRef]
- Yonemoto, Y.; Kunugi, T. Universality of droplet impingement: Low-to-high viscosities and surface tensions. Coatings 2018, 8, 409. [Google Scholar] [CrossRef] [Green Version]
- ASTM D882-18 Standard Test Method for Tensile Properties of Thin Plasic Sheeting; ASTM: West Conshohocken, PA, USA, 2018; Volume 08.01.
- ISO 2811-1: Paints and Varnishes—Determination of Density—Part 1: Pycnometer Method; ISO: Geneva, Switzerland, 2016; Volume 87.040.
- Sarva, S.S.; Deschanel, S.; Boyce, M.C.; Chen, W. Stress–strain behavior of a polyurea and a polyurethane from low to high strain rates. Polymer 2007, 48, 2208–2213. [Google Scholar] [CrossRef]
- Fan, J.; Weerheijm, J.; Sluys, B. High-strain-rate tensile mechanical response of a polyurethane elastomeric material. Polymer 2015, 65, 72–80. [Google Scholar] [CrossRef]
- Ronold, K.O.; Echtermeyer, A.T. Estimation of fatigue curves for design of composite laminates. Compos. Part A Appl. Sci. Manuf. 1996, 27, 485–491. [Google Scholar] [CrossRef]


Publisher’s Note: MDPI stays neutral with regard to jurisdictional claims in published maps and institutional affiliations. |
© 2021 by the authors. Licensee MDPI, Basel, Switzerland. This article is an open access article distributed under the terms and conditions of the Creative Commons Attribution (CC BY) license (https://creativecommons.org/licenses/by/4.0/).