Abstract
A silicon oxycarbide-carbon nanotube coating on steel was synthesized using a novel approach utilizing unmodified carbon nanotubes (CNT), silane surfactant and large monomer-based silsesquioxane sol. This enabled the creation of very stable carbon nanotube dispersion, which in turn resulted in homogenous layers obtained in a simple dip-coating process. The samples were annealed in 800 °C in argon to obtain a uniform glassy silicon oxycarbide-based composite from a silsesquioxane precursor. The layers’ morphology and nanomechanical properties were investigated using a number of methods, including infrared spectroscopy (IR), X-ray diffraction (XRD), scanning electron microscopy (SEM), nanoindentation, Accelerated Property Mapping (XPM) and Quantitative Nanomechanical Mapping—an Atomic Force Microscopy method (QNM-AFM).
1. Introduction
Silicon oxycarbide is a very promising material, as it combines good mechanical properties [1,2] with thermal and chemical resistance [3,4]. These properties originate from its structure, where some oxygen atom pairs in amorphous silica bulk are replaced by a single carbon atom. Even though the bond between silicon and carbon atoms is weaker then between silicon and oxygen, the increased bond density enhances the material’s strength. In most cases of silicon oxycarbide-based materials, carbon can also be found in the form of a free carbon phase dispersed in the ceramic bulk. These can either be turbostratic carbon nanodomains or graphene-like sheets, depending on the preparation technique, mainly the annealing temperature [5]. This makes silicon oxycarbide well suited for being the bulk of the composites with carbon nanotubes (CNTs), as its composite structure enables easier integration of CNTs in the final material. Unfortunately, the creation of such a composite can be difficult due to synthesis routes of silicon oxycarbide. The two main synthesis procedures focus on different deposition methods, such as chemical vapor deposition and derivative techniques [6,7] or annealing of preceramic polymeric precursors in an oxygen-free atmosphere at at least 800 °C [8]. These precursors can be commercially available siloxanes [9,10], networked siloxanes [11,12] or silsesquioxanes obtained from various monomers via the sol–gel method [13,14,15]. The last method is especially interesting as it gives the best control over the initial silicon to carbon atom ratio, either in the form of various organic groups of siloxane monomers [16] or a mixture of monomers with different numbers of organic sidegroups per silicon atom [17]. Unfortunately, this method cannot be used with unmodified CNTs, as water and ethanol are needed for the polycondensation reaction. This can be mitigated by the use of modified CNTs, which also widens the range of deposition methods to include, e.g., electrophoretic deposition [18]. Alternative route of incorporating CNTs into the silicon oxycarbide matrix is freeze casting [19], which has the additional benefit of control over the material’s porosity, but is not suited for solid coating fabrication.
The addition of CNTs to silicon oxycarbide-based coating has a number of possible advantages. The most direct one is the possibility of enhancing material strength, as it was reported that even an addition of 1 wt.% of CNTs can increase it in other materials by up to five times [20]. The other reason to include carbon phases in general is enhanced conductivity, as it turns mostly non-conductive silicon oxycarbide into a conductor [21], which could increase its usefulness in electric devices such as batteries [22] or fuel cells [23]. As all these properties are highly dependent on CNTs’ dispersion in the material, it is of utmost importance to prevent CNTs’ aggregation [24]. Additionally, the main downside of CNT usage, i.e., their toxicity [25], can be mitigated by their incorporation into hard and resistant material with possible covalent bonds with the bulk.
In this work, a novel approach to producing a CNT-enhanced silicon oxicarbide-based coating is proposed. The method includes two vital aspects—the use of a surfactant and large monomers in order to produce stable dispersion of unmodified CNTs in the sol. The surfactant used was triethoxy-(2-phenylethyl)silane, as it not only serves as a surfactant in sol stage, but also eases the integration of carbon nanotubes in both the preceramic precursor and final composite. This can be achieved due to the phenyl group that bonds with unmodified CNTs by π–π interactions and the silane part that first acts as a weakly hydrophilic part, but in the process of polycondensation, bonds with the preceramic matrix with strong Si–O–Si bridges. The ethyl linker enables the perfect conformation of both parts, as our investigation has showed that this effect cannot be achieved using simple triethoxyphenylsilane. The bonds created by the surfactant in the early stages are of types that are preserved throughout the whole preparation process, including annealing. In order to stabilize the dispersion, large monomers, i.e., 1,3,5,7-tetraethoxy-1,3,5,7-tetramethylcyclotetrasiloxane (T4) obtained from 1,3,5,7-tetramethylcyclotetrasiloxane (D4H), were used. Previous experiments have shown that these monomers have a greater tendency to occlude solvents in the polycondensation process due to their rigid structure and larger size of oligomers [26]. This effect enabled the dispersion of CNTs in sol, in which they showed no aggregation a few hours after dispersion preparation and minimal aggregation after one week, while in the case of a simpler monomer—triethoxymethylsilane—notable aggregation was observed after a few minutes.
2. Materials and Methods
The preparation method of 1,3,5,7-tetraethoxy-1,3,5,7-tetramethylcyclotetrasiloxane (T4)-based sol can be found in a previous article [26]. In general, commercially available 1,3,5,7-tetramethylcyclotetrasiloxane (D4H) (95%, ABCR) underwent reactions with ethanol (99.8%, P.A., POCH) in the presence of a palladium catalyst (5% Pd on activated charcoal, Sigma Aldrich, St. Louis, MO, USA), which was subsequently filtered using Teflon syringe filters (SIMAX, Porąbka, Poland) with a pore size of 250 nm. The sol was prepared by the addition of twice distilled water with hydrochloric acid (37%, P., Avantor Performance Materials Poland S.A., Gliwice, Poland), added to obtain pH 4.5, mixed with ethanol. The molar amount of water and ethanol was twice the amount of silicon atoms in each monomer. Due to the relatively small number of hydrophilic groups on every monomer, tetrahydrofuran (P.A., Avantor Performance Materials Poland S.A., Gliwice, Poland), with a volume equal to the sum the other reagents’ volumes, was added to prevent phase separation. The mixture was stirred for 24 h to obtain sol. The process was performed in a closed flask filled with argon equipped with a washing bottle filled with silicon oil to maintain a constant pressure.
To obtain the surfactant, a reaction of styrene with triethoxysilane in the presence of Karstedt catalyst was performed. First, styrene (99%, Sigma-Aldrich, St. Louis, MO, USA) was dried using anhydrous magnesium sulfate (99.5%, Sigma-Aldrich, St. Louis, MO, USA) for 6 days and subsequently distilled in vacuo after the addition of calcium hydride (95%, Sigma-Aldrich, St. Louis, MO, USA). The purity of styrene and lack of oligomers was confirmed using GC. Then, 5 mL of triethoxysilane (97%, Sigma-Aldrich, St. Louis, MO, USA) were added to 3.12 mL of purified styrene dropwise in argon atmosphere. After 5 min of stirring 3 μL of catalyst (Pt ~2%, Sigma-Aldrich, St. Louis, MO, USA) was added. As after 5 days the reaction progress was not complete, an additional 6 μL of catalyst were added and the temperature of the reaction was raised to 60 °C. After 24 h, GC showed no peaks originating from the presence of substrates. The product was distilled in vacuo and 5.03 g of surfactant was obtained. The GC showed 2 products, with the second product being triethoxy(phenylmethylmetyl)silane, which is a typical by-product of this reaction. As the linker between phenyl and silane groups is also present in this product, the surfactants were not separated.
Preliminary research has shown that the most stable dispersion of CNTs (multiwall carbon nanotubes with a diameter over 50 nm and a length of 10–20 μm, NanoAmor, Houston, TX, USA) can be obtained using 2 μL of surfactant per 2 mg of CNTs per 1 mL of ethanol. The mixture was sonicated for 2 min, then added dropwise to sol to obtain a 1 wt.% addition of CNTs in gel. To prepare the dispersion, the mixture was sonicated for 15 min. It should be noted that longer sonication promotes agglomeration of CNTs. The large amount of surfactant needed originates from the large surface area of carbon nanotubes. The coatings were prepared on type 316L stainless steel sheets via the dip-coating method. The sheets were cleaned by polishing, sonicated for 15 min in acetone, sonicated for 15 min in ethanol, immersed in aqua regia for 30 s and then rinsed thoroughly with twice distilled water. The dip-coating process was conducted in a glovebox to keep humidity at 34% throughout all experiments. Every deposition step consisted of immersing the sample in sol for 60 s, with immersion speed of 15 cm/min, after which the sample was left for 20 min to dry and form the initial gel. The samples containing two (SC-2) and five (SC-5) deposited layers, as well as reference samples with same number of layers (Ref-2 and Ref-5, respectively) but without the addition of CNT/surfactant, were prepared. The specimens were dried at 70 °C for 2 weeks, then were annealed in a tube furnace in argon atmosphere. The annealing steps were: 2 h at 70 °C, 4 h at 120 °C, 4 h at 200 °C and finally 30 min at 800 °C. The heating speed was 10 °C/minute and this time was not included in the abovementioned steps. After the last step, the furnace was cooled passively to room temperature. At 200 °C, the flow of argon was cut.
The XRD experiment was conducted using an X’Pert Pro MD X-ray diffractometer (Malvern Panalytical Ltd, Malvern, UK). It employed a Cu Kα x-ray lines with the Bragg–Brentano standard setup with a Ge(111) Johansson monochromator at the incidence beam. The scanning range was 5°–90° with a 0.008° step size. The measurements were performed at room temperature.
The MIR experiment was performed using a Vertex 70V (Bruker, Billerica, MA, USA) spectrometer equipped with a Harrick Scientific “Seagull” Variable Angle Reflection Attachment. The measurements were performed in vacuum with a measurement range of 4000–400 cm−1, a 4 cm−1 resolution and accumulation of 128 scans, giving the final spectra.
The SEM images were collected using a Nova Nano SEM 200 (FEI, Hillsboro, OR, USA) equipped with a field emission gun (Schotky FEG-emitter) and EDS analyzer (EDAX, Mahwah, NJ, USA). Due to the carbon content, the layers were not covered with an additional conductive layer. The samples of sections were first cut with a high-energy laser, embedded in epoxy resin and polished. Due to delamination and breaking of layers, the last steps of polishing with sub-micrometer diameter powders had to be omitted.
The nanoindentation experiment was performed using a G200 nanoindenter (Agilent, Santa Clara, CA, USA) equipped with a calibrated Vickers indenter (Synton MDP, Nidau, Switzerland). The measurements were conducted in stiffness continuous mode with a maximum pressure of 1 g. Ten measurements in random places were performed for each sample.
The nanoindentation mapping was performed using a TI 980 TriboIndenter (Bruker, Billerica, MA, USA) equipped with a diamond Berkovich probe with tip area function calibrated on a fused quartz sample. The measurements were conducted in Accelerated Property Mapping (XPM) mode.
The atomic force microscopy imaging and mechanical property investigation were conducted using a MultiMode VIII (Bruker, Billerica, MA, USA) microscope in quantitative nanomechanical investigation mode (PeakForce Tapping mode derivative) using silicon probes with a nominal tip radius of 8 nm and spring constant of 200 N/m. The absolute calibration method was used.
A simple conductivity experiment was performed using a custom setup with two electrodes 1 cm apart mounted in a holder that ensured the same pressure force for every measurement. The electrodes were attached to a BM811 (Brymen, New Taipei City, Taiwan) multimeter with ohmmeter function. Ten measurements in random places chosen blindly were performed for each sample.
3. Results and Discussion
3.1. Structure Characterization
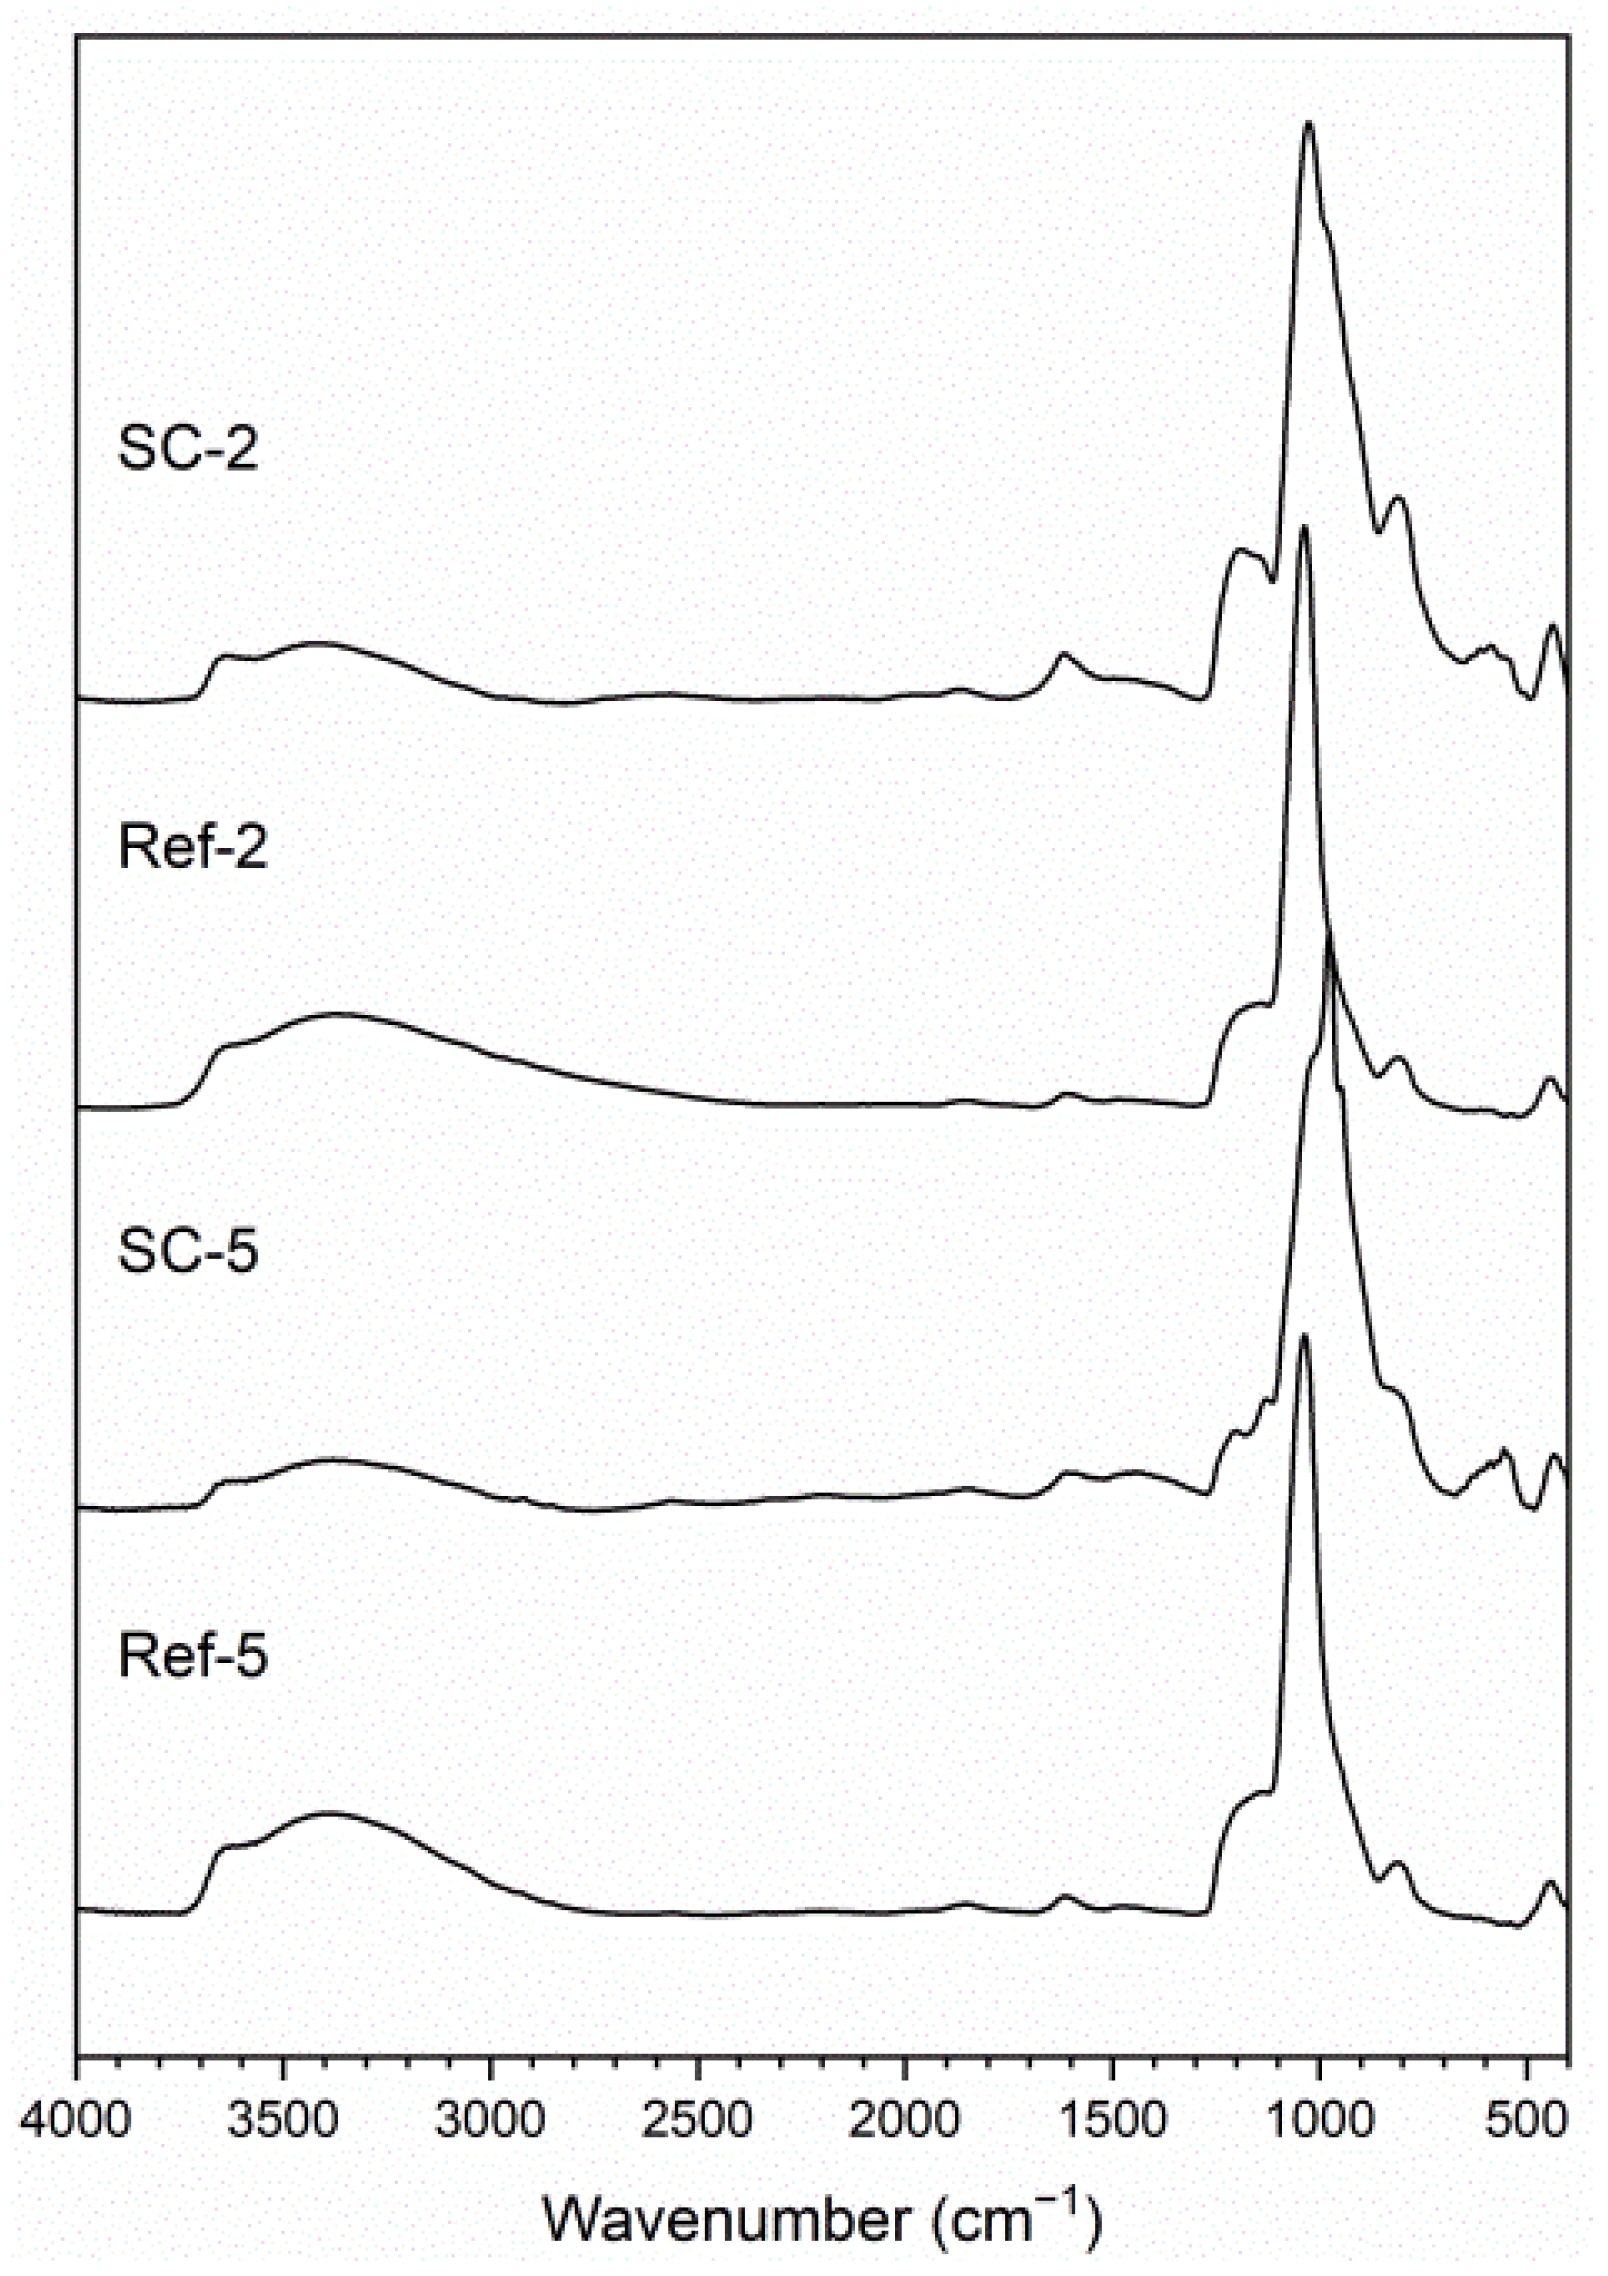
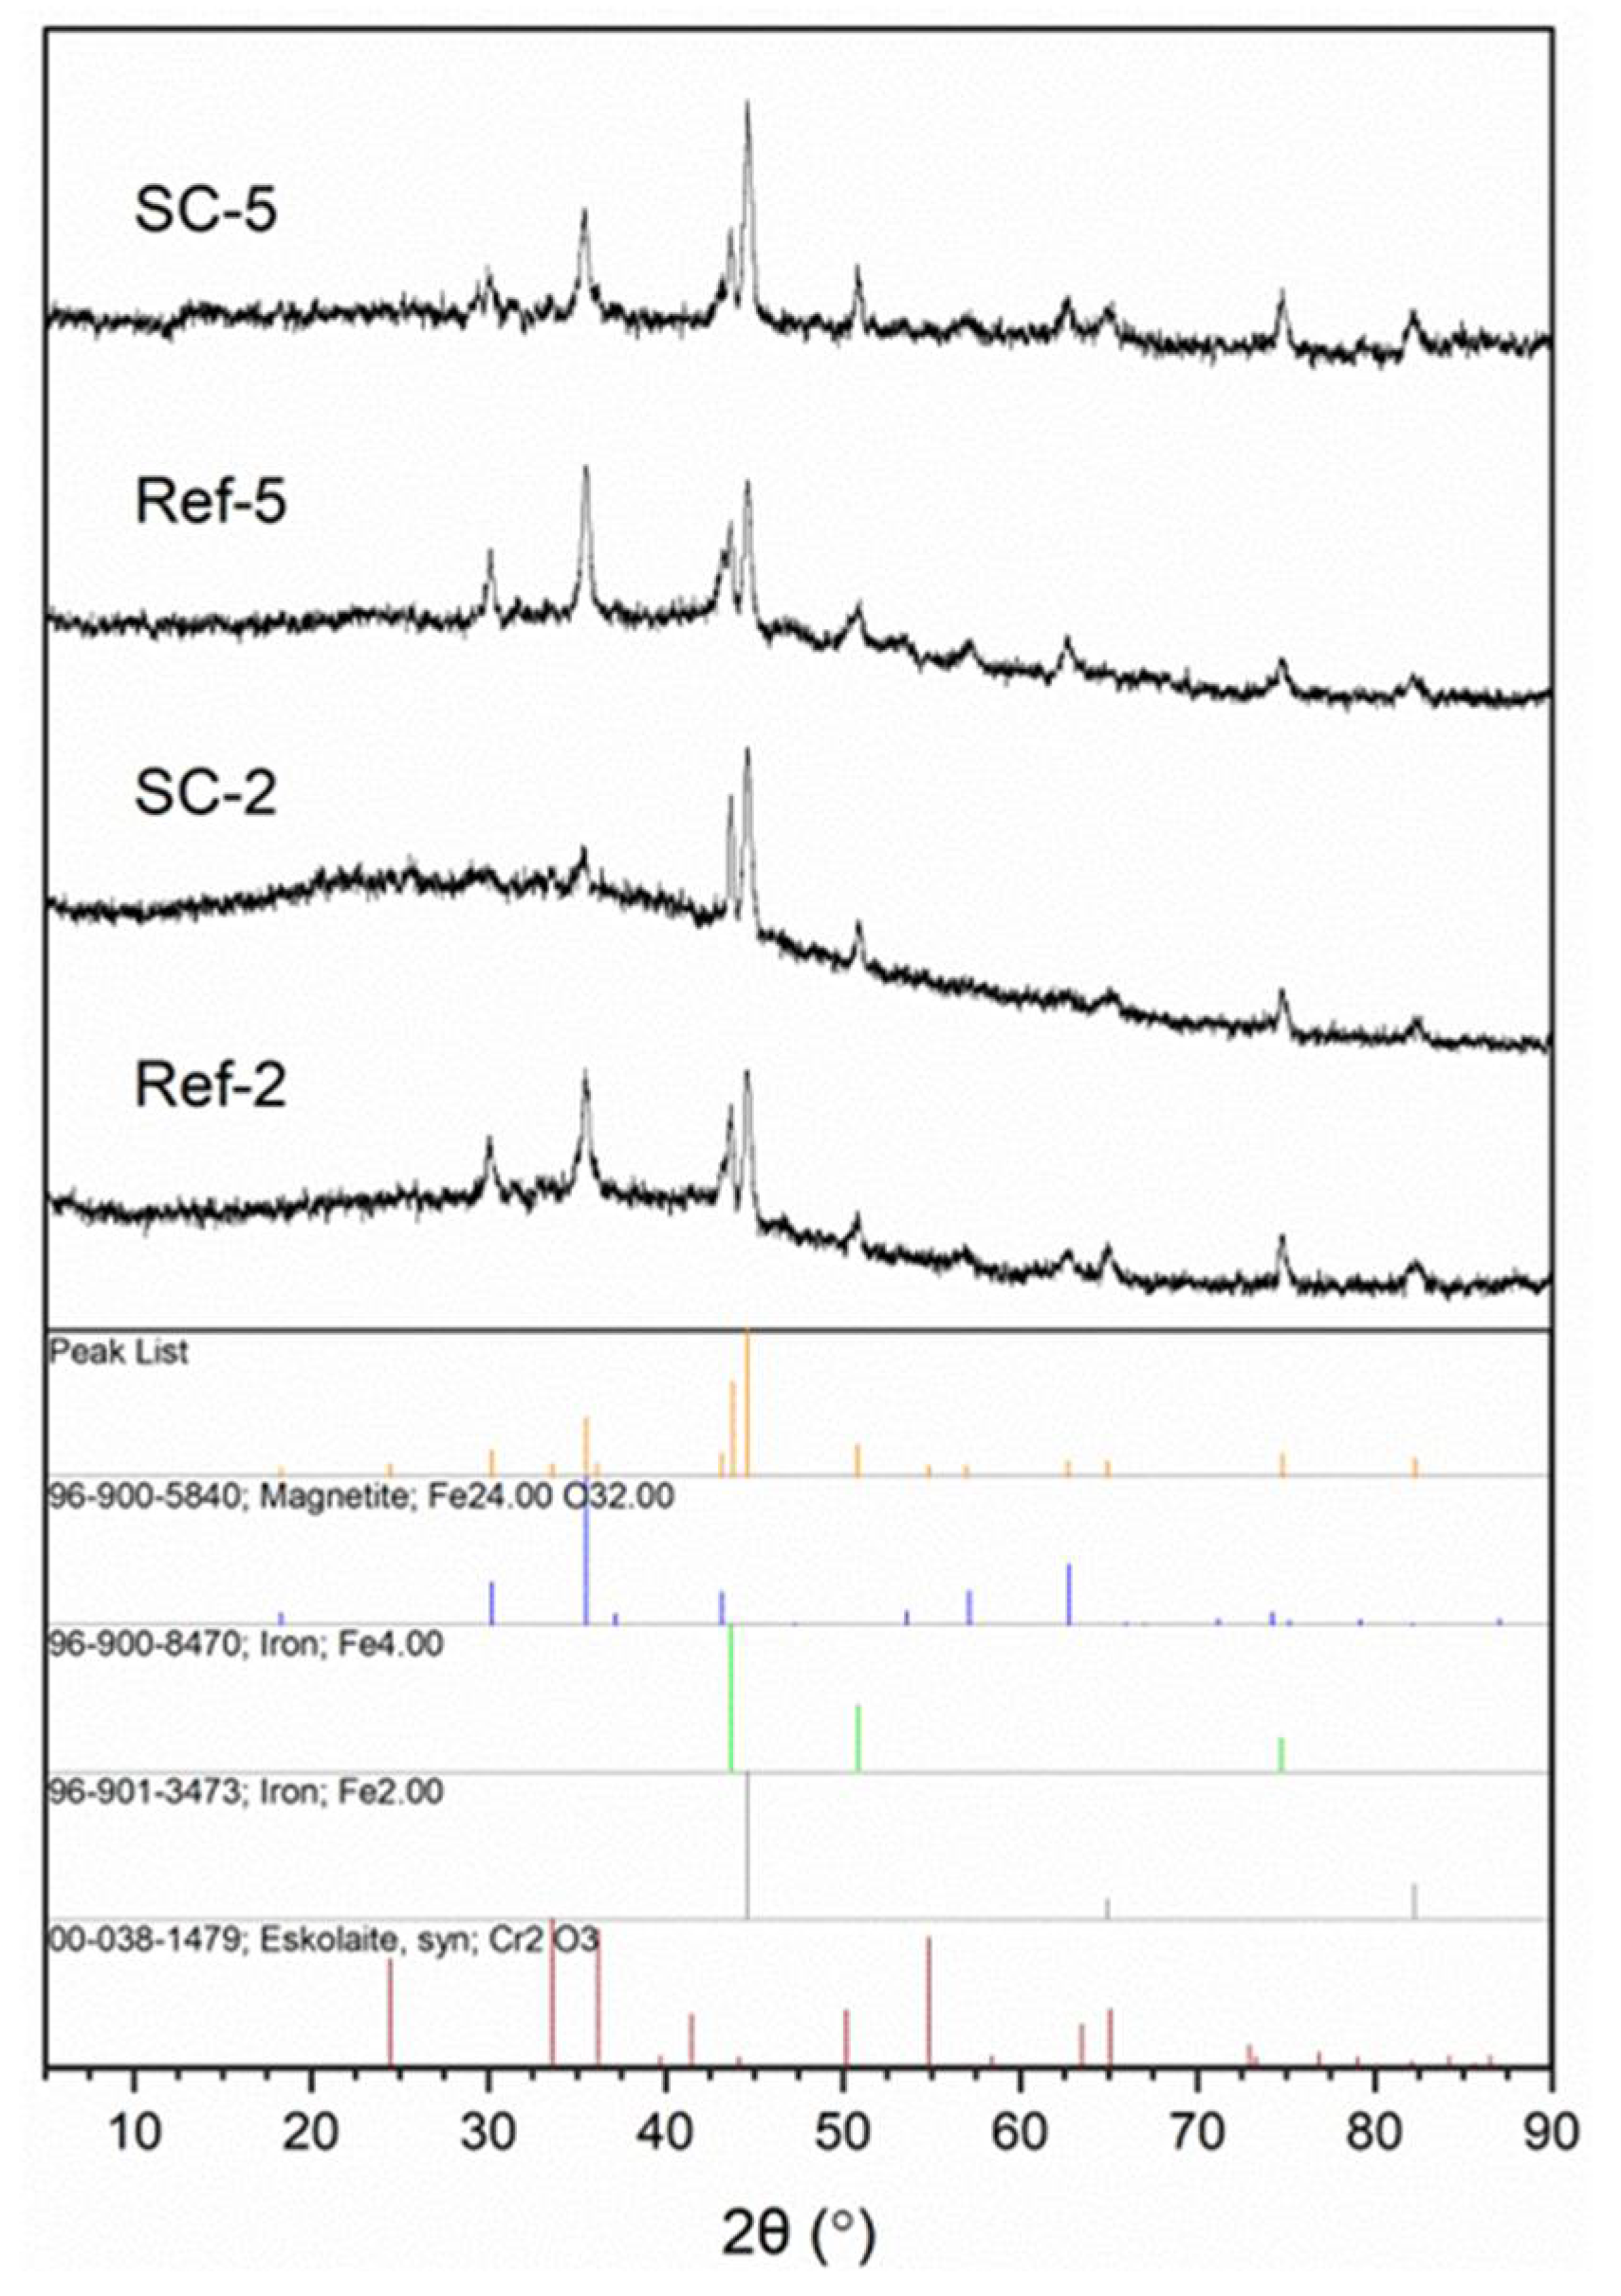
The structure of obtained layers was investigated using IR (Figure 1) and XRD (Figure 2) analysis. The IR spectra contain broad peaks, which are a typical profile of glass. The most notable vibrations visible on the spectra are typical for silicon oxycarbide, carbon nanotubes and corroded steel substrate. Information on most bands including their range and bibliography source attribution can be found in our previous article [26]. Starting from higher wavenumbers, the bands can be attributed to Si–OH stretching vibrations (~3650 cm−1) and O–H stretching vibrations (3000–3550 cm−1). The C–H stretching vibration bands are visible around 3000 cm−1. The peak, visible in the case of CNT composite coating spectra, below that value can be correlated with C–H stretching vibrations of hydrogen atoms bonded to carbon atoms with sp2 hybridization, which can be present on the surface of damaged CNTs. A barely visibly band at about 2150 cm−1 can be attributed to Si–H stretching vibrations. The peak at about 1610 cm−1 is correlated with C=C stretching vibrations and is more prominent in composite samples than the reference. The bands between 800 and 1250 cm−1 can be attributed to numerous groups found in materials, including Si–O–Si bridges (1000–1225 cm−1) and Si–O− stretching (1000–1070 cm−1) vibrations and non-bridging Si–O stretching (940–980 cm−1), as well as C–C (~940 cm−1) and Si–C (825–845 cm−1) stretching vibrations. This region also includes stretching vibrations of iron oxides (850–1250 cm−1) [27] as well as C=C bending vibrations (~950 cm−1) [28]. The peaks found in CNT composite spectra between 500 and 650 cm−1 can be correlated with C=C bending vibrations in carbon nanotubes [28]. Lastly, bands at 455–470 cm−1 can be attributed to O-Si-O bending vibrations. This confirms the structure of obtained composites as being CNT-modified silicon oxycarbide, as the differences in spectra at about 1610 and 950 cm−1 and in the 500–650 cm−1 range can all be attributed to the presence of CNTs. The further proof of the glassy structure of obtained layers comes from XRD analysis (Figure 2), as a halo typical for such systems is visible in all samples. The difference in halo intensity is most probably caused by different amounts of material found on the surface originating from layer thickness, delamination or both. The peaks can be attributed to iron, magnetite and eskolaite and can be correlated with stainless steel substrate.
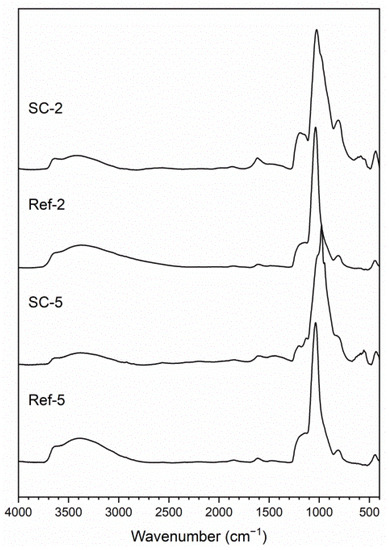
Figure 1.
IR analysis of obtained layers. (SC-2: CNT-enhanced silicon oxycarbide, 2 cycles of sol deposition; Ref-2: unmodified silicon oxycarbide, 2 cycles of sol deposition; SC-5: CNT-enhanced silicon oxycarbide, 5 cycles of sol deposition; Ref-5: unmodified silicon oxycarbide, 5 cycles of sol deposition).
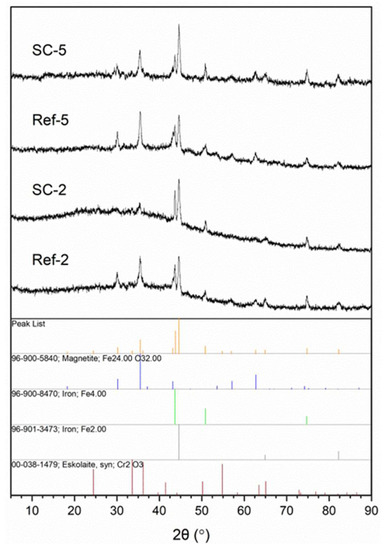
Figure 2.
XRD analysis of obtained layers (SC-2: CNT-enhanced silicon oxycarbide, 2 cycles of sol deposition; Ref-2: unmodified silicon oxycarbide, 2 cycles of sol deposition; SC-5: CNT-enhanced silicon oxycarbide, 5 cycles of sol deposition; Ref-5: unmodified silicon oxycarbide, 5 cycles of sol deposition) with peak assignment.
3.2. Coating Morphology and Thickness
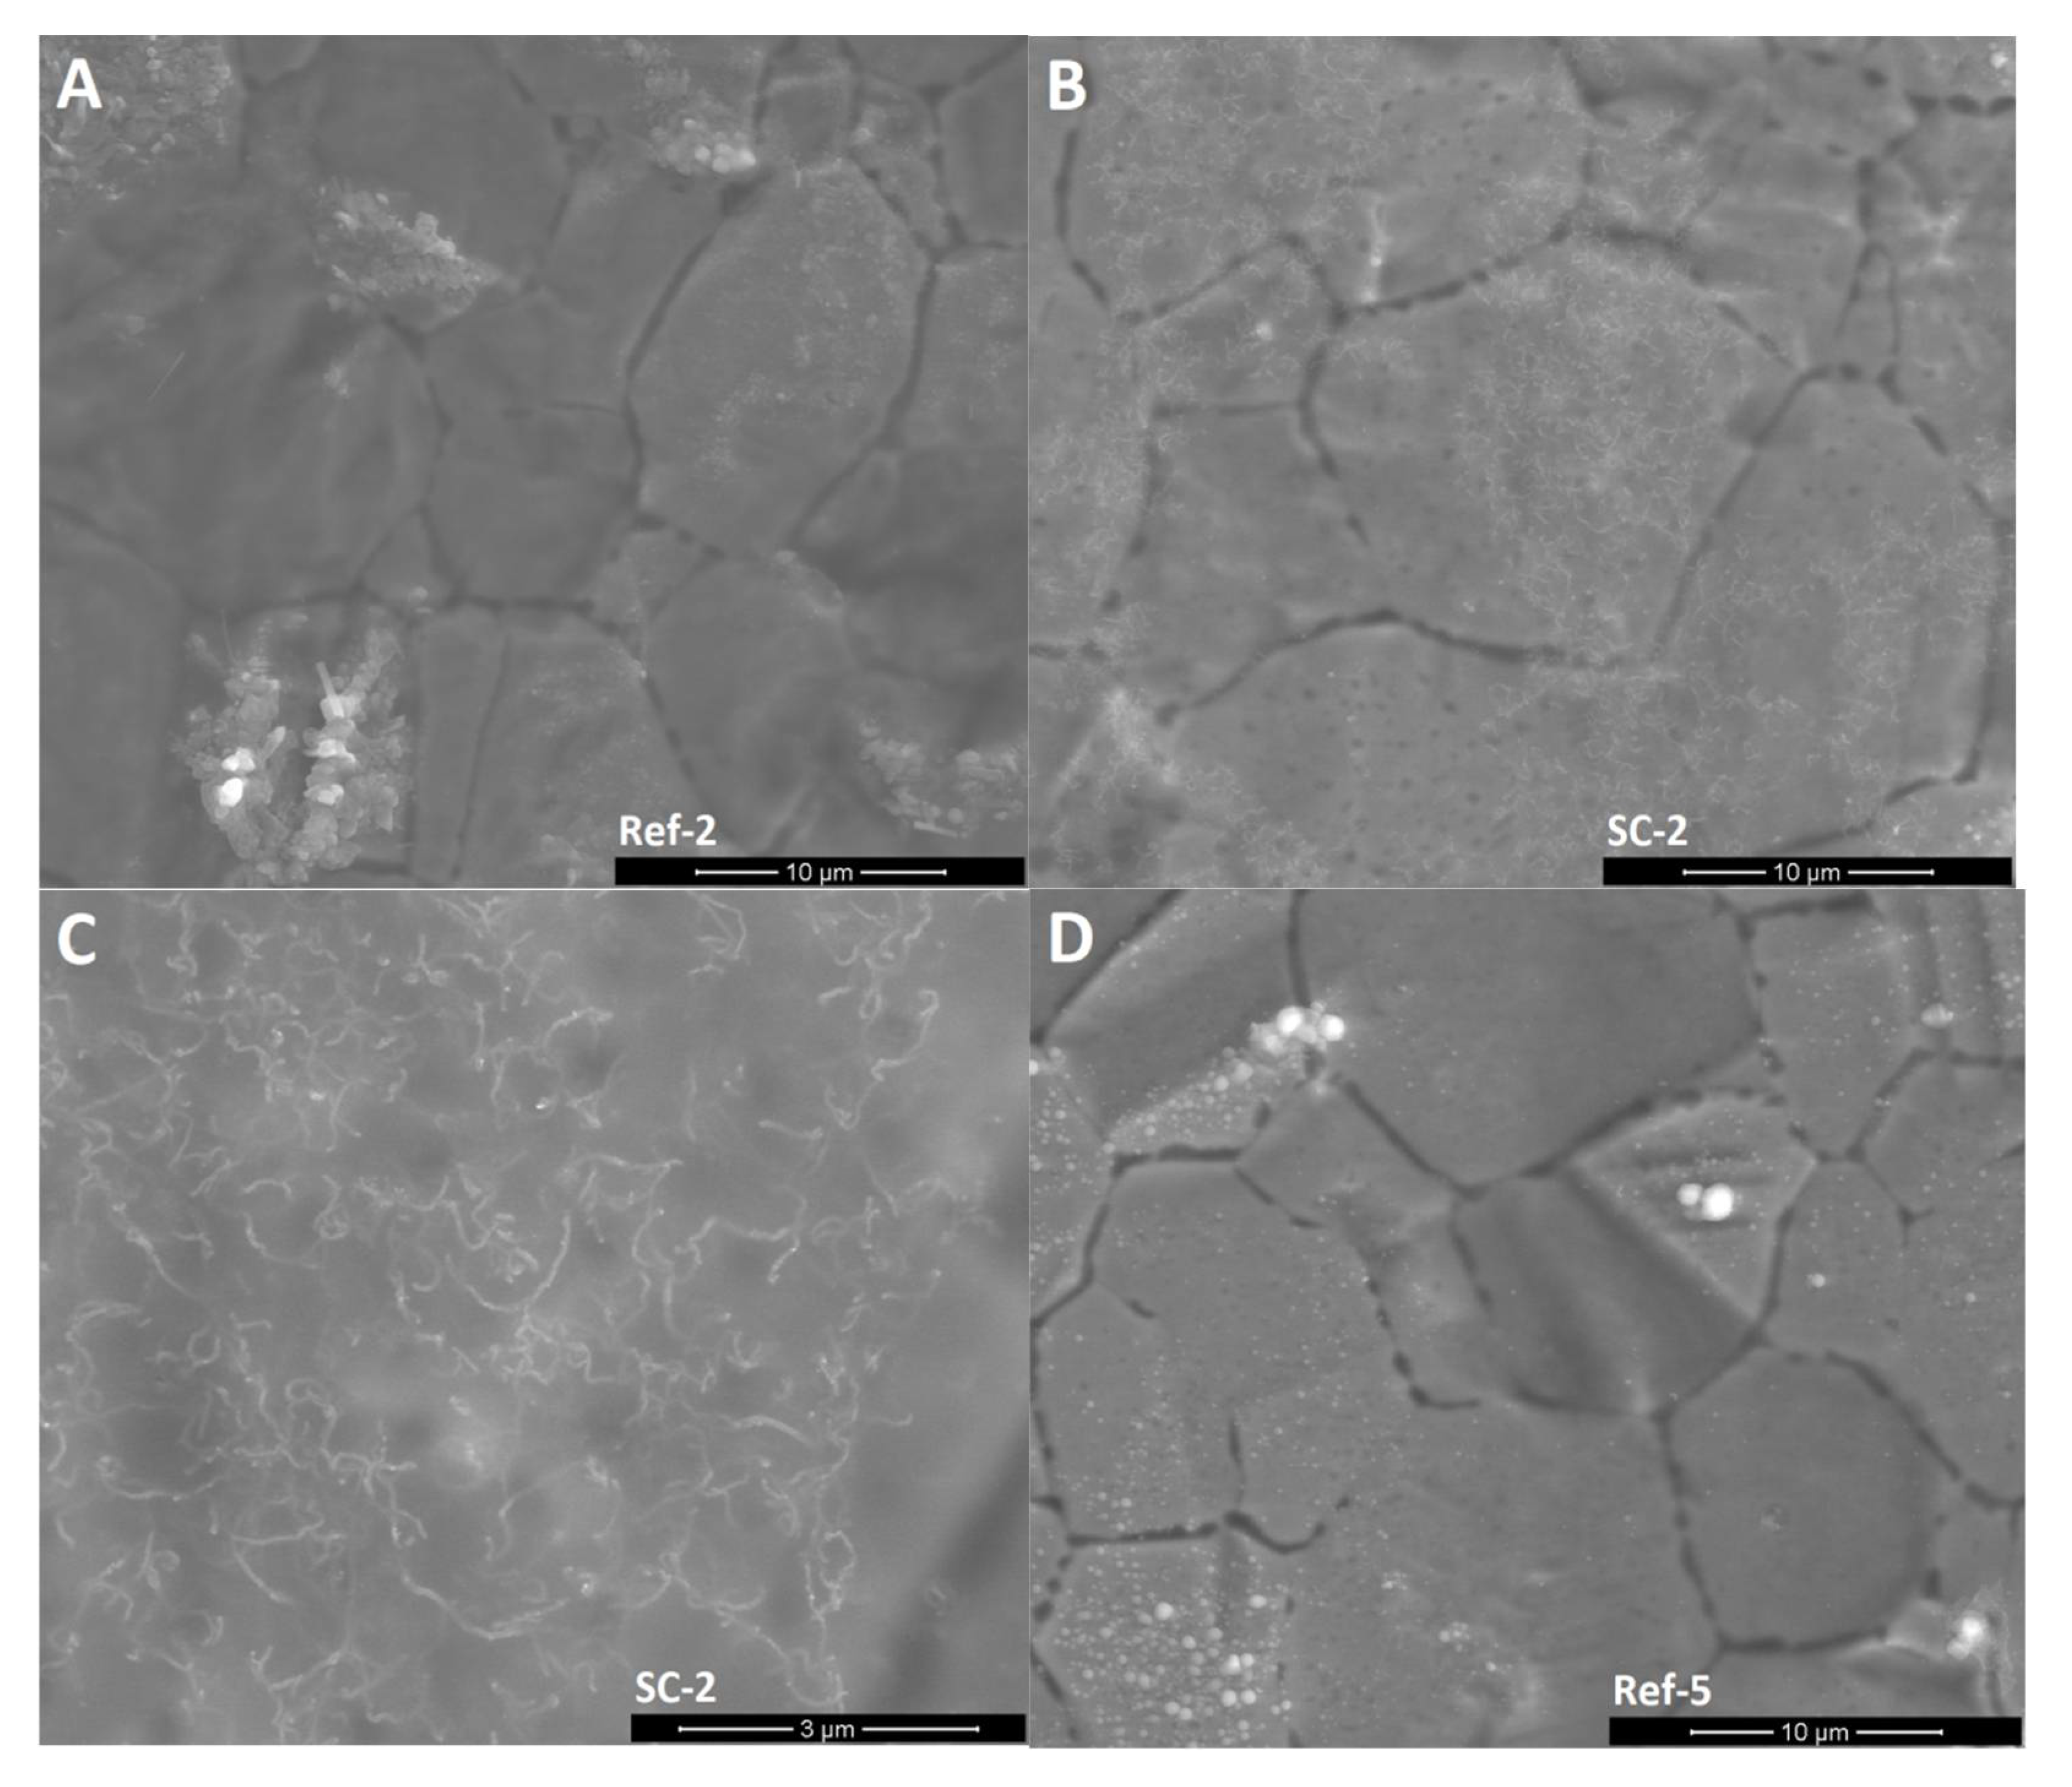
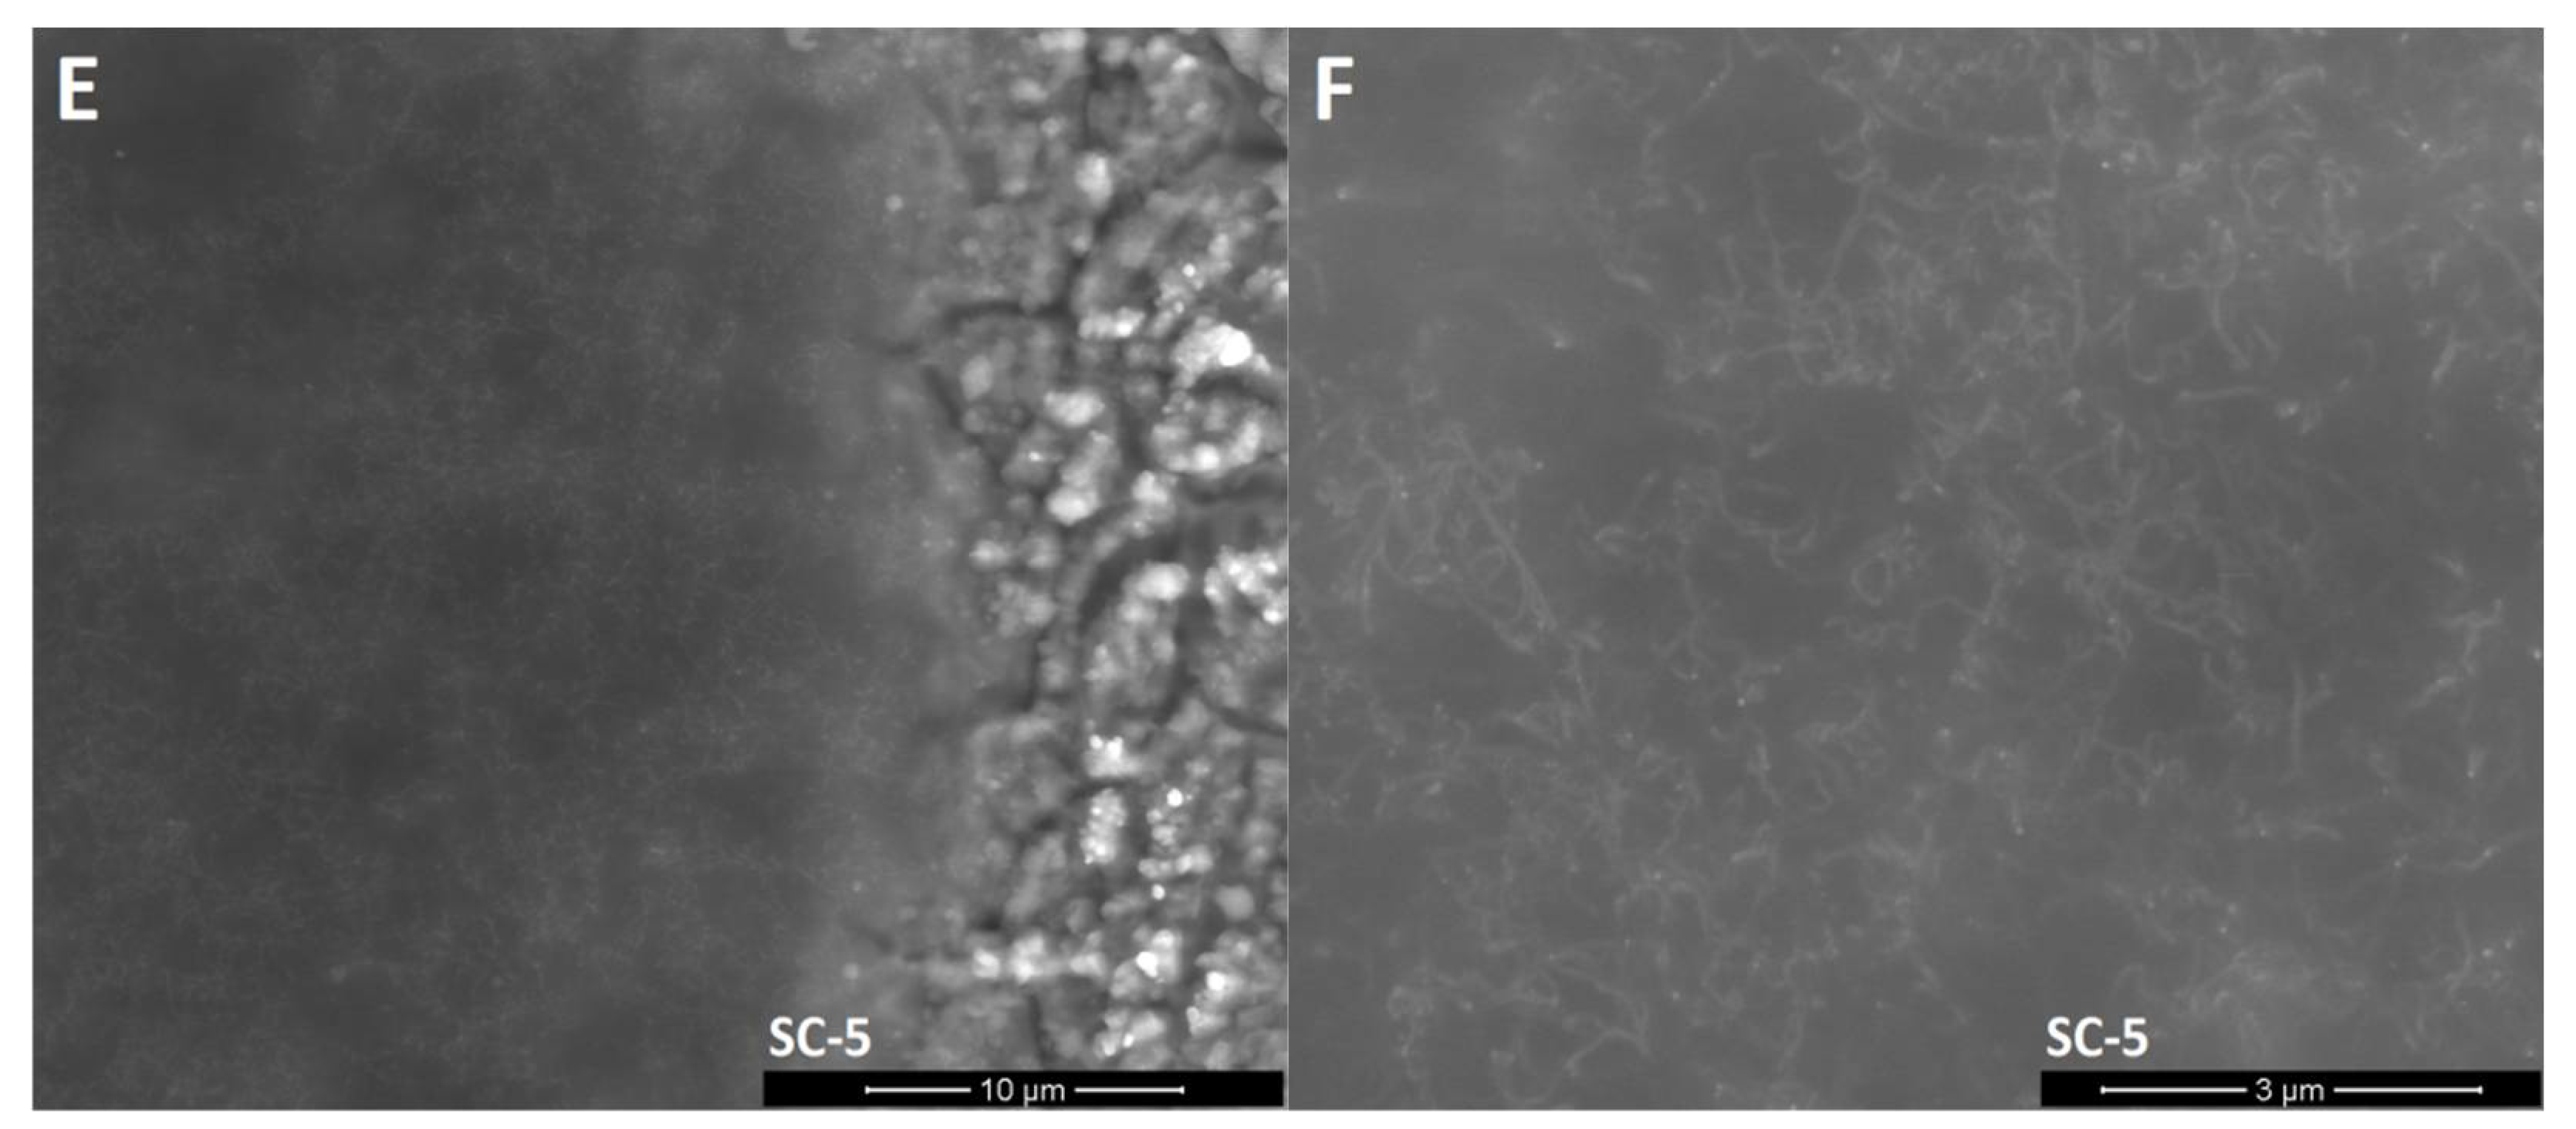
SEM images (Figure 3) show that unmodified silicon oxycarbide covers the steel substrate with a thin layer that enables the recognition of the steel grain structure. EDS analysis (Table 1) showed that clusters on the surface are products of steel oxidation, as proportionally larger amounts of chromium and oxygen atoms can be found in the measurement volume. Oxidation may occur in the annealing process due to trace amounts of oxygen and cracking of the coating due to layer shrinkage. This is supported by the abovementioned XRD experiment, where the existence of oxide was confirmed. Small cracks in the silsesquioxane coating are created by layer shrinkage. The CNT-modified layers created in two deposition cycles (SC-2) have a similar morphology with two distinct differences: there are carbon nanotube-like structures visible on the surface of the coating and much fewer oxide formations can be observed on the surface. The magnified image shows that these structures are distributed quite evenly on the surface. Their shape is similar to the CNTs used, with distortions that can be found on unprocessed material as well as caused by annealing processing, which can further deteriorate of CNTs. Moreover, phase separation in silicon oxycarbide can result in carbon diffusion onto the CNT surface, thus creating patches of incomplete additional walls. On the other hand, the CNT-modified sample created in five deposition cycles shows thick layers that lack a substrate structure, yet it does not cover the whole sample. The magnified image shows a similar good CNT-like structure distribution, with only slight aggregation occurring, as well as similar structure morphology. Delamination can be caused by layer thickness, which is typical for silicon oxycarbide-based coatings [3].
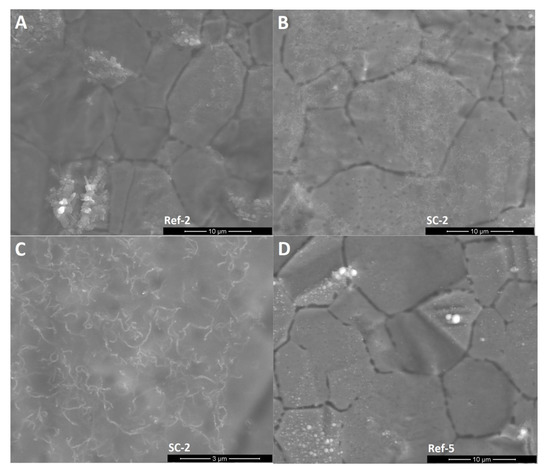

Figure 3.
SEM images of the surface of obtained layers. (A): CNT enhanced silicon oxycarbide, 2 cycles of sol deposition (SC-2), 5000× magnification; (B): unmodified silicon oxycarbide, 2 cycles of sol deposition (Ref-2), 5000× magnification; (C): CNT enhanced silicon oxycarbide, 5 cycles of sol deposition (SC-5), 5000× magnification; (D): unmodified silicon oxycarbide, 5 cycles of sol deposition (Ref-5), 5000× magnification; (E): CNT enhanced silicon oxycarbide, 2 cycles of sol deposition (SC-2), 20,000× magnification; (F): CNT enhanced silicon oxycarbide, 5 cycles of sol deposition (SC-5), 20,000× magnification.

Table 1.
Summary of EDS measurement results of atomic content of SC-2, Ref-2, SC-5, Ref-5 samples, crystallites on Ref-2 sample surface (Ref-2-crystallite) and material above SC-2 sample layer in section image (SC-2-above layer). Mean results include information about layer, substrate (due to layer thickness) and oxidation products, depending on samples. Ref-2-crystallite and SC-2-above layer are point measurements, yet, due to scanned volume size, include information about surrounding material. In the case of SC-2-above layer, other atoms than the ones listed are not shown.
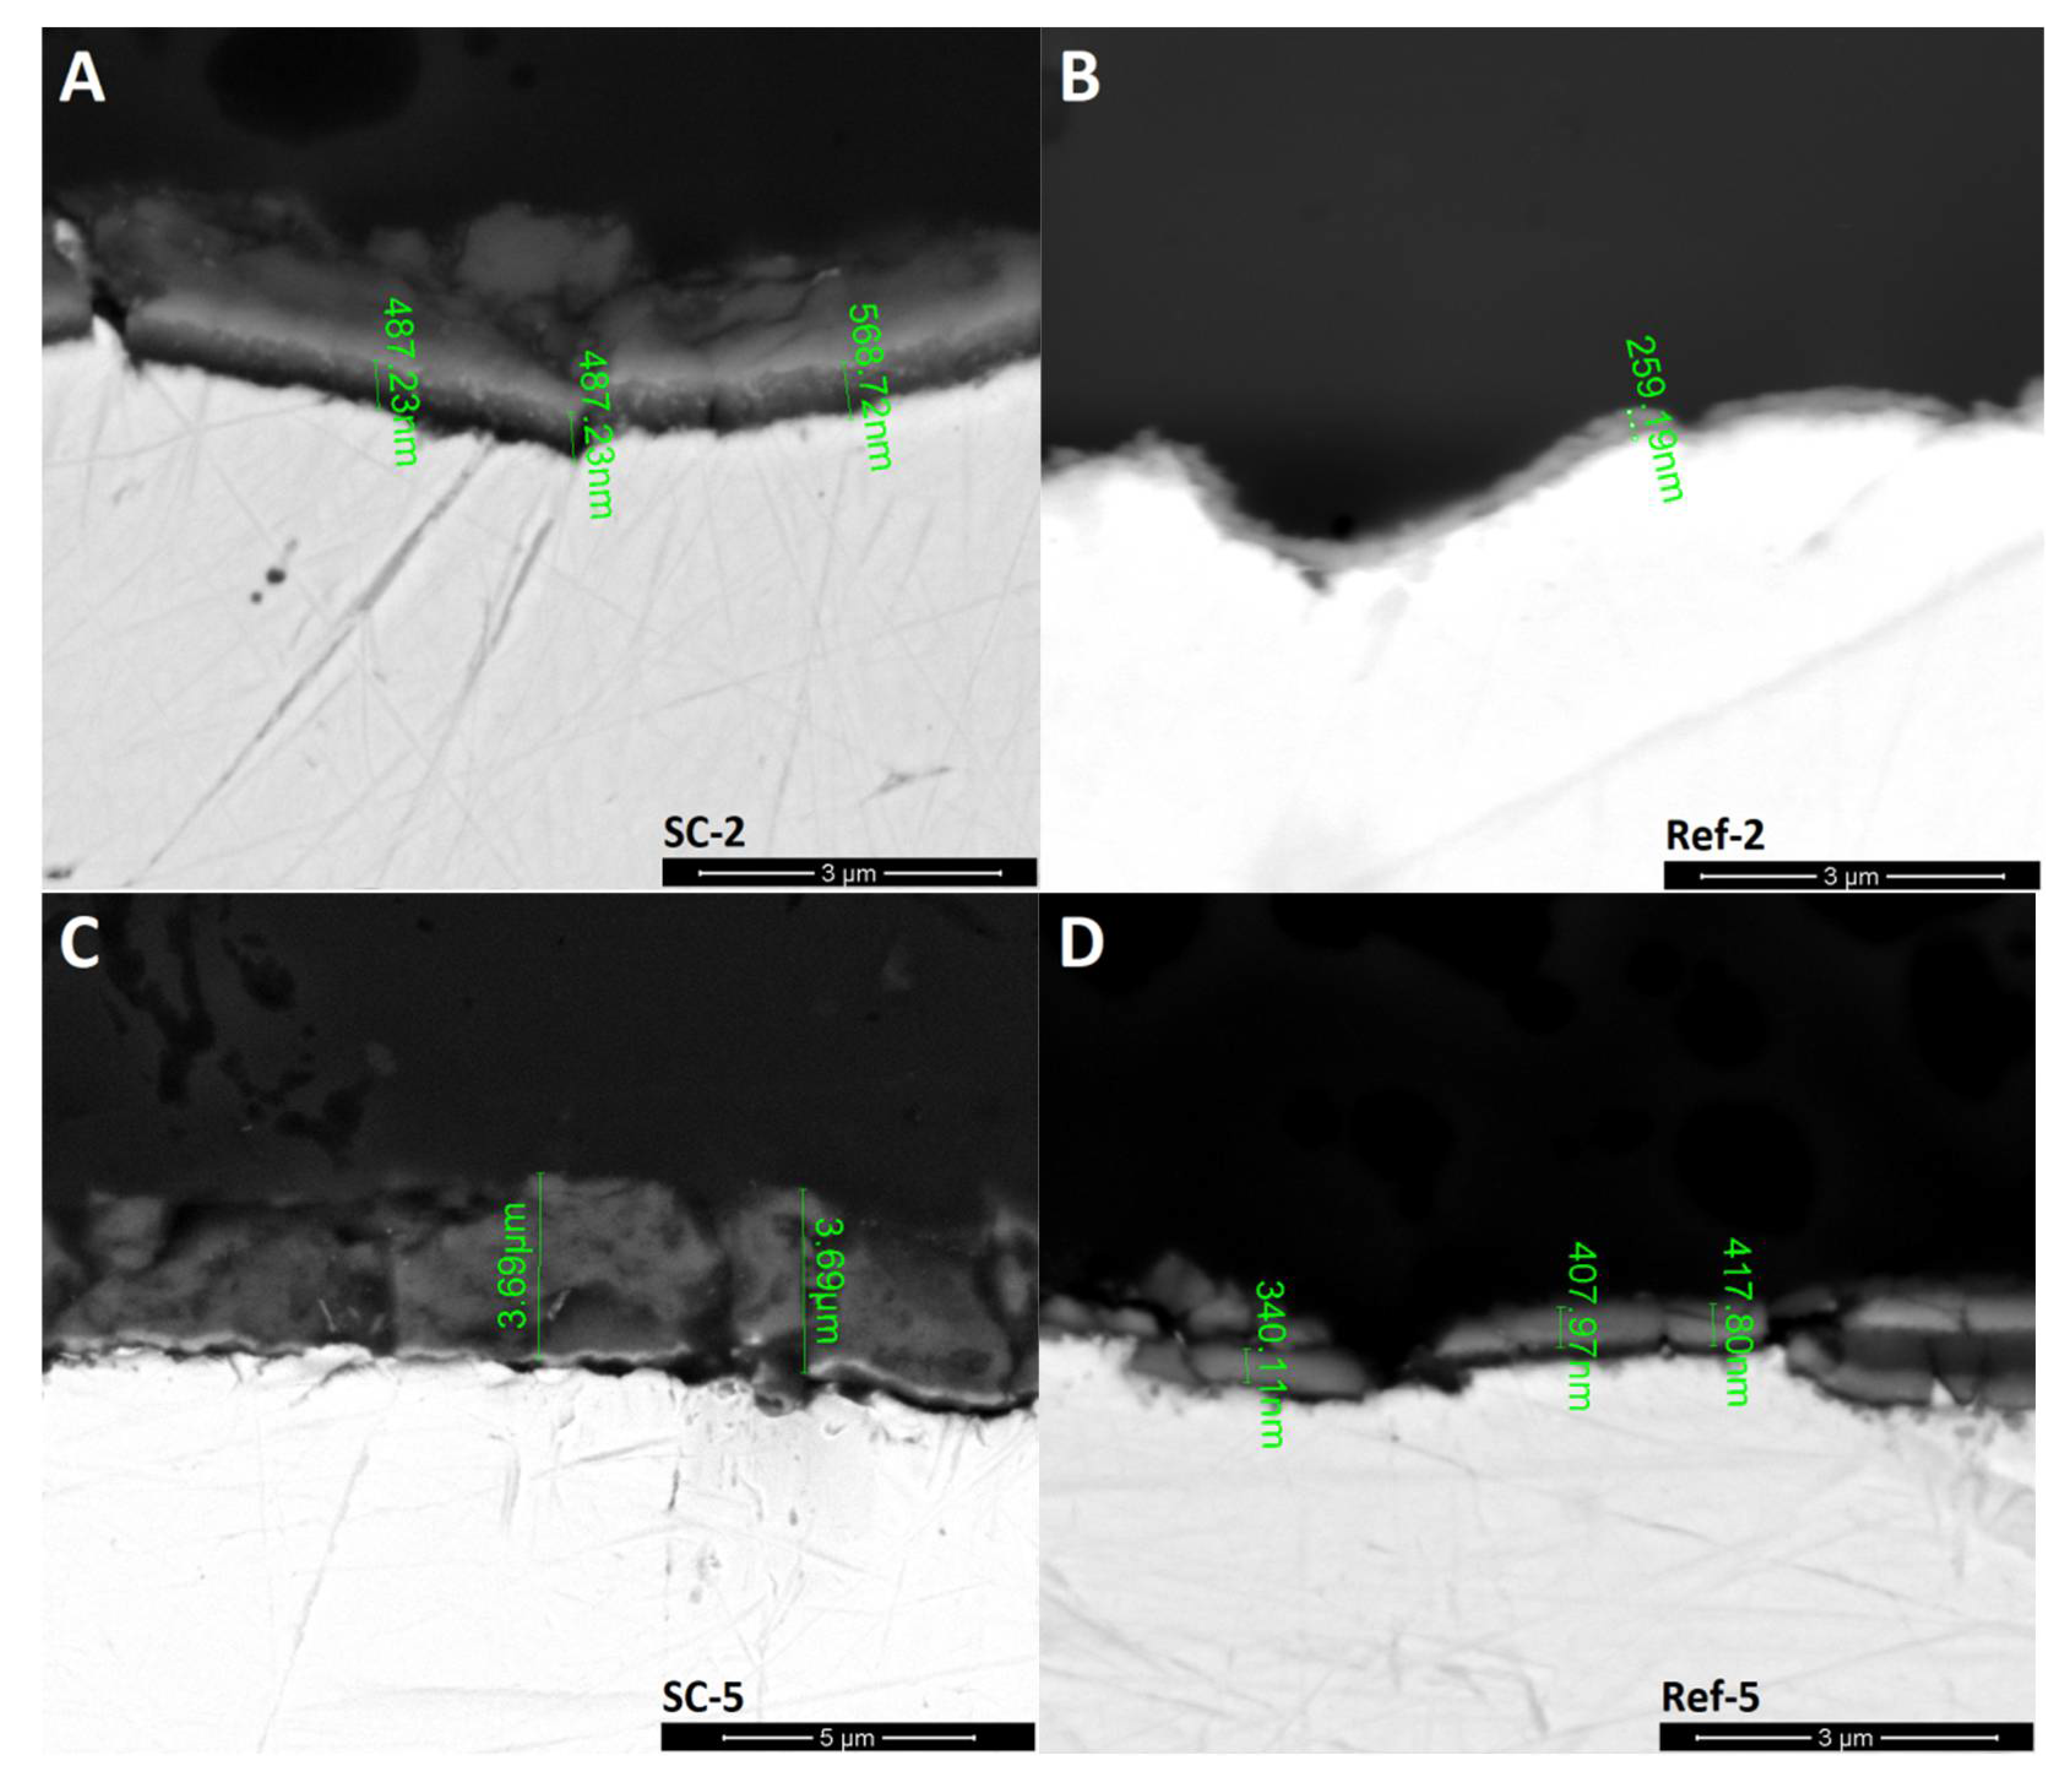
The SEM section images (Figure 4) are in line with previous experiments. The reference silicon oxycarbide layers show low thickness of about 250 nm for coating deposited in two cycles and about 400 nm for five-cycle deposition. The thicker layer also exhibits a greater number of cracks. The CNT–silicon oxycarbide composite coating, on the other hand, has a greater thickness of about 500 nm in the case of the one created in two deposition cycles and up to 3.69 μm in the case of five deposition cycles. Additionally, CNT-modified coating has fewer cracks, although a thicker layer is not present on the whole surface of the steel substrate. The area above the SC-2 layer is damaged resin, which was proved by EDS (Table 1). This explains the differences in halo intensity in the XRD experiment, which mainly correlates with layer thickness. In the case of samples Ref-5 and, especially, SC-5, large areas without coating are the reason for lower halo intensity.
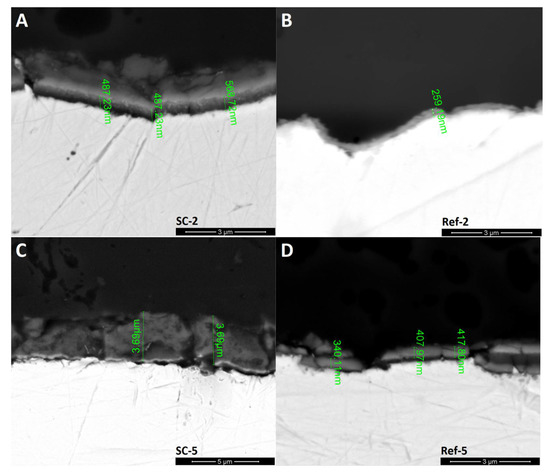
Figure 4.
SEM images of coating sections with layer thickness. (A): CNT enhanced silicon oxycarbide, 2 cycles of sol deposition (SC-2); (B): unmodified silicon oxycarbide, 2 cycles of sol deposition (Ref-2); (C): CNT enhanced silicon oxycarbide, 5 cycles of sol deposition (SC-5); (D): unmodified silicon oxycarbide, 5 cycles of sol deposition (Ref-5).
3.3. Mechanical Properties
The nanoindentation experiment showed a decrease in both Young’s modulus and hardness after the addition of CNTs. In the case of layers deposited in two cycles, the reference sample Young’s modulus and hardness were 119 ± 42 and 3.47 ± 0.76 GPa, respectively, while in the case of the CNT-modified sample, the values were 69 ± 21 and 2.6 ± 1.2 GPa, respectively. Even greater differences were observed for samples deposited in five cycles as the reference sample Young’s modulus and hardness values were 75.4 ± 4.6 and 2.56 ± 0.27 GPa, respectively, compared to 41 ± 10 and 1.56 ± 0.80 GPa for the CNT-modified sample. Previous values for the latter samples are warped by the blind measurement spot determination, as there was a high probability of uncoated steel substrate being measured. As values measured for the CS-5 sample were natively divided into two groups, the more probable results are about 65.5 and 3.5 GPa, respectively.
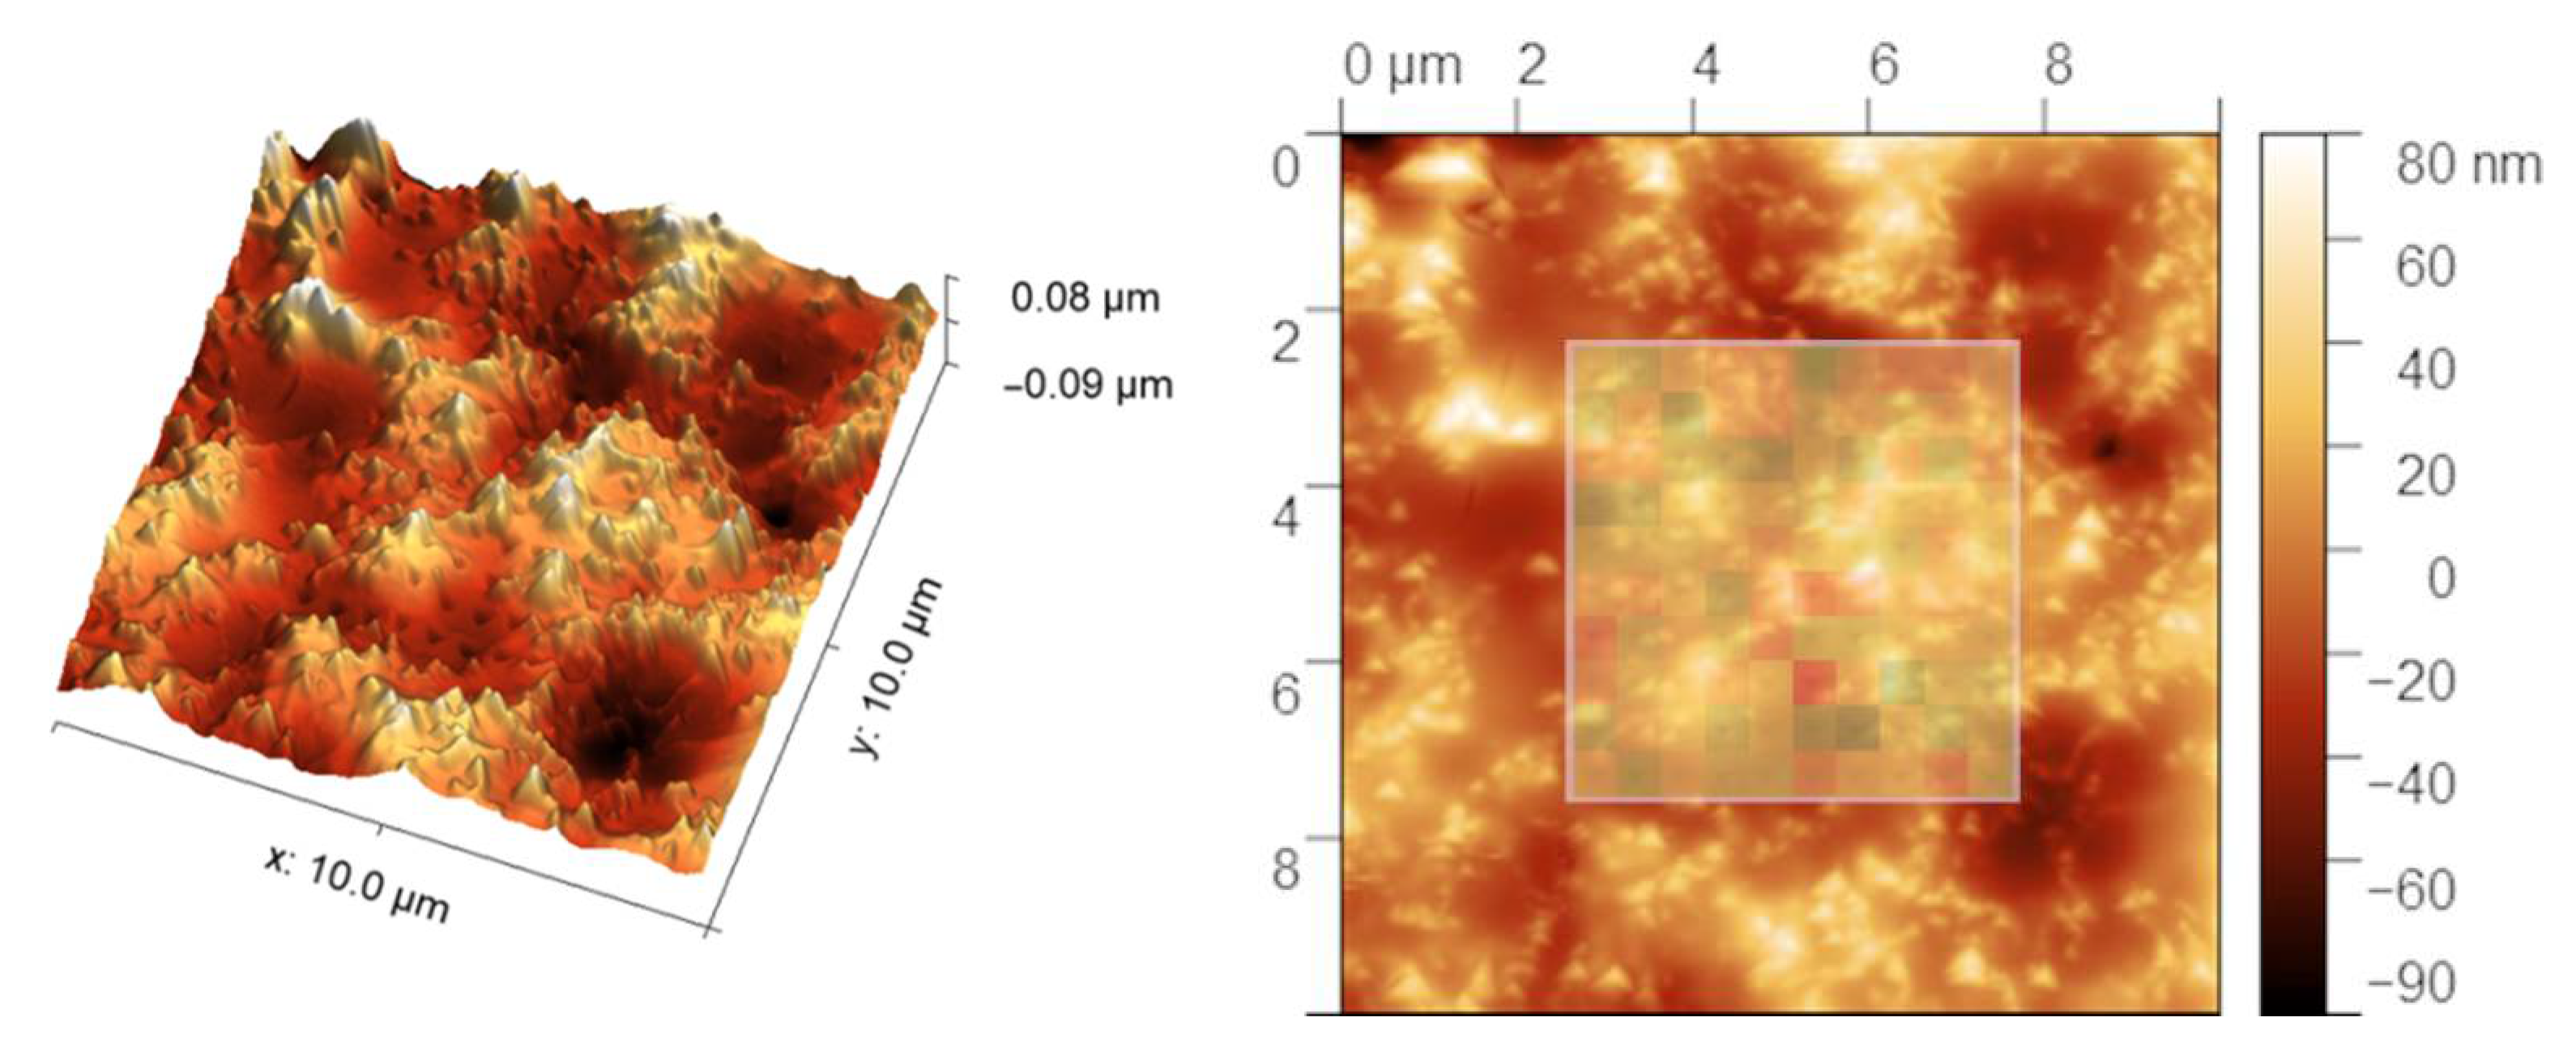
In order to acquire more precise information about the coating obtained after five deposition cycles, the accelerated property mapping was performed. The mean values of Young’s modulus, 62.4 ± 8.3 GPa in the case of the reference sample and 51.6 ± 7.7 GPa for the CNT-modified coating, are in line with nanoindentation measurements. The hardness measurements show greater differences, as measured values are 6.2 ± 1.0 GPa for the reference sample and 6.5 ± 1.4 GPa for the coating. The main cause of the differences between the two experiments is the indentation depth, which was one degree of magnitude smaller in the case of accelerated property mapping—about 20–40 nm compared to mainly 400–650 nm in the case of nanoindentation. Taking into account layers’ thickness and delamination of the SC-5 coating, the XPM experiment showed values for layers, while in the case of nanoindentation, the substrate affects the obtained results as the indenter pierces through the reference layer or misses the CNT-modified one. As the comparison of Young’s modulus values with the topography of CNT-modified silicon oxycarbide in the area of measurement (Figure 5) shows, the topography greatly affects the measurements. As indentation size is on par with CNT diameter, raised features on the surface are most probably surface-most CNTs, as seen in SEM images. This can have two effects, namely non-perpendicular indentation due to height differences between the bulk level and protruding CNT, or differences in mechanical properties of carbon nanotubes and silicon oxycarbide-based bulk.
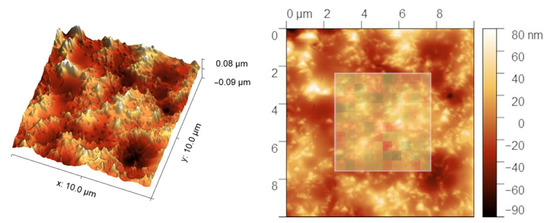
Figure 5.
In situ SPM image after indentation in Accelerated Property Mapping of CNT-modified silicon oxycarbide coating obtained after 5 deposition cycles (SC-5). The inlet of the 2-dimensional image shows Young’s modulus values in the area of indentation.
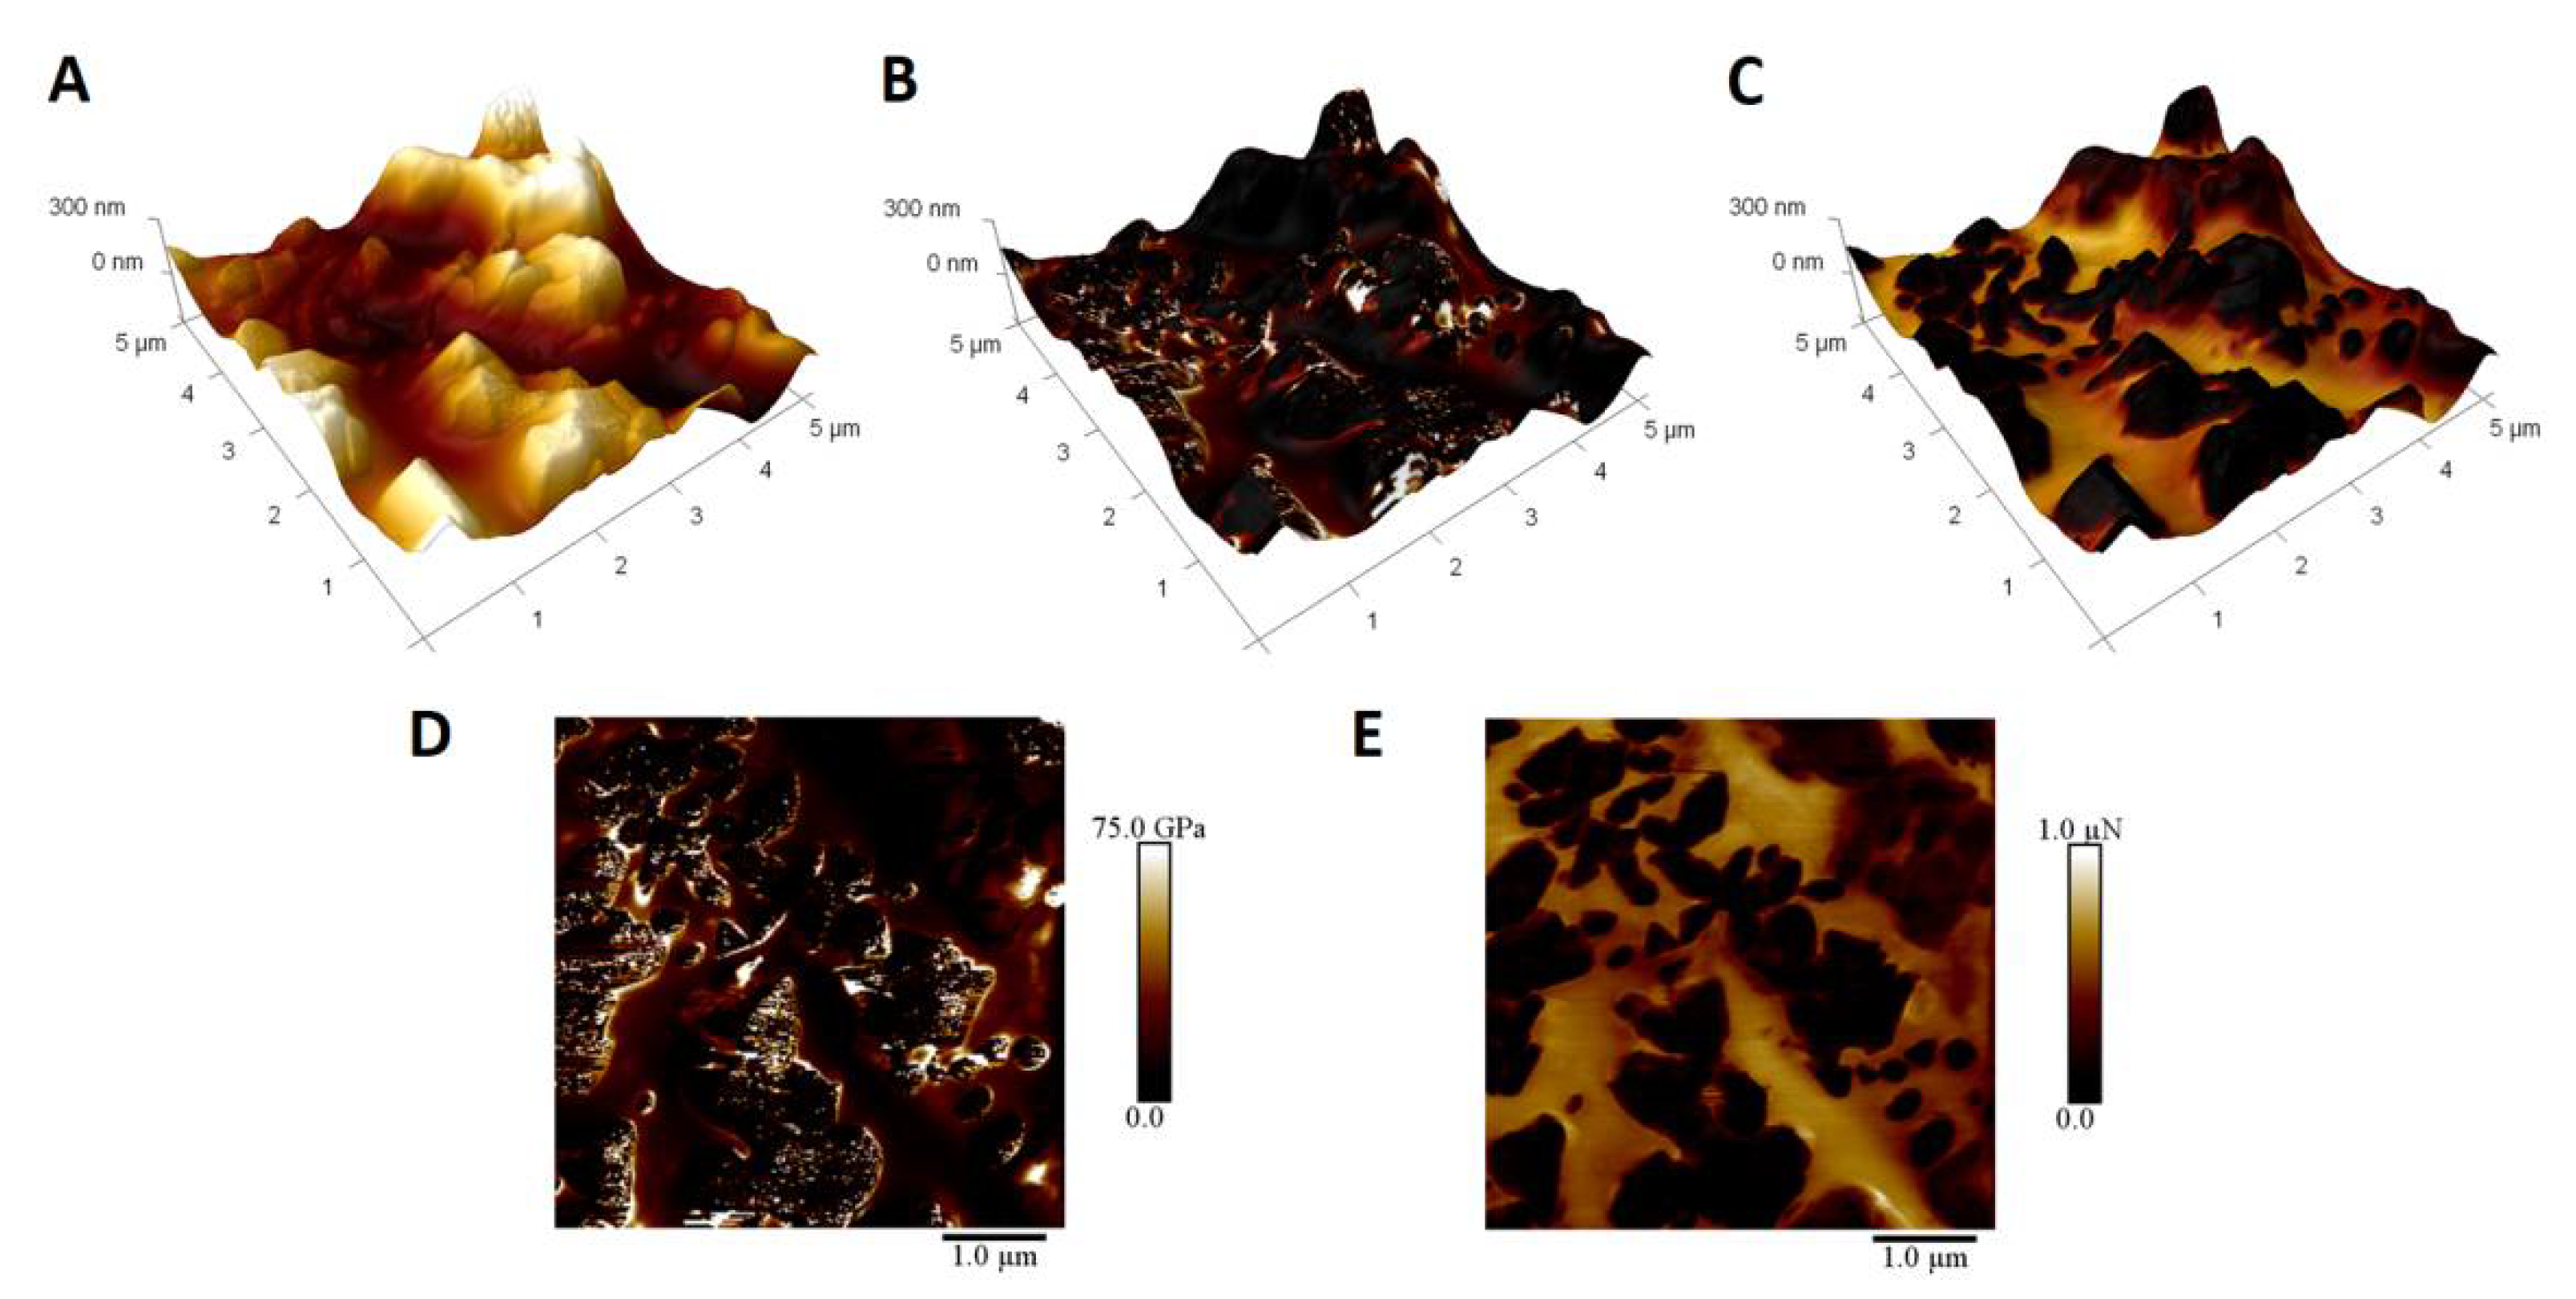
In order to prove that the structures on the surface are indeed CNTs, a quantitative nanomechanical mapping experiment was performed (Figure 6). The topography image (Figure 6A) shows large structures on the surface, which are absent in the reference samples, which are smooth with the exception of rare crystallite structures and substrate grain boundaries. The Young’s modulus map (Figure 6D) exhibits two distinct types of regions. One has constant values, while the other show areas with either very high or very low Young’s modulus values. The comparison with topography (Figure 6B) proves that constant value regions are correlated with smooth surfaces between protrusions, while the latter can be found for these features. The nature of these features can be inferred from the adhesion image (Figure 6E) and its correlation with topography (Figure 6C). As the smooth surfaces exhibit adhesion to the silicon tip, the polar nature is confirmed. The adhesion could be caused by capillary forces due to a thin water film or to electrostatic interactions. As such, it can be attributed to the existence of silanol groups on the surface of silicon oxycarbide bulk. The other domains show no interactions with the tip, and so are, most probably, carbon related. The comparison with the topography shows that these adhesion regions are correlated with surface morphology, as protrusions are CNT based, while smooth surfaces consist of silicon oxycarbide. Taking into account the 1 nm indentation depth, it can be assumed that the differences in Young’s modulus values on CNT surfaces can be connected to distortions of the graphene surface, with very low values in such areas and high values where CNTs are undamaged.

Figure 6.
Quantitative Nanomechanical Mapping of CNT modified silicon oxycarbide coating obtained after 5 deposition cycles (SC-5). (A): 3 dimensional topography representation; (B): 3 dimensional topography representation with Young’s modulus map; (C): 3 dimensional topography representation with adhesion map; (D): Young’s modulus map; (E): map of adhesion between tip and surface.
3.4. Coating Conductivity
A simple conductivity experiment was performed in order to ascertain the layout of CNTs inside the material. Both reference samples were insulators, while the resistance of the thinner CNT-modified silicon oxycarbide layer was 94 ± 127 and 77 ± 76 kΩ for the thicker one. This shows that CNTs inside the materials can create pathways for electrons from the surface to the substrate or inside the material, with higher probability of the former. The high value of errors could be caused by a number of factors. The conductivity in a single measurement would depend on the contact area between electrodes and the surface, which can vary due to sample roughness, as well as the thickness of poorly conducting silicon oxycarbide bulk on the surface of the topmost CNTs. Additionally, the layer thickness at the point of measurement and the number of unbroken carbon phase pathways that can be traced from the surface to the substrate could greatly affect the result. The exfoliation of layers has a great impact on both the mean and the error of measurement, especially in the case of the SC-5 sample, as there is a high probability that either one or both electrodes can make contact with the steel substrate, either directly or through the oxide layer. As such, the main benefit of these measurements is proving the existence of interconnected carbon phases in the composite, created from carbon nanotubes. This in turn proves the dispersion of CNTs not only near the surface, but throughout the whole layer.
4. Conclusions
The layers were proved to be made of silicon oxycarbide with CNTs modifying their structure. The silicon oxycarbide structure was confirmed by IR, while CNT-like structures are clearly visible in microscopic images. The presence of CNTs on the surface was confirmed using QNM-AFM. The coatings are amorphous, and the intensity of the amorphous halo correlated not only with the thickness of the coating, but also with surface coverage, as the CS-5 sample exhibits smallest halo. In the deposition process, CNTs act as scaffolding, enabling deposition of greater amounts of material. Due to CNTs being built into the matrix using strong bonds, the annealing process creates a smaller number of cracks caused by material shrinkage, despite thicker layers. Unfortunately, very thick layers are prone to exfoliation. The dispersion of carbon nanotubes throughout the coating both in the layer’s plane and perpendicular to the surface was confirmed. Although the increase in the coating conductivity was confirmed, the mechanical properties of the layers are lower than in the case of unmodified samples. There are two reasons for this phenomenon, depending on the size of indentation. The addition of carbon nanotubes changes the smooth silicon oxycarbide surface into a corrugated one with height differences of 0.5 μm. This can greatly change the indentation readings, as non-perpendicular measurements tend to overstate indentation depth, which affects the calculations. Additionally, indentation depth tends to be on par with layer thickness, which causes the values to include substrate properties. On the other hand, on a nanometric scale, the readings are affected by the existence of two phases on the surface—silicon oxycarbide bulk and CNTs—with further differentiation depending on the disorder level of the graphene sheets. These can have two origins, as they depend on CNT quality that can be further degraded by the annealing process and diffusion of carbon in silicon oxycarbide to existing carbon phases in the form of CNTs. This shows that in these materials, it is better to perform measurements tailored to their projected application than more general ones.
This article is a proof of concept on using unmodified carbon nanotubes for modification of silicon oxycarbide-based solid layers. The preparation process enables the use of nearly any type of CNT and can be easily adjusted to accommodate other forms of carbon. The amount of CNTs added can be tailored without much problem and the whole methodology can be applied to other polymer-derived ceramics. Additionally, due to dispersion stability, these layers can be applied using various techniques other than dip-coating, such as spin-coating or spray-coating.
Author Contributions
Conceptualization, W.N. and E.D.; methodology, W.N., M.O., A.F., M.S. and E.D.; validation, W.N., M.O., A.F., M.S. and E.D.; formal analysis, W.N.; investigation, W.N., M.O., A.F., M.S. and E.D.; resources, W.N.; data curation, W.N.; writing—original draft preparation, W.N.; writing—review and editing, W.N.; visualization, W.N.; supervision, W.N.; project administration, W.N.; funding acquisition, W.N. All authors have read and agreed to the published version of the manuscript.
Funding
This research was funded by National Science Centre Poland (NCN), Grant No. UMO-402 2014/13/D/ST8/03243.
Institutional Review Board Statement
Not applicable.
Informed Consent Statement
Not applicable.
Data Availability Statement
Not applicable.
Acknowledgments
We would like to thank Jaroslav Lukeš, as well as Bruker and LabSoft for the opportunity to perform accelerated property mapping experiments.
Conflicts of Interest
The authors declare no conflict of interest.
References
- Ming, K.; Gu, C.; Su, Q.; Wang, Y.; Zare, A.; Lucca, D.A.; Nastasi, M.; Wang, J. Strength and plasticity of amorphous silicon oxycarbide. J. Nucl. Mater. 2019, 516, 289–296. [Google Scholar] [CrossRef] [Green Version]
- Szymanski, W.; Lipa, S.; Fortuniak, W.; Chojnowski, J.; Pospiech, P.; Mizerska, U.; Slomkowski, S.; Nyczyk-Malinowska, A.; Hasik, M. Silicon oxycarbide (SiOC) ceramic microspheres-Structure and mechanical properties by nanoindentation studies. Ceram. Int. 2019, 45, 11946–11954. [Google Scholar] [CrossRef]
- Nyczyk-Malinowska, A.; Niemiec, W.; Smoła, G.; Gaweł, R.; Szuwarzyński, M.; Grzesik, Z. Preparation and characterization of oxidation-resistant black glass (SiCO) coatings obtained by hydrosilylation of polysiloxanes. Surf. Coat. Technol. 2021, 407, 126760. [Google Scholar] [CrossRef]
- Guo, F.; Su, D.; Liu, Y.; Wang, J.; Yan, X.; Chen, J.; Chen, S. High acid resistant SiOC ceramic membranes for wastewater treatment. Ceram. Int. 2018, 44, 13444–13448. [Google Scholar] [CrossRef]
- Saha, A.; Raj, R.; Williamson, D.L. A model for the nanodomains in polymer-derived SiCO. J. Am. Ceram. Soc. 2006, 89, 2188–2195. [Google Scholar] [CrossRef]
- Song, J.; Huang, R.; Zhang, Y.; Lin, Z.; Zhang, W.; Li, H.; Song, C.; Guo, Y.; Lin, Z. Effect of nitrogen doping on the photoluminescence of amorphous silicon oxycarbide films. Micromachines 2019, 10, 649. [Google Scholar] [CrossRef] [PubMed] [Green Version]
- Uznanski, P.; Walkiewicz-Pietrzykowska, A.; Jankowski, K.; Zakrzewska, J.; Wrobel, A.M.; Balcerzak, J.; Tyczkowski, J. Atomic hydrogen induced chemical vapor deposition of silicon oxycarbide thin films derived from diethoxymethylsilane precursor. Appl. Organomet. Chem. 2020, 34, e5674. [Google Scholar] [CrossRef]
- Pantano, C.G.; Singh, A.K.; Zhang, H. Silicon oxycarbide glasses. J. Sol Gel Sci. Technol. 1999, 14, 7–25. [Google Scholar] [CrossRef]
- Zhang, H.; D’Angelo Nunes, P.; Wilhelm, M.; Rezwan, K. Hierarchically ordered micro/meso/macroporous polymer-derived ceramic monoliths fabricated by freeze-casting. J. Eur. Ceram. Soc. 2016, 36, 51–58. [Google Scholar] [CrossRef]
- Huang, K.; Elsayed, H.; Franchin, G.; Colombo, P. Complex SiOC ceramics from 2D structures by 3D printing and origami. Addit. Manuf. 2020, 33, 101144. [Google Scholar] [CrossRef]
- Chauhan, P.K.; Sujith, R.; Parameshwaran, R.; Prasad, A.V.S.S. Role of polysiloxanes in the synthesis of aligned porous silicon oxycarbide ceramics. Ceram. Int. 2019, 45, 8150–8156. [Google Scholar] [CrossRef]
- Nyczyk-Malinowska, A.; Wójcik-Bania, M.; Gumuła, T.; Hasik, M.; Cypryk, M.; Olejniczak, Z. New precursors to SiCO ceramics derived from linear poly(vinylsiloxanes) of regular chain composition. J. Eur. Ceram. Soc. 2014, 34, 889–902. [Google Scholar] [CrossRef]
- Iwase, Y.; Fuchigami, T.; Horie, Y.; Daiko, Y.; Honda, S.; Iwamoto, Y. Formation and thermal behaviors of ternary silicon oxycarbides derived from silsesquioxane derivatives. Materials 2019, 12, 1721. [Google Scholar] [CrossRef] [PubMed] [Green Version]
- Xie, F.; Ionescu, E.; Arango-Ospina, M.; Riedel, R.; Boccaccini, A.R.; Gonzalo-Juan, I. Facile preparative access to bioactive silicon oxycarbides with tunable porosity. Materials 2019, 12, 3862. [Google Scholar] [CrossRef] [Green Version]
- Mazo, M.A.; Colomer, M.T.; Tamayo, A.; Rubio, J. Microstructure-electrochemical behavior relationships of hierarchically micro-mesoporous silicon oxycarbide derived materials obtained by the pyrolysis of trietoxysilane/dimethyldiphenylsiloxane hybrids. J. Alloys Compd. 2021, 870, 159427. [Google Scholar] [CrossRef]
- Wang, L.; Lu, K.; Ma, R. Effects of different polymer precursors on the characteristics of SiOC bulk ceramics. Appl. Phys. A: Mater. 2019, 125, 395. [Google Scholar] [CrossRef]
- Jeleń, P.; Szumera, M.; Gawęda, M.; Długoń, E.; Sitarz, M. Thermal evolution of ladder-like silsesquioxanes during formation of black glasses. J. Therm. Anal. Calorim. 2017, 130, 103–111. [Google Scholar] [CrossRef] [Green Version]
- Marchewka, J.; Jeleń, P.; Długoń, E.; Sitarz, M.; Błażewicz, M. Spectroscopic investigation of the carbon nanotubes and polysiloxane coatings on titanium surface. J. Mol. Struct. 2020, 1212, 128176. [Google Scholar] [CrossRef]
- Kuo, C.T.; Faber, K.T. Permeable carbon nanotube-reinforced silicon oxycarbide via freeze casting with enhanced mechanical stability. J. Eur. Ceram. Soc. 2020, 40, 2470–2479. [Google Scholar] [CrossRef]
- Jose, M.V.; Dean, D.; Tyner, J.; Price, G.; Nyairo, E. Polypropylene/carbon nanotube nanocomposite fibers: Process-morphology- property relationships. J. Appl. Polym. Sci. 2007, 103, 3844–3850. [Google Scholar] [CrossRef]
- Knozowski, D.; Graczyk-Zajac, M.; Trykowski, G.; Wilamowska-Zawłocka, M. Silicon oxycarbide-graphite electrodes for high-power energy storage devices. Materials 2020, 13, 4302. [Google Scholar] [CrossRef] [PubMed]
- Li, H.; Yan, X.; Ma, Z.; Zhang, Y.; Li, C.; Xiao, W.; Jiang, Y. Silicon oxycarbide-carbon hybrid nanofibers: A promising anode for ultralong-cycle lithium ion batteries with high rate capability. Ceram. Int. 2021, 47, 6867–6874. [Google Scholar] [CrossRef]
- Canuto de Almeida e Silva, T.; Bhowmick, G.D.; Ghangrekar, M.M.; Wilhelm, M.; Rezwan, K. SiOC-based polymer derived-ceramic porous anodes for microbial fuel cells. Biochem. Eng. J. 2019, 148, 29–36. [Google Scholar] [CrossRef]
- Bai, J.; Allaoui, A. Effect of the length and the aggregate size of MWNTs on the improvement efficiency of the mechanical and electrical properties of nanocomposites-experimental investigation. Compos. A Appl. Sci. Manuf. 2003, 34, 689–694. [Google Scholar] [CrossRef]
- Francis, A.P.; Devasena, T. Toxicity of carbon nanotubes: A review. Toxicol. Ind. Health 2018, 34, 200–210. [Google Scholar] [CrossRef] [PubMed]
- Niemiec, W.; Szczygieł, P.; Jeleń, P.; Handke, M. IR investigation on silicon oxycarbide structure obtained from precursors with 1:1 silicon to carbon atoms ratio and various carbon atoms distribution. J. Mol. Struct. 2018, 1164, 217–226. [Google Scholar] [CrossRef]
- Waseda, Y.; Suzuki, S. 4. FT-IR and UV for Iron Hydroxides and Oxides. In Characterization of Corrosion Products on Steel Surfaces; Springer Science & Business Media: Berlin, Germany, 2006. [Google Scholar]
- Sbai, K.; Rahmani, A.; Chadli, H.; Bantignies, J.-L.; Hermet, P.; Sauvajol, J.-L. Infrared spectroscopy of single-walled carbon nanotubes. J. Phys. Chem. B 2006, 110, 12388–12393. [Google Scholar] [CrossRef]
Publisher’s Note: MDPI stays neutral with regard to jurisdictional claims in published maps and institutional affiliations. |
© 2021 by the authors. Licensee MDPI, Basel, Switzerland. This article is an open access article distributed under the terms and conditions of the Creative Commons Attribution (CC BY) license (https://creativecommons.org/licenses/by/4.0/).